Abstract
In this work, it is proposed an environmental friendly sonophotocatalytic approach to efficiently treat polluted waters from industrial dyes exploiting ZnO micro- and nano-materials. For the first time, we deeply investigated the generation of reactive oxygen species (ROS) under ultrasound stimulation of different ZnO structures by Electron Paramagnetic Resonance Spectroscopy (EPR). Indeed, five zinc oxide (ZnO) micro- and nano-structures, i.e. Desert Roses (DRs), Multipods (MPs), Microwires (MWs), Nanoparticles (NPs) and Nanowires (NWs), were studied for the Rhodamine B (RhB) sonodegradation under ultrasonic irradiation. The DRs microparticles demonstrated the best sonocatalytic performance (100% degradation of RhB in 180 min) and the highest OH· radicals generation under ultrasonic irradiation. Strikingly, the coupling of ultrasound and sun-light irradiation in a sonophotodegradation approach led to 100% degradation efficiency, i.e. color reduction, of RhB in just 10 min, revealing a great positive synergy between the photocatalytic and sonocatalytic mechanisms. The RhB sonophotocatalytic degradation was also evaluated at different initial dye concentrations and with the presence of anions in solution. It was demonstrated a good stability over repeated cycles of dye treatment, which probe the applicability of this technique with industrial effluents. In conclusion, sonophotocatalytic degradation synergizing sunlight and ultrasound in the presence of DRs microparticles shows a great potential and a starting point to investigate further the efficient treatment of organic dyes in wastewater.
Keywords: Zinc oxide, Sonocatalysis, Photocatalysis, Rhodamine B, Electron paramagnetic resonance spectroscopy
1. Introduction
Since the discovery of synthetic dyes to nowadays the textile and dye industries have greatly increased their production. On the other hand, the release of synthetic dyes in natural water sources from the washing cycles of these industries causes several problems towards aquatic wildlife and human life [1].
In particular, Rhodamine B (RhB) is a dye extensively used in several industries like textiles, leather and food. Nevertheless, this is a highly toxic colorant that presents carcinogenic and mutagenic behavior for any living species [2]. Furthermore, RhB represents also a severe and long-lasting problem for aquatic life, especially plants, because it impedes light penetration and, therefore, it reduces photosynthesis and interferes with natural purification processes. Therefore, RhB necessarily need to be completely removed from the industrial wastewater to avoid the dangerous effects generated by its presence in the ecosystem.
The conventional wastewater treatment methods (physical, chemical and biological ones) used to eliminate dye molecules show several limitations, like low removal efficiencies towards non-biodegradable and refractory organic dyes, and requirement long removal times and post-treatments.
In the last decade, the application of advanced oxidation processes (AOPs) has received a great interest for the purification of polluted wastewater. AOPs are characterized by the production of reactive oxygen species (ROS) like superoxide radical anion, hydroxyl radical (OH·), hydrogen peroxide (H2O2) and singlet oxygen (O2·), which can quickly oxidize dye molecules present in industrial effluents. Some examples of AOPs include Fenton reaction (involving iron cations Fe2+/Fe3+ and hydrogen peroxide H2O2) [3], ozonation [4], photolysis [5], photocatalysis [6], sonolysis [7] and sonocatalysis [8].
In the recent years, sonolysis has received a great interest as advanced oxidation process for the purification of polluted wastewater since it is an environmental friendly method, which can be implemented under mild operative conditions (i.e. near ambient temperature and pressure). It takes advantage of the physical phenomenon of the cavitation, that consists on the nucleation, growth, and collapse of gas microbubbles in the liquid medium under the ultrasonic pressure waves [9]. During the bubbles formation and collapse phases, critical temperature and pressure conditions are reached (about 5000 K and 500 atm) that lead to water sonolysis, with the formation of free radicals, i.e. H· and OH· [10], which can quickly oxidize organic pollutants into smaller and less harmful substances or fully mineralize in water and carbon dioxide [11,12]. The presence of solid particles (sonocatalysts) in solution allow the use of low ultrasound (US) power intensities and provides additional nucleation sites increasing the number of cavitation events [13] consequently enhancing the degradation performances. Furthermore, the use of semiconductor materials in sonocatalysis might produce electron/hole pairs, and consequently lead to a further production of oxygen radicals. This radical generation mechanism is still under investigation, but one of the most probable mechanism is the semiconductor activation due to the intense UV and visible light emission during the cavitation and bubbles collapses [14]. Titanium dioxide (TiO2) is the most widely investigated sonocatalyst and it was found that its sonocatalytic activity is influenced by its crystalline structure and morphology [8]. Some studies obtained that the TiO2 sonocatalytic activity was higher than of Al2O3 (non-semi-conducting material) suggesting that the photonic and thermal excitation has an important contribution on the overall sonocatalytic activity [15–17]. For example, it was found that rutile polymorph exhibits higher activity than anatase for the sonocatalytic degradation of methyl orange (MO) [18]. Pang et al. [19] demonstrated that the pseudo-order kinetic constant of TiO2 nanotubes to remove Rhodamine B was 4 times higher than that of TiO2 nanoparticles.
ZnO has extensively attracted much attention in various research works concerning pollutants degradation under light irradiation due to their good photocatalytic activity, low cost, non-toxicity [20]. Nevertheless, sonocatalytic degradation of pollutant dyes using ZnO particles has been little investigated. In addition, synthesis of ZnO micro- and nano-structures with various morphologies is cheap, affordable and easy to control for high scale production. There is only a work by Ahmad et al. [21], where ZnO nanoparticles decorated by carbon nanotubes were used to degrade Rhodamine B in a sonophotocatalytic approach by sunlight. However, to the best of our knowledge there are not literature works reporting the influence of the ZnO morphology on the capacity to generate ROS in quantitative terms. Consequently, the relation between ZnO structure, size and morphology with respect to the sonocatalytic efficiency and dye degradation mechanism has not been investigated yet.
Sonocatalysis alone for the oxidation of dyes in industrial effluents requires high consumption of energy and high degradation time, then its direct application on large scale is difficult [22]. To solve these problems, sonophotocatalysis (sonocatalysis + photocatalysis) could be a promising strategy for water decontamination process, although cost effectiveness should be still industrially proved. Actually, the increase in treatments cost associated with an increase in energy consumption can be offset by the reduced treatment time required, owing to the positive synergic effect of the combination of these two advanced oxidation processes. Furthermore, a further reduction in costs may result from the replacement of UV irradiation with sunlight. It was actually reported that the photo-response to the visible-light of semiconductor materials with a wide band gap energy, like ZnO, could be triggered by dye sensitization [23]. Therefore, the dye molecules allow themselves the process to take place: as dyes, they are able to absorb light in the visible region, thus, once they are adsorbed on the photocatalyst surface they are able to convert incident photons into electrons and inject them in the conduction band of the semiconductor photocatalyst. This will allow the electron-hole separation and the process of ROS formation within the photocatalyst. Therefore, this photo-sensitization process will further allow the dye degradation at the catalyst surface. We hypothesize that this would be a further advantage to efficiently degrade the dyes by a sonophotocatalytic process using sunlight.
To give insights on the above-mentioned phenomena, in the present study zinc oxide (ZnO) catalysts with five different morphologies and sizes were synthesized by a wet-chemical method, i.e. via sol-gel approaches. This is a simple, inexpensive and fast synthesis method, which do not require thermal treatments and addition of additives. The ZnO particles were extensively characterized in terms of morphology, surface charge, surface chemistry as well as crystalline structure, optical and colloidal properties. Their efficiency as sonocatalysts was evaluated for the color degradation of a non-biodegradable organic dye (i.e. Rhodamine-B, Rh-B) and was correlated to their physico-chemical properties. Moreover, for the first time, EPR spectroscopy associated to spin-trapping technique was used in this work to understand the role of morphology and size of these ZnO semiconducting particles on the generation of ROS in water suspension under ultrasound irradiation.
Furthermore, the degradation mechanisms and the effects of operating conditions, such as dye concentration, presence of salts typical of industrial wastewater were also investigated on the RhB sonophotodegradation. Finally, the stability and reusability of the best catalyst were studied to pave the way for an industrial application of ZnO for efficient sonophotocatalytic degradation of dye pollutants.
2. Material and methods
2.1. Synthesis of ZnO catalysts: micro and nano-particles
2.1.1. Synthesis of ZnO microparticles
The preparation of ZnO microparticles was carried out as previously reported [24] by sol-gel method using as synthesis precursors zinc nitrate hexahydtrate (Zn(NO3)2·6H2O 99%, Sigma-Aldrich) and potassium hydroxide (KOH, 85%, Sigma-Aldrich), both in water solutions.
The molar amount of Zn(NO3)2·6H2O was maintained constant while the molar amount of potassium hydroxide was varied to obtain different ZnO morphologies. In details, 7.4 g (0.0249 mol) of Zn (NO3)2·6H2O and 2.794 (0.0498 mol), 11.177 (0.1992 mol) and 16.766 g (0.2988 mol) of KOH, respectively, were dissolved separately in 50 ml of double-distilled water. In this way, the molar ratio between KOH and Zn(NO3)2·6H2O were 2, 8 and 12, to obtain Desert Roses (DRs), Multipods (MPs), and Microwires (MWs), respectively. The zinc nitrate solution was then added dropwise to the KOH solution for about 20 min under vigorous and continuous stirring. The obtained gels were transferred in closed Teflon reactors at mild temperature (70 °C) for 4 h. At the end of the reaction, the ZnO microparticles were separated from the solution by filtration and the precipitate was washed with deionized water until pH was neutral. Finally, the particles were dried in air at 60 °C overnight to obtain the powder form.
2.1.2. Synthesis of ZnO nanoparticles
The preparation of ZnO nanostructures was carried out by sol-gel method in methanol, using a previously described procedure [25,26].
A solution of zinc acetate dihydrate (818.2 mg, 3.73 mmol, Zn (CH3COO)2·2H2O, 99.99%, Sigma Aldrich) in 42 ml of methanol was heated into a round glass flask at 60 °C under continuous stirring (350 rpm) and reflux in protected atmosphere of nitrogen. 318 μL of double-distilled water (from a MilliQ system, Millipore) were then added. Then, a solution of sodium hydroxide (288.8 mg, 9.03 mmol, NaOH, 98%, Sigma Aldrich) in 23 ml of methanol was slowly added dropwise within a period of 15–20 min. To obtain the synthesis products the solution was then left to react for 2 h at 60 °C under reflux condition. At the end of this time, the colour of the solution shifts from transparent to opalescent. To produce spherical nanoparticles (NPs) [25], the synthesis product was then washed three times by centrifugation (for 5 min at 5000 rpm, 6540 rcf) and then dispersed in absolute ethanol (EtOH, 96%, Sigma Aldrich).
In order to obtain nanowires (NWs) [26], the final solution as transferred in a rotovapor and the solvent was evaporated at 55 °C until it reached a final volume of 10 ml. Then the solution was refluxed at 60 °C under nitrogen atmosphere for additional 48 h. The washing steps of the synthesis products were obtained by centrifugation–redispersion process for three times, as described above.
Both nanostructures were maintained as colloidal dispersions in EtOH. Their concentration was determined by evaporating for one night at 60 °C a known volume of solution in a pre-weighted container and then weighing the dried product afterwards.
2.2. Characterization of the samples
X-ray diffraction measurements were performed on the prepared ZnO micro and nano-particles by using an X’Pert diffractometer with θ–2θ Bragg–Brentano configuration using Cu-Ka radiation (λ = 1.54 Å, 40 kV and 30 mA) in the range of 20–60°.
Field Emission Scanning Electron Microscopy (FESEM) was carried out by a Merlin, Karl Zeiss dispensing and drying a drop of samples dispersed in EtOH (around 25 μg mL−1) on a silica wafer (for the microparticles) or on a holey carbon-coated copper grid (for the nanoparticles). Similarly, Transmission Electron Microscopy (TEM) was obtained, only for the nanosized particles, from a Tecnai, FEI operating at 200 kV.
Fourier Transform InfraRed spectra (FT-IR) were recorded in transmission mode with a Bruker Equinox 55 in the region of 4000–400 cm−1 and UV–vis spectra in Diffuse Reflectance Spectroscopy (DRS) were acquired on a with a Cary 5000 Scan UV–vis spectrophotometer, by using a total reflectance sphere. All the spectra were background subtracted. The optical band gap (Eg) of the samples was calculated by using the Tauc’s method from the UV–vis spectra [27].
The Zeta Potential of the samples was determined using the Zetasizer Nano ZS90 (Malvern Instrument), that use the Laser Doppler Velocimetry to determine the electrophoretic mobility. The measurements were performed in double distilled water and pH was adjusted from 2 to 11 with HCl and NaOH 1 M. Before the measurements, all suspensions were sonicated for 5 min and each experiment was replicated three times. Only for the NPs, Dynamic Light Scattering (DLS) measurements in both water and EtOH were also carried to measure the nanostructure hydrodynamic size.
2.3. Analysis of the ROS generation mechanism
Water dispersions (1 mg/mL) of micro- and nanoparticles were obtained by either dissolving the microsized powders in water or by redispersing in water the nanoparticles at the right concentration after repeated centrifugation and washing steps to eliminate any EtOH content. Then the water suspensions were sonicated for 10 min to obtain a good dispersion. 100 μL of as prepared dispersion were mixed with 100 μL of 50 mM of DMPO (5,5-Dimethyl-1-pyrroline, Sigma Aldrich) in water and 1 μL of DTPA (Diethylenetriaminepentaacetic acid, Sigma Aldrich). The aqueous suspension was placed in an ultrasound bath and the ultrasonic irradiation (Frequency of 59 kHz, total intensity of about 1W m−2) was performed for 30 min, as described above. The temperature of the ultrasound bath was maintained at 20 °C. Further experiments were carried out by UV–vis light irradiation, as explained above in details. After the reaction time, 50 μL of the solution was transferred in a quartz capillary tube and the latter was placed in the Electron Paramagnetic Resonance (EPR) cavity of the spectrometer (EMX-Nano, Bruker). The magnetic field was set to a center field of 3423 G, sweep width of 100 G, sweep time of 160 s. The signal channel was set with a receiver gain of 60 dB, Mod. Amp. of 1 G and 15 number of scans.
2.4. Rhodamine B adsorption and degradation tests
In this study, degradation of RhB as a dye pollutant was investigated in the presence of both ZnO micro and nanoparticles under visible light and/or ultrasonic irradiation. The sono- and photo-catalytic activities were evaluated by using 10 mL of the dye solution at pH 5.8 with an appropriate initial dye concentration (2.5 ppm) and a catalyst concentration in the solution of 0.5 mg/mL. Initially, the suspension was poured inside a Pyrex type reactor, covered by an aluminum foil, and stirred at 350 rpm for 60 min in the dark, without any kind of irradiation, to secure the establishment of an adsorption/desorption equilibrium of the dye on the surface of the catalyst. At the end of the 60 min, 300 μL was centrifuged and the supernatant (100 μL) was analyzed by using a UV-VIS a spectrophotometer (MultiskanGo, Thermo Scientific).
From the absorbance spectra obtained, through the calibration curve, the absorption values were calculated for each catalyst by using Eq. (1):
| (1) |
C60 and C0 represent the concentration at the end of the adsorption phase and the RhB initial concentration, respectively.
The sonodegradation experiments were carried out in an ultrasound bath (Labsonic LBS 2-10, Falc Instrument) operating at 40 kHz or 59 kHz and able to generate about 1 W cm−2 as power intensity. A pyrex reactor with the catalyst suspension was immersed at 2/3 of its height inside the sonication bath, which was maintained at the same position in all the experiments to guarantee sufficient reproducibility. The temperature of the system was kept constant at 20 °C ± 2 °C by using an external cooling bath with recycled water (SB 15, Falc Instrument). The photodegradation tests were driven by visible light irradiation with a white lamp (Schölly Fiberoptic GMBH, Flexilux 650, Endoscopy Fiber-Optic Light Source 150 W) that emits a radiation composed mainly of visible light (150 W/m2) and about 4% of UV light (0.17 W/m2). Mechanical stirring of the solution was provided by a magnetic stir bar at 350 rpm.
The sono-photodegradation tests were run with both visible and ultrasound irradiation at the same time, by immersing the pyrex tube in the ultrasonic water bath and illuminating the reactor from the upper part.
During those degradation tests, at regular time intervals, 300 μL suspension were sampled, immediately centrifuged for 5 min at 6540 rpm and 100 μL of the supernatant were analyzed with a UV-VIS spectrophotometer (MultiskanGo, Thermo Scientific), while the remaining part was mixed by a vortex (Advanced Vortex Mixer, VelpScientifica ZX3) and reintegrated to the initial solution. Moreover, experiments with addition of salts (Na2SO4 and NaHCO3, 2 g/L), and radical scavenger (DMSO, dimethylsulfoxide, Sigma Aldrich, 5%v/v) were performed to evaluate their effect on the sonophotocatalytic RhB degradation.
3. Results and discussion
3.1. Characterization of the ZnO micro and nano-catalysts
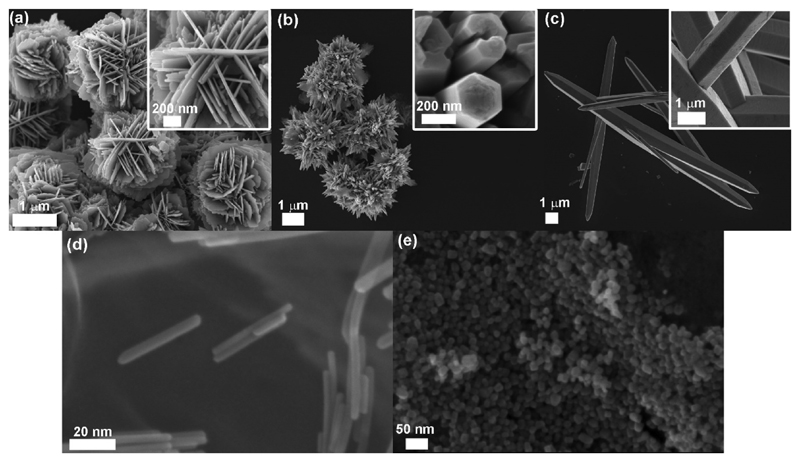
Through the sol-gel approach, micro and nano-sized structures of ZnO were obtained, as reported in the FESEM images of Fig. 1. In particular, five different morphologies and dimensions were produced in water-based media, i.e. desert roses (Fig. 1a), branched multipods (Fig. 1b) and single microwires (Fig. 1c) by varying the precursors KOH:Zn(NO3)2 molar ratio from 2, to 8 and 12, respectively.
Fig. 1.
FESEM imaging of the synthesized catalysts with detailed features in the insets: (a) Desert Roses (DRs), (b) MultiPods (MPs), (c) MicroWires (MWs)(d) NanoParticles (NPs) and (e) NanoWires (NWs).
The desert roses (DRs) present a diameter of about 2 μm, each petal is a nanosheet with a very homogeneous thickness of about 50 nm, as also previously reported [28], indicating a homogeneous and oriented growth. Similarly, each wire in both MPs and MWs structures has similar dimensions of around 400–500 nm in diameter. The MPs microstructure shows a diameter varying from 2 to 4 μm, whereas the MWs are single one-dimensional and highly-oriented structures with a length of 30–40 μm. The formation mechanism of these microstructures was already reported by our group [24]. In short, hydroxyl groups react with the zinc cations Zn2+ through coordination or electrostatic interactions, forming zinc hydroxide intermediates growing units and then ZnO nucleates from the solution generating multi-nuclei aggregates in an oriented-growth direction. By increasing the molar ratio of KOH:Zn(NO3)2, and consequently in presence of a higher concentration of hydroxyl ions, the morphology change from flower-like to wires was obtained.
Nanosized structures of ZnO, i.e. nanoparticles and nanowires, were obtained via sol-gel method carried out in methanol with a precursors molar ratio of 1.94 [25]. From FESEM images it is shown that the dimensions of the obtained ZnO NPs were in the order of 10–20 nm (Fig. 1e). ZnO NWs, derived from a modification of the synthesis of the NPs, leading to an oriented growth of the pre-formed NPs [26], show the same diameter, i.e. 10–20 nm, and a length of about 100 nm (Fig. 1d).
TEM images show visible single-crystalline domains in case of both nanostructures (as reported in both Figs. S-1 and S-2 for ZnO NPs and NWs, respectively, of the Supplementary Information, S.I.).
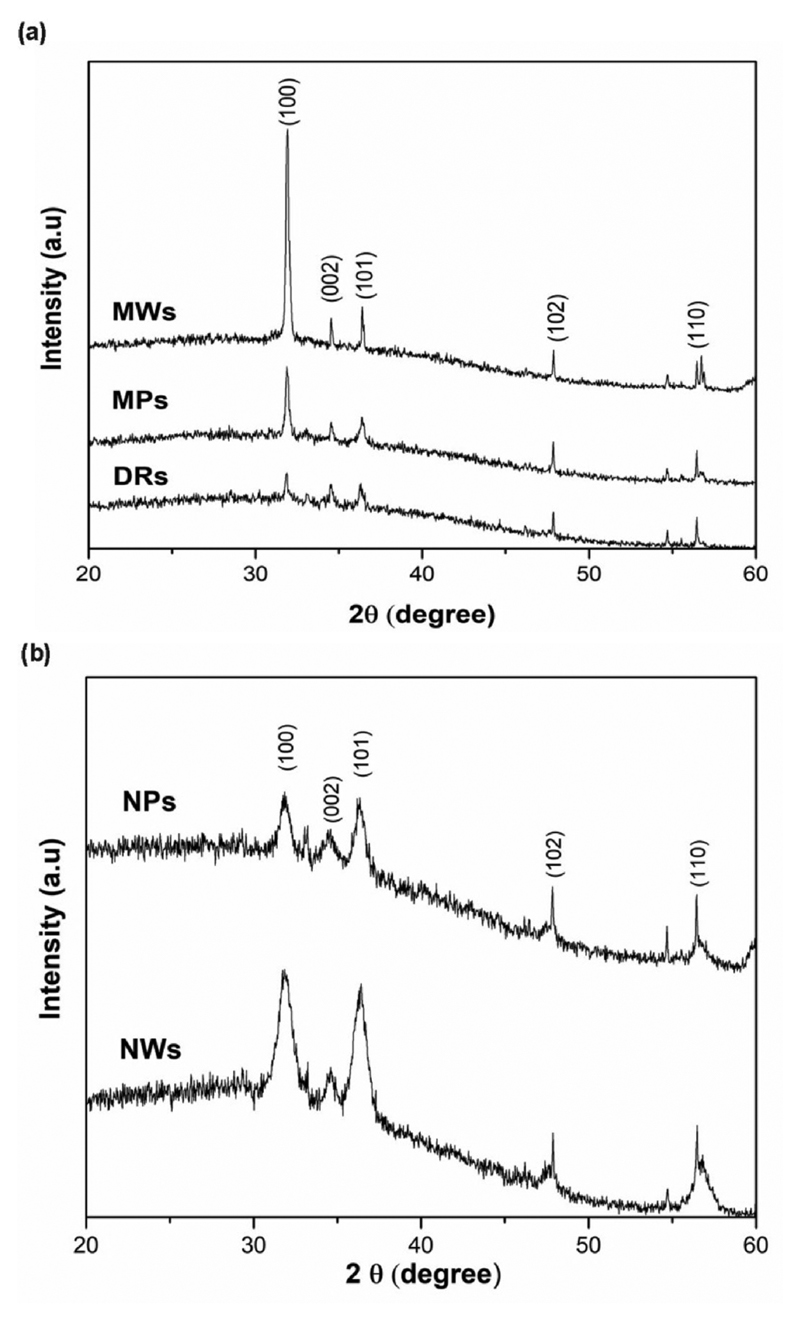
X-ray diffraction patterns (Fig. 2) of all the micro- and nano-sized samples present the typical reflections peaks attributed to the wurtzite hexagonal phase, indexed as (100) at 31.82°, (002) at 34.54°, (101) at 36.42°, (102) at 47.46°, (110) at 56.74°, according to the JCPDS card n.36–1451.
Fig. 2.
X-Ray Diffraction patterns of (a) microstructured and (b) nanostructured ZnO samples.
The UV–vis spectra and the relative band-gap calculation for all the ZnO micro and nanostructures are reported in the S.I in Figs. S-3 and S-4.
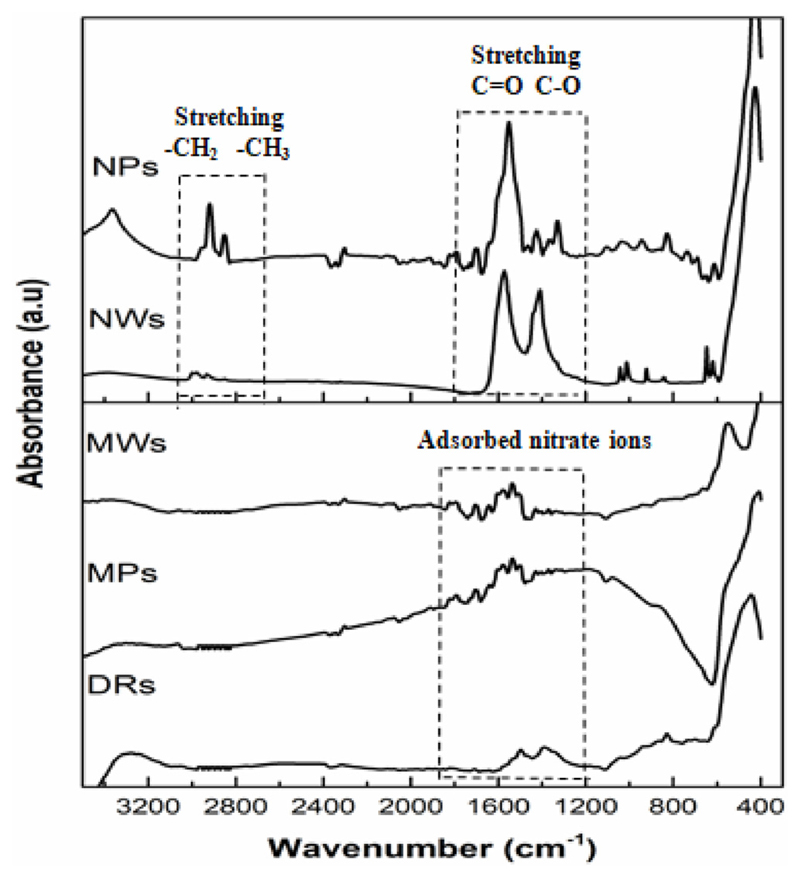
To investigate the presence of the reaction residuals on the surface of the synthesized particles, FTIR analysis was conducted (Fig. 3). All samples exhibit an intense band at 400–450 cm−1, which is attributed to the Zn–O stretching vibration, and a broad band at 3400 cm−1, associated to the −OH stretching of surface hydroxyl groups, typical of metal oxide materials, or of absorbed water molecules. The peaks located at around 1300–1700 cm−1, concerning the ZnO microparticles, could be associated to the stretching vibrational modes of nitrate ions, probably deriving from the dissociation of Zn(NO3)2 precursor present in the reaction medium. In the case of ZnO nanoparticles, the bands located at 1550 and 1414 cm−1 are attributed to the stretching vibrations of C═O and C─O, respectively. Finally, the absorption peaks around 2800–2950 cm−1 are associated to the symmetrical and antisymmetrical stretching of the ─CH2 and ─CH3. All these bands, in the case of the ZnO nanoparticles, are due to the presence of acetate and ethylic groups, deriving from zinc acetate residuals and methanol during sol-gel synthesis or ethanol used as dispersing solvent to stock both NPs and NWs colloidal solutions.
Fig. 3.
FTIR spectra of microstructured (top) and nanostructured (bottom) ZnO.
3.2. Generation of reactive species under US irradiation
Our goal is to demonstrate if ZnO semiconducting micro and nanoparticles added in solution can further increase the ROS production by a synergic effect between heterogeneous nucleation and photo-thermal activity of this sonocatalyst.
Hence, the EPR spectroscopy with spin-trapping technique was used to identify and quantify short-lived free radicals and molecules with unpaired electrons, i.e. mainly OH· radicals, generated by ZnO under ultrasounds irradiation. These EPR studies were performed in five different micro and nanostructures to elucidate the influence of the ZnO morphology on its sonocatalytic efficiency.
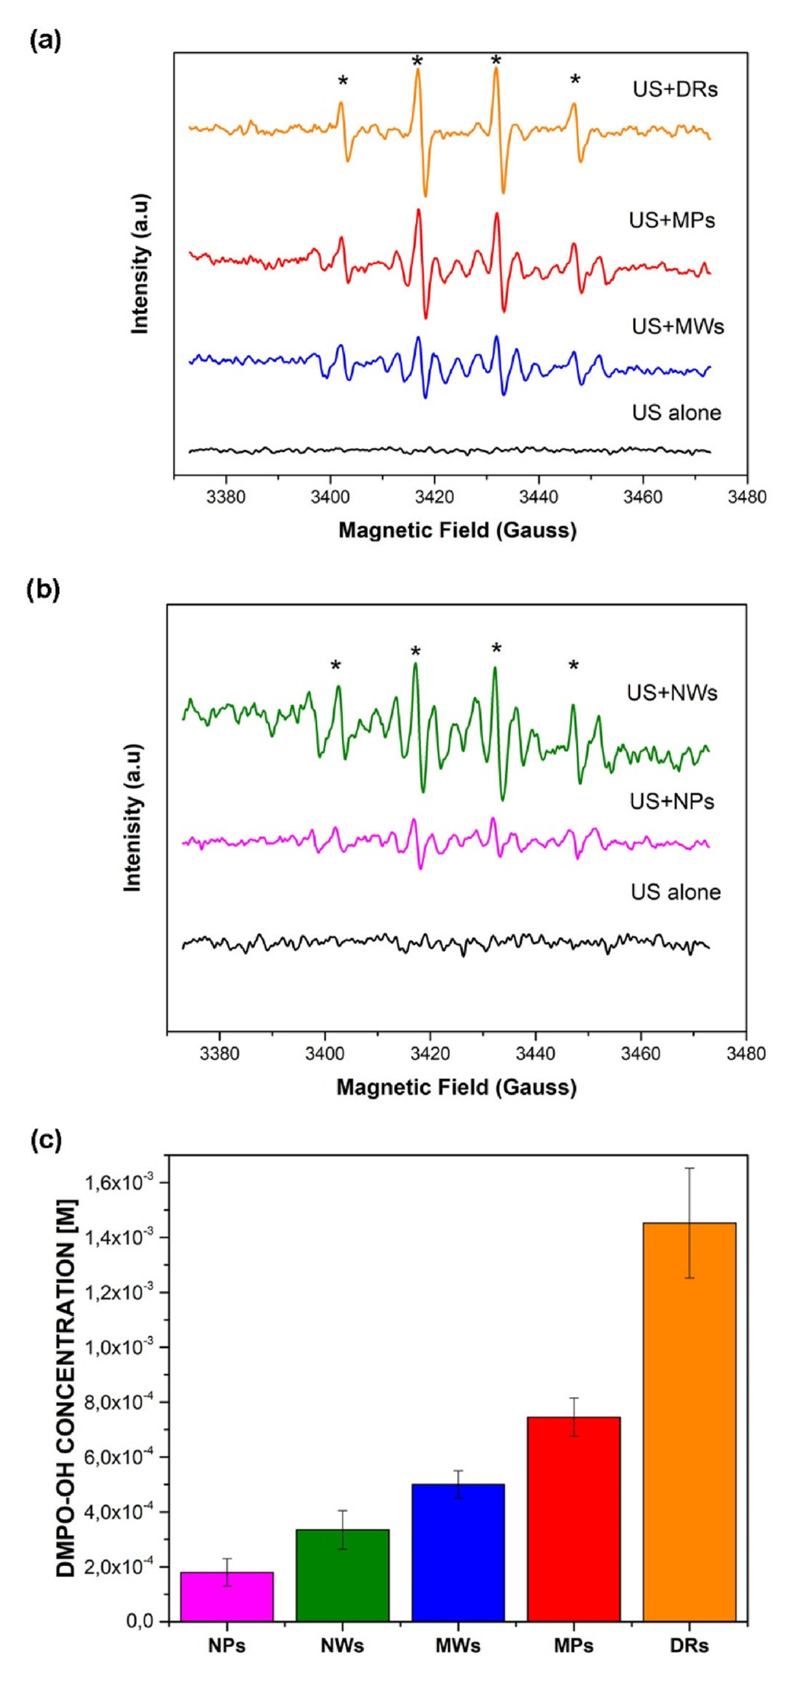
Figs. 4a and b show the experimental spectra of DMPO-OH adducts obtained in the presence of all the ZnO micro and nano-particles. As it can be observed, no signal was collected in the absence of ZnO particles under the adopted operative conditions (US ALONE: frequency of 59 kHz, total intensity of about 1 W m−2). Instead, Fig. 4c shows the quantitative results of the hydroxyl radicals generation in the presence of the ZnO materials. These results confirm that the addition of ZnO particles in the water suspension (at a concentration of 0.5 g/L) provides nucleation sites for cavitation of the gas bubbles, most probably lowering the cavitation threshold, which in turns enhance the generation of OH· radicals. From Fig. 4c, it is evident that the DRs structures lead to the highest formation of OH· radicals that is of about 3, 5, 8 and 12 times better than that of the MPs, MWs, NWs and NPs, respectively. Furthermore, in the case of the microparticles, the generation of oxidizing species increases by increasing the surface area of the ZnO microstructures (values listed in Table 1), most probably because of more defects and active sites on the surface that are available to produce cavitation bubbles. We further hypothesize that DRs and MPs, unlike MWs, owing to their morphologic structure in the form of flower-like and multi-wires aggregates, easily adsorb and trap gas pockets on their surface and facilitating the vapor microbubbles nucleation when they are put in solution, and consequently increasing OH· radicals amount on the particles’ surface.
Fig. 4.
EPR spectra obtained by DMPO spin trapping after ultrasound irradiation of (a) microstructured ZnO catalysts and (b) ZnO nanostructured catalysts; (c) quantitative EPR spectra. The peaks indicated by * correspond to the signal of DMPO-OH adducts.
Table 1. Results of BET surface area analysis and adsorption percentages of RhB between the different catalysts.
| Sample | Specific Surface Area (m2/g) | RhB adsorption (%) |
|---|---|---|
| DRs | 16 | 35 |
| MPs | 7 | 24 |
| MWs | 1 | 17 |
| NPs | 61 | 22 |
| NWs | 21 | 15 |
It is worth of notice that, despite the fact that ZnO nanoparticles have a larger surface area (see Table 1), they generate less OH· radicals than the ZnO microparticles. We hypothesize that this result could be explained because the ZnO nanostructures trap tiny gas nanobubbles on their surface, with a size that is not sufficient to effectively trigger the heterogeneous nucleation of the bubbles. Another reason could be that, as reported in the Supplementary Information (S.I.), the calculated band gap energy of the ZnO nanostructures were slightly higher than that of the ZnO microstructures, thus implying that a larger energy has to be supplied to promote electrons from the valence band to the conduction band in the ZnO nanostructures than in the ZnO microstructures.
3.3. Rhodamine B sonodegradation
Prior to the dye degradation experiments, an important step that could affect the RhB degradation efficiency is the dye adsorption on the catalyst active sites. As reported in the Materials and Methods section, for the quantification of adsorbed RhB, the catalysts were stirred for 60 min in the dark condition in the dye solution (2.5 ppm). Table 1 shows that RhB is adsorbed in larger amount by DRs than to the other morphologies. In particular, DRs morphology ensures the greatest adsorption level of about 35% compared to the initial dye concentration, while the MWs and NWs present the worst adsorption of 17% and 15%, respectively. Finally, the MPs and NPs present similar intermediate values.
An important parameter that commonly influences the adsorption of the dye is the specific surface area of the catalyst, which was measured by N2 adsorption experiments and BET method, see Table 1. These data show that DRs are the morphology with the highest surface area among the microparticles, MPs and MWs have about 2 and 16 times less specific surface area than the DRs. However, it is worth to note that both nanostructures have a higher specific surface area with respect to the microstructures. In particular, ZnO NPs shows a surface area of 4, 9 and 61 times higher than of the DRs and MPs and MWs, respectively, however their dark adsorption of the dye is similar to that of the MPs. Therefore, it is evident that in the present case, the catalysts surface area is not the only parameter influencing the adsorption of the RhB molecules. At pH > 4 RhB exists in dimer forms due to dissociation of carboxylic groups and formation of aggregates between dye molecules [29]. Therefore, it is possible that steric hindrance provided by dye molecules adsorbed in the ZnO nanostructures decreases their RhB adsorption performance.
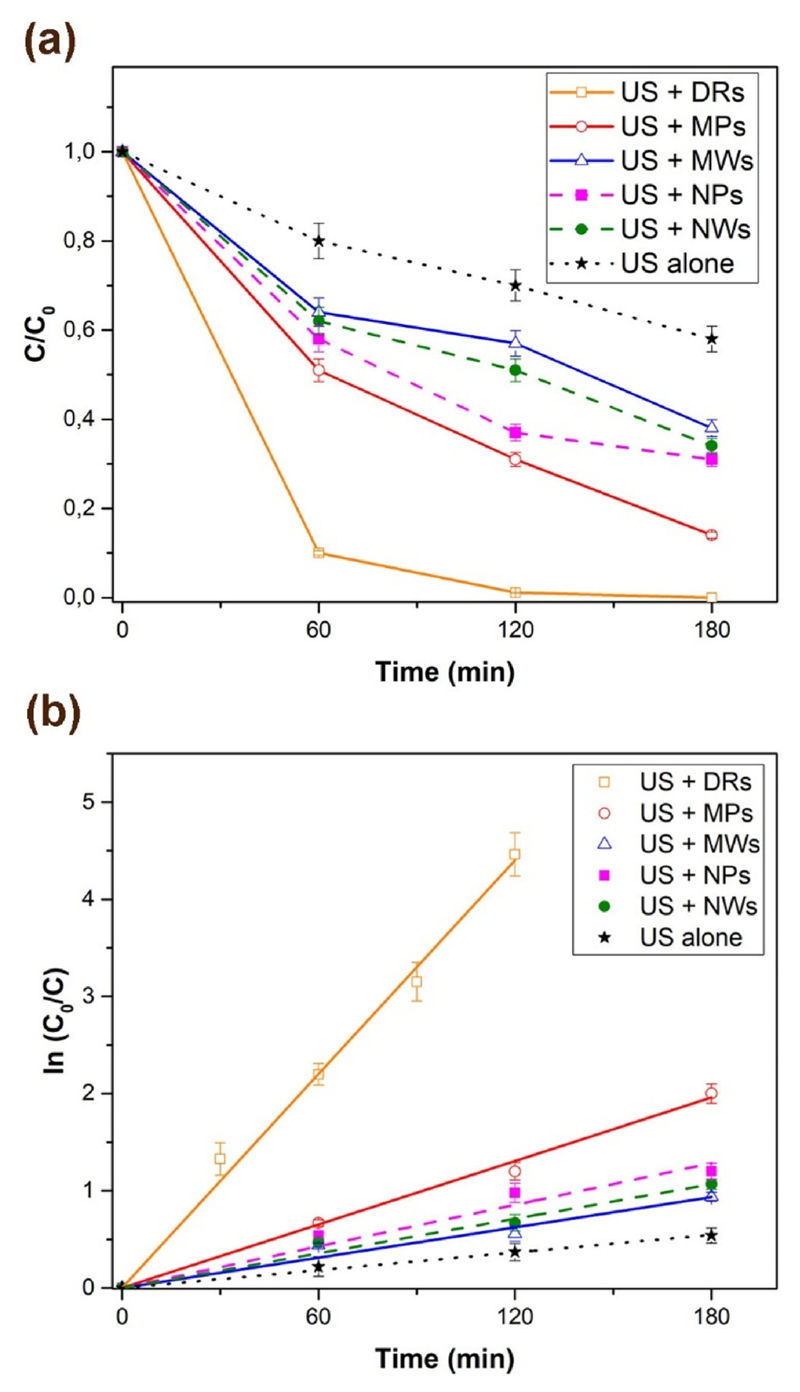
Fig. 5a shows the percentages of Rhodamine B absorption performances, i.e. related to the color component decay, reached by each catalyst under ultrasound irradiation with the setup described in the Materials and methods part. Solid lines are used to indicate the microstructures behavior, while dashed lines are for the nanostructures. The more active particles for RhB sonodegradation were the DRs, by which the complete color degradation was reached in about 3 h. For all the other morphologies, 3 h were not sufficient to reach the complete color degradation. At this time, MPs give 86% of degradation, while MWs, NPs and NWs had a similar trend and their capability of degradation is 62%, 69% and 66%, respectively.
Fig. 5.
(a) Percentages of Rhodamine B degradation obtained by sonocatalysis with different ZnO micro and nanoparticles; (b) The ln(C/C0) vs time curves of RhB sonodegradation.
Some studies [8] reported that dye degradation processes through sonocatalysis follow a pseudo-first order kinetics or pseudo-second order kinetics.
From Fig. 5b, it is noticeable that the RhB degradation kinetics in all the tests is of pseudo-first order because there is a good linear relationship between the ln(C0/C) and the irradiation time (R2 > 0.967). The slope of the straight line represents the kinetic constant (min−1). Table S1 in the S.I. shows the values of the kinetic constant, the necessary time to degrade the 50% of the initial RhB concentration (half-life time) and R-squared calculated from the kinetic plot.
The kinetic constant values show that the degradation performance of the DRs and MPs is 12 and 4 times higher than the control test of sonolysis without ZnO (US alone), while the MWs, NPs and NWs only doubled the result of the sonolysis test. Furthermore, the effective combination of ultrasounds and ZnO catalysts in the sonocatalytic approach is evidenced by the notably decrease of the half-life time of about 92% (DRs), 73% (MPs), 41% (MPs), 57% (NPs) and 49% (NWs), with respect to the only sonolytic process (see Table S1 in the Supporting information, S.I.). In particular, these notable results achieved with the ZnO DRs particles and the US are very promising if compared the performances obtained in other works that used TiO2 and ZnO as sonocatalyst to degrade RhB [19,30]. For instance, the kinetic constant values obtained using commercial and synthetic anatase TiO2 nanoparticles were only 5.8 and 6.8 times higher, respectively, than the RhB degradation only by sonolysis [31]. Similarly, nano-sized ZnO under US achieved a degradation kinetic constant of 8.25 times higher than US alone [32].
Sonodegradation results are in full agreement with the dye adsorption and EPR tests and the considerations reported above. As a general trend, as the adsorption degree of the dye and the OH· radicals generation on the catalyst increases, the kinetic constant increases, and consequently the catalyst enhances its sonocatalytic activity. In the DRs sample, both dye adsorption and radical generation are maximized leading to the best performances. In contrast the NPs, despite showing a lower OH· radicals generation, expose a high surface area and a good retention of the dye, thus leading to a good degradation comparable to that observed for the MWs and the NWs.
3.4. Possible mechanism of the RhB sonocatalytic degradation
The surface charge of metal-oxide particles in aqueous solution is another important factor that influences the adsorption of molecules on the catalyst surface and possibly the degradation mechanism [33]. However, the surface charge of the metal-oxide particles and of the dyes molecules are both pH-dependent [16]. Moreover, above the isoelectric point (IEP), the surface of the particles has negative net charge, while below the isoelectric point a positive net charge [34]. It is well known that, in aqueous dispersions, RhB shows a positively charged diethylamino group (─C═N+) and at pH > 4 the molecules are in the zwitterionic form due to the dissociation of the carboxylic group (─COOH → ─COO−). It can be therefore easily explained the adsorption of the dye through electrostatic attraction forces on the charged catalyst surface.
Feng et al. [35] reported that the RhB photocatalytic degradation proceeds on the catalyst surface rather than in the bulk solution. To the best of our knowledge, there are no works in literature reporting the sonocatalytic degradation pathway of the Rhodamine B on the ZnO particles surface under ultrasounds irradiation. Hence, we investigated in deep the surface properties of our ZnO samples, and carefully analyses the RhB solutions during the color decay tests, in order to propose a possible degradation mechanism.
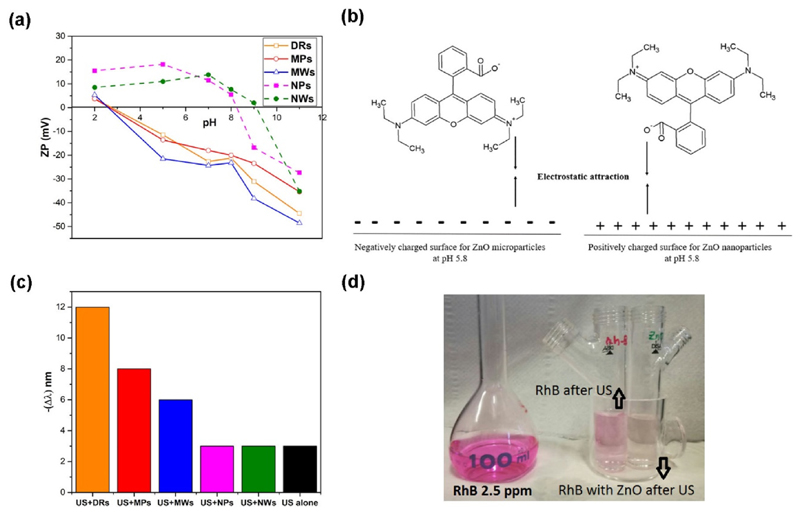
Z-potential measurements were recorded for all the five ZnO catalysts (Fig. 6a), clearly showing very different trends between the microstructures and the nanosized particles. At the pH of the dye solution used in this work (pH = 5.8), the three microstructures show a negative Z-potential value, whereas both NPs and NWs display a positive one. In details, it results that IEP of both nanostructures is at basic pH (about 8–9.5) in good agreement with the data reported in the literature for ZnO materials [34]. In contrast, the microparticles exhibit an unusual IEP at acidic pH (about 2–4). These differences can be attributed to the different synthesis protocols of the micro- and nano-particles. In addition, the negative surface charge of the microparticles can be attributed to the surface adsorption of anions, as the nitrate ones (−NO3), resulting from zinc nitrate precursor, as already shown by FTIR spectroscopy in Fig. 3.
Fig. 6.
(a) Z-Potential profiles of the micro-sized particles (solid lines) and the nano-sized structures (dashed lines); (b) Schematic representation of the Rhodamine B interaction with microstructured sample surfaces (left) and nano-sized sample surfaces (right); (c) Shift of the wavelength of the absorbance peak of the Rh-B solutions treated with ultrasounds; (d) Example of the ultrasound effect on the color of the RhB solutions.
Therefore, in our case, at the operating pH conditions (5.8), the positively charged diethylamino group adsorbs easily on the negatively-charged surfaces presented by all the microstructures, i.e. DRs, MWs and MPs, while the deprotonated carboxylic group can simply interact with the protonated surfaces of the nanostructures, as sketched in Fig. 6b.
To better understand the sonodegradation mechanism, the trend of both position and intensity of the RhB absorbance peak in the visible region, of the solutions under degradation, was analyzed for each catalyst. Indeed, as the RhB degradation increases, its absorbance peak decreases in intensity and it may either remain at the same wavelength (554 nm) or shift to lower wavelengths (hypsochromic shift). In literature, this different behavior is attributed to different mechanisms of RhB photodegradation [33,35]. In the case of only an absorption intensity reduction, the aromatic chromophore group dissociation occurs. Otherwise, the sole peak left-shift is related with the N-deethylation and the formation of a series of N-deethylated intermediates. It is also known that these reaction mechanisms can take place simultaneously.
We observed a continuous reduction in intensity of the RhB adsorption peak, as shown by the trends in Fig. 5a. Moreover, in Fig. 6c are reported the shift in wavelength of the absorption peak compared to the standard peak position of RhB (554 nm). Actually, RhB treated with ultrasound by both ZnO nanostructures slightly changes the position of its absorption peak over time (maximum shift of about 3 nm). This behavior is identical to the shift experienced by the reference RhB solution sonicated in the absence of any catalysts. Remarkably, the variation (up to 14 nm) is more evident when RhB is degraded by the micrometric structures. Feng et al. [35] obtained highly selective RhB N-deethylation by using TiO2/SiO2 with a hypsochromic shift of about 50 nm. In view of these results, the N-deethylation mechanism cannot be excluded for the ZnO microparticles but we consider that this has a minor contribution in the RhB degradation process on the ZnO nanostructures.
Considering that the rate of color decay is proportional to the absorption peak reduction, as depicted in Fig. 6a, it can be deduced that the dominant mechanism in all our degradation trials is the cleavage of the xanthene group. It represents the chromophore group, responsible of the dye color, and therefore its splitting leads to a decrease in the color of the solution. This behavior is confirmed by the color change, from violet to white, of all the RhB solutions treated by the different catalysts during the sonodegradation experiments (as depicted in Fig. 6d).
From the above considerations, clearly the RhB degradation reaction mechanism is driven by the two different dye orientations at the catalyst surfaces and thus by the Z-potential value of the ZnO catalysts (Fig. 6a). Furthermore, the hydroxyl radicals generated during the sonodegradation easily attack the RhB group near catalyst surface. In case of positively charged nanostructures, the xantene group should be oriented toward the surface through the interaction of the carboxylic group, thus undergoing to a facile cleavage of the whole chromophore by the attack of the radicals OH·. On the negatively-charged microstructures, RhB+ molecules can interact through the diethylamino group, thus the dominant chromophore cleavage should be accompanied by the N-deethylation mechanism.
3.5. RhB degradation by different set-up
3.5.1. Photo- and sonophoto-catalytic activities of DRs
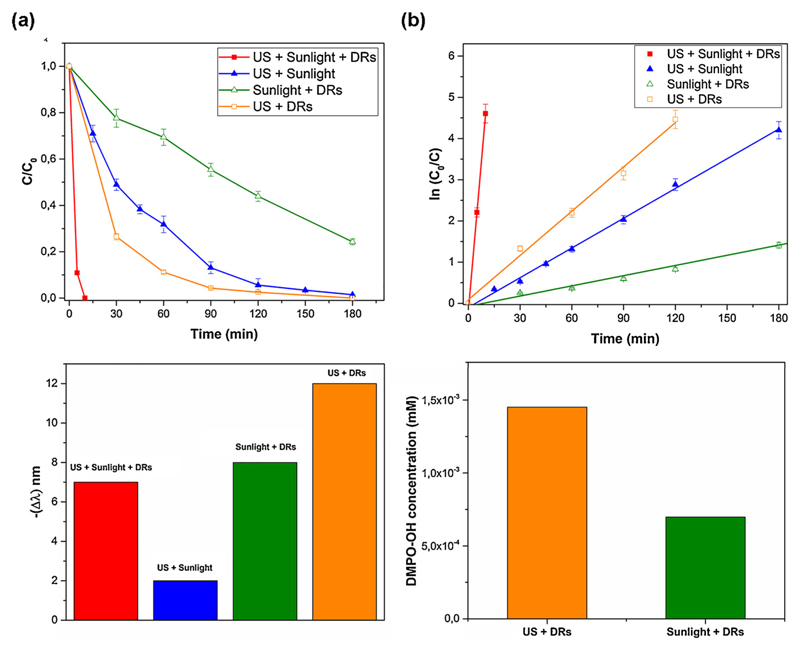
The most performing catalyst, DRs, in the sonodegradation of RhB was then tested in other two configurations (photo and sonophotocatalysis) to compare the degradation performances of these different approaches. Fig. 7a shows the time evolution of the C/C0 ratio during the degradation experiments. During the photodegradation experiment with simulated sunlight irradiation, the DRs sample achieved a much lower degradation (76%) than that by means of sonocatalysis (100%), after 180 min. These results are in agreement with the radicals quantification obtained from EPR analysis in Fig. 7d. Actually, there is a greater generation of hydroxyl radicals in water suspension by ultrasound irradiation than by simulated sunlight irradiation, in the adopted operative conditions.
Fig. 7.
(a) Comparison between three different setups used for the degradation of Rh-B by DRs sample; (b) Trend of the absorbance wavelength of RhB solutions treated by DRs with the three setups; (c) The ln(C/C0) vs time curves of RhB degradation; (d) Comparison quantitative EPR: US and UV–vis irradiaton.
Strikingly, the coupling of the sono- and photocatalysis setup applied at the same time on the DRs microparticles leads to a very rapid and complete degradation of RhB (100%) in only 10 min. We assume that when the solution is treated with the two advanced oxidation processes simultaneously, the application of the US cleans the photocatalyst surface avoiding the accumulation of contaminants or reaction intermediates produced during the dye degradation. Furthermore, US reduce the catalyst microparticles aggregation in solution thanks to the action of turbulence in the liquid medium that increases the mass transfer. As a consequence of the two mechanisms listed above, the open porosity and surface area of the microparticles are easily exposed to the solution, hence there are more active sites available for dye adsorption and formation of the cavitation bubbles. It was also reported [13] that the presence of solid particles gives additional nuclei that are useful for the cavitation, thus increasing the number of cavitation events and, consequently, enhancing the degradation performance. Finally, the production of hydroxyl radicals could also take place through self-photosensitized oxidative transformation of the dye molecules, as it could happens in the sole photocatalytic degradation [23].
All the above-mentioned aspects demonstrate the not only additive but even synergistic effect of applying sono- and photocatalysis at the same time in presence of semiconductor solid particles. This idea is further confirmed by the RhB degradation test without catalyst (the sonophotolythic degradation, line with triangles symbols in Fig. 8a) leading to 52% of degradation after 10 min. Hence, the complete RhB degradation achieved in the presence of the DRs (sonophotocatalysis degradation line) demonstrates the enhancing role of the ZnO microparticles during the sonophotodegradation process.
Fig. 8.
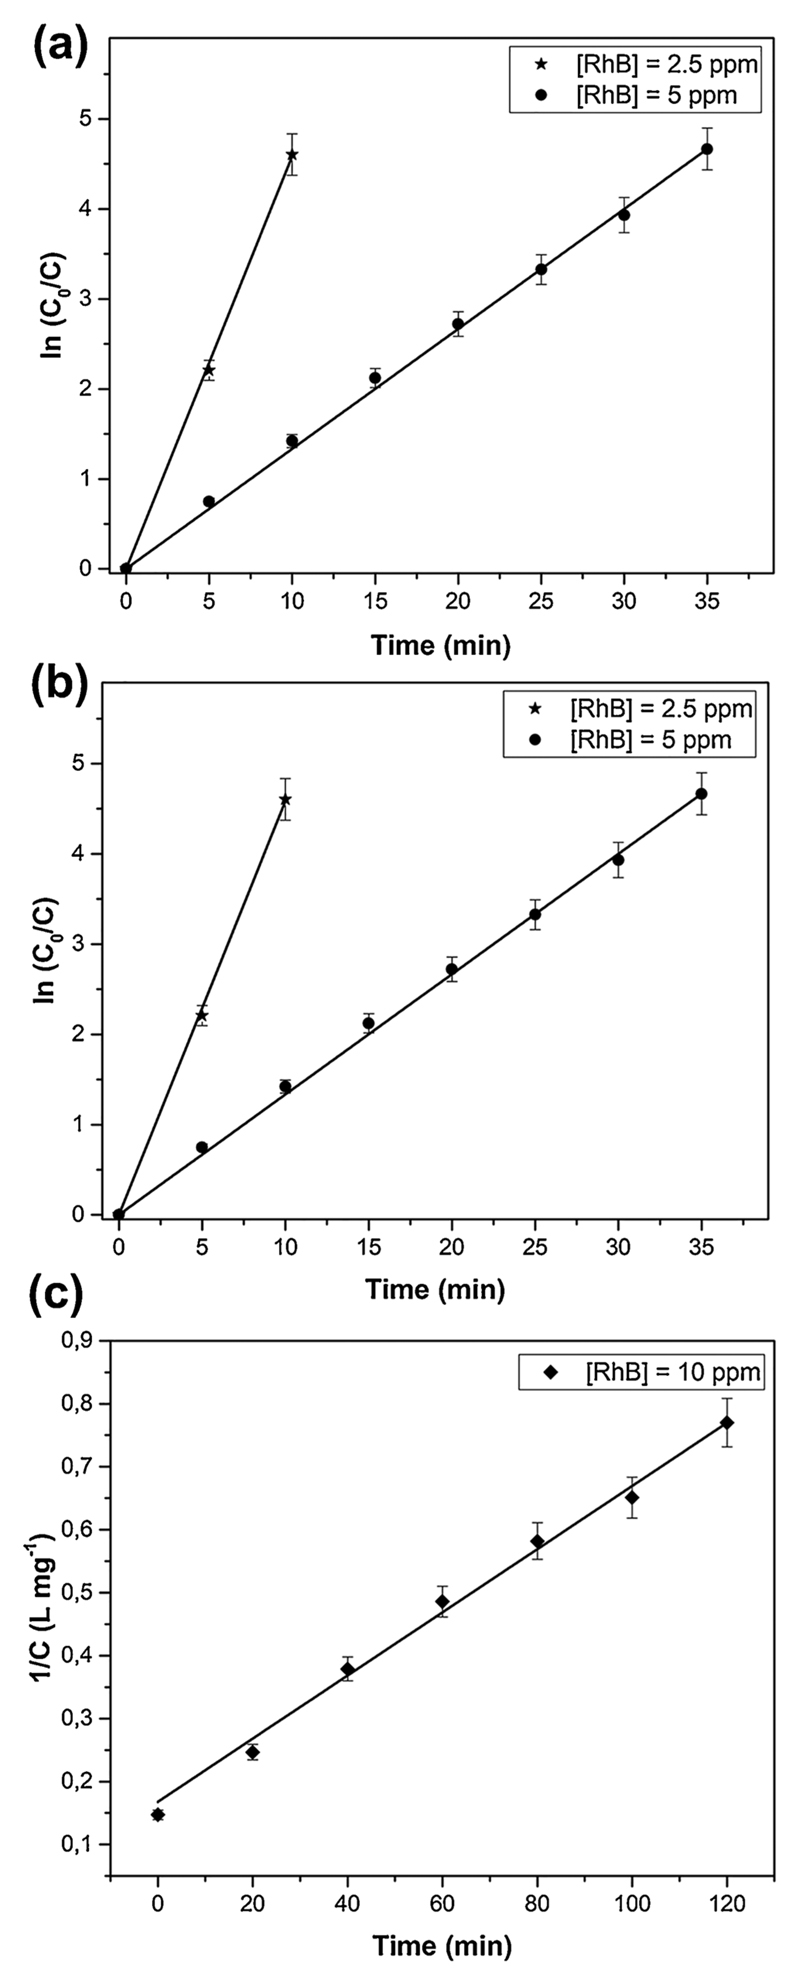
(a) Effect of the initial dye concentration on the RhB degradation; (b) ln (C/C0) vs time curves of RhB degradation and (c) 1/C vs time curves of RhB degradation.
From Fig. 7c, it is noticeable that the RhB degradation kinetics in all the three configurations is of pseudo-first order, since there is a good linear relationship between the ln(C0/C) and the irradiation time. The slope of the straight line represents the kinetic constant (min−1) and those results are reported in Table S2 of the S.I. together with the half-life time and the R-squared calculated from the kinetic plots.
The synergic and not incremental effect of the sonophotocatalytic approach is evidenced by the increase of about 56 and 13 times of the kinetic rate constant, and the notably decrease of the half-life time of about 98% and 92%, with respect to the individual photocatalytic and sonocatalytic processes, respectively. Instead, the important role of the ZnO DRs microparticles in the sonophotocatalytic degradation is highlighted by the 19-fold enhancement of the kinetic rate constant and by the lowering of 95% of the half-life with respect to the not-catalyzed sonophotolysis process.
The achieved results by sonophotocatalysis are very promising and remarkably higher than those previously reported for RhB degradation [36]. Ahmad et al. [21] actually reported an increase of the sonophotocatalytic kinetic rate constant of only 4 times and 3 times, with respect to the individual photocatalytic and sonocatalytic processes, respectively, carried out with ZnO/CNTs composites.
By examining the shift in wavelength of the absorbance peak in both photodegradation and sonodegradation mechanism (Fig. 7c), similar final values of wavelength variation were reached: 8 nm shift for the first and 12 nm shift for the second. When the two degradation processes were combined in the sono-photocatalysis approach, the reaction was so fast that it was possible to evaluate only one point before the complete degradation of Rh-B solution, leading to just 7 nm of shift. Finally, the sonophotolytic experiment (without catalyst) shows a small variation of the dye absorption peak position (around 1 nm shift). As also previously stated for the Fig. 6c from the peak shift analysis, it can be concluded that the main degradation mechanism in all the three used set-ups with the DRs catalyst is the chromophore group rupture, whereas the N-deethylation mechanism has a minor influence. Table S2 in the S.I. reports the kinetic values for these degradation processes.
3.6. Effect RhB initial concentration
The sonophotocatalytic activity of the DRs microparticles was evaluated with different initial concentrations (2.5, 5 and 10 ppm), keeping constant the catalyst concentration (0.5 g/L) and the solution pH at 5.8. From Fig. 8a it can be noticed that at RhB initial concentration of 2.5 and 5 ppm, complete degradation happens after 10 and 35 min, respectively. In contrast, at 10 mg/L the degradation percentage reached the value of 78% after 2 h.
The degradation efficiency could be decreased due to several reasons: (i) at high concentrations, the formation of reaction intermediates increases, so competition begins between the intermediates and the RhB molecules for the occupation of active sites at the-ZnO microparticle surface [37,38]; (ii) hydroxyl radicals react with both the RhB molecules and the reaction intermediates, so the sono- photo-degradation efficiency diminishes because during the process the concentration of hydroxyl radicals reaches a steady value [12]; (iii) at high concentrations, the solution becomes intensively colored and fewer photons reach the surface of the ZnO microparticles, reducing the photocatalytic contribution [39].
In these experiments it is noted that at 2.5 and 5 ppm the reaction order is of pseudo-first order (Fig. 8b), while at 10 ppm there is a good relationship between 1/C and the irradiation time, suggesting that the reaction order is of pseudo-second order (Fig. 8c). In the latter case, the slope and the intercept of the straight line represent the kinetic rate constant (L mg−1 min−1) and 1/C0, respectively. The kinetic rate constants calculated for the degradation of 2.5, 5, and 10 ppm of RhB concentrations are 0,48 ± 5,9E-3 min−1, 0,13 ± 9,69E-4 min−1 and 0,00502 ± 1,82E-4 ml mg−1 ml−1, respectively. As shown in Figs. 8b the kinetic rate constant decreases by increasing the Rh-B concentration, in agreement with the lowering of the degradation efficiency and the reasons explained above. In addition, a possible explanation for second order sonophotocatalytic degradation at the highest Rh-B concentration might be that the molecules of the dye aggregate, leading to dimer formation or higher order aggregates [40]. Similar behaviour has been recently reported in other studies [41].
3.7. Effect of salts addition
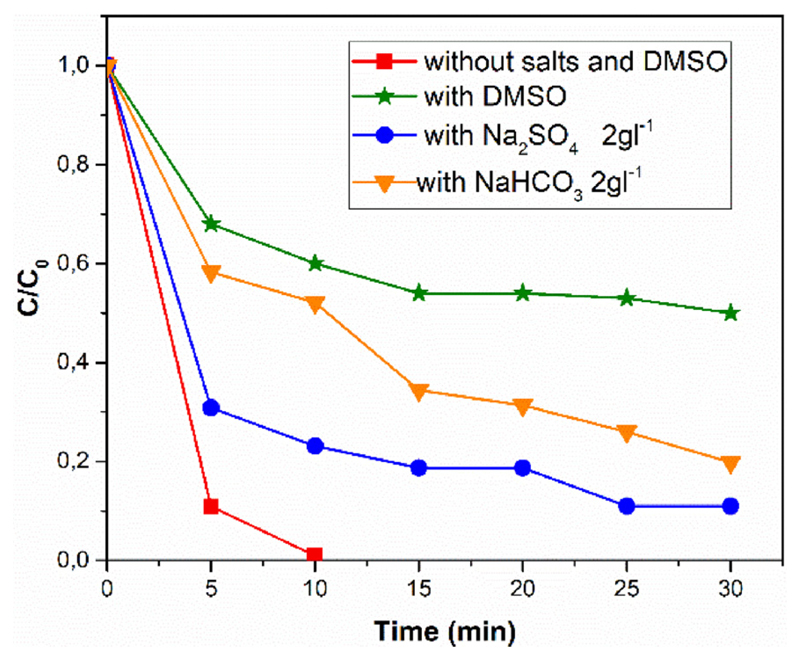
Since industrial waters contain many contaminants including salts, it is important from the application point of view to investigate the dependence of RhB color decay, i.e. degradation rate, in presence of salts. Fig. 9 shows that the addition of common salts found in waste waters, such as Na2SO4 and NaHCO3, leads to a decrease in degradation rate. This is probably because the anions scavenge the hydroxyl radicals, transforming them into the respective anionic radicals, which are less efficient (see Eqs. (3.3)–(3.5)) [42,43].
Fig. 9.
RhB sonophotocatalytic degradation by ZnO DRs in function of the presence of salts or DMSO.
| (3.3) |
| (3.4) |
| (3.5) |
Furthermore, the addition of salts in an aqueous solution influences its ionic strength value and therefore the stability of metal oxides particles suspensions. In particular, a high saline concentration causes the reduction of the electrical double layer of the dispersed and charged particles and the establishment of attraction forces, resulting in the precipitation of the particles.
To further unravel the OH· radicals action in the degradation mechanism of the RhB, dye degradation experiments were conducted in the presence of dimethyl sulfoxide (DMSO), a molecule used as scavenger of hydroxyl radicals. Fig. 9 compares the degradation of RhB with and without DMSO. In particular, the solution containing the scavenger (line with starlet symbols) degrades the RhB more slowly than the others in absence of DMSO. Therefore, this result confirms that the sonophotocatalytic degradation reaction with ZnO DRs involve the formation of OH· radicals.
On the other hand, the RhB degradation reaction also occurred in the presence of DMSO, although in a minor extent (about 40% of degradation in 30 min). We explain this behavior assuming that the RhB molecules, adsorbed on the DRs active sites, react with the radicals produced on the catalyst surface easier than the DMSO molecules in the solution bulk, establishing a competition mechanism.
3.8. Reusability and stability of the catalyst
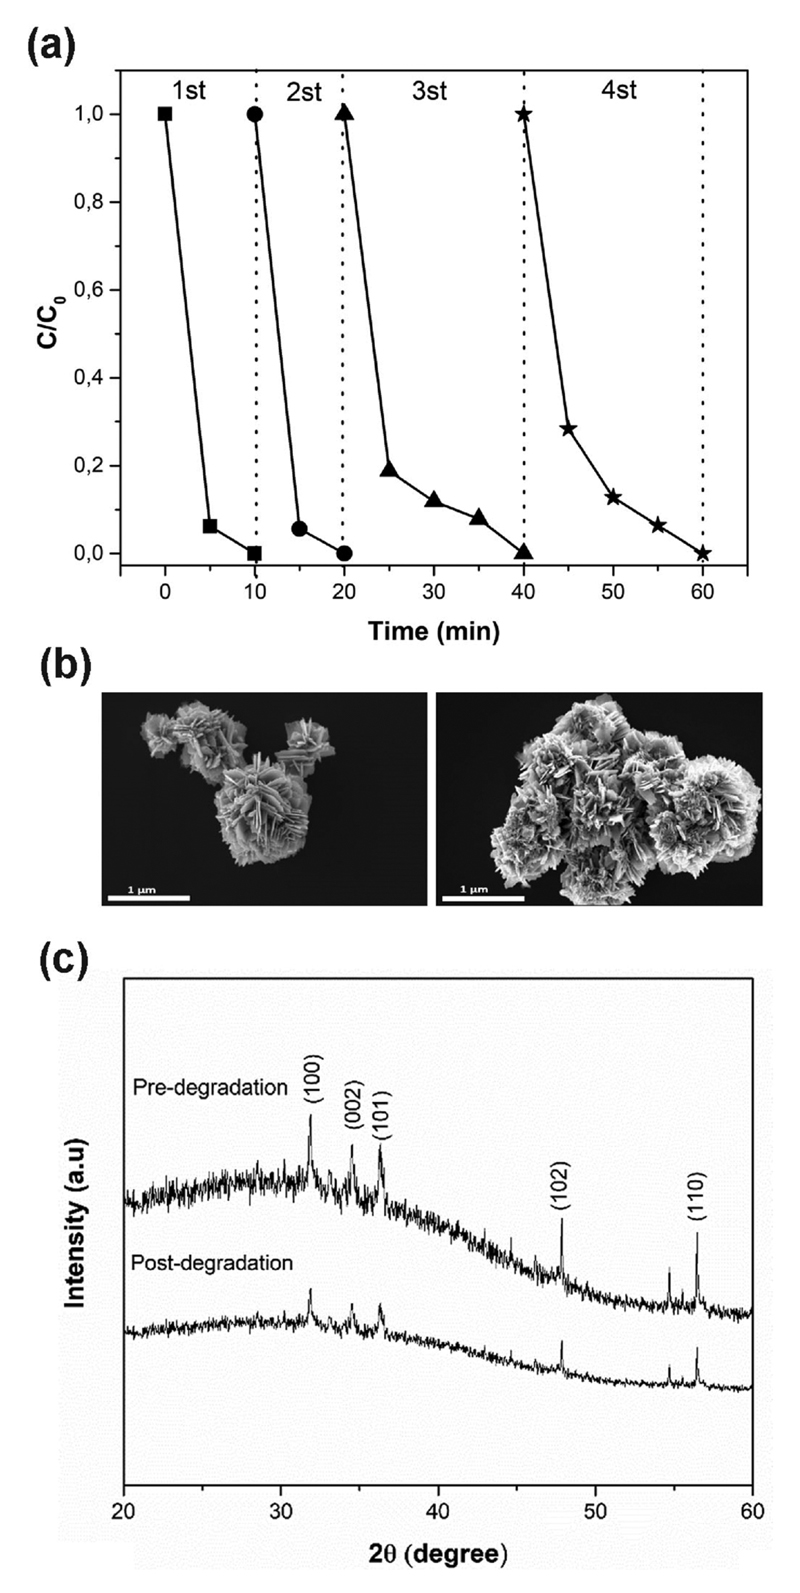
From an industrial point of view, it is interesting to evaluate the stability of the catalyst during the sonophotodegradation process. In this study, to estimate the stability and reusability of ZnO DRs microparticles, the latter were reused in four subsequent sonophotodegradation experiments. From Fig. 10a, it can be noticed that in the first two experiments the sonophotocatalytic activity remained constant, while in the other two following tests the sonophotocatalytic capacity decreased. This loss in efficiency can be attributed to several reasons: (i) a degradation of the catalyst itself; (ii) a possible mass loss of ZnO microparticles during the recovery phase, which was confirmed by visive inspection; (iii) adsorption of RhB molecules of the previous cycle on the surface of the catalyst, hence leading to less available active sites. The first hypothesis was confirmed by FESEM and XRD analyses. The FESEM images in Fig. 10b show that the DRs petals are slightly damaged after sonophotocatalytic degradation. XRD patterns in Fig. 10c also show that the crystallinity of the microparticles slightly decreases with a reduction of the peaks intensities. However, we suggest the good suitability of the DRs microparticles as a reusable sonophotocatalysts for multiple processes, bearing in mind that a more efficient processing of the microparticles to avoid mass losses between consecutive catalytic steps could be developed. For instance, we previously reported that a protective layer of a more resistant material (i.e. TiO2) can be used to shield the surface of the ZnO from chemical corrosion in harsh aqueous media during a photocatalytic process [27]. Finally, colocalization experiment by a fluorescence microscope in Supplementary information (S.I.) confirmed that RhB was adsorbed on the DRs surface after the degradation process.
Fig. 10.
(a) RhB sonophotocatalytic degradation with ZnO DRs microparticles reused four times; (b) FESEM images of DRs before (left) and after (right) the Rh-B sonophotocatalytic degradation experiment; (c) X-ray Diffraction patterns of DRs pre- and post-degradation.
4. Conclusions
By applying two different sol-gel synthesis methods, five zinc oxide catalyst powders with different morphologies and sizes were successfully synthesized: Desert Roses (DRs), Multipods (MPs), Microwires (MWs), Nanoparticles (NPs) and Nanowires (NWs). All catalysts were characterized, showing a high degree of crystallinity, purity and the expected morphology.
The common dye pollutant Rhodamine B, used in the textile industry, was chosen to investigate the degradation action by two advanced oxidation processes (AOPs), sono- and photo-catalysis and their synergic combination in the sonophotocatalytic approach.
The sonodegradation experiments were conducted by comparing the different ZnO micro- and nano-structures. The obtained data confirmed that the performance in presence of catalysts (sonocatalysis) were better than without them (sonolysis). In particular, the pseudoorder kinetic constant of DRs microparticles (flower-like morphology) was 12 times higher than that of sonolysis alone, while the half-time was decreased of 92% respect to the sonolytic process. The EPR spectroscopy coupled with spin trapping technique showed that the DRs leads to the greatest generation of OH· radicals, among the five different structures, confirming the hypothesis that the morphology and size of the particles affect the radical generation under ultrasound irradiation.
In a strategy to further reduce the RhB degradation time (180 min needed to completely degrade the RhB with DRs), the synergistic sonophotocatalytic process was applied. The sonophotocatalytic degradation improved the overall efficiency with respect to the AOPs used separately, allowing the total degradation of the dye in only 10 min, with a remarkably increase (56 and 13-fold) of the kinetic rate constant with respect to the individual photocatalytic and sonocatalytic processes, respectively.
The dependence of sonophotocatalytic degradation of RhB on its initial concentration was also studied and the results clearly illustrated that the sonophotocatalytic degradation process is promising at low dye concentrations. Addition of common salts, such as Na2SO4 and NaHCO3, has led to a decrease in dye degradation rate, so a pre-treatment (i.e. by ion exchange membranes) may be needed to reduce the saline composition of the wastewater. Finally, in this study, to estimate the stability and reusability of ZnO DRs microparticles, the latter were re-used in four subsequent sonophotodegradation experiments. The results suggest that the stability of the obtained ZnO micropowders decreases over multiple cycles of decontamination, then a protective layer of a more resistant material (i.e. TiO2) can be used to protect the surface of the ZnO during the degradation process.
Supplementary Material
Supplementary material related to this article can be found, in the online version, at doi:https://doi.org/10.1016/j.apcatb.2018.10.078.
Acknowledgements
This work was accomplished also thanks to the funding from the European Research Council (ERC) under the European Union’s Horizon 2020 research and innovation programme (grant agreement No 678151 – Project Acronym “TROJANANOHORSE” – ERC starting Grant). The help of Mr. Mauro Raimondo for the acquisition of FESEM and STEM images, and that of Dr. Tanveer A. Gadhi for the technical support on the photo-degradation measurements are both gratefully acknowledged.
References
- [1].Madhav S, Ahamad A, Singh P, Mishra PK. A review of textile industry: wet processing, environmental impacts, and effluent treatment methods. Environ Qual Manag. 2018;27(3):31–41. [Google Scholar]
- [2].Merouani S, Hamdaoui O, Saoudi F, Chiha M. Sonochemical degradation of Rhodamine B in aqueous phase: effects of additives. Chem Eng J. 2010;158(3):550–557. doi: 10.1016/j.jhazmat.2009.10.046. [DOI] [PubMed] [Google Scholar]
- [3].Nidheesh PV, Gandhimathi R, Ramesh ST. Degradation of dyes from aqueous solution by Fenton processes: a review. Environ Sci Pollut Res. 2013;20(4):2099–2132. doi: 10.1007/s11356-012-1385-z. [DOI] [PubMed] [Google Scholar]
- [4].Khamparia S, Jaspal DK. Adsorption in combination with ozonation for the treatment of textile waste water: a critical review. Front Environ Sci Eng. 2017;11(1):1–18. [Google Scholar]
- [5].Yang W, Zhou H, Cicek N. Treatment of organic micropollutants in water and wastewater by UV-based processes: a literature review. Crit Rev Environ Sci Technol. 2014;44(13):1443–1476. [Google Scholar]
- [6].Chan SHS, Wu TY, Juan JC, Teh CY. Recent developments of metal oxide semiconductors as photocatalysts in advanced oxidation processes (AOPs) for treatment of dye waste-water. J Chem Technol Biotechnol. 2011;86(9):1130–1158. [Google Scholar]
- [7].Eren Z. Ultrasound as a basic and auxiliary process for dye remediation: a review. J Environ Manage. 2012;104:127–141. doi: 10.1016/j.jenvman.2012.03.028. [DOI] [PubMed] [Google Scholar]
- [8].Qiu P, Park B, Choi J, Thokchom B, Pandit AB, Khim J. A review on heterogeneous sonocatalyst for treatment of organic pollutants in aqueous phase based on catalytic mechanism. Ultrason Sonochem. 2018 Mar;45:29–49. doi: 10.1016/j.ultsonch.2018.03.003. [DOI] [PubMed] [Google Scholar]
- [9].Wood RJ, Lee J, Bussemaker MJ. A parametric review of sonochemistry: control and augmentation of sonochemical activity in aqueous solutions. Ultrason Sonochem. 2017;38:351–370. doi: 10.1016/j.ultsonch.2017.03.030. [DOI] [PubMed] [Google Scholar]
- [10].Miyaji A, Kohno M, Inoue Y, Baba T. Hydroxyl radical generation by dissociation of water molecules during 1.65 MHz frequency ultrasound irradiation under aerobic conditions. Biochem Biophys Res Commun. 2017;483(1):178–182. doi: 10.1016/j.bbrc.2016.12.171. [DOI] [PubMed] [Google Scholar]
- [11].Tijani JO, Fatoba OO, Madzivire G, Petrik LF. A review of combined advanced oxidation technologies for the removal of organic pollutants from water. Water Air Soil Pollut. 2014;225(9) [Google Scholar]
- [12].Behnajady MA, Modirshahla N, Tabrizi SB, Molanee S. Ultrasonic degradation of Rhodamine B in aqueous solution: Influence of operational parameters. J Hazard Mater. 2008;152(1):381–386. doi: 10.1016/j.jhazmat.2007.07.019. [DOI] [PubMed] [Google Scholar]
- [13].Tuziuti T, Yasui K, Sivakumar M, Iida Y, Miyoshi N. Correlation between acoustic cavitation noise and yield enhancement of sonochemical reaction by particle addition. J Phys Chem A. 2005;109(21):4869–4872. doi: 10.1021/jp0503516. [DOI] [PubMed] [Google Scholar]
- [14].Canavese G, et al. Nanoparticle-assisted ultrasound: a special focus on sonodynamic therapy against cancer. Chem Eng J. 2018 Jan;340:155–172. doi: 10.1016/j.cej.2018.01.060. [DOI] [PMC free article] [PubMed] [Google Scholar]
- [15].Dadjour MF, Ogino C, Matsumura S, Shimizu N. Kinetics of disinfection of Escherichia coli by catalytic ultrasonic irradiation with TiO2. Biochem Eng J. 2005;25(3):243–248. [Google Scholar]
- [16].Shimizu N, Ogino C, Dadjour MF, Murata T. Sonocatalytic degradation of methylene blue with TiO2 pellets in water. Ultrason Sonochem. 2007;14(2):184–190. doi: 10.1016/j.ultsonch.2006.04.002. [DOI] [PubMed] [Google Scholar]
- [17].Farshbaf Dadjour M, Ogino C, Matsumura S, Nakamura S, Shimizu N. Disinfection of Legionella pneumophila by ultrasonic treatment with TiO2. Water Res. 2006;40(6):1137–1142. doi: 10.1016/j.watres.2005.12.047. [DOI] [PubMed] [Google Scholar]
- [18].Wang J, Guo B, Zhang X, Zhang Z, Han J, Wu J. Sonocatalytic degradation of methyl orange in the presence of TiO2catalysts and catalytic activity comparison of rutile and anatase. Ultrason Sonochem. 2005;12(5):331–337. doi: 10.1016/j.ultsonch.2004.05.002. [DOI] [PubMed] [Google Scholar]
- [19].Pang YL, Abdullah AZ, Bhatia S. Effect of annealing temperature on the characteristics, sonocatalytic activity and reusability of nanotubes TiO2 in the degradation of Rhodamine B. Appl Catal B: Environ. 2010;100(1–2):393–402. [Google Scholar]
- [20].Lee KM, Lai CW, Ngai KS, Juan JC. Recent developments of zinc oxide based photocatalyst in water treatment technology: a review. Water Res. 2016;88:428–448. doi: 10.1016/j.watres.2015.09.045. [DOI] [PubMed] [Google Scholar]
- [21].Ahmad M, Ahmed E, Hong ZL, Ahmed W, Elhissi A, Khalid NR. Photocatalytic, sonocatalytic and sonophotocatalytic degradation of Rhodamine B using ZnO/CNTs composites photocatalysts. Ultrason Sonochem. 2014;21(2):761–773. doi: 10.1016/j.ultsonch.2013.08.014. [DOI] [PubMed] [Google Scholar]
- [22].Gogate PR. Treatment of wastewater streams containing phenolic compounds using hybrid techniques based on cavitation: a review of the current status and the way forward. Ultrason Sonochem. 2008;15(1):1–15. doi: 10.1016/j.ultsonch.2007.04.007. [DOI] [PubMed] [Google Scholar]
- [23].Wu T, Liu G, Zhao J, Hidaka H, Serpone N. Photoassisted degradation of dye pollutants. V. Self-photosensitized oxidative transformation of Rhodamine B under visible light irradiation in aqueous TiO2 dispersions. J Phys Chem B. 1998;102(30):5845–5851. [Google Scholar]
- [24].Cauda V, Stassi S, Lamberti A, Morello M, Fabrizio Pirri C, Canavese G. Leveraging ZnO morphologies in piezoelectric composites for mechanical energy harvesting. Nano Energy. 2015;18:212–221. [Google Scholar]
- [25].Dumontel B, et al. Enhanced biostability and cellular uptake of zinc oxide nano-crystals shielded with a phospholipid bilayer. J Mater Chem B. 2017;5(44):8799–8813. doi: 10.1039/c7tb02229h. [DOI] [PMC free article] [PubMed] [Google Scholar]
- [26].Pacholski C, Kornowski A, Weller H. Self-assembly of ZnO: From nanodots to nanorods. Angew Chem—Int Ed. 2002;41(7):1188–1191. doi: 10.1002/1521-3773(20020402)41:7<1188::aid-anie1188>3.0.co;2-5. [DOI] [PubMed] [Google Scholar]
- [27].Hernández S, et al. Optimization of 1D ZnO@TiO2 core–shell nanostructures for enhanced photoelectrochemical water splitting under solar light illumination. ACS Appl Mater Interfaces. 2014;6(15):12153–12167. doi: 10.1021/am501379m. [DOI] [PubMed] [Google Scholar]
- [28].Cauda V, et al. Multi-functional energy conversion and storage electrodes using flower-like zinc oxide nanostructures. Energy. 2014;65:639–646. [Google Scholar]
- [29].Shen K, Gondal MA. Removal of hazardous Rhodamine dye from water by adsorption onto exhausted coffee ground. J Saudi Chem Soc. 2017;21:S120–S127. [Google Scholar]
- [30].Pang YL, Abdullah AZ. Comparative study on the process behavior and reaction kinetics in sonocatalytic degradation of organic dyes by powder and nanotubes TiO2. Ultrason Sonochem. 2012;19(3):642–651. doi: 10.1016/j.ultsonch.2011.09.007. [DOI] [PubMed] [Google Scholar]
- [31].Priya MH, Madras G. Kinetics of TiO2-catalyzed ultrasonic degradation of Rhodamine dyes. Ind Eng Chem Res. 2006;45(3):913–921. [Google Scholar]
- [32].Wang J, et al. Sonocatalytic degradation of acid red B and rhodamine B catalyzed by nano-sized ZnO powder under ultrasonic irradiation. Ultrason Sonochem. 2008;15(5):768–774. doi: 10.1016/j.ultsonch.2008.02.002. [DOI] [PubMed] [Google Scholar]
- [33].He Z, Sun C, Yang S, Ding Y, He H, Wang Z. Photocatalytic degradation of rhodamine B by Bi2WO6 with electron accepting agent under microwave irradiation: mechanism and pathway. J Hazard Mater. 2009;162(2–3):1477–1486. doi: 10.1016/j.jhazmat.2008.06.047. [DOI] [PubMed] [Google Scholar]
- [34].Ancona A, et al. Lipid-coated zinc oxide nanoparticles as innovative ROS-generators for photodynamic therapy in cancer cells. Nanomaterials. 2018;8(3):143. doi: 10.3390/nano8030143. [DOI] [PMC free article] [PubMed] [Google Scholar]
- [35].Chen F, Zhao J, Hidaka H. Highly selective deethylation of Rhodamine B: adsorption and photooxidation pathways of the dye on the TiO2/SiO2 composite photocatalyst. Int J Photoenergy. 2003;5(4):209–217. [Google Scholar]
- [36].Rastogi M, Bowen C, Kushwaha HS, Vaish R. First principles insights into improved catalytic performance of BaTiO3-graphene nanocomposites in conjugation with experimental investigations. Mater Sci Semicond Process. 2016;51:33–41. [Google Scholar]
- [37].Pimentel A, et al. Effect of solvents on ZnO nanostructures synthesized by solvothermal method assisted by microwave radiation: a photocatalytic study. J Mater Sci. 2015;50(17):5777–5787. [Google Scholar]
- [38].Hu L, Yuan H, Zou L, Chen F, Hu X. Applied Surface Science Adsorption and visible light-driven photocatalytic degradation of Rhodamine B in aqueous solutions by Ag @ AgBr/SBA-15. Appl Surf Sci. 2015;355:706–715. [Google Scholar]
- [39].Nagaraja R, Kottam N, Girija CR, Nagabhushana BM. Photocatalytic degradation of Rhodamine B dye under UV/solar light using ZnO nanopowder synthesized by solution combustion route. Powder Technol. 2012;215–216:91–97. [Google Scholar]
- [40].Niazi A, Yazdanipour A, Ghasemi J, Kubista M. Spectrophotometric and thermodynamic study on the dimerization equilibrium of ionic dyes in water by chemometrics method. Spectrochim Acta Part A: Mol Biomol Spectrosc. 2006;65(1):73–78. doi: 10.1016/j.saa.2005.09.030. [DOI] [PubMed] [Google Scholar]
- [41].El-Kemary M, El-Shamy H. Fluorescence modulation and photodegradation characteristics of safranin O dye in the presence of ZnS nanoparticles. J Photochem Photobiol A: Chem. 2009;205(2–3):151–155. [Google Scholar]
- [42].Jyothi KP, Yesodharan S, Yesodharan EP. Contaminant salts as enhancers of sonocatalytic degradation of organic water pollutants: Effect of concentration, reaction time and adsorption on the efficiency of enhancement and the fate of concurrently formed H2O2. J Environ Chem Eng. 2016 [Google Scholar]
- [43].Guillard C, Puzenat E, Lachheb H, Houas A, Herrmann J-M. Why inorganic salts decrease the TiO2 photocatalytic efficiency. Int J Photoenergy. 2005;7(1):1–9. [Google Scholar]
Associated Data
This section collects any data citations, data availability statements, or supplementary materials included in this article.


