Abstract
Oligodendrocytes wrap nerve fibers in the central nervous system with layers of specialized cell membrane to form myelin sheaths1. Myelin is destroyed by the immune system in multiple sclerosis, but myelin is thought to regenerate and neurological function can be recovered. In animal models of demyelinating disease, myelin is regenerated by newly generated oligodendrocytes, and remaining mature oligodendrocytes do not appear to contribute to this process2–4. Considering the major differences in oligodendrocyte generation dynamics and adaptive myelination between rodents and humans5–9, it is uncertain how well experimental animals reflect the situation in multiple sclerosis. We have assessed the generation dynamics of oligodendrocytes in multiple sclerosis patients by measuring the integration of nuclear bomb test derived 14C in genomic DNA10. The generation of new oligodendrocytes was increased several-fold in normal appearing white matter in a subset of individuals with very aggressive disease, but not in the majority of subjects with multiple sclerosis, demonstrating an inherent potential to substantially increase oligodendrocyte generation but that this fails in most patients. Oligodendrocytes in shadow plaques, thinly myelinated lesion that are thought to represent remyelinated areas, were old in multiple sclerosis patients. The absence of new oligodendrocytes in shadow plaques suggests that remyelination of lesions occur transiently or not at all, or that myelin is regenerated by preexisting, and not new, oligodendrocytes in multiple sclerosis. We report unexpected oligodendrocyte generation dynamics in multiple sclerosis, which should guide the use of current, and the development of new, therapies.
In order to assess the cell generation dynamics in multiple sclerosis, we retrospectively birth dated mature oligodendrocytes from postmortem human brain tissue. We took advantage of the drastically increased levels of atmospheric 14C levels caused by nuclear bomb tests during the Cold War11. 14C in the atmosphere is present in the form of 14CO2, which is taken up by plants in photosynthesis and in that way enters the food chain, making the atmospheric 14C level being mirrored in the human body at any given time. When a cell duplicates its chromosomes during mitosis, it will integrate 14C in the genomic DNA at a concentration corresponding to that in the atmosphere and create a stable date mark for when the cell was born. Integration of 14C in the human body can be measured with a precision of ±1.6 years10. By comparing the level of 14C in genomic DNA to that in the atmosphere it is possible to infer the age, and with mathematical modeling calculate the turnover dynamics of a cell population5,10,12–14.
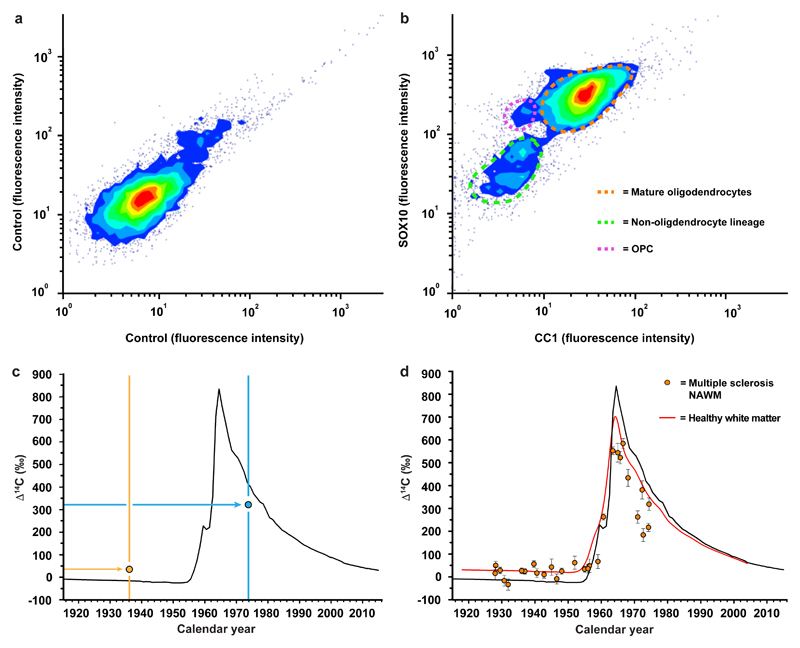
We used a previously established strategy to isolate mature oligodendrocyte cell nuclei to high purity by flow cytometry from human postmortem brain tissue using antibodies to SOX10, which is expressed at all maturational stages in the oligodendrocyte lineage, and the monoclonal antibody CC1, which specifically labels cell nuclei of myelinating oligodendrocytes5 (Fig. 1a, b, Extended Data Fig. 1, see methods section). We extracted genomic DNA and measured the 14C concentration by accelerator mass spectrometry15. See Supplementary Table 1 for measured 14C concentrations, associated data and patient information.
Figure 1. Isolation and birth dating of oligodendrocytes from multiple sclerosis patients.
a, b, Flow cytometry contour plots of cell nuclei from multiple sclerosis postmortem normal appearing white matter (n = 32, biopsies and patients) displaying fluorescence intensity without primary antibodies (a) or with CC1 and SOX10 antibodies to identify nuclei from mature oligodendrocytes, oligodendrocyte progenitor cells (OPC) and non-oligodendrocyte lineage cells (b). c, Schematic depiction of interpretation of 14C in genomic DNA. The black curve indicates the excess of 14C in the atmosphere above the natural level (Δ14C = 0) as a function of time. The 14C levels increased 1955-1963 due to over ground nuclear bomb tests, and thereafter declined due to diffusion and uptake by the biosphere. The vertical lines indicate the date of birth of two individuals and two hypothetical data points (circles) are placed corresponding to the year of birth and 14C measured in genomic DNA. In an individual born before the onset of the increase in the atmospheric 14C during the Cold War (yellow vertical line and data point), a 14C concentration above the atmospheric curve at the time of birth indicates cell generation after 1955. In a subject born after the peak in the atmospheric 14C concentration (blue), a 14C concentration lower than the atmospheric 14C concentration at the time of birth indicates cell generation after birth. d, Carbon dating of mature oligodendrocytes from normal appearing white matter (NAWM) from multiple sclerosis patients (mean ± 2 s.d., n = 29). The red line indicates the corresponding values from mature oligodendrocytes from healthy subjects born at different times (from ref. 5).
Multiple sclerosis is characterized by focal lesions, with large areas in the brain appearing grossly normal. It is, however, well established that there is microglial activation, axonal pathology as well as reduction of myelin in areas referred to as normal appearing white matter, and this is thought to underlie some of the neurological deficits16. We isolated oligodendrocyte nuclei from normal appearing white matter in postmortem tissue from multiple sclerosis patients (n=29) and determined the 14C concentration in genomic DNA (Fig. 1c, d, Supplementary Table 1). We used our previously published data on oligodendrocyte genomic DNA 14C concentration from healthy subjects (n=34), which was collected and processed in parallel and identically to as in this study, with overlapping birth and death dates of the included subjects, as a reference to assess whether oligodendrocyte generation is altered in multiple sclerosis5.
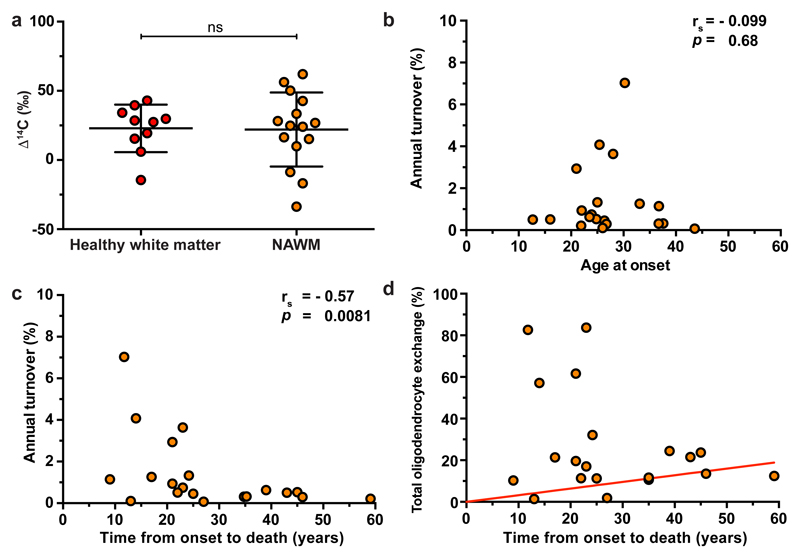
We first determined the 14C concentration in genomic DNA of mature oligodendrocytes in subjects born before the onset of the nuclear bomb tests, which provides high sensitivity to detect cell generation at later times with highly elevated atmospheric 14C concentration, which also overlapped with the time period when the patients developed multiple sclerosis. There was no statistically significant difference when comparing 14C levels in genomic DNA between healthy subjects and multiple sclerosis patients born before the increase in atmospheric 14C in 1955 (Fig. 2a, P=0.85, Mann Whitney test), establishing that the disease had not affected the oligodendrocyte generation rate in these patients.
Figure 2. Increased oligodendrocyte generation in multiple sclerosis patients with aggressive disease.
a, There is no significant difference in the 14C concentration in genomic DNA of mature oligodendrocytes from white matter of healthy subjects and normal appearing white matter (NAWM) in multiple sclerosis patients born before the onset of the nuclear bomb tests, indicating that turnover dynamics are unaltered by the disease in these individuals (ns, P = 0.85, two-tailed Mann Whitney test, a method to compare two ensembles of randomly distributed values in order to find out whether they are similar within statistical uncertainties or not) (n = 10 and 15). The horizontal lines indicate the mean value (long line) and the s.d. (short lines) of the distribution of Δ14C values. b, The age at onset of multiple sclerosis does not correlate to the oligodendrocyte generation rate in normal appearing white matter. c, Multiple sclerosis patients with aggressive disease and short disease duration to death have a significantly elevated oligodendrocyte generation rate after the multiple sclerosis onset. Individual turnover rate calculations are sensitive to deviations in measured 14C, especially for subjects born during the rapid increase in atmospheric 14C, and two subjects born 1959 and 1956 were excluded in (b, c) due to unrealistically high turnover rates from the analysis. Seven additional subjects were excluded as the turnover rate could not be estimated due to poor fit (n = 20 in b, c). The full data is given in Supplementary Table 4. d, The total proportion of all oligodendrocytes exchanged is dramatically increased in some patients with aggressive disease and short disease duration to death (n = 20). The red line indicates the proportion of oligodendrocytes that are exchanged over time in healthy adults (0.32% per year5). ns, not significant. rs, spearman’s correlation coefficient. p, probability value.
However, several multiple sclerosis patients born later displayed a highly elevated oligodendrocyte generation (see Supplementary Data and Supplementary Tables 2-8). Seven multiple sclerosis patients had >3-fold higher oligodendrocyte turnover in normal appearing white matter compared to the median in healthy subjects of the corresponding age (Fig. 2b, c, Supplementary Table 4, 5). There is little interindividual variation in oligodendrocyte generation in the white matter of healthy individuals (median annual turnover in individuals >30 years of age is 0.33% [CI] [0.23%, 0.44%], Supplementary Table 5), whereas the high turnover rate in normal appearing white matter in several young patients made the turnover more heterogeneous and significantly higher in the multiple sclerosis group (median 0.58% [0.32%, 1.26%], P= 0.02, Mann-Whitney test, Supplementary Table 4). In the seven multiple sclerosis patients with >3-fold increased oligodendrocyte generation, in average 49.9% of the oligodendrocytes in the analyzed normal appearing white matter were generated after the disease onset (Fig. 2d).
Oligodendrocyte generation and remyelination becomes less efficient with age in models of multiple sclerosis in rodents17,18, raising the question whether this result may be related to the age of the patient. However, there was no correlation between the age at disease onset and the oligodendrocyte generation rate in the multiple sclerosis patients (Fig. 2b, rs=-0.099, P=0.68, Spearman correlation). Moreover, if the older patients born before the nuclear bomb tests during the Cold War would have had a high oligodendrocyte generation rate the first decade after disease onset, it would have left a lasting mark and would readily have been detected long after, as 14C acts as a cumulative label.
Rather than the elevated level of oligodendrocyte generation in some patients being related to their age, a common factor for these individuals was that they had very aggressive disease with rapid progression to death. The time from disease onset to death was inversely correlated with the oligodendrocyte generation rate in the multiple sclerosis patients (Fig. 2c, rs=-0.57, P=0.0081, Spearman correlation). As tissue from all patients was collected postmortem during the same time period, the individuals who had the most aggressive disease died at the youngest age, and that is why this effect was seen in the latest born patients.
Although all patients with a highly elevated oligodendrocyte generation rate had rapid disease progression, there were other patients who had similarly rapid disease progression without an increased oligodendrocyte generation rate, suggesting that the disease, or the response to it, is heterogeneous. Although the tissue appeared normal, we do not know if these new oligodendrocytes were fully functional, and if their generation was beneficial for the patients. Nevertheless, the dramatic increase in some individuals with aggressive disease demonstrates that there is an inherent potential to substantially increase oligodendrocyte generation and long term integration in humans. A better understanding of the molecular regulation of oligodendrocyte generation, and identification of factors that may inhibit this process or the integration of new oligodendrocytes, may aid in the development of new therapies19.
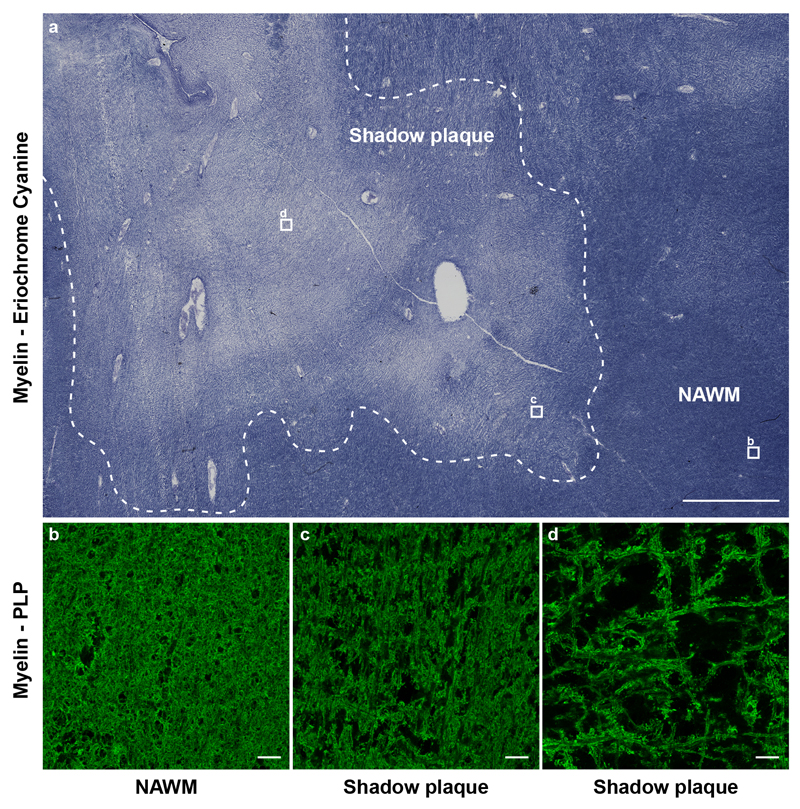
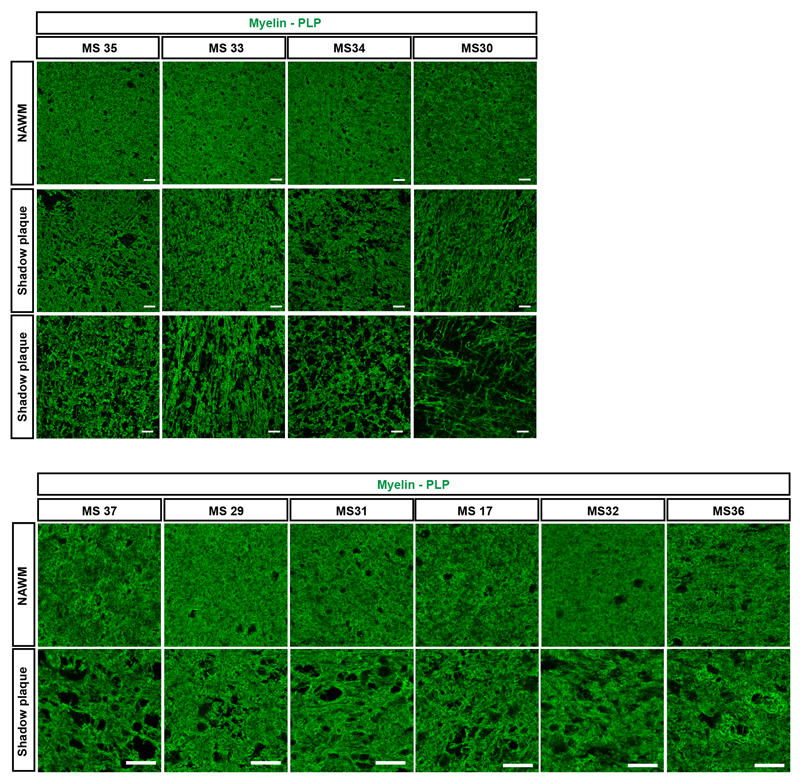
We next carbon dated genomic DNA of mature oligodendrocytes from shadow plaques. Shadow plaques are focal multiple sclerosis lesions where the inflammation has subsided and which have lower myelin density than normal appearing white matter. Remyelination of lesions in animal models of multiple sclerosis results in shadow plaques, and shadow plaques in multiple sclerosis patients have therefore been inferred to represent partly remyelinated areas, although this is difficult to formally establish in humans. It is possible that shadow plaques rather represent focal areas of thinning of myelin of surviving compromised oligodendrocytes. Shadow plaques are rare and often too small to isolate sufficient numbers of cells for carbon dating from, but we were able to collect nuclei from mature oligodendrocytes for accurate measurements from 11 patients (Fig. 3a, Supplementary Table 1). Shadow plaques are readily distinguished in histological sections and were identified by independent experienced neuropathologists using standard criteria (see method section). Moreover, we analyzed the pattern of eriochrome cyanine staining and proteolipid protein labeling, which verified reduced myelin in each carbon dated shadow plaque (Extended Data Fig. 2, 3).
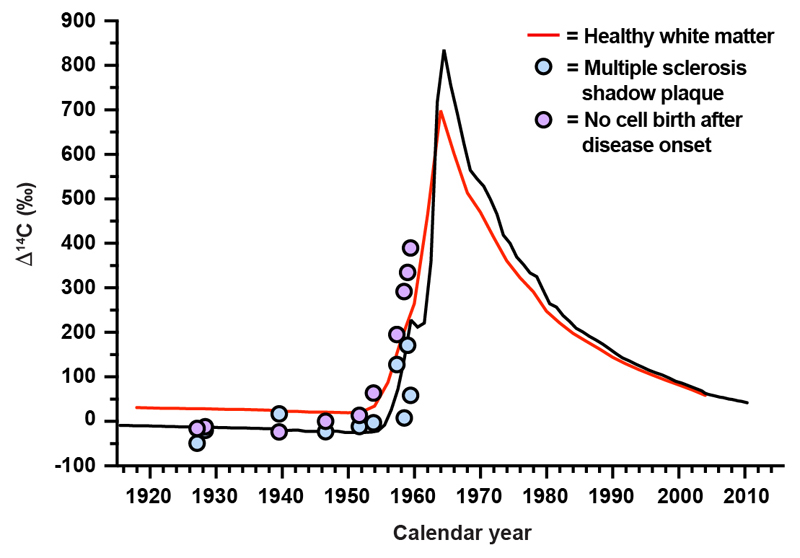
Figure 3. Reduced oligodendrocyte generation in shadow plaques.
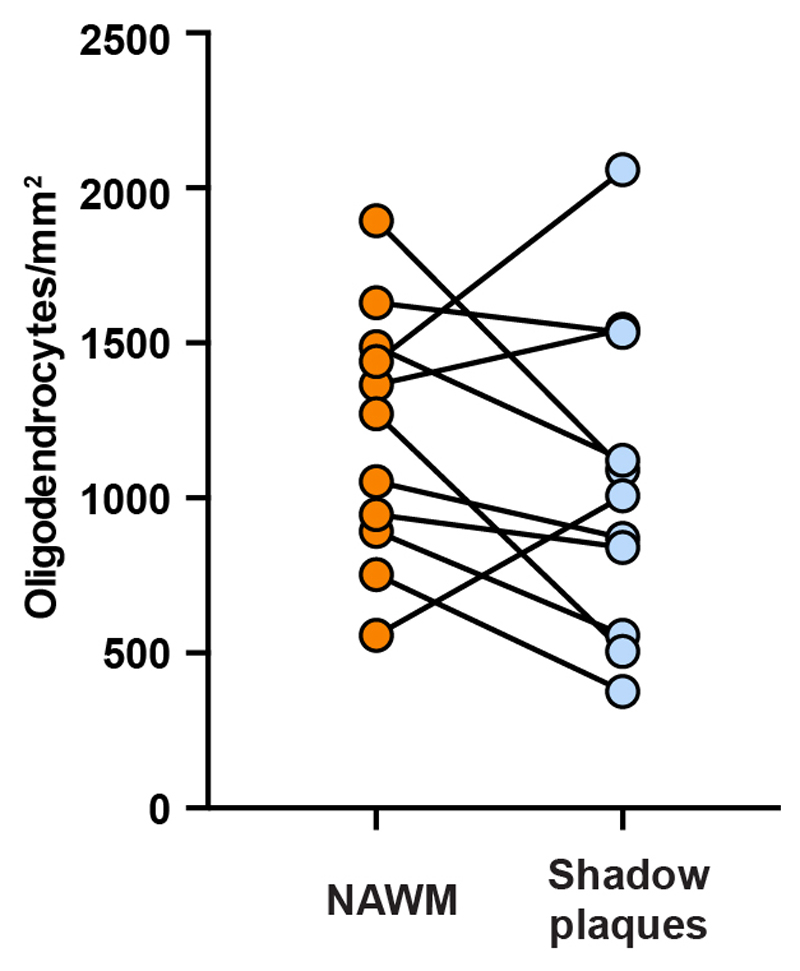
a, 14C concentration in genomic DNA of oligodendrocyte nuclei isolated from shadow plaques in multiple sclerosis patients. In patients born before the peak in the atmospheric concentration of 14C, most data points are lower than in oligodendrocyte genomic DNA from healthy subjects (red line), indicating reduced generation (mean ± 2 s.d., n = 11). b, Significantly lower 14C concentration in genomic DNA of oligodendrocytes in shadow plaques from multiple sclerosis patients born prior to the increase in atmospheric 14C compared to oligodendrocytes in healthy subjects (**, P=0.0047, two-tailed Mann-Whitney test). The 14C concentration in genomic DNA of mature oligodendrocytes in shadow plaques is similar to the modelled 14C concentration if there would have been no oligodendrocyte generation after the disease onset (ns, P = 0.31, two-tailed Mann-Whitney test) (n = 10, 6 and 6). c, The density of mature oligodendrocytes (SOX10+/NOGO-A+) is not significantly different between shadow plaques and adjacent normal appearing white matter (NAWM) (ns, P =0.26, paired two-tailed t-test, a hypothesis test of the difference between population means for a pair of random samples. (n = 11)). Mean ± s.d (long line ± short lines) (b, c). ns, not significant, ** P<0.01.
The 14C concentration in oligodendrocyte nuclei from shadow plaques in multiple sclerosis patients born before the onset of the nuclear bomb tests or during the rapid increase in atmospheric 14C concentration was lower compared to both white matter from healthy subjects (Fig. 3b, P=0.0047, Mann-Whitney test) and normal appearing white matter in multiple sclerosis patients (P=0.011, Mann-Whitney test) born during the same time period. If there had been an increase in the generation of oligodendrocytes in the shadow plaques during the disease period, which in all these patients overlapped with the period of very highly elevated atmospheric 14C levels compared to the time of birth of these individuals, they would have elevated 14C. In contrast, the 14C level, and thus oligodendrocyte generation, was reduced in shadow plaques.
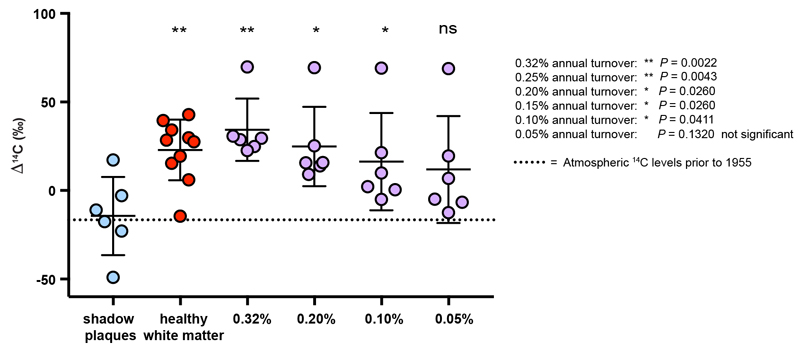
This demonstrated that the generation of new oligodendrocytes had been reduced during the disease period, and that the remaining oligodendrocytes were largely generated before the onset of the disease. We modeled how an absence of oligodendrocyte generation after disease onset would affect the 14C level (see Supplementary Data). This closely corresponded to the measured 14C levels in mature oligodendrocytes from the shadow plaques (P=0.31, Mann-Whitney test, Fig. 3b, Extended Data Fig. 4). We cannot exclude that there was some integration of new oligodendrocytes in the shadow plaques, at a level below the detection by carbon dating, but we can set a firm upper limit to the proportion of oligodendrocytes in the shadow plaques that could have been generated after the disease onset to maximally 3.1±1.6% (mean±s.d, Extended Data Fig. 5). Thus, integration of new oligodendrocytes was minimal in shadow plaques, which could mean that the shadow plaques represent either incompletely demyelinated lesions or that the lesions had been demyelinated and remyelinated by old oligodendrocytes.
The density of mature oligodendrocytes in the shadow plaques was similar to that in the adjacent normal appearing white matter (Fig. 3c, Extended Data Fig. 6, P=0.26, paired two-tailed t-test), corroborating previous studies, which have demonstrated an unaltered or reduced number of mature oligodendrocytes in shadow plaques in humans20,21. This is in contrast to animal models, where the density of mature oligodendrocytes is highly increased in remyelinated lesions, as an independent indication that there is de novo generation of oligodendrocytes in rodents22.
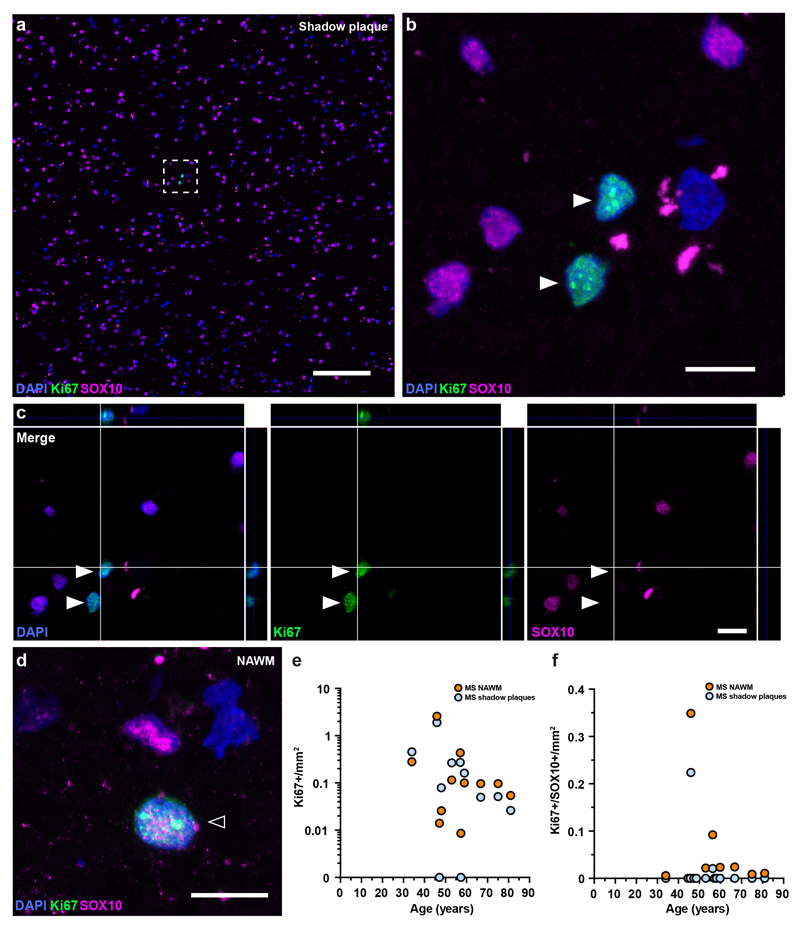
We next assessed cell proliferation by immunohistochemical detection of the proliferation marker Ki67 combined with the oligodendrocyte marker SOX10 in shadow plaques and adjacent normal appearing white matter present in the same tissue section (Extended Data Fig. 7). There was no statistically significant difference in the number of proliferating cells (Ki67+), when analyzing all cell types together, between the two tissue types (shadow plaques vs normal appearing white matter, average 0.016±0.024% and 0.018±0.034%, Ki67+ of all cells, P=0.83, paired Wilcoxon test, n=11, Supplementary Table 9). However, proliferating oligodendrocyte progenitor cells (Ki67+/SOX10+) were much less numerous and were found in 8/11 normal appearing white matter areas and in 2/11 shadow plaques in the same tissue sections (Extended Data Fig. 7e, f). There were significantly fewer proliferating oligodendrocyte progenitor cells in shadow plaques compared to normal appearing white matter (average 0.022±0.067/mm2 and 0.049±0.103/mm2, P=0.0078, paired Wilcoxon test, n=11, Supplementary Table 9). This reduced generation of oligodendrocyte lineage cells together with previous data suggesting inefficient integration of new oligodendrocytes in multiple sclerosis lesions23,24, is likely to contribute to the lack of new oligodendrocytes in shadow plaques.
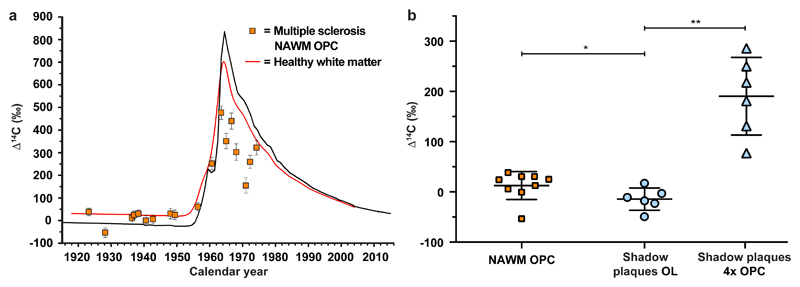
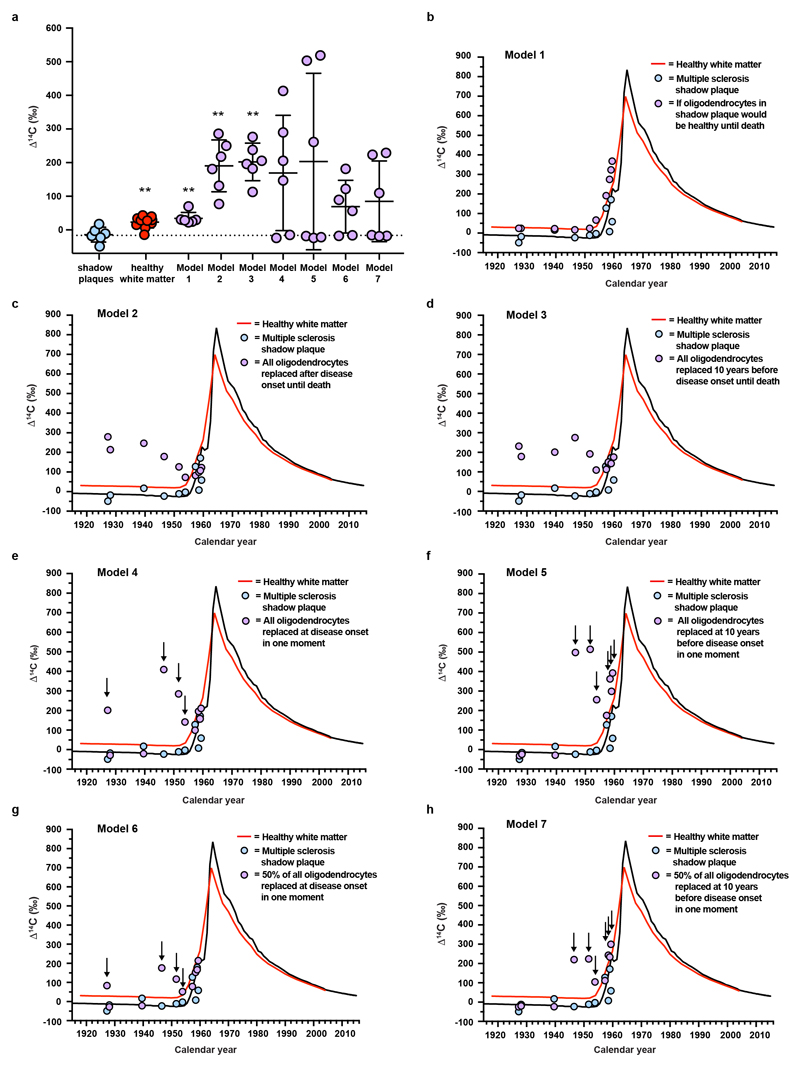
Oligodendrocyte progenitor cells can differentiate directly to oligodendrocytes without proliferation25, and it is important to consider whether old oligodendrocyte progenitor cells could give rise to mature oligodendrocytes without proliferation in shadow plaques in humans. This would give the impression of the oligodendrocytes being old by 14C analysis, although they would be newly generated. This scenario, however, can be ruled out for two reasons. First, carbon dating revealed that oligodendrocyte progenitor cells in normal appearing white matter of multiple sclerosis patients are younger than the oligodendrocytes in shadow plaques (P=0.036, Mann-Whitney test, Fig. 4a, b). Thus, even if oligodendrocyte progenitor cells directly differentiated to mature oligodendrocytes without any proliferation, the oligodendrocytes would appear significantly younger than what we found. Second, as oligodendrocyte progenitor cells are approximately 20-fold less numerous than mature oligodendrocytes in the white matter of the adult human brain5,26 (Supplementary Table 10), more than four cell divisions would be required for progenitor cells to reconstitute the observed density of mature oligodendrocytes. This would result in incorporation of 14C at the concentration present during the disease period. We modeled this scenario (see Supplementary Data), which even with very conservative estimates would be detected as significantly different by the carbon dating strategy (P=0.0022, Mann-Whitney test Fig. 4b, Extended Data Fig. 8, Supplementary Data and Supplementary Tables 11, 12), allowing us to exclude this possibility.
Figure 4. Non-mitotic differentiation cannot account for new oligodendrocytes in shadow plaques.
a, 14C concentration in oligodendrocyte progenitor cells (OPCs, SOX10+/CC1-) in normal appearing white matter (NAWM) (mean ± 2 s.d., n = 18) compared to mature oligodendrocytes in healthy subjects (red line). b, The 14C concentration in genomic DNA of OPCs in NAWM (n = 9) is significantly higher than in mature oligodendrocytes (OL) in shadow plaques (n = 6) (mean ± s.d.,*, P = 0.0360, two-tailed Mann-Whitney test), indicating that OPCs do not give rise to mature oligodendrocytes by direct differentiation, even without taking into account that they would need to divide several times to make up for the larger number of oligodendrocytes. In the scenario where there would be a subset of OPCs that had not divided after birth, and therefore had a very low 14C concentration in genomic DNA, modeling demonstrates that the 4 cell divisions required to reconstitute the number of oligodendrocytes would result in significantly higher 14C concentrations than measured (mean ± s.d., 4xOPC, **, P=0.0022, two-tailed Mann-Whitney test). *P < 0.05, **P < 0.01.
We report that oligodendrocyte generation is markedly increased in normal appearing white matter in some multiple sclerosis patients with very aggressive disease, but unaltered in most subjects, and that integration of new oligodendrocytes is undetectable in shadow plaques. This demonstrates both a substantial potential to increase oligodendrocyte generation in the human brain and a failure of this process in focal lesions. The lack of persisting oligodendrocytes generated during the disease period in shadow plaques does not exclude that new oligodendrocytes are generated, but if so, they are very few and/or fail to survive and integrate long term.
Our results point to substantial differences between rodents and humans in oligodendrocyte generation dynamics in demyelinated lesions. This may reflect principal differences in how myelination is modulated in rodents and humans under physiological conditions5–9. It is also possible that animal models of multiple sclerosis may not optimally reflect the human disease and the cellular responses to it27. It has been well documented that regeneration may be accomplished in diverse ways depending on the injury model. For example, pancreatic beta cells can in different situations be regenerated from progenitor cells, by beta cell duplication or by transdifferentiation28.
If shadow plaques represent remyelinated areas in humans, our results suggest that remyelination is not carried out by new cells, but by old spared oligodendrocytes. When myelin is cleared in multiple sclerosis lesions, mature oligodendrocytes remain at approximately intact numbers, albeit stripped off their myelin21. Autoantibodies against myelin-associated epitopes may result in the observed selective destruction of myelin sheaths, leaving the oligodendrocyte cell body intact21, suggesting that remyelination may take place as long as the oligodendrocyte is not lost29. This may, in part, explain the known benefit of early diagnosis and aggressive treatment of multiple sclerosis to avoid the development of permanent functional impairment30. Our results suggest that immediate and active therapeutic interventions that inhibit the destruction of oligodendrocytes may be critical to enable remyelination, remissions and functional recovery.
Methods
Ethical compliance
This study complied with all relevant ethical regulations regarding experiments involving human tissue samples. Ethical permission for this study were granted by the Regional Ethics Committee of Sweden (2010/313-31/3). Multiple sclerosis tissue samples were obtained from; The Netherlands Brain Bank, with ethical permission granted by the institutional review board of the Vrije University Medical Center of Amsterdam, Multiple Sclerosis Society Tissue Bank, UK with ethical permission granted by Regional Ethics Committee for UK (Research Ethics Committee for Wales) and Cleveland Clinic, Learner Research Institute, Cleveland, Ohio, US, with ethical permission granted by the Cleveland Clinic Institutional Review Board. In this study permission and informed consent were obtained from all the patient in order to use their biopsies.
Tissue collection
Brain postmortem tissue sample from multiple sclerosis patients (shadow plaques and normal appearing white matter) were obtained from The Netherlands Brain Bank (NBB), Netherlands Institute for Neuroscience, Amsterdam (open access: www.brainbank.nl). Characterization and identification of tissue samples were done by independent experienced neuropathologist following standard criteria31. All material has been collected from donors from whom a written consent for a brain autopsy and the use of the material and clinical information for research purposes had been obtained by the brain tissue banks and collaborators. MS tissue samples (shadow plaques and normal appearing white matter) and associated clinical and neuropathological data were also supplied by the Multiple Sclerosis Society Tissue Bank, funded by the Multiple Sclerosis Society of Great Britain and Northern Ireland, registered charity 207495. Additional MS tissue samples (normal appearing white matter) were received from Cleveland Clinic, Lerner Research Institute, Cleveland, Ohio, US with ethical permission granted by the Cleveland Clinic Institutional review board.
Nuclear isolation and flow cytometry
Snap frozen normal appearing white matter tissue samples from MS patients (pre-frontal and frontal regions, classified as described by32,33 were dissected and adjacent gray matter was removed carefully. Snap frozen MS tissue sample blocks with white matter shadow plaques (classified as described in33–35), were carefully dissected to include as little adjacent normal appearing white matter as possible, before the tissue sample blocks with MS shadow plaques were processed for nuclei isolation and flowcytometry. Part of the tissue blocks were sectioned in 12-20 μm thick sections for immunohistochemical analyses and 25-30μm thick sections for myelin staining. The normal appearing white matter tissue, the shadow plaque tissue and the adjacent normal appearing white matter were cut into smaller pieces and homogenized with a glass Douncer in lysis buffer as previously described5. The Triton X-100 in the lysis solution gently permeabilizes the nuclei and together with the freezing of the tissue after the collection this enables nuclear antigen detection using antibodies. The isolated cell nuclei were then incubated with primary antibodies against SOX10 (1:250, goat, R&D Systems) and APC/CC1 (1:250, mouse-anti APC, clone CC1, Millipore/Calbiochem) in nuclei storage buffer (0.43 M (15%) sucrose, 70 mM KCl, 2 mM MgCl2, 10 mM Tris-HCl (pH 7.2)) for 1 hour on ice. Species-specific Alexa 488- and Alexa 647 - conjugated secondary antibodies (1:1750, Molecular Probes, Invitrogen, Jackson ImmunoResearch Laboratories Inc) were added and incubated for 1 hour. Flow cytometry analyses and sorting were carried out using a BD Bioscience Influx flowcytometer, using the same gating strategy to separate single nuclei as previously described5,10.
Immunohistochemistry and tissue staining
Snap frozen 12-20 μm thick MS tissue sections were fixed in 2% PFA for 5-10 min (depending of the thickness of the section). For immunodetection of PLP, the tissue sections were delipidized in 95% ethanol for 5-10 min followed by antigen retrieval with citrate buffer (pH 6.0, Vectashield, 3300) in a steamer for 20 min. The sections were incubated in blocking solution (10% normal donkey serum with 0.15% Triton-X-100) for 1 hour in room temperature and then incubated at room temperature overnight in a humidified chamber with primary antibodies in 10% normal donkey serum. The following primary antibodies were used; SOX10 (goat, 1:500, R&D System), Nogo-A (rabbit, 1:500, Millipore, mAb 11C7, 1:10 000, a generous gift from M.E. Schwab, Brain Research Institute, ETH and University of Zürich), PLP (rat, 1:250, generous gift from B.D. Trapp, Lerner Research Institute, Cleveland Clinic), Ki67 (mouse, clone MIB-1, 1:300, DAKO), Iba1 (rabbit, 1:1000, WAKO, goat, 1:500, Abcam), CD68 (mouse, clone KP1, 1:400, Abcam) and TMEM-119 (rabbit, 1:250, Abcam). After thorough washing, antibody staining was visualized using species-specific fluorophore-conjugated secondary antibodies (1:500, Cy3, Alexa Fluor 405, 488, 647 from Jackson ImmunoResearch). Cell nuclei were counterstained with DAPI (4’,6-Diamidino-2-Phenylindole, Dihydrochloride, 1μg/ml, Sigma-Aldrich) or To-PRO-3 (1:1000, Invitrogen) by incubation for 2-5 min. Slides were mounted with ProLong Gold Antifade mounting medium (Molecular probes, Thermo Fisher Scientific). Eriochrome cyanine (EC) staining was used for myelin staining of MS shadow plaque tissue blocks. All the following steps were performed in room temperature. Snap frozen, 25-30μm thick sections were fixed in 2% PFA for 10 min with following PBS wash. The tissue slides were cleared in xylene for 10 min and followed by rehydration in graded ethanol solution (2x100%, 2x95%, 2x70%, 50% 2x H2O) for 2 min each. The slides were placed in eriochrome solution (2 ml of 10% FeCl3 and 40 ml of 0.2% EC (Sigma-Aldrich) in 0.5% aqueous H2SO4 and brought to a final volume of 50 ml with dH2O) for 10 min, then washed in water for 1 min and differentiated with 0.5% ammonium hydroxide (NH4OH) for 10 s. After rinsing in water for 1 min, the slides were dehydrated in graded ethanol solution (2x H2O, 50%, 2x70%, 2x95% 2x100%), cleared in xylene and coverslipped with mounting media. Images were acquired with Zeiss LSM880 confocal microscope with Zen2012 software or a Leica CTR6000 bright-field microscope, with LAS AF 3 software. Image processing and assembly were performed with Image J/Fiji software (version 1.47v for Mac, Java 1.6.0_65), Adobe Photoshop CS6 and Illustrator CS6 for Mac.
Quantification of oligodendrocyte cell numbers and ki67 cells
MS tissue samples with a shadow plaque (characterizes and classified as described33–35 and adjacent normal appearing white matter from 11 individuals were analyzed. Images of the whole MS tissue sample section were taken with a Zeiss LSM880 confocal microscope, using Zen2012 software and a 20x Plan-Apo objective. After the image of the whole tissue section was taken, the microscope software function; positioning was used to image the selected sampling area frames. The respective EC myelin stained image was also used as a guide to locate shadow plaque area/areas. Sampling area frames were randomly placed in the shadow plaque area/areas and regions of adjacent normal appearing white matter (NAWM) of the same section. The numbers of DAPI+ (cell nuclei marker), SOX10+ (oligodendrocyte lineage) and NOGO-A+ (mature oligodendrocytes) were counted in a sampling area frame of 0.18mm2 (0.4251x0.4251 mm). A minimum of 12 frames per region (shadow plaque region and NAWM region) per section and individual were imaged and counted. Total counted cells per region were 2100-7400 cells. Image processing and analysis/quantification were performed using ImageJ/Fiji software (version 1.47v for Mac, Java 1.6.0_65) with customized macros for the numbers, area and fluorescence intensity36,37. In brief, in each sampling area frame (0.18mm2), DAPI staining was first used to count the total number of nuclei. DAPI staining of very small cell nuclei (area pixels less than 10 or 14) were excluded due to for example half of a cell captured in the image or cell debris. The digital counting of DAPI+ cells was validated by manual counting in 2-3 frames in all individuals. The same area region of interest from DAPI+ cells were then used to analyze if the cells were positive for SOX10 staining and NOGO-A staining. This resulted in a DAPI+ cell with an intensity of SOX10 staining and an intensity of NOGO-A staining. The baseline intensities for non-oligodendrocytes, DAPI+ only, for each individual were analyzed when each cell’s intensities for NOGO-A and SOX10 were plotted together (x-and y-axis respectively, see also below for further analysis) and also by manual visual comparison of the same sampling frame. The digital counting of SOX10 and NOGO-A staining was also compared and confirmed by manual counting of the number of cells (of SOX10 and NOGO-A staining) in the same sampling frame. Two-three frames per region per individual were manually checked. The same numbers of counting frames from shadow plaque and NAWM regions per individual were analyzed. Two separate investigators analyzed the same set of images of shadow plaque region and NAWM region from the 11 individuals and the cell numbers/mm2 (cell densities) were presented as an average cell density per region per individual (see Fig. 3C and Extended Data Fig. 4).
To assess the numbers of cells with SOX10 and NOGO-A staining, a two-dimensional (2D) histogram of DAPI+ cells were generated with respect to SOX10 and NOGO-A stainings (intensities). 2D regression was used to fit DAPI+ cells only (SOX10-/NOGO-A-) and mature oligodendrocytes (SOX10+/NOGO-A+) using the following function:
where e is the baseline, d is the amplitude (of the Gaussian cell distribution), x0 is the center of the distribution on the x-axis, y0 is the center of the distribution on the y-axis and a, b, c are the contributions of the various terms in the exponent. a, b, c depend on the standard deviations, σx and σy, in the respective x- and y-direction, and an arbitrary rotation angle, θ:
All parameters (amplitude, baseline, 2D center position, 2D standard deviation, and rotation angle) were fitted using least-squares optimization for shadow plaque and NAWM samples (i.e. to fit the distribution as close as possible to the experimental data). Two standard deviations were used to quantify the cell numbers of DAPI+ cell only (SOX10-/NOGO-A-) and mature oligodendrocyte (SOX10+/NOGO-A+) distributions.
For quantification of proliferating cells (Ki67+), images of the whole MS tissue sample section with shadow plaque and adjacent normal appearing white matter region were taken with a Leica TCS SP8X confocal microscope, using LAS AF software and a 20x Plan-Apo objective. The number of Ki67+ cells and overlap with DAPI (cell nuclei marker) and SOX10 (oligodendrocyte lineage) labelling were manually counted in the whole section (n = 11 MS samples and patients) using ImageJ/Fiji software. For total cell number quantification in the shadow plaque area and adjacent normal appearing white matter, Imaris-based automated quantification was used. Images of the whole MS tissue section where visualized in Imaris software 7.6, where the total cell nuclei number using DAPI nuclei stain were quantified by the spot finding algorithm using the same nuclei mask size parameter across all samples with manual adjustment for fluorescence intensity threshold and quality. Minimum total counted cells per region per MS patient were 20 908 cells.
DNA extraction
DNA extraction from sorted nuclei was performed as previously5. The extracted DNA was quantified with a Nanodrop 2000 (ThermoScientific) and samples only within a defined range (260/280: 1.8-2.0; 260/230: 2.0-2.4) were included for 14C analysis.
Accelerator mass spectrometry
All sample analyses performed by the accelerator mass spectrometer were sample identity blinded and carried out as previously described5.
FACS purity correction of 14C values
The FACS-sorted samples of oligodendrocyte nuclei contained a small fraction of non-oligodendrocyte nuclei (see Supplementary Table 1 for FACS purity). This impurity was accounted for by correcting the 14C-values so they could accurately reflect the oligodendrocytes and was done as previously described5. For those cases we did not obtain Δ14C values for the non-oligodendrocyte nuclei fraction the measured Δ14C values were instead presented.
Statistical Analysis and Mathematical Modelling
Paired, t-test was used to determine significant difference of cell numbers in tissue biopsies with normal appearing white matter and shadow plaques from multiple sclerosis patients. D’Agostino and Pearson normality test (PRISM 7) were used to test the normality of the data. Non-parametric Mann-Whitney test was used to assess statistically significance difference between the measured carbon levels and individual turnover rates. Non-parametric Spearman correlation was used to correlate individual turnover rate with age at onset or disease duration in Fig. 2. Paired non-parametric Wilcoxon test was used to determine significant difference of proliferating cells (Ki67) and proliferating OPCs (Ki67+/SOX10+) in shadow plaques and adjacent normal appearing white matter present in the same tissue section. All tests were two-tailed and P values <0.05 were considered to be significant. All statistical analysis was performed in PRISM 7. Mean ± s.d. is shown in all graph unless indicated. Mathematical modelling was used in order to find the best turnover scenario that fit the measured 14C data, and to explore and rule out theoretical scenarios of turnover. Mathematical modelling was performed in MATLAB R2016a. Details of the mathematical modelling are included in the Supplementary Data.
Data availability
Source data for Figs 1d, 2, 3, 4 and Extended Data Figs 4,5,6, 7e,f, 8 have been provided. All other data supporting the findings of this study are available from the corresponding authors upon reasonable request.
Extended Data
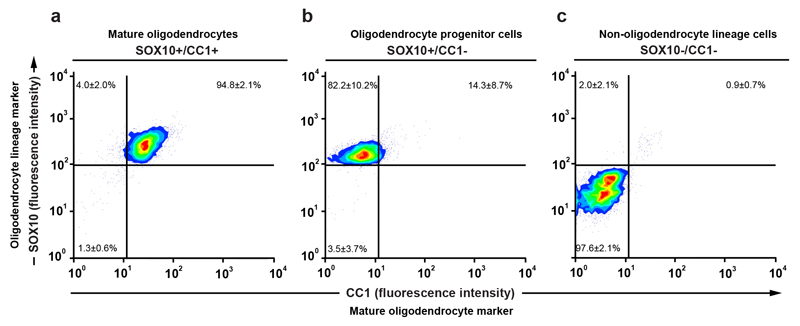
Extended Data Figure 1. Flow cytometry reanalysis of isolated cell nuclei from multiple sclerosis patients.
a, b, c, Reanalysis of flow cytometry isolated mature oligodendrocytes, oligodendrocyte progenitor cells and non-oligodendrocyte lineage cells show 94.8 ± 2.1%, 82.2 ± 10.2% and 97.6± 2.1% purity respectively (n = 29, n = 24 and n = 28) and the respective contamination of oligodendrocyte progenitor cells (upper left quadrant), non-oligodendrocyte linage cells (lower left quadrant) and mature oligodendrocyte (upper right quadrant) in the isolated population. Value inside the quadrants represent average percentage from all isolated normal appearing white matter of multiple sclerosis patients (mean ± s.d.). The small fraction of contamination of other than the isolated population acquired during flow cytometry isolation was accounted by correcting the 14C values to accurately reflect the isolated cell population. See also Method section and Supplementary Table 1.
Extended Data Figure 2. Visualization of myelin in shadow plaques.
a, Overview of a carbon dated multiple sclerosis tissue block reveals a shadow plaque and normal appearing white matter (NAWM) by eriochrome cyanine staining (n = 11). The shadow plaque is outlined by a dashed line. b-d, Higher magnification views of areas indicated by boxes in a show reduced myelin (PLP) in all areas compared to NAWM. The images show patient case MS10. See also Supplementary Table 1. Scale bar in a, 2mm; b-d; 20μm.
Extended Data Figure 3. Reduced myelin in carbon dated multiple sclerosis shadow plaques.
Reduced myelin staining (PLP) was observed in all shadow plaque areas (boarder and center of shadow plaque) compared to NAWM. NAWM and shadow plaque images from each patient were taken from the same sample tissue block (n = 11). See also Supplementary Table 1. Scale bar 20μm.
Extended Data Figure 4. Modeled 14C concentration in DNA of oligodendrocytes generated until disease onset.
The modeled 14C concentration, for each patient born before the nuclear bomb tests with dated mature oligodendrocytes from a shadow plaque, if there would have been normal oligodendrocyte generation dynamics until the time of disease onset and no further generation thereafter. The measured data from each patient is shown as a blue circle and the modeled data for each patient in purple (n = 11). The red line depicts genomic DNA 14C concentrations in oligodendrocytes from healthy subjects.
Extended Data Figure 5. Modelling of the highest possible turnover during the disease period that could occur undetected with carbon dating.
Different annual turnover rates during the disease period were modelled in order to find the highest possible turnover rate that could occur undetected. It was assumed that there was a healthy turnover before disease onset. If a comparison between the measured 14C and the modelled values is significant, we would be able to detect that turnover rate. The lowest turnover rate with significant difference tested was 0.1% annual turnover (P=0.041, two-tailed Mann-Whitney test, n=6). At 0.05% annual turnover, there was no longer a significant difference (P=0.132, two-tailed Mann-Whitney test, n=6). Data are mean (long line), ± s.d (short lines).
Extended Data Figure 6. Oligodendrocyte density in shadow plaques.
Pair-wise comparison of the density of SOX10+/NOGO-A+ mature oligodendrocytes in histological sections of shadow plaques and adjacent normal appearing white matter in the same patients (n = 11 biopsies from 11 patients).
Extended Data Figure 7. Cell proliferation in multiple sclerosis.
a-d, Proliferating cells (Ki67+, arrow heads, a-c) are sparse and proliferating oligodendrocyte progenitor cells are very rare (Ki67+/SOX10+, hollow arrow head, d) in histological sections of shadow plaques (a-c) and adjacent normal appearing white matter (NAWM) (d) from multiple sclerosis patients (n = 11). The box in a indicates the area shown in higher magnification (b) and orthogonal view (c). Scale bar in a, 100μm; b-d; 10μm. e, f Quantification of Ki67+ cells (e) and Ki67+/SOX10+ cells (f) in shadow plaque and adjacent normal appearing white matter in multiple sclerosis patients (n = 11).
Extended Data Figure 8. Modeled 14C concentration in DNA of oligodendrocytes generated from oligodendrocyte progenitor cells in shadow plaques.
a, Measured and modelled data. The level of atmospheric 14C prior to 1955 are indicated by the dotted line. Mean (long line) ± s.d (short lines). Statistical analyses represent comparison between shadow plaque data (n=6) and the other groups. b-h Measured and modelled data plotted in relation to time and atmospheric 14C concentration.
Model 1: Estimated 14C concentration in mature oligodendrocytes (OLs) in shadow plaques if assumed to have healthy turnover rate until death of the patients, is similar to healthy white matter OLs and is significantly higher compared to measured mature OLs in shadow plaques (**, P=0.002, two-tailed Mann-Whitney test, **, P=0.0047, two-tailed Mann-Whitney test, n = 6 and 6). Model 2 and 3: To reconstitute the observed mature OL density with newly made OLs, it would require oligodendrocyte progenitor cells (OPCs) to divide at least 4 times. If this would occur over the time from onset of the disease (model 2) or even from 10 years before the first clinical symptoms (model 3) until death of the patient, it results in significantly higher modeled 14C concentrations in mature OL in shadow plaques than measured (model 2, **, P=0.002, two-tailed Mann-Whitney test, n = 6, model 3, **, P=0.002, two-tailed Mann-Whitney test, n = 6). Model 4 and 5: Even with more conservative scenarios assuming all replacement happening not throughout the disease course, but early by proliferation of OPCs at disease onset or before, still results in higher 14C concentrations in some patients. Model 6, 7: Modeled data as above, but with 50% of OLs being newly made from OPCs and 50% being old OLs. For some patients, the time of disease onset and 10 years before onset occur before the rise of the 14C atmospheric levels (1955). For these patients, any cell replacement by proliferation of old OPC during this period would results in values similar to atmospherical levels. Arrows points to patients with time periods prior to and disease onsets which overlap with very highly elevated atmospheric 14C levels compared to respective levels at time of birth of the patients, and that the modeled values deviate from the measured rules out these scenarios. The red line depicts genomic DNA 14C concentrations in oligodendrocytes from healthy subjects. Healthy white matter (a) **, P=0.0047, two-tailed Mann-Whitney test, (n=10). **, P<0.01. See also Supplementary Table 1, 11 and 12.
Supplementary Material
Supplementary Information is available in the online version of the paper.
Acknowledgements
We thank Sarantis Giatrellis and Marcelo Toro for flow cytometry and Karl Håkansson and Peter Senneryd for AMS sample preparation. This study was supported by the Swedish Research Council, the Swedish Cancer Foundation, Tobias Stiftelsen, SSF, Knut och Alice Wallenbergs Stiftelse, the ERC and Torsten Söderberg Foundation. Tissue samples and associated clinical and neuropathological data were supplied by the Multiple Sclerosis Society Tissue Bank, funded by the Multiple Sclerosis Society of Great Britain and Northern Ireland, registered charity 207495. We also thank Bruce D. Trapp and Ranjan Dutta, Lerner Research Institute, Cleveland Clinic, Cleveland, USA and the Netherlands Brain Bank, Netherlands Institute for Neuroscience, Amsterdam, for providing tissue.
Footnotes
Author Contributions
M.S.Y. and M.D. performed the experiments. M.S.Y and E.S. performed statistical analysis. E.S. and S.B. performed mathematical modeling. M.S., and G.P performed 14C measurements. M.S.Y and J.F designed the study and experiments. M.S.Y., J.F., and L.B. designed data analysis. E.S., S.B., M.S.Y. and J.F. designed mathematical analysis. J.F. supervised the study. M.S.Y., E.S., and J.F. prepared figures and wrote the manuscript.
Author Information
Reprints and permission information is available at www.nature.com/reprints.
Readers are welcome to comment on the online version of the paper.
The authors declare no competing financial interests.
References
- 1.Nave KA, Werner HB. Myelination of the nervous system: mechanisms and functions. Annu Rev Cell Dev Biol. 2014;30:503–533. doi: 10.1146/annurev-cellbio-100913-013101. [DOI] [PubMed] [Google Scholar]
- 2.Crawford AH, et al. Pre-Existing Mature Oligodendrocytes Do Not Contribute to Remyelination following Toxin-Induced Spinal Cord Demyelination. Am J Pathol. 2016 doi: 10.1016/j.ajpath.2015.11.005. [DOI] [PMC free article] [PubMed] [Google Scholar]
- 3.Tripathi RB, Rivers LE, Young KM, Jamen F, Richardson WD. NG2 glia generate new oligodendrocytes but few astrocytes in a murine experimental autoimmune encephalomyelitis model of demyelinating disease. J Neurosci. 2010;30:16383–16390. doi: 10.1523/JNEUROSCI.3411-10.2010. [DOI] [PMC free article] [PubMed] [Google Scholar]
- 4.Zawadzka M, et al. CNS-resident glial progenitor/stem cells produce Schwann cells as well as oligodendrocytes during repair of CNS demyelination. Cell Stem Cell. 2010;6:578–590. doi: 10.1016/j.stem.2010.04.002. [DOI] [PMC free article] [PubMed] [Google Scholar]
- 5.Yeung MS, et al. Dynamics of oligodendrocyte generation and myelination in the human brain. Cell. 2014;159:766–774. doi: 10.1016/j.cell.2014.10.011. [DOI] [PubMed] [Google Scholar]
- 6.McKenzie IA, et al. Motor skill learning requires active central myelination. Science. 2014;346:318–322. doi: 10.1126/science.1254960. [DOI] [PMC free article] [PubMed] [Google Scholar]
- 7.Gibson EM, et al. Neuronal activity promotes oligodendrogenesis and adaptive myelination in the mammalian brain. Science. 2014;344 doi: 10.1126/science.1252304. 1252304. [DOI] [PMC free article] [PubMed] [Google Scholar]
- 8.Sampaio-Baptista C, Johansen-Berg H. White Matter Plasticity in the Adult Brain. Neuron. 2017;96:1239–1251. doi: 10.1016/j.neuron.2017.11.026. [DOI] [PMC free article] [PubMed] [Google Scholar]
- 9.Frisén J. Neurogenesis and Gliogenesis in Nervous System Plasticity and Repair. Annu Rev Cell Dev Biol. 2016;32:127–141. doi: 10.1146/annurev-cellbio-111315-124953. [DOI] [PubMed] [Google Scholar]
- 10.Spalding K, Bhardwaj RD, Buchholz B, Druid H, Frisén J. Retrospective birth dating of cells in humans. Cell. 2005;122:133–143. doi: 10.1016/j.cell.2005.04.028. [DOI] [PubMed] [Google Scholar]
- 11.Levin I, et al. Observations and modelling of the global distribution and long-term trend of atmospheric 14CO2. Tellus. 2010;62:26–46. [Google Scholar]
- 12.Bergmann O, et al. Evidence for cardiomyocyte renewal in humans. Science. 2009;324:98–102. doi: 10.1126/science.1164680. [DOI] [PMC free article] [PubMed] [Google Scholar]
- 13.Spalding KL, et al. Dynamics of hippocampal neurogenesis in adult humans. Cell. 2013;153:1219–1227. doi: 10.1016/j.cell.2013.05.002. [DOI] [PMC free article] [PubMed] [Google Scholar]
- 14.Ernst A, et al. Neurogenesis in the striatum of the adult human brain. Cell. 2014;156:1072–1083. doi: 10.1016/j.cell.2014.01.044. [DOI] [PubMed] [Google Scholar]
- 15.Salehpour M, Håkansson K, Possnert G. Small sample Accelerator Mass Spectrometry for biomedical applications. Nuclear Instruments and Methods in Physics Research Section B: Beam Interactions with Materials and Atoms. 2015;361:43–47. doi: 10.1016/j.nimb.2015.04.047. [DOI] [Google Scholar]
- 16.Beer A, et al. Tissue damage within normal appearing white matter in early multiple sclerosis: assessment by the ratio of T1- and T2-weighted MR image intensity. Journal of neurology. 2016;263:1495–1502. doi: 10.1007/s00415-016-8156-6. [DOI] [PubMed] [Google Scholar]
- 17.Sim FJ, Zhao C, Penderis J, Franklin RJ. The age-related decrease in CNS remyelination efficiency is attributable to an impairment of both oligodendrocyte progenitor recruitment and differentiation. J Neurosci. 2002;22:2451–2459. doi: 10.1523/JNEUROSCI.22-07-02451.2002. doi:20026217. [DOI] [PMC free article] [PubMed] [Google Scholar]
- 18.Shields SA, Gilson JM, Blakemore WF, Franklin RJ. Remyelination occurs as extensively but more slowly in old rats compared to young rats following gliotoxin-induced CNS demyelination. Glia. 1999;28:77–83. doi: 10.1002/(sici)1098-1136(199910)28:1<77::aid-glia9>3.0.co;2-f. [DOI] [PubMed] [Google Scholar]
- 19.Franklin RJM, Ffrench-Constant C. Regenerating CNS myelin - from mechanisms to experimental medicines. Nat Rev Neurosci. 2017;18:753–769. doi: 10.1038/nrn.2017.136. [DOI] [PubMed] [Google Scholar]
- 20.Lucchinetti C, et al. A quantitative analysis of oligodendrocytes in multiple sclerosis lesions. A study of 113 cases. Brain. 1999;122(Pt 12):2279–2295. doi: 10.1093/brain/122.12.2279. [DOI] [PubMed] [Google Scholar]
- 21.Romanelli E, et al. Myelinosome formation represents an early stage of oligodendrocyte damage in multiple sclerosis and its animal model. Nat Commun. 2016;7 doi: 10.1038/ncomms13275. 13275. [DOI] [PMC free article] [PubMed] [Google Scholar]
- 22.Blakemore WF, Keirstead HS. The origin of remyelinating cells in the central nervous system. J Neuroimmunol. 1999;98:69–76. doi: 10.1016/s0165-5728(99)00083-1. [DOI] [PubMed] [Google Scholar]
- 23.Kuhlmann T, et al. Differentiation block of oligodendroglial progenitor cells as a cause for remyelination failure in chronic multiple sclerosis. Brain. 2008;131:1749–1758. doi: 10.1093/brain/awn096. [DOI] [PubMed] [Google Scholar]
- 24.Chang A, Tourtellotte WW, Rudick R, Trapp BD. Premyelinating oligodendrocytes in chronic lesions of multiple sclerosis. N Engl J Med. 2002;346:165–173. doi: 10.1056/NEJMoa010994. [DOI] [PubMed] [Google Scholar]
- 25.Hughes EG, Kang SH, Fukaya M, Bergles DE. Oligodendrocyte progenitors balance growth with self-repulsion to achieve homeostasis in the adult brain. Nat Neurosci. 2013;16:668–676. doi: 10.1038/nn.3390. [DOI] [PMC free article] [PubMed] [Google Scholar]
- 26.Nunes MC, et al. Identification and isolation of multipotential neural progenitor cells from the subcortical white matter of the adult human brain. Nature Medicine. 2003;9:439. doi: 10.1038/nm837. [DOI] [PubMed] [Google Scholar]
- 27.Ransohoff RM. Animal models of multiple sclerosis: the good, the bad and the bottom line. Nat Neurosci. 2012;15:1074–1077. doi: 10.1038/nn.3168. [DOI] [PMC free article] [PubMed] [Google Scholar]
- 28.Benthuysen JR, Carrano AC, Sander M. Advances in beta cell replacement and regeneration strategies for treating diabetes. The Journal of clinical investigation. 2016;126:3651–3660. doi: 10.1172/JCI87439. [DOI] [PMC free article] [PubMed] [Google Scholar]
- 29.Cui QL, et al. Sublethal oligodendrocyte injury: A reversible condition in multiple sclerosis? Ann Neurol. 2017;81:811–824. doi: 10.1002/ana.24944. [DOI] [PubMed] [Google Scholar]
- 30.Giovannoni G, et al. Brain health: time matters in multiple sclerosis. Multiple sclerosis and related disorders. 2016;9(Suppl 1):S5–S48. doi: 10.1016/j.msard.2016.07.003. [DOI] [PubMed] [Google Scholar]
- 31.Popescu BFG, Lucchinetti CF. Pathology of Demyelinating Diseases. Annual Review of Pathology: Mechanisms of Disease. 2012;7:185–217. doi: 10.1146/annurev-pathol-011811-132443. [DOI] [PubMed] [Google Scholar]
- 32.Trapp BD, et al. Axonal Transection in the Lesions of Multiple Sclerosis. New England Journal of Medicine. 1998;338:278–285. doi: 10.1056/NEJM199801293380502. [DOI] [PubMed] [Google Scholar]
- 33.Li H, Cuzner ML, Newcombe J. Microglia-derived macrophages in early multiple sclerosis plaques. Neuropathology and Applied Neurobiology. 1996;22:207–215. doi: 10.1111/j.1365-2990.1996.tb00896.x. [DOI] [PubMed] [Google Scholar]
- 34.Van Der Valk P, De Groot CJA. Staging of multiple sclerosis (MS) lesions: pathology of the time frame of MS. Neuropathology and Applied Neurobiology. 2000;26:2–10. doi: 10.1046/j.1365-2990.2000.00217.x. [DOI] [PubMed] [Google Scholar]
- 35.Bö L, Geurts JJG, Mörk SJ, van der Valk P. Grey matter pathology in multiple sclerosis. Acta Neurologica Scandinavica. 2006;113:48–50. doi: 10.1111/j.1600-0404.2006.00615.x. [DOI] [PubMed] [Google Scholar]
- 36.Cai Z, et al. Optimized digital counting colonies of clonogenic assays using ImageJ software and customized macros: Comparison with manual counting. International Journal of Radiation Biology. 2011;87:1135–1146. doi: 10.3109/09553002.2011.622033. [DOI] [PubMed] [Google Scholar]
- 37.Choudhry P. High-Throughput Method for Automated Colony and Cell Counting by Digital Image Analysis Based on Edge Detection. PLOS ONE. 2016;11:e0148469. doi: 10.1371/journal.pone.0148469. [DOI] [PMC free article] [PubMed] [Google Scholar]
Associated Data
This section collects any data citations, data availability statements, or supplementary materials included in this article.
Supplementary Materials
Data Availability Statement
Source data for Figs 1d, 2, 3, 4 and Extended Data Figs 4,5,6, 7e,f, 8 have been provided. All other data supporting the findings of this study are available from the corresponding authors upon reasonable request.


