Abstract
Yemen is currently experiencing the largest cholera epidemic in recent history. The first cases were declared in September 2016, and over 1.1 million cases and 2,300 deaths have since been reported1. We investigated the phylogenetic relationships, pathogenesis, and antimicrobial resistance determinants by sequencing the genomes of Vibrio cholerae isolates from the Yemen epidemic and recent isolates from neighbouring regions. These 116 genomic sequences were placed within the phylogenetic context of a global collection of 1087 seventh pandemic V. cholerae serogroup O1 and O139 biotype El Tor isolates [2–4]. We show that the Yemeni isolates collected during the two epidemiological waves of the epidemic [1], —the first between September 28th 2016 and April 23rd 2017 (25,839 suspected cases) and the second beginning on April 24th, 2017 (more than one million suspected cases), — are seventh pandemic V. cholerae O1 El Tor (7PET) serotype Ogawa isolates from a single sublineage. Using genomic approaches, we link the Yemen epidemic to global radiations of pandemic V. cholerae and show that this sublineage originated from South Asia and that it caused outbreaks in East Africa before appearing in Yemen. We also show that the Yemeni isolates are susceptible to several antibiotics commonly used to treat cholera, and to polymyxins, resistance to which is used as a marker of the El Tor biotype.
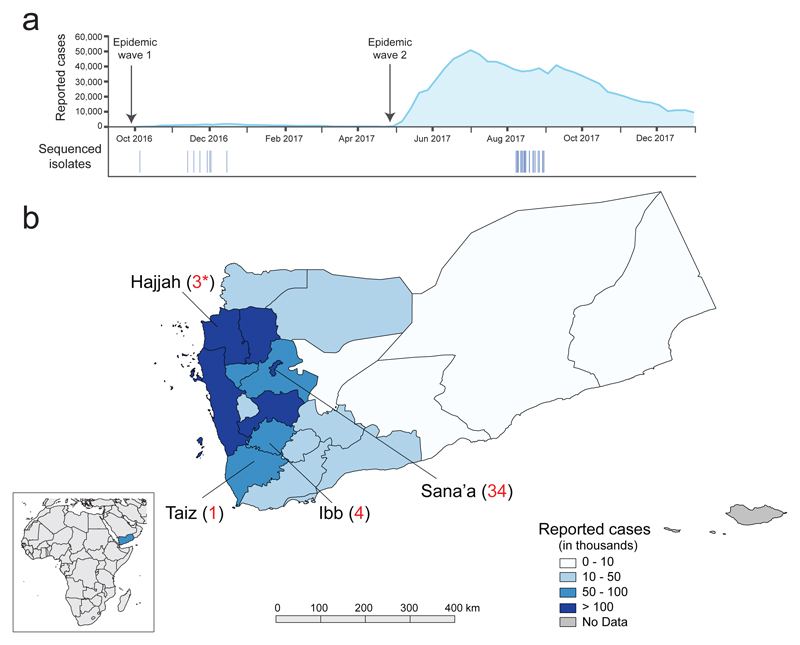
We investigated the bacterial populations causing the Yemeni cholera epidemic, by sequencing 42 V. cholerae O1 serotype Ogawa isolates recovered during this epidemic. Thirty-nine of these isolates were collected from cholera patients living in three different governorates of Yemen (Fig. 1a, b). They span both waves of the epidemic, having been collected between October 5th, 2016 and August 31st, 2017. The three remaining isolates were collected from patients from a temporary refugee centre on the Saudi Arabia-Yemen border on August 30th, 2017 (Fig. 1b). We also sequenced 74 7PET isolates from South Asia, the Middle East, Eastern and Central Africa (Extended Data Fig. 1 and Supplementary Table 1). We placed these new isolates in the context of a global collection of 1087 7PET genomic sequences [2–4] (Supplementary Table 1) and constructed a maximum likelihood phylogeny of 1,203 genomes, using 9,986 single-nucleotide variants (SNVs) evenly distributed over the non-repetitive, non-recombinant core genome (Fig. 2a).
Figure 1.
Geographic location of the sequenced V. cholerae O1 El Tor isolates and number of reported cholera cases. a, Aggregate number of suspected cholera cases per week in Yemen until December 31st, 2017 (http://yemeneoc.org/bi/), showing the two epidemic waves. The dates of the isolates sequenced in this study are shown under the epidemic curve. b, Geographic location of the 42 V. cholerae O1 El Tor isolates from Yemen. The three isolates collected in Saudi Arabia (denoted by asterisks) were obtained from Yemeni refugees from Hajjah District and are considered to be ‘Yemeni isolates’ throughout the manuscript. The number of cases per governorate is indicated according to reference 1. The governate map of Yemen was created using QGIS v2.16 (https://qgis.org) and the shape file approved for use by the UN Office for the Coordination of Humanitarian Affairs (OCHA) OCHA Yemen country office (https://data.humdata.org/dataset/yemen-admin-boundaries). The small inlay map was created using QGIS v2.16 using the Natural Earth basemap v4.0.0 (https://www.naturalearthdata.com).
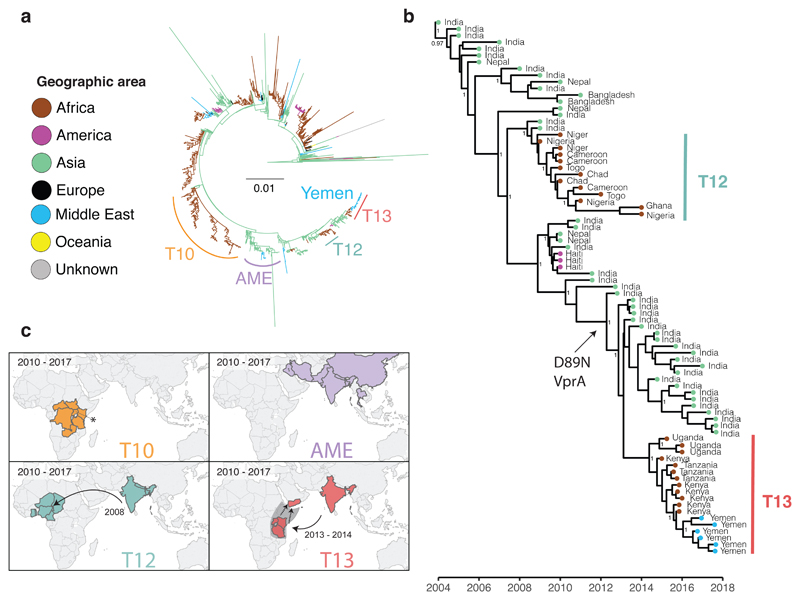
Figure 2.
Phylogenetic relatedness of the V. cholerae O1 El Tor isolates from the 2016-2017 epidemic in Yemen. a, Maximum likelihood phylogeny of 1,203 genomic sequences. M66 was used as an outgroup. The scale bar denotes substitutions per variable site (SNVs). Branches are coloured according to geographic location, inferred by stochastic mapping of the geographic origin of each isolate onto the tree. The inferred introduction events into Africa are indicated by the letter ‘T’. The sublineage labelled AME (Asia/Middle East) contains the most recent Middle Eastern isolates. b, Maximum clade credibility tree produced with BEAST for a subset of 81 representative isolates of the distal part of genomic wave 3 (i.e., those with the ctxB7 allele). Geographic location of the isolates is indicated in the same colours as in panel a. Selected nodes supported by posterior probability values ≥ 0.8 are shown. Acquisition of the polymyxin susceptibility-associated non-synonymous SNV in VC_1320 (vprA) is indicated. c. The geographic distribution of selected 7PET sublineages. An asterisk denotes data from reference 4. The date ranges shown for introductions are the 95% CI estimate of the MRCA in years. Dashed lines and the grey area in T13 indicate that the lineage was detected in East Africa before its appearance in the Yemen. This does not represent a precise route of transmission. The maps were created with Tableau Desktop version 10.1.5 using the basemap from ©OpenStreetMap contributors (www.openstreetmap.org), available under the Open Database License.
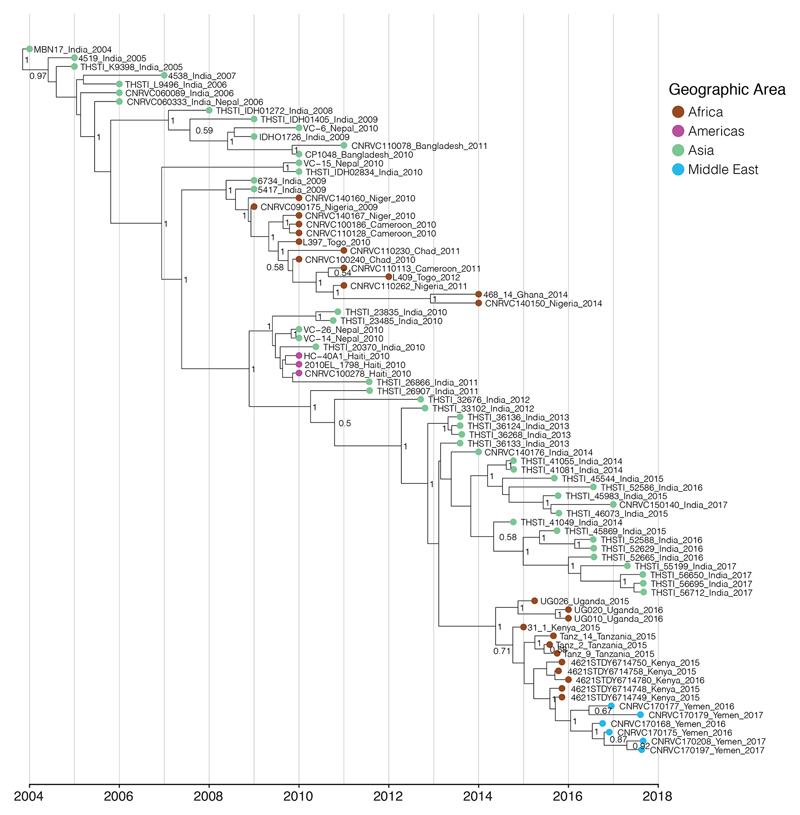
We also detected a strong temporal signal, making it possible to estimate time-scaled phylogenies (Fig. 2b and Extended Data Figs. 2-4), which showed the Yemeni epidemic to have originated from a recently emerged 7PET wave 3 clade [5] harbouring the cholera toxin subunit B gene variant ctxB7 (Fig. 2). All the Yemeni isolates clustered together (median pairwise SNV difference of 3 [range of 0-13]) confirming that the two epidemiological waves observed during Yemeni epidemic, which had very different clinical attack rates [1], were produced by a single clone rather than arising from two separate introductions. We estimated the date of the most recent common ancestor (MRCA) of the Yemeni isolates at January 2016 (95% Bayesian credible interval [CI] September 2015 to June 2016) (Fig. 2b, Extended Data Fig. 3, Extended Data Table 1). Our phylogenetic analysis shows that the Yemeni isolates are different from those circulating in the Middle East over the last decade, such as those isolated in Iraq in 2007 and 2015, and in Iran from 2012 to 2015 (Fig. 2a). These Middle Eastern isolates also belong to 7PET wave 3, but are attributed to different sublineages on the phylogenetic tree, and were imported from South Asia on two separate occasions. The Yemeni isolates are most closely related to isolates collected from outbreaks in Eastern Africa (Kenya, Tanzania [3] and Uganda [4]) from 2015 to 2016 (Fig. 2). Collectively, these isolates belong to a new sublineage, T13, corresponding to the most recent, newly identified introduction of 7PET into East Africa. All these T13 isolates are different from those previously recovered in West or East Africa (sublineages T12 and T10, respectively) (Fig. 2). Our data suggest that the 7PET wave 3 clade containing all isolates with the ctxB7 allele, first emerged in South Asia in the early 2000s (Fig. 2b), consistent with the first detection of ctxB7 isolates in Kolkata, India in 2006 [6]. This ctxB7 clade has been exported to areas outside Asia on at least three separate occasions: West Africa (T12 introduction event) [2] in 2008 (estimates with 95% CI), Haiti in 2010 [7,8], and East Africa (T13 introduction event) [4] between 2013 and 2014 (estimates with 95% CI) (Fig. 2b and Extended Data Fig. 3 and Extended Table 1).
In addition to the ctxB7 allele, all the Yemeni isolates analysed harboured the following genomic features (Table 1): (i) the toxin-coregulated pilus gene subunit A gene variant, tcpACIRS101 (ii) a deletion (ΔVC_0495-VC_0512) within Vibrio seventh pandemic island II (VSP-II), (iii) and an SXT/R391 integrating conjugating element (ICE) called ICEVchInd5/ICEVchBan5, which is associated with multiple drug resistance.
Table 1. Characteristics of the 2016-2017 Yemeni cholera epidemic strain.
| Species | Vibrio cholerae |
| Serogroup, serotype and biotype | O1, Ogawa, El Tor |
| Genomic wave | 3 |
| Genetic markers | ctxB7, tcpACIRS101, rtxA°, VSP-IIΔ* |
| AMR profile | POLS (1-2 mg/L), COLS (2-8 mg/L), O129R‡, NALR (64 - ≥ 256 mg/L), CIPDS (0.25-0.5 mg/L), FTR |
| Horizontally acquired AMR element, acquired AMR gene (AMR phenotype) | ICEVchInd5/ICEVchBan5Δ**, dfrA1 (O129R) |
| Mutated chromosomal genes (AMR phenotype) |
gyrA_S83I and parC_S85L
(NALR,
CIPDS) nfsA_R169C and nfsB_Q5Stop (FTR) |
AMR, antimicrobial resistance; POL, polymyxin B; COL, polymyxin E; NAL, nalidixic acid; CIP, ciprofloxacin; FT, nitrofurantoin; MIC range values are indicated in parentheses; R, S, and DS in uppercase indicate resistant, susceptible, and decreased susceptibility, respectively
Deletion encompassing VC_0495-VC_0512 according to GenBank accession no. AE003852
Deletion encompassing ICEVCHIND5_0011- ICEVCHIND5_0021 according to GenBank accession no. GQ463142
cross-resistance to the vibriostatic agent O/129 and trimethoprim.
Consistent with the genomic evidence, all the Yemeni isolates have a similar narrow phenotype of antimicrobial drug resistance to nalidixic acid, the vibriostatic agent O/129, and nitrofurantoin (Table 1). Mutations of the DNA gyrase gene, gyrA, resulting in the S83I amino-acid substitution, and mutations of the topoisomerase IV gene, parC, resulting in the S85L substitution, explain the resistance of the Yemeni isolates to nalidixic acid and their decreased susceptibility to ciprofloxacin. A ~10-kb deletion in ICE variable region III resulted in the loss of four genes encoding resistance to streptomycin (strA and strB), chloramphenicol (floR), and sulfonamides (sul2). The fifth gene of this region, which encodes resistance to the vibriostatic agent O/129 (dfrA1), is present in the Yemeni isolates. This deletion is not unique, as similar deletions encompassing the strA, strB, floR, and sul2 genes, flanked by transposase genes, have arisen several times independently in 7PET wave 3 isolates [2,9]. The resistance of V. cholerae to nitrofurans is due to the loss of expression of a reductase enzyme converting the drug into its active form [10]. By combining phenotypic and genotypic data, we found lesions in the VC_0715 and VC_A0637 genes of nitrofuran-resistant isolates (Extended Data Table 2). VC_0715 and VC_A0637 encode orthologs of the NfsA (52% amino-acid identity) and NfsB (58% amino-acid identity) proteins of E. coli K12 (GenBank accession no. NC_000913), respectively. In E. coli, disruption of the nitroreductases encoded by these genes confers nitrofuran resistance [11]. In all 7PET wave 3 isolates, including the Yemeni isolates, the observed mutations of VC_0715 led to the R169C amino-acid substitution, and the mutation of VC_A0637 introduced a premature stop codon (Q5Stop) likely to abolish protein function.
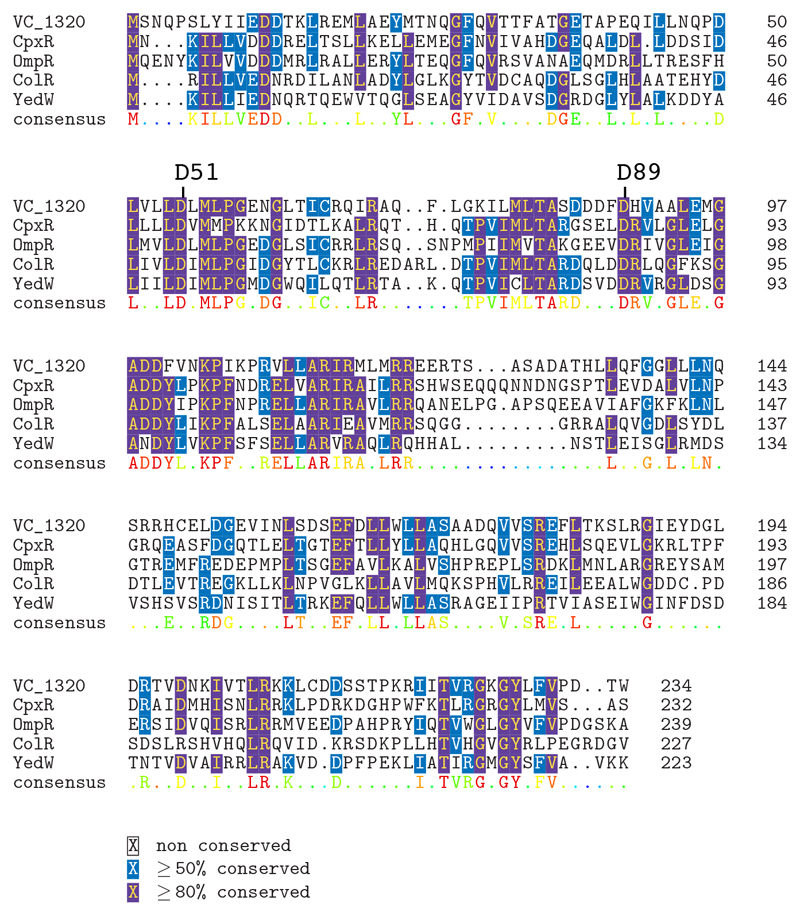
The Yemeni isolates were also susceptible to polymyxins. This is an important finding, because resistance to polymyxin B has been used as a marker of the V. cholerae O1 El Tor biotype since the beginning of the seventh cholera pandemic in 1961 [12,13]. Unlike the El Tor biotype, the classical biotype (responsible for the six previous pandemics) [14] is susceptible to polymyxin B. Polymyxin resistance is conferred by changes to the lipid A domain of the surface lipopolysaccharide, altering its charge [12,13]. The vprA (VC_1320) gene, disruption of which is known to restore susceptibility to polymyxin in 7PET isolates, is required for expression of the almEFG operon encoding the genes required for the glycine modification of lipid A [12]. A specific non-synonymous SNV in vprA genes (predicted to result in the D89N substitution, Extended Data Fig. 5) was present in 97% (63/65) of polymyxin B-susceptible isolates (Extended Data Table 2), including all the Yemeni isolates. The first polymyxin-susceptible 7PET isolates with this VprA D89N substitution in our dataset were identified in South Asia in 2012 (Fig.2b), consistent with microbiological data from Kolkata, India, where polymyxin B-susceptible V. cholerae O1 isolates emerged in 2012 and replaced polymyxin-resistant strains after 2014 [15].
7PET isolates from the ctxB7 clade have been associated with the two largest cholera epidemics in recent history. In addition to the ongoing Yemeni epidemic, the introduction of this sublineage into Haiti in 2010, in the wake of a devastating earthquake, resulted in one million cases and almost 10,000 deaths by 2017 [16,17]. These two major events highlight the threat that cholera continues to pose to public health in vulnerable populations. The United Nations (UN) estimates that 16 of the 29 million people in Yemen lack access to clean water and basic sanitation, due to the destruction of public and health infrastructures during the years of civil conflict [18]. The complexity of the situation in Yemen before the epidemic was set against a backdrop of large acute watery diarrhoea (AWD)/cholera outbreaks across the Horn of Africa (Extended Data Fig. 1), which serves as a major hub of migration into Yemen [19,20]. This region, linking Asia to Africa at the southern entrance of the Red Sea, has long been a crossroads of trade and communications routes. Several importations of 7PET cholera from Asia into the Horn of Africa are likely to have followed this route, such as T3 in 1970 [2].
The available genomic data for the historical and current importations of the 7PET sublineage into Africa are not consistent with a local origin, but instead highlight the importance of human-mediated spread of the epidemic 7PET lineage from South Asia. However, an inability to obtain samples from countries in this region hampered our efforts to reconstruct the routes of transmission in East Africa before the appearance of this strain in Yemen more precisely.
In summary, a single recent 7PET sublineage with an unusual antimicrobial resistance phenotype is responsible for the cholera epidemic in Yemen. Our study illustrates the key role of genomic microbial surveillance and cross-border collaborations in understanding global cholera spread and the evolution of virulence and antibiotic resistance determinants.
Methods (ONLINE)
Bacterial isolates
The 116 7PET isolates sequenced in this study are listed in Supplementary Table 1 and originated from the collections of the French National Reference Centre for Vibrios and Cholera, Institut Pasteur, Paris, France (n=6); the Central Public Health Laboratory of Baghdad, Iraq (n=11); the Ministry of Health of South Sudan (n=14); the Pasteur Institute of Iran (n=4); the Maharishi Valmiki Infectious Diseases Hospital, Delhi, India (n=29); the Central Public Health Laboratory of Sana’a, Yemen (n=39), Amref Health Africa, Kenya (n=1), the Kenya Medical Research Institute (n=9), and the Ministry of Health of Saudi Arabia (n=3). The isolates were characterized by standard biochemical, culture, and serotyping methods [21].
Antibiotic susceptibility testing
Antibiotic susceptibility was determined by disc diffusion on Mueller–Hinton agar, in accordance with the guidelines of the Antibiogram Committee of the French Society for Microbiology [22]. The following antimicrobial drugs (Bio-Rad, Marnes-la-Coquette, France) were tested: ampicillin, cefalotin, cefotaxime, streptomycin, chloramphenicol, erythromycin, azithromycin, sulfonamides, trimethoprim-sulfamethoxazole, vibriostatic agent O/129, tetracycline, doxycycline, minocycline, nalidixic acid, norfloxacin, ofloxacin, pefloxacin, ciprofloxacin, nitrofurantoin, polymyxin B and colistin (polymyxin E). Escherichia coli CIP 76.24 (ATCC 25922) was used as a control. The minimum inhibitory concentrations (MICs) of nalidixic acid and ciprofloxacin were determined by Etests (bioMérieux, Marcy L'Etoile, France). The MICs of colistin and polymyxin B were determined with custom-produced Sensititre microtitre plates (Thermo Fisher Scientific, East Grinstead, UK) and MIC test strips (Liofilchem, Roseto degli Abruzzi, Italy), respectively, on 34 isolates chosen on the basis of resistance phenotype, year and country of isolation.
Total DNA extraction
Total DNA was extracted with the Wizard Genomic DNA Kit (Promega, Madison, WI, USA), the Maxwell 16-cell DNA purification kit (Promega, Madison WI) or the DNeasy Blood & Tissue Kit (Qiagen), in accordance with the manufacturer's recommendations.
Whole-genome sequencing
High-throughput genome sequencing was carried out at the genomics platform of Institut Pasteur (n=107), or at the Wellcome Sanger Institute (n=9), or on Illumina platforms generating 92 to 295 bp paired-end reads, yielding a mean of 117-fold coverage (minimum 13.5-fold, maximum 639-fold). Short-read sequence data were submitted to the European Nucleotide Archive (ENA) (http://www.ebi.ac.uk/ena), under study accession numbers PRJEB24611 and ERP021285, and the genome accession numbers are provided in Supplementary Table 1
Genomic sequence analyses
The genomic sequences were processed and analysed as previously described [2]. Briefly, for each sample, sequence reads were mapped against reference genome Vibrio cholerae O1 El Tor N16961 (GenBank accession numbers LT907989 and LT907990) using SMALT v0.7.4 ((http://www.sanger.ac.uk/science/tools/smalt-0) to produce a BAM file. Variants were detected with samtools mpileup [23] version 0.1.19, with parameters “-d 1000 -DSugBf”, and bcftools [23] version 0.1.19, to produce a BCF file of all variant sites. The bcftools variant quality score had to be greater than 50 (quality > 50) and mapping quality greater than 30 (map_quality > 30). The majority base call was required to be present in at least 75% of reads mapping to the base, (ratio > 0.75), and the minimum mapping depth required was 4 reads, at least two of which had to map to each strand (depth > 4, depth_strand > 2). A pseudogenome for each sample was constructed by substituting the base call at each site (variant and non-variant) in the BCF file in the reference genome. While this paper was under review, Bwire et al. [4] published three genome sequences from Ugandan isolates belonging to the T13 clade. These three genome sequences were available as contig files and were added to the alignment with Snippy version 4.1.0 (https://github.com/tseemann/snippy), using the “--ctgs” flag to call SNPs between the contigs and the reference genome. Short reads were assembled with SPAdes [24] version 3.8.2 and annotated with Prokka [25] version 1.5.
The code for the pipelines from the Sanger Institute used can be found here: https://github.com/sanger-pathogens/vr-codebase
Phylogenetic analysis
Repetitive (insertion sequences and the TLC-RS1-CTX region) and recombinogenic (VSP-II) regions were masked from the alignment [2]. Putative recombinogenic regions were detected and masked with Gubbins [26] version 1.4.10. A maximum likelihood (ML) phylogenetic tree was built from an alignment of 9,986 chromosomal SNPs, with RAxML [27] version 8.2.8 under the GTR model with 100 bootstraps.
BEAST [28] version 1.10.1 was used to estimate time-resolved phylogenies for a spatially and temporally representative subset of 81 7PET isolates under the GTR nucleotide substitution model. We tested a combination of molecular clock and tree prior models to identify the best fit (Extended Data Table 1). Both path and stepping-stone sampling showed the best fit to be an uncorrelated relaxed clock (lognormal distribution of rates) model with a Bayesian skyline coalescent tree prior. Priors were kept at default values, with the exception of the ‘constant.popSize’ value, which was set to a lognormal distribution (initial value =1, mu =1, sigma=10) under the constant population coalescence tree prior. The choice of model had little impact on the dating of key nodes in this analysis (Extended Data Table 1). For each model, we ran three independent Markov chain Monte Carlo (MCMC) chains over 50 million steps, sampling every 2000 steps. We used a burn-in of 5 million steps for each chain and then combined chains, resampling every 10,000 steps. The effective sample size (ESS) for all estimated parameters was greater than 200. We tested for an adequate temporal signal, using TempEst [29] version 1.5, by calculating the linear regression between the root-to-tip distance and isolation date for each sample. We also performed 20 date-randomization tests with the R package TipDatingBeast [30] to assess the ucld.mean parameter.
Extended Data
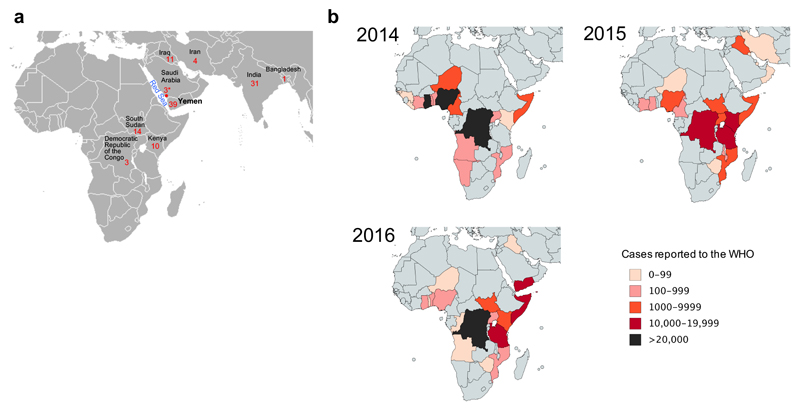
Extended data Figure 1.
Geographic location of the sequenced V. cholerae O1 El Tor isolates and number of reported cholera cases. a, Geographic location of the 116 V. cholerae O1 El Tor isolates sequenced. The number of isolates collected per country is indicated. The three isolates collected in Jizan, Saudi Arabia (denoted by an asterisk) were from Yemeni refugees originating from Hajjah District. The map is a cropped version of the one available at: https://commons.wikimedia.org/wiki/File:BlankMap-World.png. b, Number of cholera cases per country reported to the World Health Organisation (WHO) between 2014 and 2016. The total number of cholera cases reported to the WHO by the countries in panel b was 268,337. The maps were created using Paintmaps, a free online map generating tool (http://www.paintmaps.com/).
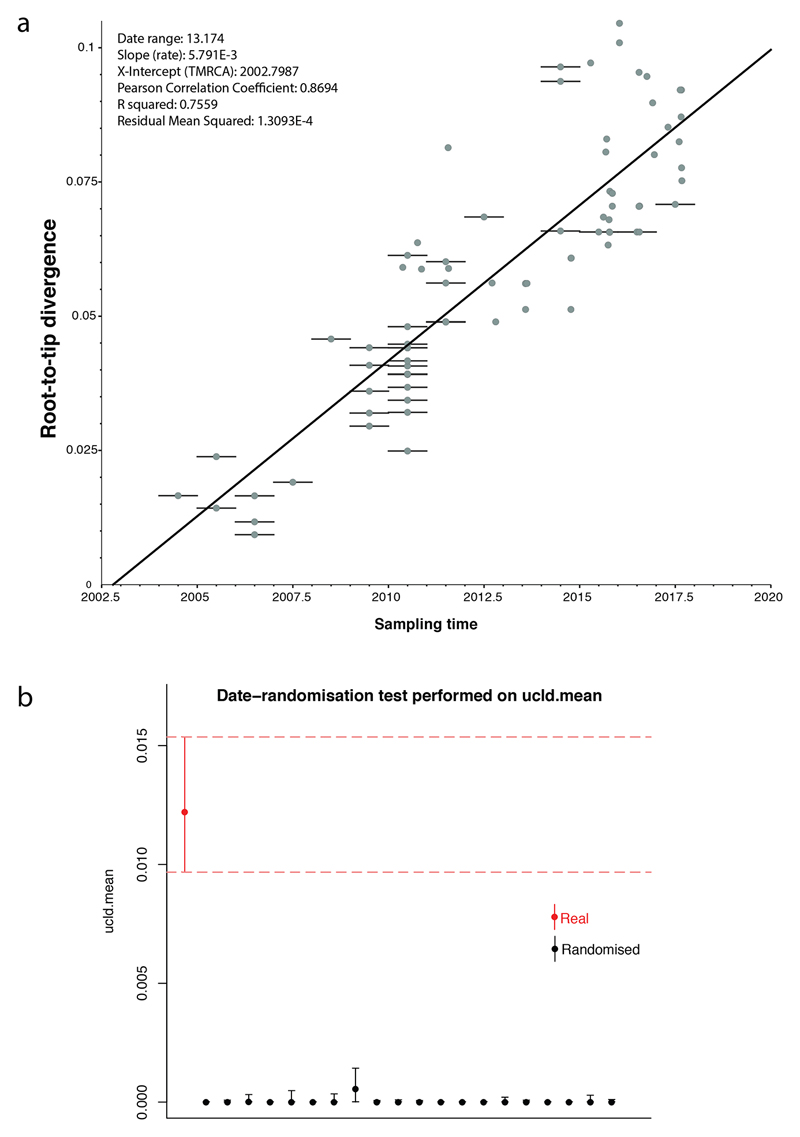
Extended data Figure 2.
Assessment of the temporal signal within the dataset. a, Linear regression of the root-to-tip distance against sampling time obtained with TempEst [29] using a maximum-likelihood phylogeny of 81 representative seventh pandemic V. cholerae O1 isolates (i.e., those used for the BEAST analysis). Bars on nodes indicate the precision of the isolation date (e.g., if only the year of isolation is known, the bar spans the entire year). b, Comparison of the ucld.mean parameter estimated from 20 date-randomisation BEAST experiments and the original dataset. The rate for the correctly dated tree is shown in red. The median and 95% Bayesian credible interval for the ucld.mean parameter are provided.
Extended data Figure 3.
Maximum clade credibility tree produced with BEAST [28] for a subset of 81 representative isolates of the distal part of the genomic wave 3 (i.e., those with the ctxB7 allele). The nodes supported by posterior probability values ≥ 0.5 are indicated.
Extended data Figure 4.
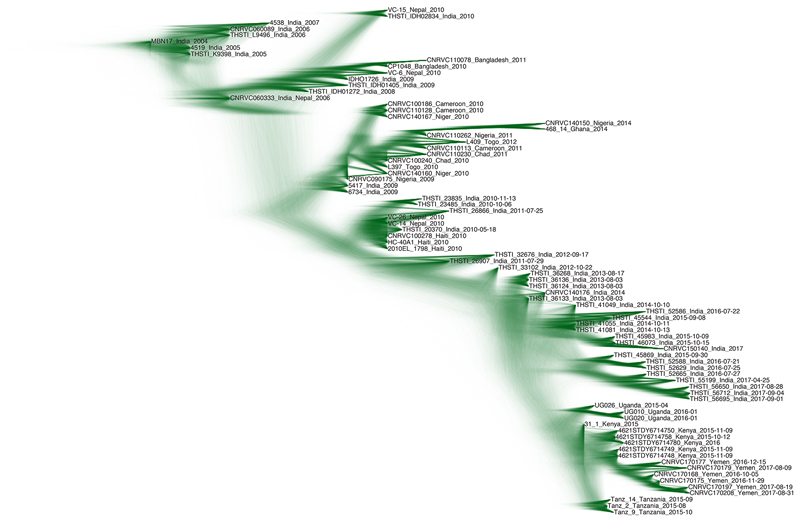
Visualisation of the posterior distribution of trees from the BEAST MCMC analysis. The opacity of the branches is scaled according to the number of times a clade is seen in the distribution. There is high support for the East Africa/Yemen clade. The uncertainty in the placement of the node for the Indian/East African isolates is the reason for the low posterior support value for this node in Extended Data Figure 3.
Extended data Figure 5.
Multiple sequence alignment of VprA (VC_1320) with two-component response regulators. A non-synonymous mutation at position 89 of VC_1320 resulting in a D-to-N amino-acid change was associated with a phenotype of polymyxin B susceptibility.
Extended Data Table 1. Summary of the Bayesian models used for BEAST [28] analyses on a subset of 81 representative V. cholerae O1 isolates of the distal part of the genomic wave 3.
tMRCA, time to the most recent common ancestor; UCLN, uncorrelated lognormal relaxed-clock; HPD, highest posterior density region; MLE, marginal likelihood estimate.
| Yemeni isolates tMRCA | African/Yemeni isolates tMRCA | |||||
|---|---|---|---|---|---|---|
| Model | Median | Upper 95% HPD | Lower 95% HPD | Median | Upper 95% HPD | Lower 95% HPD |
| Strict, Constant | 2016.04 | 2016.34 | 2015.72 | 2014.14 | 2014.62 | 2013.59 |
| Strict, Bayesian skyline | 2016.03 | 2016.35 | 2015.71 | 2014.16 | 2014.63 | 2013.61 |
| UCLN, Bayesian skyline | 2016.05 | 2016.44 | 2015.67 | 2014.38 | 2014.86 | 2013.74 |
| Model | log MLE Path Sampling | Rank | log MLE Stepping Stone Sampling | Rank | ||
| Strict, Constant | -5481314.81 | 3 | -5481312.99 | 2 | ||
| Strict, Bayesian skyline | -5481314.47 | 2 | -5481313.00 | 3 | ||
| UCLN, Bayesian skyline | -5481313.28 | 1 | -5481311.50 | 1 | ||
Extended Data Table 2. Gene alteration frequencies in isolates susceptible or resistant to certain antibiotics.
FT, nitrofurantoin; POL, polymyxin B; *720 genomes with antimicrobial susceptibility testing data (this study and reference 2) or **106 genomes with antimicrobial susceptibility testing data (this study).
| Number (%) of isolates: | |||
| VCA_0637 | FTS | FTR | |
| Wild-type | 258 (94.2) | 0 (0) | |
| Genetic alteration | 16 (5.8) | 446 (100) | |
| Total | 274 | 446 | 720* |
| Number (%) of isolates: | |||
| VC_0715 | FTS | FTR | |
| Wild-type | 264 (96.4) | 5 (1.1) | |
| Genetic alteration | 10 (3.6) | 441 (98.9) | |
| Total | 274 | 446 | 720* |
| Number (%) of isolates: | |||
| VCA_0637 and VC_0715 | FTS | FTR | |
| Wild-type | 258 (94.2) | 0 (0) | |
| Genetic alteration | 16 (5.8) | 446 (100) | |
| Total | 274 | 446 | 720* |
| Number (%) of isolates: | |||
| VC_1320 | POLS | POLA | |
| Wild-type | 2 (3.1) | 40 (97.6) | |
| D89N | 63 (96.9) | 1(2.4) | |
| Total | 65 | 41 | 106** |
Acknowledgements
This study was supported by the Institut Pasteur, Santé publique France, the French government’s Investissement d’Avenir programme, Laboratoire d’Excellence ‘Integrative Biology of Emerging Infectious Diseases’ (grant number ANR-10-LABX-62-IBEID), the Wellcome Trust through grant 098051 to the Sanger Institute, and the Indian Council of Medical Research, New Delhi, India. The Institut Pasteur Genomics Platform is a member of the France Génomique consortium (ANR10-INBS-09-08). We thank D. Legros, A. Fadaq, A. Alsomine, F. Bazel, and H. A. Jokhdar for their support; M. Musoke, S. Vernadat for technical assistance; Z. M. Eisa for providing isolates; L. Ma, C. Fund, S. Sjunnebo, and the sequencing teams at the Institut Pasteur and Wellcome Sanger Institute for sequencing the samples.
The funders had no role in study design, data collection and analysis, decision to publish, or preparation of the manuscript.
Footnotes
Data Availability Statement
The whole-genome alignment for the 1203 genomes and other files that support the findings of this study have been deposited in FigShare: https://figshare.com/s/b70a9efac9cf2625480e
Supplementary Information
Supplementary Information is linked to the online version of the paper at www.nature.com/nature.
Author Contributions
F.-X.W. and M.-L.Q. designed the study. A.A.A, M.N., S.S.N, A.R., A.M.A, N.C.S., S.K., M.R.P., A.A., J.Y.C., J.F.W., C.S., B.B., H.H.N.A, D.K., S.M.N., M.R.M, J.K., F.J.L., A.S.A., T.R., and M.-L.Q. collected, selected and provided characterised isolates and their corresponding epidemiological information. J.R. performed the DNA extractions and phenotypic and molecular typing experiments. T.M. analysed protein data. C.B. performed the whole-genome sequencing. F.-X.W., D.D., and E.N. analysed the genomic sequence data. F.-X.W. and D.D. wrote the manuscript, with major contributions from N.R.T. All authors contributed to the editing of the manuscript.
Author Information
Short-read sequence data were submitted to the European Nucleotide Archive (ENA) (http://www.ebi.ac.uk/ena), under study accession numbers PRJEB24611 and ERP021285, and the genome accession numbers are provided in Supplementary Table 1. Phylogeny and metadata can be viewed interactively at https://microreact.org/project/globalcholera.
Reprints and permissions information is available at www.nature.com/reprints
The authors declare no competing financial interests.
References
- 1.Camacho A, et al. Cholera epidemic in Yemen, 2016–18: an analysis of surveillance data. Lancet Glob Health. 2018 doi: 10.1016/S2214-109X(18)30230-4. [DOI] [PMC free article] [PubMed] [Google Scholar]
- 2.Weill FX, et al. Genomic history of the seventh pandemic of cholera in Africa. Science. 2017;358:785–789. doi: 10.1126/science.aad5901. [DOI] [PubMed] [Google Scholar]
- 3.Kachwamba Y, et al. Genetic characterization of Vibrio cholerae O1 isolates from outbreaks between 2011 and 2015 in Tanzania. BMC Infect Dis. 2017;17:157. doi: 10.1186/s12879-017-2252-9. [DOI] [PMC free article] [PubMed] [Google Scholar]
- 4.Bwire G, et al. Molecular characterization of Vibrio cholerae responsible for cholera epidemics in Uganda by PCR, MLVA and WGS. PLoS Negl Trop Dis. 2018;12:e0006492. doi: 10.1371/journal.pntd.0006492. [DOI] [PMC free article] [PubMed] [Google Scholar]
- 5.Mutreja A, et al. Evidence for several waves of global transmission in the seventh cholera pandemic. Nature. 2011;477:462–465. doi: 10.1038/nature10392. [DOI] [PMC free article] [PubMed] [Google Scholar]
- 6.Naha A, et al. Development and evaluation of a PCR assay for tracking the emergence and dissemination of Haitian variant ctxB in Vibrio cholerae O1 strains isolated from Kolkata, India. J Clin Microbiol. 2012;50:1733–1736. doi: 10.1128/JCM.00387-12. [DOI] [PMC free article] [PubMed] [Google Scholar]
- 7.Chin CS, et al. The origin of the Haitian cholera outbreak strain. N Engl J Med. 2011;364:33–42. doi: 10.1056/NEJMoa1012928. [DOI] [PMC free article] [PubMed] [Google Scholar]
- 8.Domman D, et al. Integrated view of Vibrio cholerae in the Americas. Science. 2017;358:789–793. doi: 10.1126/science.aao2136. [DOI] [PubMed] [Google Scholar]
- 9.Katz LS, et al. Evolutionary dynamics of Vibrio cholerae O1 following a single-source introduction to Haiti. MBio. 2013;4:e00398–13. doi: 10.1128/mBio.00398-13. [DOI] [PMC free article] [PubMed] [Google Scholar]
- 10.Ghosh Dastidar P, Sinha AM, Ghosh S, Chatterjee GC. Biochemical mechanism of nitrofurantoin resistance in Vibrio el tor. Folia Microbiol (Praha) 1979;24:487–494. doi: 10.1007/BF02927181. [DOI] [PubMed] [Google Scholar]
- 11.Sandegren L, Lindqvist A, Kahlmeter G, Andersson DI. Nitrofurantoin resistance mechanism and fitness cost in Escherichia coli. J Antimicrob Chemother. 2008;62:495–503. doi: 10.1093/jac/dkn222. [DOI] [PubMed] [Google Scholar]
- 12.Herrera CM, et al. The Vibrio cholerae VprA-VprB two-component system controls virulence through endotoxin modification. MBio. 2014;5:e02283–14. doi: 10.1128/mBio.02283-14. [DOI] [PMC free article] [PubMed] [Google Scholar]
- 13.Matson JS, Livny J, DiRita VJ. A putative Vibrio cholerae two-component system controls a conserved periplasmic protein in response to the antimicrobial peptide polymyxin B. PLoS One. 2017;12:e0186199. doi: 10.1371/journal.pone.0186199. [DOI] [PMC free article] [PubMed] [Google Scholar]
- 14.Devault AM, et al. Second-pandemic strain of Vibrio cholerae from the Philadelphia cholera outbreak of 1849. N Engl J Med. 2014;370:334–340. doi: 10.1056/NEJMoa1308663. [DOI] [PubMed] [Google Scholar]
- 15.Samanta P, et al. Sensitivity to polymyxin B in El Tor Vibrio cholerae O1 strain, Kolkata, India. Emerg Infect Dis. 2015;21:2100–2102. doi: 10.3201/eid2111.150762. [DOI] [PMC free article] [PubMed] [Google Scholar]
- 16.Hasan NA, et al. Genomic diversity of 2010 Haitian cholera outbreak strains. Proc Natl Acad Sci USA. 2012;109:E2010–2017. doi: 10.1073/pnas.1207359109. [DOI] [PMC free article] [PubMed] [Google Scholar]
- 17.Zarocostas J. Cholera outbreak in Haiti-from 2010 to today. Lancet. 2017;389:2274–2275. doi: 10.1016/S0140-6736(17)31581-7. [DOI] [PubMed] [Google Scholar]
- 18.United Nations Office for the Coordination of Humanitarian Affairs. 2017 http://www.unocha.org/sites/unocha/files/dms/yemen_humanitarian_needs_overview_hno_2018_20171204.pdf.
- 19.The International Organization for Migration. 2016 https://www.iom.int/news/irregular-migration-horn-africa-increases-2015.
- 20.The Danish Refugee Council. 2016 https://reliefweb.int/sites/reliefweb.int/files/resources/RMMS%20Mixed%20Migration%20Monthly%20Summary%20September%202016_0.pdf.
- 21.Dodin A, Fournier JM, (Institut Pasteur Paris (France)). , editors. Diagnosis of the cholera vibrio. Laboratory methods for the diagnosis of cholera vibrio and other vibrios. 1992:59–82. [Google Scholar]
- 22.CA-SFM & EUCAST. Comité de l’Antibiogramme de la Société Française de Microbiologie Recommandations 2017. 2017 http://www.sfm-microbiologie.org/UserFiles/files/casfm/CASFMV1_0_MARS_2017.pdf.
- 23.Li H, et al. The Sequence Alignment/Map format and SAMtools. Bioinformatics. 2009;25:2078–2079. doi: 10.1093/bioinformatics/btp352. [DOI] [PMC free article] [PubMed] [Google Scholar]
- 24.Bankevich A, et al. SPAdes: A New Genome Assembly Algorithm and Its Applications to Single-Cell Sequencing. J Comput Biol. 2012;19:455–477. doi: 10.1089/cmb.2012.0021. [DOI] [PMC free article] [PubMed] [Google Scholar]
- 25.Seemann T. Prokka: rapid prokaryotic genome annotation. Bioinformatics. 2014;30:2068–2069. [Google Scholar]
- 26.Croucher NJ, et al. Rapid phylogenetic analysis of large samples of recombinant bacterial whole genome sequences using Gubbins. Nucleic Acids Res. 2015;43:e15. doi: 10.1093/nar/gku1196. [DOI] [PMC free article] [PubMed] [Google Scholar]
- 27.Stamatakis A. RAxML version 8: a tool for phylogenetic analysis and post-analysis of large phylogenies. Bioinformatics. 2014;30:1312–1313. doi: 10.1093/bioinformatics/btu033. [DOI] [PMC free article] [PubMed] [Google Scholar]
- 28.Drummond AJ, Suchard MA, Xie D, Rambaut A. Bayesian Phylogenetics with BEAUti and the BEAST 1.7. Mol Biol Evol. 2012;29:1969–1973. doi: 10.1093/molbev/mss075. [DOI] [PMC free article] [PubMed] [Google Scholar]
- 29.Rambaut A, Lam TT, Max Carvalho L, Pybus OG. Exploring the temporal structure of heterochronous sequences using TempEst (formerly Path-O-Gen) Virus Evol. 2016;2 doi: 10.1093/ve/vew007. vew007. [DOI] [PMC free article] [PubMed] [Google Scholar]
- 30.Rieux A, Khatchikian CE. tipdatingbeast: an r package to assist the implementation of phylogenetic tip-dating tests using beast. Mol Ecol Resour. 2017;17:608–613. doi: 10.1111/1755-0998.12603. [DOI] [PubMed] [Google Scholar]


