Abstract
ApoE has been implicated in Alzheimer´s disease, atherosclerosis, and other unresolvable inflammatory conditions but a common mechanism of action remains elusive. We found in ApoE-deficient mice that oxidized lipids activated the classical complement cascade (CCC) resulting in leukocyte infiltration of the choroid plexus (ChP). All human ApoE isoforms attenuated CCC activity via high-affinity binding to the activated CCC-initiating C1q protein (KD~140-580 pM) in vitro; and C1q-ApoE complexes emerged as markers for ongoing complement activity of diseased ChPs, Aβ plaques, and atherosclerosis in vivo. C1q-ApoE complexes in human ChPs, Aβ plaques, and arteries correlated with cognitive decline and atherosclerosis, respectively. Treatment with siRNA against C5 which is formed by all complement pathways, attenuated murine ChP inflammation, Aβ-associated microglia accumulation, and atherosclerosis. Thus, ApoE is a direct checkpoint inhibitor of unresolvable inflammation and reducing C5 attenuates disease burden.
Introduction
Human Apolipoprotein-E (ApoE) is a polymorphic multifunctional protein arising from three alleles at a single gene locus. However, a common mode of action of ApoE in physiology and disease has not been identified1–7. The human isoforms of ApoE, i.e. ApoE2, ApoE3, and ApoE4 differ by amino acid residues 112 and 158 located outside of the N-terminal receptor-binding site, yielding proteins with distinct impacts on tissue homeostasis. Thus, ApoE may act through multiple pathways depending on its isoform, cellular source, the lipid moieties it binds, and multiple genetic and environmental risk factors. Notions regarding mechanisms of action of ApoE include isoform-specific domain-domain interactions7; involvement of lipoprotein receptors2,3; effects on cholesterol efflux7; maintenance of the blood brain barrier (BBB)1,6; and binding extracellular molecules including beta amyloid peptide and heparan sulfate proteoglycans2. This wide range of activities indicates that ApoE exercises its functions in complex territorialized tissue contexts. Here, we explored the roles of ApoE in the aging choroid plexus (ChP), brain, and the aorta of mice and in two major prototypic human unresolvable diseases, i.e. Alzheimer´s disease (AD) and atherosclerosis. We chose these diseases, because both have been linked to ApoE: AD is the most common form of dementia and the ApoE4 isoform predisposes to late onset AD (LOAD)2,3; and atherosclerosis is the leading cause of death worldwide8,9. Our data indicate that ApoE is a classical complement cascade (CCC) checkpoint inhibitor by binding to activated C1q and that the resulting C1q-ApoE complex emerges as a common player to impact brain inflammation and atherosclerosis.
Results
ChP lipid deposits, inflammation, and interferon signatures
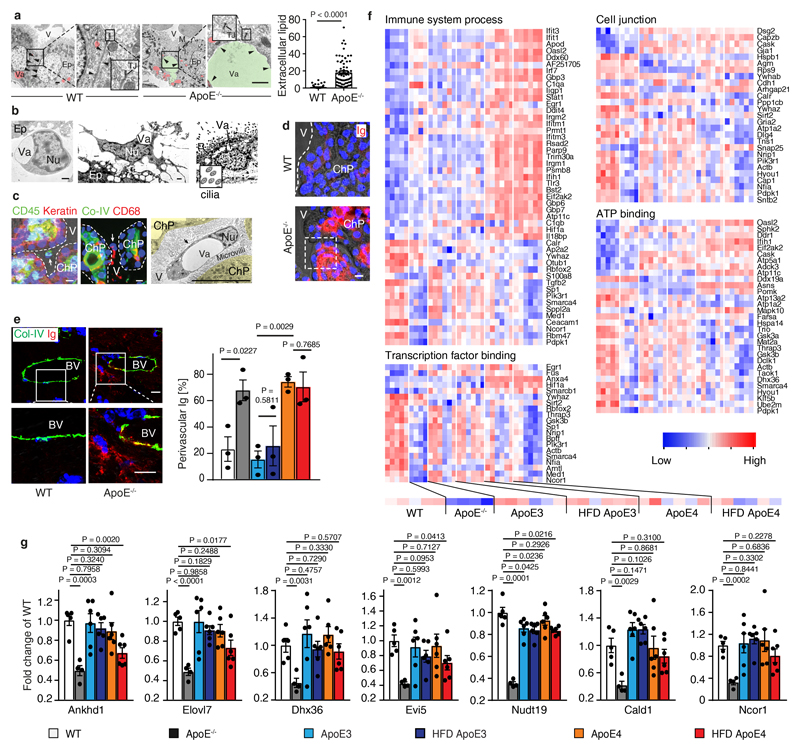
We focused on the ChP since the ChP is the major intracranial neuroimmunological interface which produces the cerebrospinal fluid (CSF), forms the blood-CSF barrier, exchanges signals between the brain and the circulation, and is the principal gateway for blood-borne leukocytes to infiltrate the central nervous system in inflammatory and degenerative brain diseases10–14. ApoE-/- mice develop spontaneous hyperlipidemia when maintained on normal chow (NC). To distinguish effects of human isoforms of ApoE and the separate impact of hyperlipidemia, humanized ApoE3-knockin (KI) and ApoE4-KI where either maintained on NC or on a high fat diet (HFD). Similar amounts of lipid accumulated in aged ApoE-/- and the HFD ApoE4-KI ChPs but no lipid accumulated in NC ApoE4-KI or in NC or HFD ApoE3-KI ChPs although HFD KI mice had similar lipid levels in the circulation (Fig.1a-c). These data indicated that lipid deposits in ChPs developed either in the absence of ApoE or in hyperlipidemic ApoE4-KI but not in hyperlipidemic ApoE3-KI mice. Lipid deposits colocalized with leukocytes in ApoE-/- ChPs with the majority of macrophages/dendritic cells (DCs), which were increased in number by a factor of ~15 (Fig.1d,e). ChP leukocytes (Fig.1f; extended Fig.1b), endothelial cells (Fig.1f), and epithelial cells (extended Fig.1a) accumulated intracellular lipid droplets, as did the ependymal cells lining the ventricle surfaces (extended Fig.1b). The adjacent brain parenchyma underneath the ependymal cells was also infiltrated by lipid and leukocytes and exhibited signs of astrocyte activation (not shown). Extracellular lipid increased in ApoE-/- versus WT ChPs by ~18-fold and also localized at the luminal side of the epithelial cells (extended Fig.1a). Additionally, high-resolution and transmission electron microscopy (TEM) revealed leukocytes and macrophages in the CSF attached to the microvilli at the abluminal side of the ChP (Extended Data Fig. 1c, left and middle panels); some of the intraventricular macrophages accumulated lipid, yielding a foam cell-like appearance (extended Fig.1c). These data suggested that macrophages on both sides of the blood-CSF barrier engulfed lipid. Extracellular lipid provides a pathological surface for complement activation in other diseases prompting us to consider complement activation in ChPs. Since extracellular ChP lipid appeared at the luminal side and the stromal space, we first considered the possibility that immunoglobulins (Igs) bind to the lipid droplets. In ApoE-/- ChPs, Igs colocalized with lipid inside the capillary lumen, the stromal space, and the lipid between the epithelial cells (Fig.1f; extended Fig.1d). These data show that lipid/Igs accumulate outside of the blood-CSF barrier in the ChP. Bell et al. previously reported that ApoE-deficiency and transgenic expression of ApoE4 in NC ApoE4-KI mice were afflicted with BBB breakdown1. Igs, which we used as a marker of BBB breakdown, accumulated in the perivascular space of the lipid-free brain parenchyma of ApoE-/- and NC or HFD ApoE4-KI mice confirming the findings of Bell et al. However, there was no statistically discernable aggravation of BBB dysfunction as a function of hyperlipidemia (extended Fig.1e).
Figure 1. ChP lipid, inflammation, and interferon (IFN) signatures.
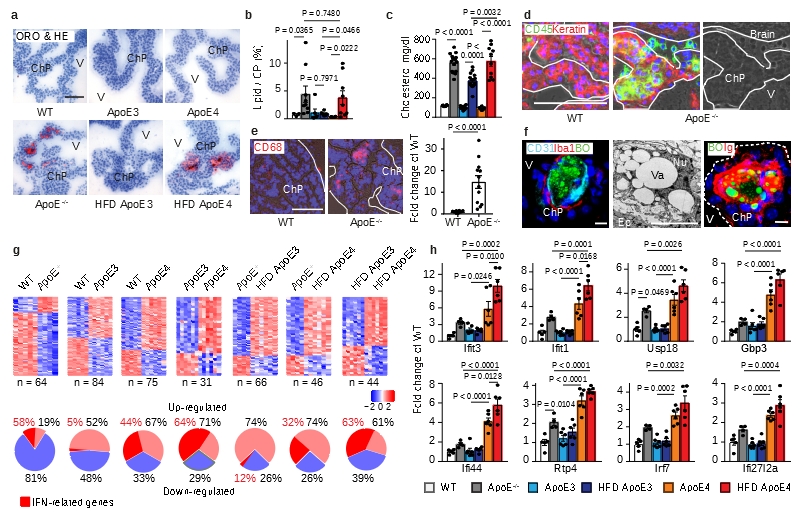
(a-b) ChP sections were stained with oil red o (ORO) for lipid (red) and hematoxylin (HE) for nuclei (blue) (a). Bar 100 μm; Representative images from b. ChPs and associated parenchyma per tissue area was quantified as described in Methods (b). WT (n=3 mice); ApoE-/- (n=9); ND ApoE3 (n=6); HFD ApoE3 (n=6); ND ApoE4 (n=6); HFD ApoE4 (n=9); (c) plasma cholesterol. WT (n=6); ApoE-/- (n=6); ApoE3 (n=14); ApoE3 HFD (n=17); ApoE4 (n=8); ApoE4 HFD (n=10) mice. (d) Epithelial cells were stained for cytokeratin (Keratin, red); leukocytes (CD45, green); and nuclei by DAPI (blue). Phase contrast delineates the ChP. Dashed line indicates the border of ChP and the ventricle. Bar 100 μm; (e) CD68+ areas were quantified as described in Methods. 12 sections from 4 WT; 12 sections from 4 ApoE-/- mice. (f) ChPs were stained for lipid by BODIPY (BO, green), endothelial cells (CD31, cyan), and macrophages (Iba-1, red) (left panel); TEM shows a single ChP macrophage-foam cell (middle panel); and lipid (BO, green) and immunoglobulin (Ig, red) (right panel). Bars 10 μm; (g) IFN-related genes in ChPs by microarray. Heat maps show two-group comparisons of ChPs. The percentages of up- or down-regulated genes were showed in the circle. The percentages of IFN-related gene in up- or down-regulated were marked as red. (h) ApoE4 isoform-dependent IFN signature expression in ChPs. WT (n=5 mice); ApoE-/- (n=4); ND ApoE3 (n=6); HFD ApoE3 (n=6); ND ApoE4 (n=6); HFD ApoE4 (n=6). Data in d,f are representative images from at least 3 biologically independent mouse samples. Data in b,c,e,h represent means ± SEM; Two-tailed Student´s t-test was applied to b,c,e; one-way ANOVA with Tukey’s test was applied to h; Abbreviations, ChP, choroid plexus; V, ventricle; Ep, epithelial cells; Nu, nucleus; Va, vacuole; TJ, tight junction; Gene names and statistics in supplementary Tabls.2-3.
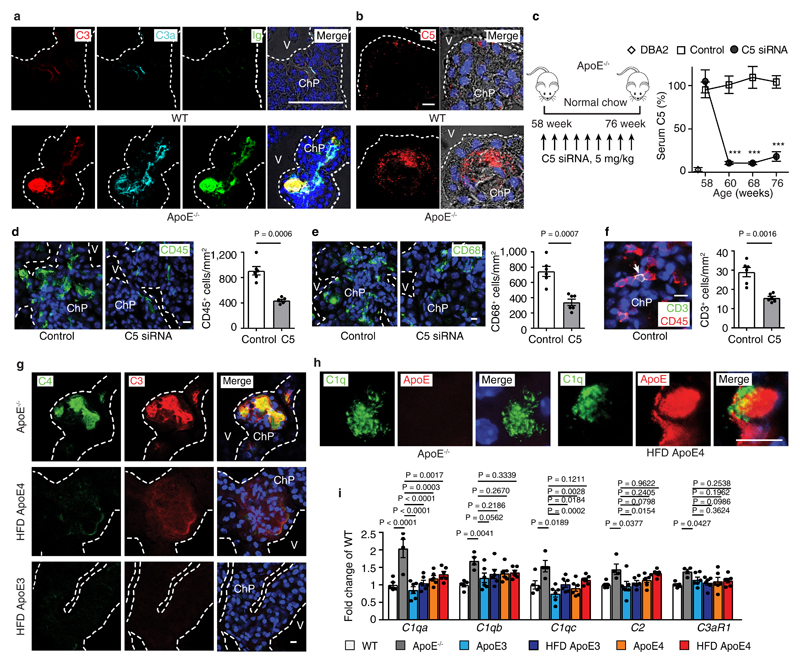
In view of the morphological ChP phenotypes in WT, ApoE-/- versus ApoE-KI mice (Fig.1; extended Fig.1) we decided to examine differential ChP gene expression profiles in 6 groups of mice: WT, ApoE-/-, ND or HFD-fed ApoE3-KI, and NC or HFD-fed ApoE4-KI mice. For this purpose, laser capture microdissection-based MIAME-compliant microarrays (http://www.ncbi.nih.gov/geo; the NCBI omnibus (GEO); accession no: GSE85774 and GSE85775) from ChPs of various mouse groups were examined. 241 differentially expressed ChP genes in the 6 transcriptomes were identified in gene ontology (GO) terms immune system process, transcription factor binding, cell junction, and ATP binding (extended Fig.1f; supplementary Tabl.1). In ApoE-/- ChPs, the majority (81%) of differentially expressed genes were down-regulated when compared to WT ChPs (Fig.1g); surprisingly, however, 58% (7/12) of upregulated genes were interferon (IFN)-related genes with none downregulated (Fig.1g). NC ApoE4 replacement ChPs further induced (44%, 22/50) IFN-related genes (Fig.1g). Multiple two-group comparisons revealed a pronounced ApoE4-specific ChP IFN signature (Fig.1g; supplementary Tabl.2). The biological activities of the IFN-related genes range from regulation of autoimmunity by macrophages and DCs to BBB integrity including IFN-induced protein with tetratricopeptide repeats 3 and 1 (ifit3, ifit1), ubiquitin-specific peptidase 18 (usp18), guanylate-binding protein 3 (gbp3), interferon-induced protein 44 (ifi44), receptor transporter protein 4 (rtp4), IFN-regulatory factor 7 (irf7), and interferon, alpha-inducible protein 27 like 2A (ifi27l2a) (Fig.1h). These data provided evidence for a detrimental and isoform-specific impact of ApoE4 in ChP homeostasis as ChP IFN has been associated with cognitive decline15. Moreover, several genes that were down-regulated in ApoE-/- ChPs were rescued in their ApoE-KI counterparts indicating phenotypic ChP changes specific for ApoE-deficiency (extended Fig.1g). In addition, complement genes were observed to be up-regulated in ApoE-/- ChPs (Fig.2; extended Fig.2; supplementary Tabl.3).
Figure 2. Complement affects ChP inflammation.
(a) ChPs were stained for complement C3 (red), anaphylatoxin C3a (cyan), and Ig (green). Bar 100 μm. (b) Complement C5. ChPs were stained for complement C5 (red). Bar 10 μm. (c) Liver-targeted C5-siRNA reduces serum C5. Control (n = 9 mice), C5 (n=9). (d-f) C5-siRNA attenuates leukocyte infiltration (d), CD68+ macrophage/DC infiltration (e), and CD3+ T cell infiltration (f) in ApoE-/- ChPs. Bars 10 μm. Control (n = 6 mice), C5 (6). (g) Low C4 and C3 protein levels in lipid deposits of HFD ApoE4 ChPs. Serial sections of ChPs as shown in Fig.1a were stained for C4 (green) and C3 (red). (h) Super-resolution (STED) microscopy shows colocalization of C1q (green) and ApoE (red) in HFD ApoE4 ChPs. Bar 10 μm. (i) ChP complement mRNA expression. WT (n=4 mice); ApoE-/- (n=5); ND ApoE3 (n=6); HFD ApoE3 (n=6); ND ApoE4 (n=6); HFD ApoE4 (n=6). Data in a,b,g,h are representative images from at least 3 independent mouse samples. Data represent means± SEM; Two-tailed Student´s t-test was applied to c,d,e,f. ***P<0.0001; one-way ANOVA with Tukey’s test was applied to i. Gene names in supplementary Tabl.3.
Complement-triggered ChP inflammation is attenuated by C5 siRNA
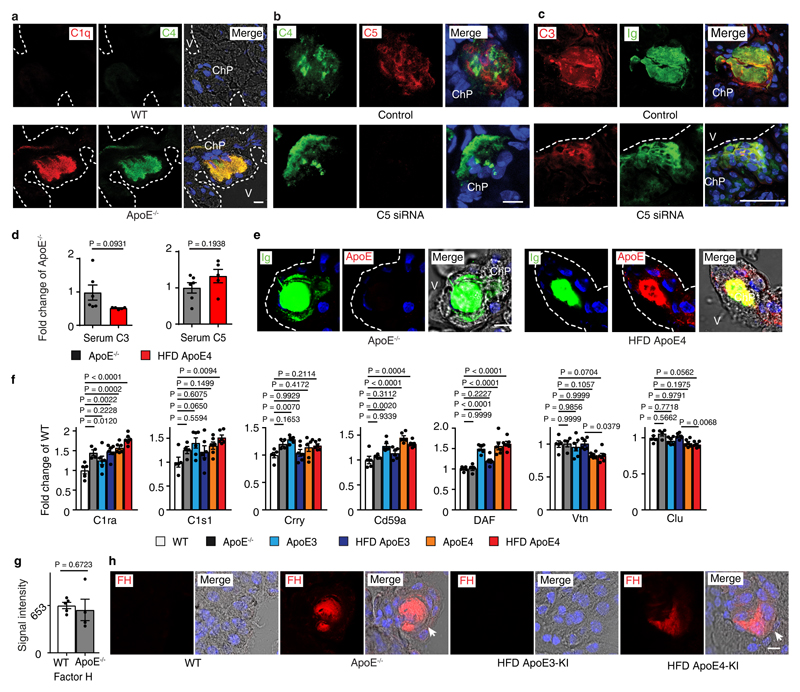
It is well recognized that oxidation-specific epitopes in extracellular lipid bind Igs and activate complement16,17 and complement activation results in surface opsonization by C3b, generation of locally acting anaphylatoxins, i.e. C3a and C5a, and subsequent recruitment of leukocytes and tissue inflammation18. We hypothesized that the lipid deposits in ApoE-/- ChPs bind Igs with resultant activation of complement. Igs, C3, C3a, and C5 were evident together with lipid in ChPs of ApoE-/- but not in WT mice (Fig.2a,b). The CCC-initiating C1q molecule and C4 colocalized with ChP lipid deposits (extended Fig.2a). Most complement constituents are produced by the liver and released into the circulation as inactive components or they can be produced locally in tissues. Whereas several complement components were significantly expressed in the ChP, C5 transcripts were below the threshold level in ChP transcriptomes, indicating that ChP C5 was largely serum/liver-derived (not shown). To examine whether ChP lipid-triggered CCC activation participates in leukocyte infiltration, we chose to specifically target liver-derived C5 using a small interference RNA (siRNA) that is exclusively taken up by the liver using an asialoglycoprotein receptor-specific tag, i.e. N-acetylgalactosamine- (GalNAc) C5-siRNA (Fig.2c). Liver C5 siRNA knockdown in ApoE-/- mice led to a large decrease of circulating C5 levels (Fig.2c) without affecting blood lipoprotein concentrations or body weight or circulating leukocytes (not shown). Liver-targeted C5 silencing also resulted in substantial decrease of C5 protein deposits in the ChP (extended Fig.2b) and significantly attenuated CD45+ leukocyte-, CD68+ macrophage-/DC-, and CD3+ T cell infiltration in ApoE-/- ChPs (Fig.2d-f). In contrast, IgG, C4, and C3 deposition were much less affected (extended Fig.2b,c). These data demonstrated that lipid-triggered complement cascade activation promoted ChP leukocyte infiltration. However, C3 and C4 were present at much lower levels in HFD ApoE4-KI ChPs vs ApoE-/- ChPs (Fig.2g) despite similar amounts of ChP lipid (parallel sections from Fig.1c) and respective serum C3 and C5 levels (extended Fig.2d) indicating that the presence of ApoE in the ChP prevented the marked complement cascade phenotype of ApoE-/- ChPs. ApoE colocalized with Igs and C1q (extended Fig.2e; Fig.2h). Using an unbiased gene expression approach, i.e. expression microarrays, we examined all complement-related genes signatures in ChPs. We identified 6 transcripts encoding CCC-specific constituents (c1qa, c1qb, c1qc, c2, c3ar1, C1ra) which were selectively upregulated in ChPs of ApoE-/- as compared to WT mice (Fig.2i, extended Fig.2f). Subsequent to CCC activation, C3b (cleavage product of C3) will initiate a constitutive amplification loop of the alternative complement cascade. Factor H (alternative complement pathway inhibitor) mRNA was detectable without differences between groups (extended Fig. 2g), factor B and MASP1 (components of the alternative and lectin pathways of complement activation) transcripts were below threshold levels. However, factor H protein accumulation was observed on lipid deposits of both ApoE-/- and HFD ApoE4 ChPs (extended Fig.2h), indicating the presence of a C3b-initiated amplification loop that recruited factor H in both groups of mice. Interestingly, C1qa and C1qc transcripts were rescued in ApoE-KI vs ApoE-/- ChPs (Fig.2i) and various complement regulators were expressed in ApoE-/- and ApoE-KI ChPs (extended Fig.2f). Taken together, these data revealed pronounced CCC activation in ApoE-/- but not in HFD ApoE3-KI and less in HFD ApoE4-KI mice. In addition, we found that ApoE mRNA ranges in the top 50 of ~14 000 genes expressed in WT ChPs indicating that ApoE is expressed at extraordinarily high levels in normal ChPs ranging in an expression range of > 99 % of all expressed ChP genes (supplementary Tabl.4).
ApoE inhibits CCC activity
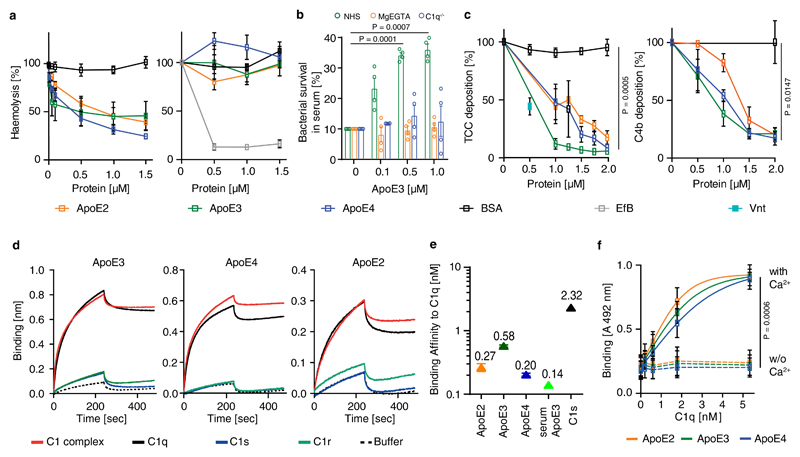
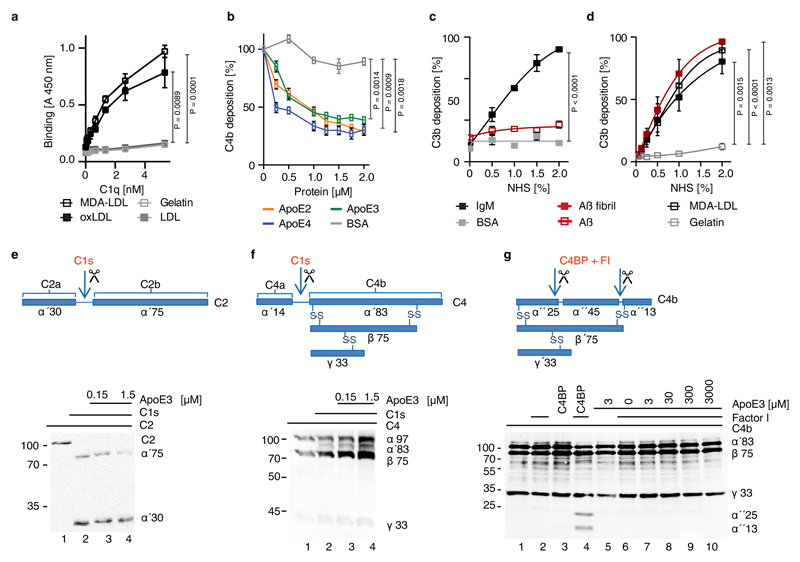
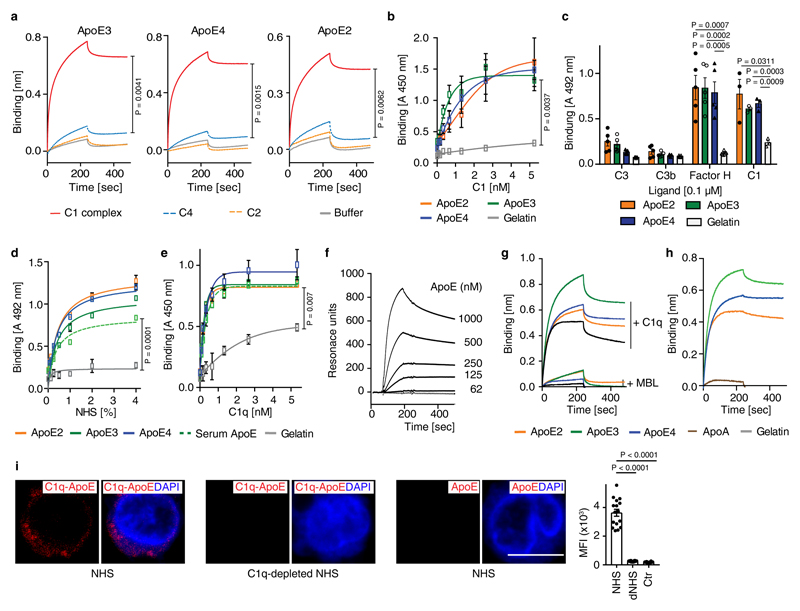
The salient absence or low expression of key complement components in HFD ApoE4-KI ChPs led us to examine a role of ApoE in the classical, alternative, and lectin pathways18. ApoE was added to normal human serum (NHS), which was activated by pathway-specific buffers, incubated with non-human erythrocytes and lysis of erythrocytes was determined. All three variants, i.e. ApoE2, ApoE3, and ApoE4 reduced CCC activation but not the alternative pathway (Fig.3a). Furthermore, in a complement-mediated killing assay, E. coli remained viable upon ApoE-supplemented NHS challenge, but were killed when complement was activated via the lectin- or alternative pathways (Fig.3b), indicating that ApoE inhibits CCC activity, but not the alternative or lectin pathways. All three ApoE isoforms inhibited deposition of C4b and the terminal complement complex (TCC) by ~80% (Fig.3c), showing that ApoE acts early in CCC activation. Oxidized-LDL (oxLDL) has been reported to activate the CCC19; and we found that purified C1q indeed bound malondialdehyde-modified low-density-lipoprotein (MDA-LDL) and oxidized-LDL (oxLDL) but not native LDL (extended Fig.3a). Moreover, ApoE inhibited the CCC and reduced C4b deposition when the CCC was activated by MDA-LDL (extended Fig.3b). Notably, amyloid fibrils but not soluble amyloid triggered C3b deposition reflecting complement activation (extended Fig.3c,d).
Figure 3. ApoE inhibits CCC initiation by high-affinity binding to C1q.
(a) ApoE inhibits CCC activation but not the alternative pathway. ApoE isoforms ApoE2, ApoE3, or ApoE4 were incubated in normal human serum (NHS), which was activated either via CCC buffer (left) (1% in GVB++) or alternative pathway buffer (right) (20% in MgEGTA); and lysis of sheep or rabbit erythrocytes by TCC was followed by measuring released haemoglobin at 415 nm. (b) ApoE was incubated with NHS in GVB++ buffer or Mg-EGTA buffer or with C1q-deficient serum in GVB++ to activate different complement pathways. Survival of E. coli was analyzed counting colony forming units. Survival of E. coli in normal serum was set as 10%. (c) ApoE isoforms inhibit the CCC at the level of TCC and C4b. ApoE isoforms in NHS were added to IgM-coated microtiter plates and TCC or C4b deposition was determined by specific antibodies, respectively. (d) Binding of C1, C1q, C1s, and C1r to ApoE isoforms was determined by biolayer interferometry as described in Methods. (e) The binding affinities of ApoE isoforms and C1s to C1q were determined by biolayer interferometry. ApoE proteins and C1s were biotinylated, immobilized on streptavidin-coated sensors, and C1q binding was determined by measuring changes of optical thickness on the sensor. (f) The ApoE-C1q interaction is dependent on Ca2+. Data represent means ± SEM of three independent experiments. Two-tailed Student´s t-test. BSA, bovine serum albumin; TCC, terminal complement complex; EfB, microbial inhibitor of the alternative pathway. Vnt: vitronectin. GVB: gelatin veronal buffer.
ApoE inhibits the CCC by high-affinity binding to the stalk of activated C1q
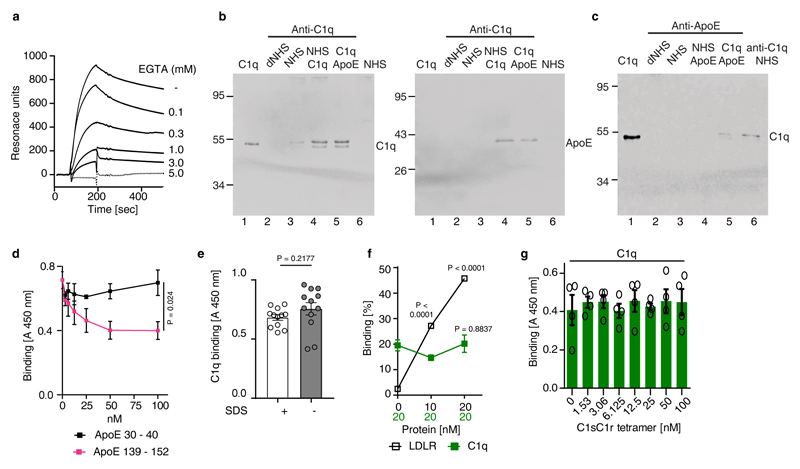
During CCC initiation, C1q is activated by undergoing a conformational change in a Ca2+-dependent manner; proteases C1s and C1r then bind to the activated C1q, forming the C1 complex followed by cleavage of C2 and C4 to form the C3 convertase C4b2b18. We incubated ApoE3 with C2 or C4 in the presence of the protease C1s. However, ApoE3 failed to inhibit C2 or C4 cleavage by C1s (extended Fig.3e,f). ApoE3 also lacked co-factor activity for factor I-mediated degradation of C4b (extended Fig.3g). ApoE binding to complement proteins revealed strong binding to C1 and C1q, but not to C1r, C1s, C2, C3, C3b, or C4 (Fig.3d; extended Fig.4a,b,c). ApoE also bound factor H (extended Fig.4c), extending an earlier report of factor H binding to ApoE on plasma high density lipoprotein20. However, ApoE did not inhibit the alternative complement pathway (Fig.3a,b). All three recombinant ApoE isoforms and serum-derived ApoE3 bound C1 and C1q (extended Fig.4d,e). Binding of C1q to immobilized ApoE was further confirmed (extended Fig.4f). We determined the strength of the interaction. All ApoE isoforms bound to C1q and equilibrium dissociation constants ranged from ~140-580 pM (Fig.3e; supplementary Tabl.5). The interaction with C1q was specific, as ApoE did not bind to mannan-binding lectin (MBL), a protein initiating the lectin pathway and sharing structural and functional features with C1q (extended Fig.4g). Likewise, apolipoprotein A did not interact with C1q (extended Fig.4h). C1q-ApoE complex formation was further confirmed by a proximity ligation assay (PLA) on cultured human apoptotic cells (extended Fig.4i). ApoE isoforms bound to C1q in a Ca2+-dependent manner (Fig.3f) and EGTA reduced the binding of ApoE to C1q (extended Fig.5a), indicating that ApoE selectively binds to the activated form but not the inactivate form of C1q. Activated C1q, but not the inactive serum C1q co-immunoprecipitated ApoE and vice versa (extended Fig.5b-c), suggesting C1q-ApoE complexes are not present in serum.
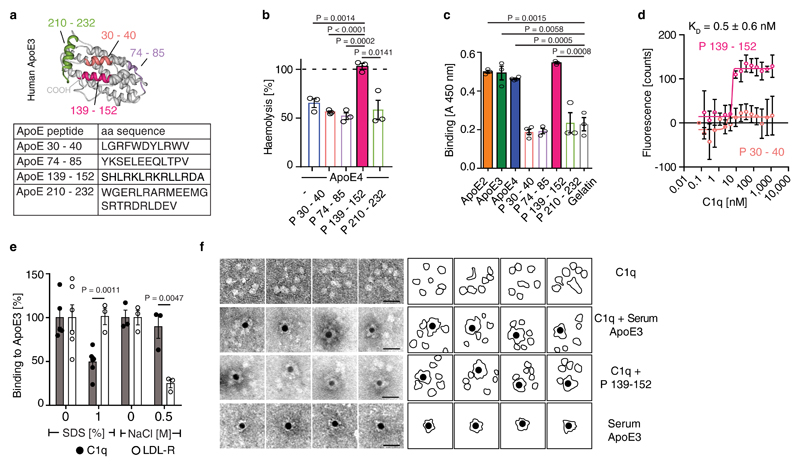
To determine the binding site in ApoE to C1q, ApoE peptides were generated and examined for their ability to reduce ApoE4-mediated CCC inhibition (Fig.4a). ApoE peptide P139-152 but not P30-40, P74-85, or P210-232, abrogated CCC inhibition by ApoE4 (Fig.4b) though P139-152 alone did not inhibit CCC activity (not shown). Analyzing binding of the four ApoE peptides to C1q revealed binding of P139-152 to C1q, but not of peptides P30-40, P74-85, or P210-232 (Fig.4c). Also, P139-152, but not P30-40 competed with ApoE3 for binding to C1q (extended Fig.5d). The dissociation constant KD of P139-152 to C1q as assessed by MicroScale thermophoresis was ~500 pM (Fig.4d). These data imply that the C1q binding site in ApoE is located between residues 139-152, which also harbors the LDL-receptor (LDLR) binding site (136-150)21. However, different binding forces for the LDLR and C1q in ApoE were indicated by the observation that C1q-ApoE interaction was strongly reduced by SDS, but not by NaCl, while LDLR-ApoE interaction was affected by NaCl, but not by SDS (Fig.4e). The influence of SDS on antibody binding was excluded (extended Fig.5e). Thus, ApoE binding to C1q was mediated by hydrophobic forces. Moreover, LDLR did not compete off C1q-ApoE binding (extended Fig.5f), indicating that LDLR and C1q do not share the same binding site in ApoE. As monitored by electron microscopy, gold-labeled ApoE and gold-labeled ApoE139-152 peptide revealed binding to the C1q stalk but not to the globular heads which mediate target binding (Fig.4f). C1sC1r tetramers also bind to the C1q stalk22. However, ApoE and the C1sC1r tetramers do not share the same binding site in C1q, because the C1q-ApoE3 interaction was unaffected by C1sC1r tetramers in competition assays (extended Fig.5g). These data revealed that ApoE acts as a specific CCC inhibitor by high-affinity binding to activated C1q at physiological concentrations.
Figure 4. ApoE or ApoE139–152 binds to the C1q stalk.
(a) Four peptides are depicted in a 3D model of human ApoE3 (PDB ID code: 2L7B) and their corresponding amino acid sequences. (b) ApoE4 inhibition was blocked by ApoE peptide P139–152 but not by ApoE peptides P30–40, P74-85, P210–232. (c) Binding of ApoE isoforms and corresponding ApoE peptides to C1q were determined by ELISA. (d) Binding affinity of P139-152 to C1q was determined by MicroScale initial fluorescence analysis. (e) Binding of ApoE3 to C1q and LDLR in the presence of SDS or NaCl was determined by ELISA. (f) ApoE binds to the stalk of C1q. C1q alone or incubated with biotinylated plasma-purified ApoE3 or biotinylated ApoE peptide P139-152 and streptavidin-coated gold particles were visualized by electron microscopy. Representative image from 3 independent experiments. Gold-streptavidin/biotin-ApoE and recombinant directly gold-labeled ApoE showed similar results. Bar 20 nm. Data represent means ± SEM of three independent experiments. Two-tailed Student´s t-test.
ChP C1q-ApoE complexes correlate with cognitive decline
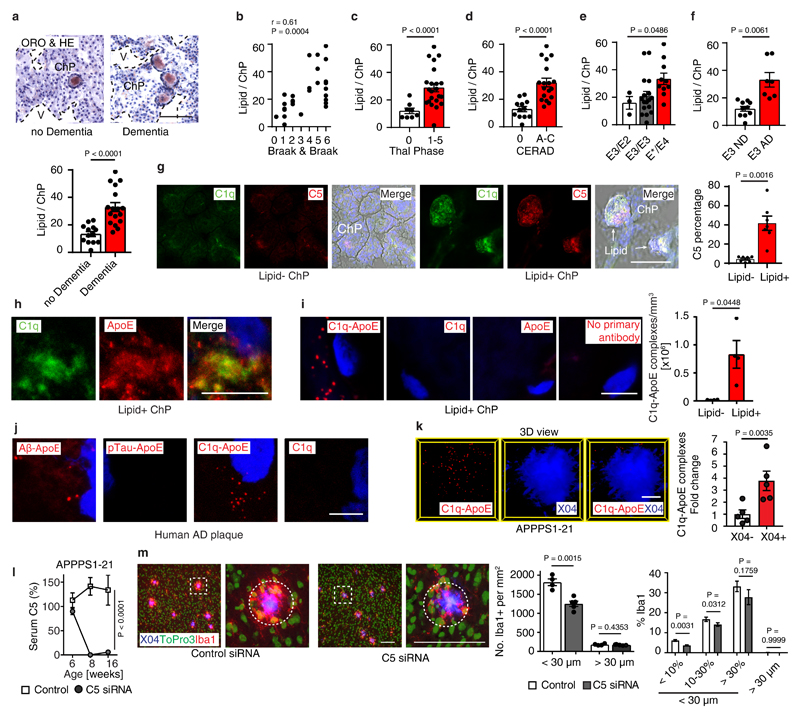
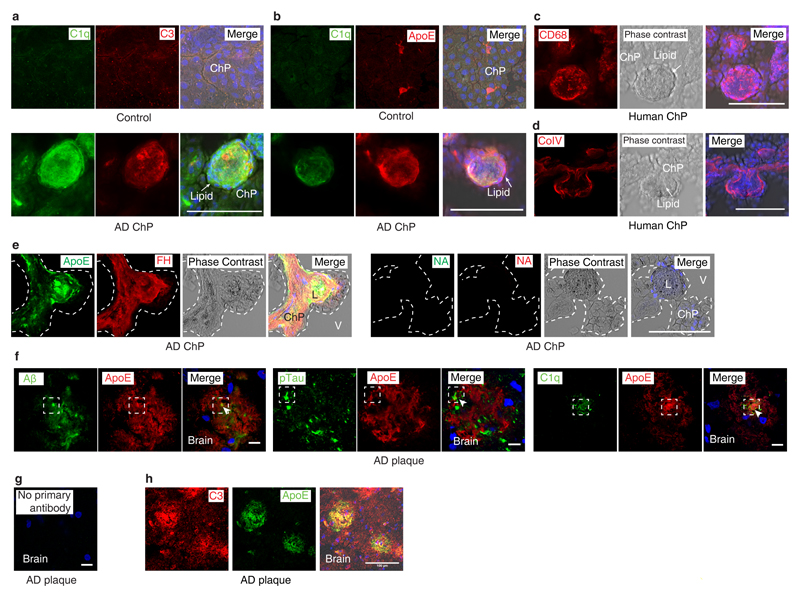
Though ChP lipid deposits have not been reported in AD, we searched for pathologies in human AD ChPs that may resemble the pathology of ApoE-/- and HFD ApoE4-KI ChPs. We studied 30 age- and gender-matched human brains afflicted with various stages of AD-associated pathologies, i.e. Braak & Braak stages for neurofibrillary tangles (NFTs)23, Thal phase for Aβ plaque score24, and the Consortium to Establish a Registry for Alzheimer´s Disease (CERAD) for neuritic plaque (Aß plaque with dystrophic neurites) burden (supplementary Tabl.6). 13/30 patients had no signs of dementia (Braak & Braak 0-III, Thal phase 0-5, CERAD stage 0), whereas 17/30 patients exhibited dementia upon clinical neurological examination and showed marked AD pathologies (Braak & Braak IV-VI, Thal phase 1-5, CERAD stage B-C) (supplementary Tabl.6). Surprisingly, 29 of the 30 brains showed various degrees of ChP lipid deposits that were strikingly similar to those found in ApoE-/- and HFD ApoE4-KI ChPs (Fig.5a). Notably, demented AD cases revealed higher rates of lipid in ChPs vs non-dementia cases (Fig.5a). Moreover, the burden of ChP lipid deposits correlated with all AD neuropathologies (Fig.5b-d) and the ChP lipid content especially correlated with ApoE4 allele carriers (Fig.5e). Unexpectedly, ApoE3/ApoE3 demented AD cases also had a significantly higher rate of ChP lipid positive areas when compared to ApoE3/ApoE3 non-dementia cases (Fig.5f). We next examined whether lipid deposits in human ChPs was associated with complement proteins and inflammation. ChP lipid colocalized with C1q, ApoE, and complement C3 and C5 (Fig.5g; extended Fig.6a,b). ChP lipid deposits were associated with intraluminal macrophage infiltration, very similar to mouse ApoE-/- ChPs (extended Fig.6c,d). Factor H protein deposition was observed in both lipid positive and lipid negative ChPs in dementia cases (extended Fig.6e). A major question that arose from these data was whether the C1q-ApoE complex that we observed in vitro (Figs.3,4) is also formed in vivo. C1q-ApoE complex formation was evaluated using the proximity ligation assay (PLA) with a resolution power of 10-30nm, comparable to resonance energy transfer-type technologies25 and super-resolution STED microscopy was applied in parallel (Fig.5h). By PLA, we observed that the C1q-ApoE complex forms in human ChPs in vivo and that its density in ChP lipid-rich areas was higher when compared to lipid-free areas (Fig.5i).
Figure 5. ChP C1q-ApoE complexes correlate with cognitive decline in Alzheimer's disease (AD).
(a) Human ChP sections were stained with ORO/HE. Bar 100 μm. ChPs lipid was quantified as described in Methods. Non-dementia cases (n=13) and demented cases (n=17). (b) Pearson correlation of ChP lipid and neurofibrillary tangle stage (Braak & Braak). n=30. (c-e) ChP lipid correlate with Aβ score (Thal phase), neuritic plaque score (CERAD), and ApoE4 genotype. n = 30 biologically independent samples, (f) ChP lipid correlates with dementia in ApoE3/ApoE3 carriers. ApoE3/ApoE3 Non-dementia cases (n=10) and demented cases (n=7). (g) Human ChP sections were stained for C1q (green) and C5 (red). Bar 100 μm. C5 percentage of lipid- ChP and lipid+ ChP from the same case was quantified according the Methods. Lipid- (n=7 biologically independent samples), lipid+ (n=7). (h) STED microscopy shows colocalization of C1q (green) and ApoE (red). Bar 5 μm. (i) Binding of C1q-ApoE in vivo by PLA. Anti-ApoE, anti-C1q, or no primary antibodies were used as controls. The number of C1q-ApoE complexes of lipid-negative ChP or lipid-positive areas were quantified as described in Methods. Lipid- (n=4 independent samples), lipid+ (n=4). Bar 5 μm. (j) Human brain sections were stained for Aβ/ApoE, pTau/ApoE, C1q/ApoE, or C1q alone. Protein-protein binding in vivo was detected by PLA. Blue for nuclei. Bar 5 μm. (k) 16 weeks AD (APPPS1-21) brain cortex sections were examined by the PLA assay for the presence of C1q/ApoE complexes, methoxy X04 to outline plaques. X04-(5), X04+ (5). Bars represent 10 μm. (l) Liver-targeted C5 siRNA reduces serum C5 in APPPS1-21 mice. Ctr (n=4 mice), C5 (n=5). (m) Brain sections were stained with iba1 for microglial cells (red), To-Pro-3 for nuclei, and X04 for Aβ plaque. White dashed circle represents the area within a 30 μm radius. The number of iba1+/To-Pro-3+ cells per areawere quantified (> 30 μm radius represents non-Aβ plaque area). Plaques were further grouped into small plaques (X04% < 10% of 30 μm radius area), moderate plaques (X04% between 10 - 30% 30 μm radius area), and large plaques (X04% > 30% of 30 μm radius area). Percentage of iba1 positivity within a 30 μm radius of Aβ plaques and non-Aβ plaque areas were compared. 420 individual Aβ plaques and 40 fields of non-Aβ plaques from 4 control mice, 536 individual Aβ plaques and 51 fields of non-Aβ plaques from 5 C5 treated mice. Data in h,j are representative images from at least 3 independent samples. Data represent means ± SEM. Two-tailed Student´s t-test was applied to a,c,d,f; paired two-tailed Student´s t-test was applied to g,I,k; One-way ANOVA was applied to e; Two-way ANOVA was applied to l,m.
C1q-ApoE complexes indicate ongoing complement activity in Aβ plaques
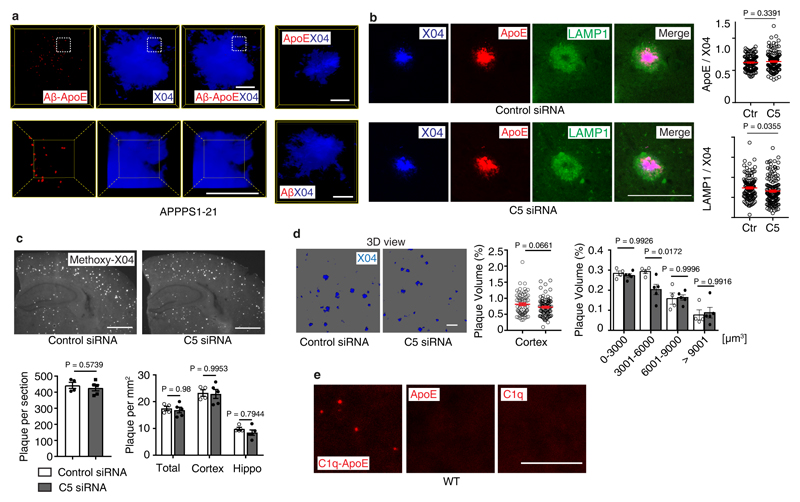
Complement C1q and ApoE have been observed in human AD plaques. We examined whether C1q-ApoE complexes can be observed in human AD plaques. C1q, Aβ, phosphorylated Tau (pTau), as well as C3 colocalized with ApoE (extended Fig.6f-h) in brains of human AD. C1q-ApoE complexes were also observed in human AD plaques (Fig.5j). Moreover, Aβ-ApoE complexes but not ApoE-pTau complexes were observed in AD plaques of demented cases (Fig.5j), extending and corroborating findings that ApoE binds to Aβ but not pTau in vitro26. These data add to earlier reports that ApoE, C1q, and C3 are detectable in human AD plaques by demonstrating the buildup of the C1q-ApoE and Aβ-ApoE complexes in brains of AD cases with dementia. We next searched for the C1q–ApoE complex in a mouse model of cerebral β-amyloidosis (the APPPS1-21 mouse carries mutations in both the APP and presenilin genes, leading to rapid onset amyloid lesions)27. High resolution 3D confocal microscopy of C1q-ApoE complexes that had been visualized by the PLA assay revealed that the complexes accumulate inside as well as in the immediate vicinity of methoxy-X04+ Aβ plaques in APPPS1-21 cortexes (Fig.5k; extended data Video1), i.e. the area of Aβ plaques that show plaque-associated microglia cells accumulation. Aβ-ApoE complexes were also observed in APPPS1-21 mouse brains. The majority of Aβ-ApoE complexes located inside X04+ Aβ plaque (extended Fig.7a; extended data Video2). The presence of C1q-ApoE complexes is a marker for persistent CCC activity in vivo. We considered the possibility that liver C5 would have inflammatory effects inside the BBB, i.e. the brain parenchyma, and - by the same token - specifically in AD plaques. For this purpose, we treated APPPS1-21 mice with liver-specific C5 siRNA. C5 siRNA treatment significantly reduced serum C5 (Fig.5i) and the number and density of Aβ plaque-associated microglia cells (Fig.5m) and of Aβ plaque-associated LAMP1 (extended Fig.7b). C5 siRNA also reduced the percentage of intermediate-sized plaque volumes though the total plaque load was unchanged under these experimental conditions (extended Fig.7c-d). These data show that C5 cleavage contributes to Aβ pathology. In addition, C1q-ApoE complexes were observed in 8 weeks old (adolescent) WT brain cortexes (extended Fig.7e). As the complex only forms under conditions of activated C1q (see above), these data indicate that the C1q-ApoE complex may play a physiological role in normal brain homeostasis.
C1q-ApoE complexes in atherosclerosis
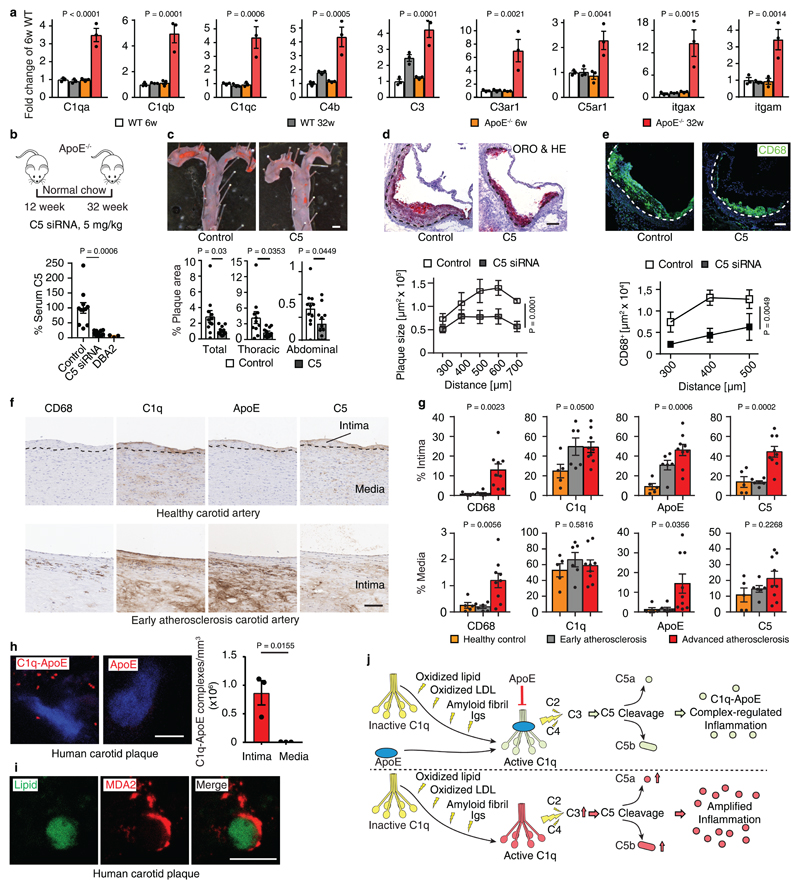
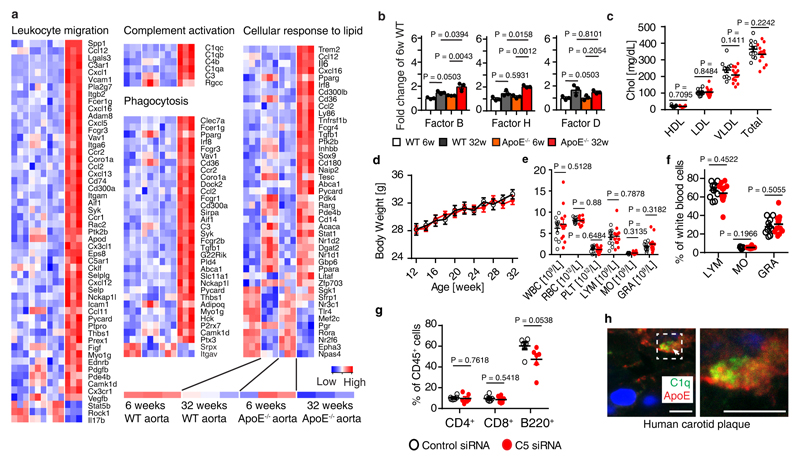
Our data raised the possibility that other unresolvable human diseases showed similar pathological hallmarks that we identified in ApoE-/- ChPs in mice and human and mouse AD brains. We examined complement pathways during the early stages of atherosclerosis in ApoE-/- mice. When we mined gene expression signatures in WT vs ApoE-/- aortas28, we found 9 complement pathway-related transcripts (largely CCC-related) to be >2-fold upregulated during development of aortic atherosclerosis (Fig.6a; extended Fig.8a,b; supplementary Tabl.7). The impact of CCC on atherosclerosis was examined by C5 siRNA treatment on ApoE-/- mice for 20 weeks (Fig.6b). Treatment reduced both thoracic and abdominal atherosclerosis by ~65% in the total aorta (Fig.6c). C5 siRNA reduced aortic root atherosclerosis and decreased macrophage density in plaques (Fig.6d-e), without affecting blood lipid levels, body weight, or blood leukocyte counts (extended Fig.8c-g). We next evaluated C1q-ApoE complexes in human carotid atherosclerosis. Five healthy control arteries on autopsy (type 0-I; American Heart Association classification29), six early (type II-III) and nine advanced atherosclerotic plaques (type V-VII) (supplementary Tabl.8) from carotid endarterectomy specimens were stained for CD68+ macrophages/DCs, C1q, ApoE, and C5 (Fig.6f). CD68+ macrophages, and C1q, ApoE, and C5 protein deposits increased in early and advanced plaques when compared to control arteries (Fig.6g). C1q and ApoE co-localized in atherosclerotic plaques as determined by STED microscopy (extended Fig.8h). The C1q-ApoE complex emerged as a marker of CCC activity in atherosclerotic plaques (Fig.6h). However, although both C1q and ApoE were expressed in the uninflamed media layer of human carotid atherosclerotic arterial wall, no C1q-ApoE complexes were detectable there (Fig.6g-h). Malondialdehyde-epitopes (MDA2) were observed on the surface of lipid deposits within plaques (Fig.6i).
Figure 6. C1q-ApoE complexes are indicative of CCC activity in atherosclerosis.
(a) Aorta complement gene mRNA expression. 6 weeks WT (n=3 mice); 32 weeks WT (n=3); 6 weeks ApoE-/- (n=3); 32 weeks ApoE-/- (n=3); (b) Liver-targeted C5 siRNA reduces serum C5 in young ApoE-/- mice. Ctr (n=11 mice), C5 (12). (c) En face staining for whole aorta. Bar 0.5 cm. Atherosclerotic plaques were quantified as described in Methods. Control (n=11 mice), C5 siRNA (n=12). (d,e) Aortic root sections were stained for ORO/HE and CD68+ macrophages/DCs. Bars 100 μm. Plaque size (d) and CD68+ macrophages/DCs size (e) were quantified as described in Methods. Control (n=4 mice), C5-siRNA (n=4). (f) Human carotid artery parallel sections were stained for CD68, C1q, ApoE, and C5 by DAB and hematoxylin. Representative images from g. (g) CD68, C1q, ApoE, and C5 signal was quantify as described in Methods. Control (n=5 independent samples), early plaque (n=6), advanced plaque (n=9). (h) C1q-ApoE complexes in human atherosclerosis plaque was determined by PLA. Intima (n=3 independent samples), media (3). Bar 5 μm. (i) High resolution microscopy shows colocalization of lipid (green) and malondialdehyde epitopes (MDA2, red) in human atherosclerotic plaque. Bar 10 μm. Representative images from at least 3 independent samples. (j) Schematic representation of the C1q-ApoE complex. Locally produced and/or serum-recruited C1q is activated in situ by a variety of surface activators including oxidized lipid, oxidized LDL, amyloid fibrils, and immunoglobulins. C1q activators have been implicated in diseases as varied as atherosclerosis and AD. Following activation, C1q acquires an active conformation that allows initiation of the CCC with resultant generation of C3a and C3b and C5 cleavage to generate C5a and C5b. ApoE inhibits the CCC activity by binding of ApoE at high affinity to the active C1q and forms the C1q-ApoE complex (upper part of the panel). By contrast, inflammation is amplified in the absence of ApoE by overactivation of the CCC (lower panel). C1q: inactive (yellow); activated (light green); overactivated (red). Data represent means ± SEM. Two-tailed Student´s t-test was applied to b,c,h; One-way ANOVA was applied to a,g; Two-way ANOVA was applied to d,e.
Discussion
We identified a CCC activity-regulating C1q-ApoE complex in diseased ChPs, AD plaques, and atherosclerotic arteries. As ApoE qualifies as a checkpoint inhibitor of the CCC via formation of the C1q-ApoE complex, our data directly tie ApoE to the regulation of the immune system and identify its mechanism of action.
The CCC is triggered by activation of C1q which can be established by multiple mechanisms in diverse sets of physiological and pathophysiological states30–34. The widespread range of C1q activators illustrates the ubiquitous actions and central position of the CCC to maintain tissue homeostasis and - more specifically - to respond to bacterial infection by activating the innate immune system31,32,34. However, inappropriate control of the CCC causes its malfunction, injurious tissue inflammation, and disease (Fig.6j)32,34. That ApoE may be indispensable for CCC regulation is indicated by the marked pathologies of the ChP and of atherosclerosis in ApoE-/- mice and by the observation that the disease burden can be reduced by C5 siRNA in peripheral tissues and the brain in experimental models as varied as ApoE-/- and APPPS1-21 mice. The salient expression of C1q-ApoE complexes in ChPs, AD plaques and atherosclerotic lesions are indicative on ongoing complement activity suggesting multiple therapeutic targets such as the complex itself, their downstream constituents and their corresponding receptors on immune cells32,34–37.
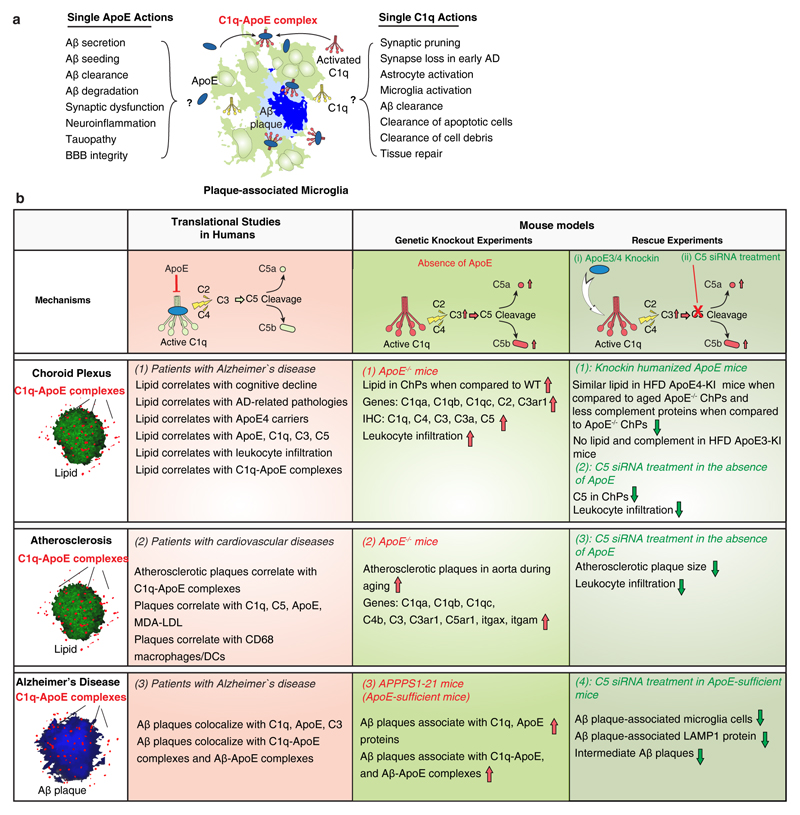
The two binding partners of the complex, i.e. C1q and ApoE, have previously been viewed as separately acting molecules30,38–45 to perform independent tasks in numerous tissue contexts (extended Fig.9a). Indeed, in addition to being involved in bona fide complement pathways, complement constituents have recently been recognized to impact non-canonical events outside of the innate arm of the complement cascade-guided immune system such as regulating inflammasomes or skewing the immune system32,34,46. Moreover, the Janus-headed natures of both C1q and ApoE become often apparent only in distinctive tissue contexts where they are either beneficial or detrimental30,38–45. Our data suggest that at least some pathologies previously thought to reflect single actions of C1q or ApoE may in fact involve C1q–ApoE complexes (extended Fig.9a). We believe that the roles of C1q-ApoE complexes in vivo deserve to be considered prudently: The in vitro data demonstrate that ApoE is a checkpoint inhibitor of CCC activity, and our genetic, pharmacological and clinical translational studies provide evidence that the C1q-ApoE complex is also active in vivo (Fig.6j; extended Fig.9b). More work is needed to further evaluate the role of the complex versus the single actions of each C1q and ApoE in multiple experimental and human disease conditions. Such studies would require a better understanding not only of the domain structures of each C1q and ApoE as prototypic multidomain-binding molecules but a more precise understanding of the amino acid binding sequences in ApoE to form a complex with C1q. As most if not all chronic inflammatory diseases are associated with activation of one or more complement pathways and C1q and ApoE are locally induced in response to multiple types of stress, our hypothesis that activated C1q initiates formation of the complex with resultant CCC-dependent physiological/beneficial or - if the CCC becomes persistently activated - disease-associated inflammation, deserves future attention in both basic and clinical studies.
AD and atherosclerosis share risk factors47 while the second most common form of dementia, i.e. vascular dementia, has been closely related to LOAD: The incidence of AD is greatly enhanced in patients with both atherosclerosis and the ApoE4 allele consistent with common mechanisms of disease progression48. Our suggestion that the C1q-ApoE complex forms an active disease-relevant regulatory module is consistent with the frequent occurrence of autoimmune diseases or immune deficiencies in patients afflicted with genetic absence or loss of function mutations in C1q, C2, C4, and other components of the CCC and with the identification of both C1q and ApoE as major players in LOAD and atherosclerosis in genetic association studies49,50.
Methods
Mice
C57BL/6J WT and ApoE-/- mice were purchased from the Jackson Laboratories and housed in the animal facilities of Jena and Munich Universities. WT and ApoE-/- were fed a standard rodent chow under pathogen free conditions. ApoE3 knock-in (ApoE3-KI) and ApoE4-KI mice on C57BL/6 background were purchased from Taconic, USA51, and maintained in the animal facility of Jena University under mouse chow or fed a high fat cholate-containing diet (Altromin, Germany) containing 15.8 % fat, 1.25 % cholesterol, and 0.5 % sodium cholate. The diet was started at the age of 62 weeks and continued for 16 weeks. APPPS1-21 mice27 were studied in collaboration with Mathias Jucker, Hertie Institute for Clinical Brain Research, University of Tübingen. Animal procedures were approved by Regierung Oberbayern according to guidelines of the local Animal Use and Care Committee and the National Animal Welfare Laws.
Human brain and choroid plexus tissues
All cases were collected and provided by the Neurobiobank Munich, Ludwig-Maximilians-University (LMU) Munich according to the guidelines and the protocols were approved by the ethics committee of Faculty of Medicine, LMU. ApoE genotype was determined by PCR (Ezway PCR kit, Koma Biotech). AD-related pathologies (neurofibrillary tangles and beta amyloid) were determined according to the guidelines of the Brain Net Europe Consortium52,53, the density of neuritic plaques according to the plaque score modified from CERAD by the National Institute on Aging54. Patient characteristics are summarized in supplementary Tabl.6.
Human carotid artery tissues
Atherosclerotic plaques were obtained from patients with high-grade carotid artery stenosis (>70%)55 after carotid endarterectomy. Healthy control carotid arteries were obtained from the Forensic Medicine Institute (type 0 – I)29. Healthy control arteries comprised all three vessel layers, i.e. the intima, media, and adventitia. Atherosclerotic plaques consisted mainly of the diseased intima resulting from the surgical intervention used for plaque excision56. The study was performed according to the Guidelines of the World Medical Association Declaration of Helsinki. The ethics committee of Faculty of Medicine, Technical University of Munich (TUM) approved the study and written informed consent for permission to be included into the Munich Vascular Biobank was given by all patients. The baseline patient characteristics are summarised in supplementary Tabl.8.
C5 siRNA injection
Mice were randomly separated into two groups. 5 mg/kg C5 siRNA targeting the liver (20 mg/ml in PBS) or control siRNA targeting luciferase (20 mg/ml in PBS) (provided by Alnylam Pharmaceuticals, Inc.) were administered subcutaneously (s.c.) every two weeks. Serum C5 protein levels were determined by ELISA. Complement C5-deficient DAB2 mouse serum (provided by Alnylam Pharmaceuticals, Inc.) was used as negative control for ELISA.
Atherosclerotic lesion analyses
Mouse aortas were prepared and stained by Sudan-IV for en face atherosclerosis analysis as described previously57. The extent of atherosclerotic plaques was quantified in total aorta, thoracic aorta, and abdominal aorta using ImageJ software. In addition, plaque sizes were quantified in Oil red O/hematoxylin stained serial sections of aortic root. Human carotid plaques were segmented in blocks of 3 to 4 mm, fixed in formalin overnight, decalcified in 0.5 M EDTA (pH 7.2) and embedded in paraffin (FFPE) as described previously58,59 or fresh-frozen in Tissue-Tec (Sakura Finetek) for immunofluorescent staining of lipid. Hematoxylin-Eosin and Elastic van Gieson (EvG) staining was performed in order to assess atherosclerosis. Specimens were divided into early (II-III) and advanced stages of atherosclerosis (V-VII). In paraffin sections, antisera were first optimised using different dilutions to determine the best staining results with minimal background. Following primary antibody incubation, visualization was performed using the LSAB ChemMate Detection Kit (Dako, Denmark) according to the manufacturer’s instructions. Stained slides were scanned by ScanScope microscope (Leica) to obtain digital images. All images were prepared as TIF files and quantified by imageJ software.
Histology, immunofluorescence microscopy, and morphometry
For Immunofluorescence staining, tissues were dissected and embedded in Tissue-Tec (Sakura Finetek), frozen in isopentane, and stored at -80°C. 20 μm whole mouse brain coronal sections or one hemisphere of AD mice were prepared according to the mouse brain atlas map60. Human and mouse brain sections were stained for Oil Red O for lipid adopted from protocols for atherosclerosis (see above). Total areas of ChPs and the areas of lipid+ areas were determined using AxioVision Rel 4.6 software (Carl Zeiss) and Leica Application Suite (Leica). AD mouse brain sections were stained for Methoxy-X04 (Tocris Bioscience) for Aβ plaque. The total number of Aβ plaques per section or per brain area were quantified using Leica Application Suite (Leica). Immunofluorescence staining was performed as previously described28, using marker antibodies anti-mouse collagen IV (2150-1470; AbDSerotec), immunoglobulins (715-166-151; Dianova), immunoglobulin isotype that do not react with mouse Ig (017-160-006; Dianova), anti-human/mouse C3 (A213, ComplementTech), anti-human/mouse C3a (A218, ComplementTech), anti-human C5 (A220, ComplementTech), anti-mouse C5 (ab11898, Abcam), isotype for C5 (ab27478, Abcam), anti-mouse C1q (HM1096BT, Hycult Biotech), anti-human C1q (ab71089, Abcam), anti-mouse C4 (HM1046, Hycult Biotech), anti-human Factor H (A312, Quidel), anti-mouse Factor H (HM1119F, Hycult Biotech), anti-human ApoE (ab52607, Abcam), anti-human ApoE (178479; Calbiochem), anti-mouse ApoE (ab183597, Abcam), anti-mouse CD68 (FA11; Serotec), anti-human CD68 (EMB11, DAKO), anti-mouse CD31 (553370; BD PharMingen), anti-mouse iba-1 (019-19741; WAKO), anti-mouse CD45 (BZL 01145; Biozol), anti-human/mouse cytokeratin (Z0622; DAKO), anti-human collagen IV (CIV22, DAKO), anti-beta-amyloid (4G8, Biolegend), anti-phospho-Tau (AT8, Thermofisher), anti-iba1 (polyclonal, WAKO), anti-LAMP1 (1D4B, Abcam), TO-PRO™-3 Iodide (642/661) (T3605, Thermo Fisher Scientific) or DAPI for DNA. Anti-malondialdehyde (MDA)-lysine epitope antibody was in-house produced as described previously17. Secondary antibodies were used as previously described61. For negative controls, stainings were performed without primary antibodies or isotype controls. Stained sections were analyzed using a confocal laser scanning microscope (CLSM) 510 META (Carl Zeiss, Germany) or Leica SP8 3X (Mannheim, Germany). The numbers and areas of microglia cells (iba1+/To-Pro-3+ cell) within 30 μm and >30 μm were quantified as described previously43. All images were prepared as TIF files by imageJ or Leica LAS-X (V1.2) software and exported into Adobe IIIustrator CS6 for figure arrangements.
Proximity ligation assay (PLA)
Protein-protein binding ex vivo was performed by Duolink® PLA kit (DUO92101 SIGMA). Fresh-frozen human choroid plexus, brain parenchyma, and carotid artery sections were fixed with 4% PFA for 10 mins at 4 degrees Celsius (4° C), then blocked with blocking buffer for 30 mins. After washing, sections were stained with rabbit anti-human ApoE (ab52607, Abcam) and mouse anti-C1q (ab71089, Abcam) or mouse anti-beta-amyloid (4G8, Biolegend), mouse anti-phospho-tau (AT8, Thermo Fisher) overnight at RT. APPPS1-21 mouse brain sections were fixed with 4 % PFA, followed with 10 mins Methoxy-X04 (Tocris Bioscience) staining for Aβ plaque. After washing, sections were stained with rabbit anti-mouse ApoE (ab183597, Abcam) and mouse anti-C1q (HM1096BT, Hycult) with no or/and one primary antibody as controls. Apoptotic THP-1 cells (ATCC® TIB-202™, UV light for 2h) were seeded onto Poly-L-lysine- (Sigma-Aldrich, Missouri, USA) coated diagnostic slides, type PTFE (Carl Roth, Karlsruhe, Germany). Cells were incubated in NHS or C1q-depleted human serum (each 1%) (Complement Technology, Texas, USA) for 30 minutes. Cells were blocked and treated with rabbit anti-ApoE antibody (25 μg/ml) (Acris Antibodies, Herford, Germany), and mouse anti-C1q antibody (25 μg/ml) (Thermo Fisher Scientific, Massachusetts, USA). PLA signal was detected by Duolink® PLA kit according to manufacturer’s protocol. Leica confocal microscope (SP8, Leica, Germany) equipped with a 100X oil objective (NA 1.4) or LSM 710 equipped with ZEN 2011 software were used for image. 6 fields per each sample were recorded, 3D reconstructions and the number of PLA signals per volume were performed using LAS-X software package (Leica, v1.2, Germany). Fluorescence was measured on cultured single cells.
Labeling of lipid with BODIPY
Stock solutions were prepared by dissolving 1 mg BODIPY 493/503 (4,4-difluoro-1,3,5,7,8-pentamethyl-4-bora-3a,4a-diaza-s-indacene; Invitrogen) in 1 ml ethanol, and stored at -20 °C. Tissue sections were fixed with 3% PFA, followed by staining with antibodies, then with BODIPY 493/503 (1:1000 dilution with 150mM NaCl buffer) for 10 mins at RT protected from ambient light, and mounted.
Stimulated emission-depletion (STED) microscopy
For 3D STED and CLSM microscopy, samples were imaged on a Leica SP8 STED 3X microscope (Leica, Germany) equipped with a 100X oil objective (NA 1.4). A tunable white light laser source was used to excite fluorophores. Depletion was performed at 660 nm and 775 nm for Cy3 and Cy5 or Abberior STAR 635P, respectively. We applied a CLSM sequence prior to the STED sequences for recording of the DAPI signal. 3D reconstructions were performed using LAS-X software package (Leica, v1.2, Germany) and ImageJ.
Transmission electron microscopy (TEM)
Mice were put down by isofluran and perfused trans-cardiacally for 2 mins with PBS followed by perfusion for 8 mins with freshly prepared 4% PFA + 1% glutaraldehyde buffer under 120 mm Hg pressure. Brain tissues were immersed in cacodylate buffer and cut at 400 μm thick sections using a Vibratome (Leica, VT1000S). After washing three times with cacodylate buffer, a post fixation with 1 % osmium tetroxide in cacodylate buffer was done according to previous methods62. 0.5 μm2 sections of areas of interest were selected. 80 nm ultra-thin sections were cut and stained with lead citrate and examined using an EM900 (Zeiss) TEM.
Blood brain barrier (BBB) assay
Mice were perfused with 200 ml 4 % PFA under 120 mm Hg pressure. Ig was stained with donkey anti-mouse IgG conjugated CY3 antibody. Collagen IV antisera were used to label basement membranes of blood vessels. Ig+ signals located in the perivascular space were used to determine BBB integrity. For quantitative studies, cerebellum was used; 3-4 sections (200 μm interval) were stained with Ig, vessels with diameter of more than 10 μm (representing arteries) were used.
Laser capture microscopy (LCM) and generation of microarrays
LCM and microarray analyses were performed as previously reported28,63. Brain sections were dissected using the PALM MicroBeam system (Carl Zeiss MicroImaging). Trizol buffer was used to lyse tissues. RNA preparation and microarrays were done as reported previously63,64. cDNA was synthesized, amplified and purified, and the probe was fragmented (0.5 – 12 μg cRNA), followed by hybridizing for 20 h in hybridization buffer according to Affymetrix protocols. Arrays were scanned immediately after staining and scale raw data to 500 and exported for further analyses.
Microarray data analysis
Microarray data analyses were done as previously reported63,64. Briefly, signal intensities were calculated from the raw data and scaled to an array trimmed mean of 500, R and Bioconductor were used in all further steps. Data were filtered prior to statistical analysis to remove genes with low expression or without significant changes between groups. Data were used from two groups and subjected to Student´s t-test. Use of data after applying filters with more than two groups were subjected to one-factor variance analysis (ANOVA). Tests with p values P ≤ 0.01 are performed with Benjamini and Hochberg correction for multiple testing. Microarray data were deposited in the NCBI´s gene expression omnibus (GEO; accession number GSE85774 and GSE85775 for ChPs, and GSE40156 for aortas57).
Proteins and antibodies used for in vitro assays
Complement components C2, C3, C3b, C4, C4b, C1q, C1s, Factor H, Factor I, and C4BP as well as all primary antibodies (anti C1q, A200/3b; anti C2, A212/18b; anti C3, A213/5a; anti C4, A201/3a; anti factor H, A237/4) were purchased from Complement Technology. Recombinant ApoE isoforms from BioCat; plasma-purified ApoE3 from Biopure. ApoE peptides were generated by Peptide 2.0: ApoE 30-40 LGRFWDYLRWV; ApoE 75-85 YKSELEEQLTPV; ApoE 139-152 SHLRKLRKRLLRDA; ApoE 210-232 WGERLRARMEEMGSRTRDRLDEV. LDL and malondialdehyde-modified LDL (MDA-LDL) were from Cell Biolabs, copper oxidized LDL (oxLDL) from Thermo Fisher (L34357), ApoA from Athens Research&Technology, vitronectin (Vnt) from Corning. Aβ and Aβ fibrils from GenSript. Recombinant EfB was expressed as described65. Additional antisera used were: anti-C5b-9 (clone AE11-MO777-Dako), anti C1s (11951-05011-AssaybioTch), anti ApoE ((178479-Calbiochem), anti ApoE (Merck, 178479), anti LDLR (HB04JL2204-B-SinoBiological), anti Aβ (clone 32A1-Abfrontier), anti goat IgG (13C0836-Sigma Aldrich) and anti rabbit IgG (13C0529-Sima Aldrich), IgM (120228-Jackson ImmunoResearch Laboratories).
Haemolytic assay
Alternative pathway haemolysis assays were performed in a total volume of 100 μl containing 20 % NHS (pooled from healthy human blood donors), increasing amounts of ApoE, BSA or EfB (each 0.25 – 1.5 μM) and 2x10⁷ rabbit erythrocytes (Fiebig-Nährstofftechnik) in Mg2+-EGTA buffer (20 mM HEPES; 144 mM NaCl; 10 mM EGTA; 7 mM MgCl2; pH 7.4). To analyze inhibition of haemolysis via the classical pathway, 1% NHS, increasing concentrations of ApoE (0.01 – 1.5 μM) or 0.44 μM ApoE4 plus 0.33 μM ApoE peptide together with 2x10⁷ amboceptor- (Siemens) coated sheep erythrocytes (Fiebig-Nährstofftechnik) were mixed in gelatine veronal buffer (GVB++; Complement Technology). After preincubation of the proteins in NHS for 15´ at 37° C the NHS-protein-mix was added to the erythrocytes and incubated for additional 30 mins at 37° C. Lysis of erythrocytes was determined by measuring the amount of hemoglobin in the supernatants at 414 nm. The results were calculated as haemolysis rate relative to the level of lysis in absence of ApoE, the latter was set as 100%.
E. coli killing assay
Different amounts of ApoE (0.1 – 1 μM) together with 0.2% NHS were preincubated for 10 mins at 37° C before adding E. coli pET200/D-TOPO (1000 cells per sample). After an incubation of 30 min at 37° C cells were plated to a LB-agar plate and cultivated overnight at 37° C before counting colony forming units. To distinguish which complement pathway was effected the experiment was performed incubating ApoE3 with NHS in GVB++ for all three pathways, with NHS in Mg-EGTA buffer for the alternative, and with C1q-depleted serum in GVB++ for the lectin and the alternative pathways. Bacterial survival w/o adding ApoE was set as 10 %.
Complement activation assay
The effect of ApoE on classical complement pathway C4b and C5b-9 deposition was analyzed by ELISA. The classical pathway was activated by coating either IgM (2 μg/ml) or MDA-LDL (1 μg/ml) to a microtiter plate. ApoE (0.25 – 2 μM), Vnt (0.5 μM) were preincubated with 1% NHS in GVB++ buffer for 15 mins at 37° C and added to coated plates for 1 h at 37° C. Complement activation with NHS alone was set as 100%.
Cleavage and cofactor assays
The influence of ApoE on C1s to cleave C2 and C4 was determined in fluid phase. ApoE3 (5 and 50 μg/ml) was preincubated with C1s (20 μg/ml) in GVB++ buffer for 15 mins at 37° C followed with C2 (10 μg/ml) or C4 (10 μg/ml) for 30 mins at 37° C. C4b cleavage activity of ApoE was determined by incubating C4b (20 μg/ml) with ApoE3 (5 and 50 μg/ml) or C4BP (20 μg/ml) for 30 mins at 37° C. C4b cleavage was followed by Western blotting. Cofactor activity of ApoE was measured by incubating C4b (10 μg/ml) with Factor I (FI) (5 μg/ml), C4BP (20 μg/ml), ApoE3 (10 μg/ml) or combinations thereof (FI together with C4BP and FI together with increasing amounts of ApoE3 (0.1 – 100 μg/ml)) for 30 mins at 37° C. C4b cleavage was analyzed by Western Blotting.
ELISA
Recombinant or plasma-purified ApoE (0.1, 0.4 or 0.5 μM), ApoE peptides (0.1 μM), IgM (1 μg/ml), LDL, oxLDL, and MDA-LDL (each 1 mg/ml) or gelatin (10 μg/ml) were immobilized in carbonate-bicarbonate buffer (Sigma) on microtiter plates (F96 Maxisorb, Nunc-Immuno module) overnight at 4° C. After washing the plate three times with washing buffer (PBS) containing 0.1% Tween 20) wells were blocked (PBS, 1% BSA, 5% milk) for at least 1 h at 37° C. Coated proteins were incubated for 1 h at 37° C with C3, C3b, and C1q (0.1 μM) or C1q (0.02– 5.33 nM) or NHS (0.075 – 10%) in GVB++ buffer. Calcium-dependent binding of C1q to ApoE was determined by diluting C1q in GVB++ buffer or in PBS and adding increasing amounts of EGTA (3 – 12 μM) (Sigma) with a fixed concentration of C1q (2 or 5 nM) to immobilized ApoE proteins. Binding force was analyzed incubating C1q or the LDLR (0.1 μM) with or w/o NaCl (0.5 M) or SDS (1 %) on immobilized ApoE3. C1q, C3, and C3b binding was analyzed by specific primary antibodies and followed by HRP-conjugated secondary antibodies. The reaction was developed with TMB (Kementec Diagnostics) or 1,2-phenylenediamine dihydrochloride (OPD tablets, Dako) and the absorbance at 450 nm or 492 nm was recorded.
Competition assay
To verify binding of ApoE peptide 139-152 to C1q, different amounts of ApoE 139-152 and ApoE 30-40 as a control (6,25 – 100 nM) were incubated with a constant concentration of C1q (0.6 nM) on immobilized ApoE3 (0.1 μM). Binding of C1q to ApoE3 was analyzed using specific antibodies. ELISA was performed to investigate whether ApoE competes with the C1sC1r tetramer for binding to C1q. C1q (0.6 nM) together with different amounts of the C1sC1r tetramer (1.53–100 nM) in PBS++ were incubated with 0.1 μM immobilized ApoE3 for 1 h at 37° C. After a washing step C1q binding to ApoE was determined. 20 nM C1q was incubated with increasing concentrations of LDLR (0 – 20 nM) to immobilized ApoE, the binding of ApoE-C1q and ApoE-LDLR was followed by ELISA. Background binding of anti-C1q and anti-LDLR to immobilized ApoE was set at 0%.
Binding assays – BLItz™ and surface plasmon resonance
Biolayer interferometry (BLItz™, ForteBio) was used to examine binding of recombinant ApoE isoforms to C1, C2, C4, C1 complex components C1q, C1s, C1r, and to MBL and the binding of C1q to ApoA. Biotinylated proteins (ligands) were coupled to Streptavidin-coated biosensors and different analytes were added. Streptavidin-coated biosensors (VWR) were hydrated for 10 mins in PBS with Calcium and Magnesium (PBS++, Lonza) before loading 20 μg/ml biotinylated ApoE2, 3 and 4 or ApoA for 120 sec. After a 30 sec baseline step 45 nm of complement protein analyte was associated for 240 sec to the sensor followed by a 240 sec dissociation step. For biotinylation ApoE isoforms as well as ApoA were incubated with biotin (Thermo Fisher Scientific) for 30 mins at RT. Samples were separated from unbound biotin using Centri Pure Mini Spin columns (Biotech). Surface plasmon resonance was used to examine the binding of ApoE (62-1000 nM) to C1q (immobilized to a 5M Biacore Chip) in real time. Binding of ApoE (1000 nM) was determined upon addition of increasing amounts of Ca2+ chelator EGTA (0.1 - 3 mM) in the binding buffer (75 mM Nacl, 5 mM HEPES, 1mM CaCl2).
Affinity measurement of ApoE binding to C1q
Affinity constant (KD), association (kon), and dissociation (koff) constants of ApoE binding to C1q full length proteins and C1s was determined by BLItz™. Streptavidin-coated biosensors were hydrated for 10 mins in PBS++. Recombinant ApoE2, ApoE3 and ApoE4, plasma-purified ApoE3 or C1s (each 20 μg/ml) were loaded for 120 sec via biotin onto the sensor. After 30 sec baseline, C1q (0.047 nM – 45.65 nM) or MBL (45.45 nM) was associated for 240 sec followed by a 240 sec dissociation step. Affinity values were generated by BLItz™ software analysis as an advanced kinetics experiment using MBL as reference value. Initial fluorescent analysis (NanoTemper) was used to determine the KD of the binding between C1q and ApoE 139-152. Alexa 647-labeled ApoE 136-152 (10 nM) or ApoE 30-40 (30 nM) were incubated with different amounts of C1q (0.073 – 1196.8 nM) in PBS++ for 30 mins in the dark. After 10 mins centrifugation samples were transferred into standard capillaries and initial fluorescence was measured using a Monolith NT.115Pico (LED power 60%, MST power 20%). To test whether the observed fluorescence changes are due to a binding event, an SD-test was performed: The three samples with the highest and the lowest C1q concentration were centrifuged for 10´ at 15000g before removing the supernatant and adding SD-mix (4 % SDS, 40 mM DTT). After an incubation step of 5 mins at 95° C samples were transferred to capillaries and initial fluorescence was measured. The initial fluorescent analysis v2.0.2 was used to determine the KD.
Co-immunoprecipitation
For co-immunoprecipitation of C1q (Invitrogen, clon 9A7) and ApoE (Invitrogen, clone 1H4) monoclonal antibodies were bound to protein G-coupled Dynabeads (Complement Technology). Beads were incubated with purified human ApoE (Merck) and/or purified C1q (Complement Technology) and/or NHS (2%) or C1q-deficient serum (dNHS, Complement Technology) (2%). NHS or anti-C1q antisera with NHS were incubated with no precoated Dynabeads and were used as controls. Proteins were eluted from the beads with glycine buffer (pH 2.7), separated by SDS-PAGE and immunoblotted using goat anti C1q antiserum or goat anti ApoE antiserum and rabbit anti-goat antibody for detection. Purified C1q was added directly to the first lane of each gel as size marker for Western blot.
TEM for C1q and ApoE interaction
To visualize single C1q protein particles by TEM, C1q (5 μg/ml) was diluted in PBS. In order to gold-label ApoE, biotinylated plasma-purified ApoE or ApoE139-152 (20 μg/ml) was incubated with streptavidin-gold complexes (5 nm gold, British BioCell International Ltd.) diluted 1:25 in PBS for two hours at RT. C1q (10 μg/ml) was added to the ApoE-streptavidin-gold solution (1:1 mixture) and incubated under gentle shaking for two hours at RT. To detect single C1q-ApoE3 complexes by structure, full length ApoE3 (40 μg/ml) was directly labeled with EM-Grade 6 nm gold particles (AURION-ImmunoGold Reagents & Accessories, The Netherlands). The probe (containing ~2 x 10¹⁴ gold particles/ml) was diluted 1:200 in PBS. Carbon-coated grids were hydrophilized by glow discharge at low pressure in air. Aliquots of C1q alone and C1q-ApoE-streptavidin-gold or C1q-ApoE3-gold were adsorbed onto hydrophilic, carbon-coated grids for 1 min, washed twice with ddH2O, and stained on a drop of 2% uranyl acetate in ddH2O. Specimens were analyzed with a Zeiss EM902A electron microscope (Carl Zeiss) operated at 80 kV accelerating voltage, and images were recorded with a FastScan-CCD-camera 1,024 x 1,024 (TVIPS).
Statistical Analysis
Significant differences between two groups were analyzed by GraphPad Prism 7 using the two-tailed unpaired Student´s t-test or one-way ANOVA with multiple testing (Tukey). Values of *p≤0.05, **p≤0.01, ***p≤0.001 were considered statistically significant.
Extended Data
Extended Figure 1. Lipid deposits, BBB, and ChP gene signatures.
(a) Vacuole (Va) represents lipid. Intercellular lipid (green) between two epithelial cells was quantified. 68 intercellular spaces from 3 ApoE-/- and 67 intercellular spaces from 3 WT mice were analyzed. Bar represents 1 µm. (b) Lipid in ApoE-/- ChPs by TEM. Lymphocytes (left panel); macrophages/dendritic cells (DC) (middle panel); and ependymal cells contain lipid (right panel). Vacuole (Va) represents lipid. Bar 1 µm; (c) ChPs were stained for cytokeratin (keratin, red) and leukocytes (CD45, green) (left panel); collagen IV (Co-IV, green) and CD68 (red) (middle panel). TEM shows single macrophage-foam cell/DCs adjacent to microvilli. Bar 10 µm; (d) ChPs were stained with Ig (red) as described in Methods. Bars 10 µm; (e) PFA-perfused brains were stained for Ig (Ig, red) and blood vessels (Col-IV, green) in the cerebellum. Perivascular Ig adjacent to blood vessels was quantified as described in Methods. WT (n = 3 mice); ApoE-/- (n=3); ND ApoE3 (n=3); HFD ApoE3 (n=3); ND ApoE4 (n=3); HFD ApoE4 (n=3). Bar 10 µm. (f) Laser capture microdissection (LCM)-based expression microarrays of ChPs. Heatmaps show transcript levels in GO terms immune system process, transcription factor binding, cell junction, and ATP binding; (g) Genes that were down-regulated in ApoE-/- CPs and rescued either in ApoE3-KI and in ND or HFD ApoE4-KI mice. WT (n = 5 mice); ApoE-/- (n=4); ND ApoE3 (n=6); HFD ApoE3 (n=6); ND ApoE4 (n=6); HFD ApoE4 (n=6). Data in c,d are representative images from at least 3 biologically independent mouse samples. Data in a,e,g represent means ± SEM; two-tailed Student's t-test was applied to a,e,g. Gene names and statistics in Supplementary Tables 7.
Extended Figure 2. Complement constituents in mouse ChPs.
(a) ChPs were stained for C1q (red) and C4 (green). Bar 100 µm. (b) C5 siRNA treatment blocks C5 protein deposition in ApoE-/- ChPs; (c) ChPs were stained for C3. Ig represents lipid; (d) Serum C3 and C5. Serum C3 and C5 protein levels were measured by ELISA. ApoE-/-(n = 6 mice), HFD ApoE4 (n=5). (e) High resolution confocal microscopy shows colocalization of ApoE4 (ApoE, red) and Ig (green, represents lipid) in HFD ApoE4-KI ChPs. ApoE-/- ChPs serve as negative controls for ApoE staining; (f) Complement regulators are expressed in ChPs. WT (n = 5 mice); ApoE-/-(n=4); ND ApoE3 (n=6); HFD ApoE3 (n=6); ND ApoE4 (n=6); HFD ApoE4 (n=6). (g) ChP Factor H expressed between WT and ApoE-/- mice. WT (n=5); ApoE-/-(n=4); (h) ChP factor H protein in ChPs. White arrows indicate lipid positive areas. Data in a,b,c,e,h are representative images from at least 3 biologically independent mouse samples. Data in d,f,g represent means ± SEM; Two-tailed Student's t-test was applied to d,g; one-way ANOVA with Tukey posttest was applied to f; Gene names in Supplementary Table 3.
Extended Figure 3. ApoE does not inhibit cleavage of C2 or C4 by C1s.
(a) C1q binds immobilized malondialdehyde-modified LDL (MDA-LDL) and oxLDL but not native LDL or gelatin. (b) ApoE isoforms in NHS were added to MDA-LDL-coated microtiter plates and C4b deposition was determined by specific antisera. (c,d) IgM, MDA-LDL, and Aβ fibrils but not soluble Aβ activate complement and cause C3b deposition. BSA, gelatin as negative controls; (e, f) ApoE3 was incubated with either (e) C2 or (f) C4 in the presence of C1s. C2 and C4 were cleaved to their active forms C2a (α′30) and C4b (α′83) via C1s as revealed by the cleavage products in Western blot analyses; (g) ApoE3 has no cofactor activity for factor I in the cleavage of C4b to inactive iC4b. ApoE3 was incubated together with factor I, C4BP and C4b, and cleavage products were detected by Western blot analysis as indicated (α′25 and α′13). Full scanned blot images in e,f,g are available from source data figures. Data in a-d represent means ± SEM of three independent experiments. Two-tailed Student's t-test. Data in e,f,g are representative from 3 independent experiments.
Extended Figure 4. ApoE binds to C1q but not to other complement components.
(a) ApoE isoforms bind to the C1 complex, but not to C4 or C2. Biotinylated ApoE was immobilized on streptavidin-coated sensors and incubated with C1 complex, C4, C2, or buffer; (b) The C1 complex binds to immobilized ApoE isoforms. (c) ApoE isoforms bind to C1 and factor H, but not to C3 or C3b; (d) Normal human serum (NHS)-derived C1 binds to immobilized plasma-purified ApoE3 and to recombinant ApoE isoforms; (e) C1q binds to immobilized plasma-purified ApoE3 and to all recombinant ApoE isoforms; (f) Plasma-purified C1q was coated on a sensor chip (CM5) and plasma-derived ApoE (62-1000 nM) was injected into the fluid phase (75 mM NaCl, 5 mM HEPES, 1 mM CaCl2). (g) Mannose-binding lectin (MBL) does not bind to C1q as determined by biolayer interferometry; (h) Apolipoprotein A (ApoA) does not bind to C1q as determined by biolayer interferometry. (i) C1q-ApoE complexes revealed by proximity ligation assay (PLA) on cultured human apoptotic cells (THP-1) were detectable when treated with NHS but not with C1q-depleted serum (dNHS). Data represent mean fluorescence intensity (MFI) ± SEM of 16 cells for each group. Bar 10 µm. Data in b,c,d,e represent means ± SEM of at least three independent experiments. Data a,f,g and h represent means of at least two independent experiments. Two-tailed Student's t-test.
Extended Figure 5. ApoE binds to the activated C1q; LDLR and C1sC1r tetramers do not compete with C1q-ApoE binding.
(a) ApoE-C1q interaction is dependent on Ca2+. Real-time binding of ApoE to C1q was followed using biosensor analyses. Binding of ApoE to C1q is reduced in a dose-dependent manner upon increasing amounts of EGTA (0.1–3 mM); (b-c) co-immunoprecipitation of C1q-ApoE complexes; (b) anti C1q antiserum precipitate C1q-ApoE complexes composed of purified proteins with activated C1q, but not with inactive C1q from NHS. (c) Anti-ApoE antiserum precipitates C1q-ApoE complexes but no complexes from NHS. C1q-ApoE complexes were eluted with glycine buffer, then, C1q or ApoE proteins were separated by SDS-PAGE and immunoblotted using goat anti-C1q antiserum (left panel of b and c) or goat anti ApoE antiserum (right panel of b) separately. Full scanned blot images in b,c are available from source data figures. (d) ApoE peptide 139 – 152 but not ApoE peptide 30 – 40 competes with immobilized ApoE3 for binding to C1q in a dose-dependent manner; (e) C1q antibody binding to C1q is not affected by SDS. (f) C1q and LDLR bind simultaneously to ApoE. 20 nM C1q was incubated with increasing concentrations of LDLR to immobilized ApoE and binding of C1q and LDLR was followed by ELISA. Background binding of anti C1q and anti LDLR antisera to immobilized ApoE were set as 0%; (g) ApoE does not compete with C1sC1r tetramers for binding to C1q. C1q in addition to increasing amounts of C1sC1r tetramers was added to immobilized ApoE3 and C1q binding was determined. Data in d-g represent means ± SEM of at least three independent experiments. Two-tailed Student's t-test. Data in a,b,c are representatives of 3 independent experiments.
Extended Figure 6. Complement constituents in mouse brain.
(a-b) Human ChP sections were stained for C1q (green) / C3 (red) (a) and C1q (green) / ApoE (red) (b); (c-d) ChP sections were stained for CD68+ macrophages/DCs (c) and collagen IV (Col-IV) to mark basement membranes. Phase contrast shows lipid deposits in ChPs; (e) ChP sections were stained for ApoE (green) and factor H (red); no primary antibody as control (NA). (f-g) human brain sections were stained for Aβ (green) / ApoE (red) (left panels), Tau phosphorylation (pTau, green) / ApoE (red) (middle panels), and C1q (green) / ApoE (red) (right panels) (f). Blue for nuclei. No primary antibody as control (g); (h) brain parenchyma sections were stained for C3 (red) / ApoE (green). Bar 100 µm for a-h; Data in a-h are representative images from at least 3 biologically independent samples.
Extended Figure 7. Complement constituents in mouse brain.
(a)16 weeks APPPS1-21 mouse brain sections were stained with Aβ/ApoE complexes (red) by PLA, methoxy X04 for Aβ plaque (blue). High resolution confocal images show the spatial location of Aβ-ApoE complexes and Aβ plaque in 3D view (lower panel). Bars represent 10 µm. (b) Brain sections were stained with methoxy-X04, ApoE, and LAMP1; the size of areas covered by methoxy-X04, ApoE, and LAMP1 was determined. ApoE/X04 and LAMP1/X04 (X04 > 150 µm2) were quantified. n = 123 plaques from 4 control mice, 147 plaques from 5 treated mice. Bars 100 µm. (c) Aβ plaque was stained with methoxy X04 (X04). Number of plaques per section and number of plaque per area were quantified. control (n=4 mice), C5 (n=5). Bar 1000 µm; (d) Total plaque volume was determined in 3D, plaques were further grouped according to the plaque volume. n = 71 random fields from 4 control mice, 88 fields from 5 C5 treated mice. Bar 100 µm; (e) 8-week old C57BL6 brain cortex sections were examined for the presence of C1q-ApoE complexes with methoxy X04. ApoE, or C1q only antisera were used as negative controls. Bar represents 10 µm. Data in a,e are representative images from at least 3 biologically independent mouse samples. Data in b,c,d represent means ± SEM; two-tailed Student's t-test was applied to b,c,d; Two-way ANOVA was applied to c,d.
Extended Figure 8. Complement and atherosclerosis.
(a) Expression microarray analyses of aortas. Heatmaps show GO terms leukocyte migration, complement activation, phagocytosis, and cellular response to lipid. 6 weeks WT (n=3 mice); 32 weeks WT (n=3); 6 weeks ApoE-/- (n=3); 32 weeks ApoE-/- (n=3); (b) aorta alternative complement pathway genes (factor B, factor H, factor D) mRNA expression in 6 weeks and 32 weeks old WT and ApoE-/- mouse aortas. 6 weeks WT (n=3 mice); 32 weeks WT (n=3); 6 weeks ApoE-/- (n=3); 32 weeks ApoE-/- (n=3); (c-d) plasma cholesterol and body weight; (e-f) blood leukocytes and percentage. For c-f, control (11 mice); C5 siRNA (12 mice). (g) blood CD4+ T cells, CD8+ T cells, and B220+ B cells by flow cytometry. Control (6 mice); C5 siRNA (6 mice). (h) super-resolution microscopy shows colocalization of C1q (green) and ApoE (red) in human atherosclerotic plaque. Representative images from at least 3 biologically independent mouse samples. Bar 5 µm. Data in b,c,d,e,f,g represent means ± SEM; Two-tailed Student's t-test was applied to c.d.e.f.g; one-way ANOVA with Tukey posttest was applied to b; abbreviations: WBC, white blood cells; RBC, red blood cells; PLT, platelets; LYM, lymphocytes; MO, monocytes; GRA, granulocytes. Gene names and statistics in supplementary Table 8.
Extended Figure 9. Graphical presentation of the body of in vivo data.
(a) Pleiotropic impacts of single ApoE or single C1q molecules in brain as reported by others. Microglia cells are the major source of brain C1q. In response to Aβ plaques, resting microglia cells differentiate into plaque-associated microglia cells. Single actions of ApoE and C1q have been reported to be involved in multiple pathways as indicated in the Figure. Inactive C1q (yellow), activated C1q (red). (b) Graphical presentation of the body of in vivo data. Three types of unresolvable inflammatory conditions were studied in 7 mouse models and in translational studies of human tissues, i.e. choroid plexus, aorta, and brain parenchyma.
Supplementary Material
Acknowledgements
We thank Wolfgang Schneider, Medical University of Vienna, Austria, for advice; Teresia Hallström, Yuchen Lin, and Steffi Hälbich, Leibniz Institute for Natural Product Research and Infection Biology, Jena, for performing complement assays; Wolfgang Wilfert, Institute of Laboratory Medicine, University of Munich for lipid analyses; Silvio Schmidt, Institute for Experimental Neurology, Jena, for advice; and Norbert Buresch, Center for Neuropathology and Prion Research, Munich, for technical assistance; Mathias Jucker, Hertie Institute for Clinical Brain Research, University of Tübingen, for experimental support. This work was funded by the Deutsche Forschungsgemeinschaft (DFG): YI 133/2-1 to C.Y.; HA 1083/15-4 to A.J.R.H.; MO 3054/1-1 to S.M.; The German Collaborative Research Center (CRC124/2-C4), SK46/2 to C.S.; CRC124/2-C6 and DFG TR 1992 to P.F.Z.; the German Centre for Cardiovascular Research (DZHK MHA VD1.2), DFG SFB 1123/A1 and Z3, the European Research Council (ERC AdG 692511) to C.W.; SFB1123/Z01, INST409/150-1 FUGG to R.T.A.M.; Chinese National Natural Science Foundation (31770983) to D.H.; S.A. and L.D.H. are doctoral researchers at the International Leibniz Research School (ILRS) in Jena.
Footnotes
Data Availability Statement
All microarray data can be found at the GEO database via accession number GSE85774 and GSE85775 for ChPs. Microarray data for aorta had been published previously with the accession number GSE4015657. The remaining of the source data for figures in the manuscript will be made available upon request.
Author contributions: These authors contributed equally: C.W., P.F.Z., C.S., and A.J.R.H.; C.Y. and A.J.R.H. designed and performed experiments and wrote the manuscript; S.A., P.F.Z., C.S. designed and performed experiments and contributed to writing the manuscript; C.W. provided critical intellectual input for experimental design and wrote the manuscript; A.B. provided the C5 siRNA; Z.M., S.K.M., C.Z., Y.L., S.N., M.W., L.P., D.H., S.V.B., P.S., M.B., R.T.A.M., S.S., M.H., L.D.H., H.-H.E., J.P., J.H., S.R., T.A., L.H., and C.J.B. performed experiments or analyzed the data.
Competing Interests Statement
C.Y., A.J.R.H., A.B., S.K.M., S.A., P.F.Z., and C.S. declare competing financial interests. C.Y., S.K.M., and A.J.R.H. are owners of Easemedcontrol R & D GmbH & Co KG Munich, Germany; A.B. is employed by Alnylam Pharmaceuticals Cambridge; Cambridge, MA, USA; C.Y. and A.J.R.H. have been named inventors on a pending patent application related to treatment and diagnosis of unresolvable inflammatory diseases (EP18183584.4); A.B. has been named as an inventor on patent applications related to C5 including PCT publication WO2014160129, and applications and patents based thereon; S.A., P.F.Z., and C.S. have been named inventors on a pending patent application (DE 10 2018 100 377.3).
References
- 1.Bell RD, et al. Apolipoprotein E controls cerebrovascular integrity via cyclophilin A. Nature. 2012;485:512–516. doi: 10.1038/nature11087. [DOI] [PMC free article] [PubMed] [Google Scholar]
- 2.Holtzman DM, Herz J, Bu G. Apolipoprotein E and apolipoprotein E receptors: normal biology and roles in Alzheimer disease. Cold Spring Harb Perspect Med. 2012;2 doi: 10.1101/cshperspect.a006312. a006312. [DOI] [PMC free article] [PubMed] [Google Scholar]
- 3.Kanekiyo T, Xu H, Bu G. ApoE and Aβ in Alzheimer’s disease: accidental encounters or partners? Neuron. 2014;81:740–754. doi: 10.1016/j.neuron.2014.01.045. [DOI] [PMC free article] [PubMed] [Google Scholar]
- 4.Linton MF, Atkinson JB, Fazio S. Prevention of atherosclerosis in apolipoprotein E-deficient mice by bone marrow transplantation. Science. 1995;267:1034–1037. doi: 10.1126/science.7863332. [DOI] [PubMed] [Google Scholar]
- 5.Mahley RW, Weisgraber KH, Huang Y. Apolipoprotein E: structure determines function, from atherosclerosis to Alzheimer's disease to AIDS. J Lipid Res. 2009;50(Suppl):S183–188. doi: 10.1194/jlr.R800069-JLR200. [DOI] [PMC free article] [PubMed] [Google Scholar]
- 6.Zlokovic BV. Cerebrovascular effects of apolipoprotein E: implications for Alzheimer disease. JAMA Neurol. 2013;70:440–444. doi: 10.1001/jamaneurol.2013.2152. [DOI] [PMC free article] [PubMed] [Google Scholar]
- 7.Mahley RW, Huang Y. Apolipoprotein E sets the stage: response to injury triggers neuropathology. Neuron. 2012;76:871–885. doi: 10.1016/j.neuron.2012.11.020. [DOI] [PMC free article] [PubMed] [Google Scholar]
- 8.Hansson GK, Hermansson A. The immune system in atherosclerosis. Nat Immunol. 2011;12:204–212. doi: 10.1038/ni.2001. [DOI] [PubMed] [Google Scholar]
- 9.Que X, et al. Oxidized phospholipids are proinflammatory and proatherogenic in hypercholesterolaemic mice. Nature. 2018;558:301–306. doi: 10.1038/s41586-018-0198-8. [DOI] [PMC free article] [PubMed] [Google Scholar]
- 10.Goldmann T, et al. Origin, fate and dynamics of macrophages at central nervous system interfaces. Nat Immunol. 2016;17:797–805. doi: 10.1038/ni.3423. [DOI] [PMC free article] [PubMed] [Google Scholar]
- 11.Lun MP, Monuki ES, Lehtinen MK. Development and functions of the choroid plexus-cerebrospinal fluid system. Nat Rev Neurosci. 2015;16:445–457. doi: 10.1038/nrn3921. [DOI] [PMC free article] [PubMed] [Google Scholar]
- 12.Moore GR, et al. Complement and humoral adaptive immunity in the human choroid plexus: roles for stromal concretions, basement membranes, and epithelium. J Neuropathol Exp Neurol. 2016;75:415–428. doi: 10.1093/jnen/nlw017. [DOI] [PMC free article] [PubMed] [Google Scholar]
- 13.Ransohoff RM, Engelhardt B. The anatomical and cellular basis of immune surveillance in the central nervous system. Nat Rev Immunol. 2012;12:623–635. doi: 10.1038/nri3265. [DOI] [PubMed] [Google Scholar]
- 14.Schwartz M, Baruch K. The resolution of neuroinflammation in neurodegeneration: leukocyte recruitment via the choroid plexus. EMBO J. 2014;33:7–22. doi: 10.1002/embj.201386609. [DOI] [PMC free article] [PubMed] [Google Scholar]
- 15.Baruch K, et al. Aging. Aging-induced type I interferon response at the choroid plexus negatively affects brain function. Science. 2014;346:89–93. doi: 10.1126/science.1252945. [DOI] [PMC free article] [PubMed] [Google Scholar]
- 16.Binder CJ, Papac-Milicevic N, Witztum JL. Innate sensing of oxidation-specific epitopes in health and disease. Nat Rev Immunol. 2016;16:485–497. doi: 10.1038/nri.2016.63. [DOI] [PMC free article] [PubMed] [Google Scholar]
- 17.Weismann D, et al. Complement factor H binds malondialdehyde epitopes and protects from oxidative stress. Nature. 2011;478:76–81. doi: 10.1038/nature10449. [DOI] [PMC free article] [PubMed] [Google Scholar]
- 18.Zipfel PF, Skerka C. Complement regulators and inhibitory proteins. Nat Rev Immunol. 2009;9:729–740. doi: 10.1038/nri2620. [DOI] [PubMed] [Google Scholar]
- 19.Arlaud GJ, Biro A, Ling WL. Enzymatically modified low-density lipoprotein is recognized by C1q and activates the classical complement pathway. Journal of Lipids. 2011;2011 doi: 10.1155/2011/376092. 376092. [DOI] [PMC free article] [PubMed] [Google Scholar]
- 20.Haapasalo K, et al. Complement factor H binds to human serum apolipoprotein E and mediates complement regulation on high density lipoprotein particles. J Biol Chem. 2015;290:28977–28987. doi: 10.1074/jbc.M115.669226. [DOI] [PMC free article] [PubMed] [Google Scholar]
- 21.Wilson C, et al. Three-dimensional structure of the LDL receptor-binding domain of human apolipoprotein E. Science. 1991;252:1817–1822. doi: 10.1126/science.2063194. [DOI] [PubMed] [Google Scholar]
- 22.Venkatraman Girija U, et al. Structural basis of the C1q/C1s interaction and its central role in assembly of the C1 complex of complement activation. Proc Natl Acad Sci U S A. 2013;110:13916–13920. doi: 10.1073/pnas.1311113110. [DOI] [PMC free article] [PubMed] [Google Scholar]
- 23.Braak H, et al. Staging of Alzheimer disease-associated neurofibrillary pathology using paraffin sections and immunocytochemistry. Acta Neuropathol. 2006;112:389–404. doi: 10.1007/s00401-006-0127-z. [DOI] [PMC free article] [PubMed] [Google Scholar]
- 24.Thal DR, Rüb U, Orantes M, Braak H. Phases of Aβ-deposition in the human brain and its relevance for the development of AD. Neurology. 2002;58:1791–1800. doi: 10.1212/wnl.58.12.1791. [DOI] [PubMed] [Google Scholar]
- 25.Soderberg O, et al. Direct observation of individual endogenous protein complexes in situ by proximity ligation. Nat Meth. 2006;3:995–1000. doi: 10.1038/nmeth947. [DOI] [PubMed] [Google Scholar]
- 26.Strittmatter WJ, et al. Isoform-specific interactions of apolipoprotein E with microtubule-associated protein tau: implications for Alzheimer disease. Proc Natl Acad Sci U S A. 1994;91:11183–11186. doi: 10.1073/pnas.91.23.11183. [DOI] [PMC free article] [PubMed] [Google Scholar]
- 27.Radde R, et al. Aβ42-driven cerebral amyloidosis in transgenic mice reveals early and robust pathology. EMBO reports. 2006;7:940–946. doi: 10.1038/sj.embor.7400784. [DOI] [PMC free article] [PubMed] [Google Scholar]
- 28.Grabner R, et al. Lymphotoxin beta receptor signaling promotes tertiary lymphoid organogenesis in the aorta adventitia of aged ApoE-/- mice. J Exp Med. 2009;206:233–248. doi: 10.1084/jem.20080752. [DOI] [PMC free article] [PubMed] [Google Scholar]
- 29.Stary HC. Natural history and histological classification of atherosclerotic lesions: an update. Arterioscler Thromb Vasc Biol. 2000;20:1177–1178. doi: 10.1161/01.atv.20.5.1177. [DOI] [PubMed] [Google Scholar]
- 30.Hong S, et al. Complement and microglia mediate early synapse loss in Alzheimer mouse models. Science. 2016;352:712–716. doi: 10.1126/science.aad8373. [DOI] [PMC free article] [PubMed] [Google Scholar]
- 31.Stevens B, et al. The classical complement cascade mediates CNS synapse elimination. Cell. 2007;131:1164–1178. doi: 10.1016/j.cell.2007.10.036. [DOI] [PubMed] [Google Scholar]
- 32.Kolev M, Friec GL, Kemper C. Complement - tapping into new sites and effector systems. Nat Rev Immunol. 2014;14:811–820. doi: 10.1038/nri3761. [DOI] [PubMed] [Google Scholar]
- 33.Vasek MJ, et al. A complement–microglial axis drives synapse loss during virus-induced memory impairment. Nature. 2016;534:538–543. doi: 10.1038/nature18283. [DOI] [PMC free article] [PubMed] [Google Scholar]
- 34.Hajishengallis G, et al. Novel mechanisms and functions of complement. Nat Immunol. 2017;18:1288–1298. doi: 10.1038/ni.3858. [DOI] [PMC free article] [PubMed] [Google Scholar]
- 35.Dinarello CA. Anti-inflammatory agents: present and future. Cell. 2010;140:935–950. doi: 10.1016/j.cell.2010.02.043. [DOI] [PMC free article] [PubMed] [Google Scholar]
- 36.Ricklin D, Lambris JD. Complement in immune and inflammatory disorders: pathophysiological mechanisms. J Immunol. 2013;190 doi: 10.4049/jimmunol.1203487. [DOI] [PMC free article] [PubMed] [Google Scholar]
- 37.Tabas I, Glass CK. Anti-inflammatory therapy in chronic disease: challenges and opportunities. Science. 2013;339:166–172. doi: 10.1126/science.1230720. [DOI] [PMC free article] [PubMed] [Google Scholar]
- 38.Fonseca MI, Zhou J, Botto M, Tenner AJ. Absence of C1q leads to less neuropathology in transgenic mouse models of Alzheimer's disease. The Journal of Neuroscience. 2004;24:6457–6465. doi: 10.1523/JNEUROSCI.0901-04.2004. [DOI] [PMC free article] [PubMed] [Google Scholar]
- 39.Huang YA, Zhou B, Wernig M, Sudhof TC. ApoE2, ApoE3, and ApoE4 differentially stimulate APP transcription and Abeta secretion. Cell. 2017;168:427–441 e421. doi: 10.1016/j.cell.2016.12.044. [DOI] [PMC free article] [PubMed] [Google Scholar]
- 40.Shi Y, et al. ApoE4 markedly exacerbates tau-mediated neurodegeneration in a mouse model of tauopathy. Nature. 2017;549:523–527. doi: 10.1038/nature24016. [DOI] [PMC free article] [PubMed] [Google Scholar]
- 41.Bales KR, et al. Lack of apolipoprotein E dramatically reduces amyloid beta-peptide deposition. Nat Genet. 1997;17:263–264. doi: 10.1038/ng1197-263. [DOI] [PubMed] [Google Scholar]
- 42.Huynh TV, et al. Age-dependent effects of apoE reduction using antisense oligonucleotides in a model of beta-amyloidosis. Neuron. 2017;96:1013–1023.e1014. doi: 10.1016/j.neuron.2017.11.014. [DOI] [PMC free article] [PubMed] [Google Scholar]
- 43.Liu CC, et al. ApoE4 accelerates early seeding of amyloid pathology. Neuron. 2017;96:1024–1032.e1023. doi: 10.1016/j.neuron.2017.11.013. [DOI] [PMC free article] [PubMed] [Google Scholar]
- 44.Ulrich JD, et al. ApoE facilitates the microglial response to amyloid plaque pathology. J Exp Med. 2018;215:1047–1058. doi: 10.1084/jem.20171265. [DOI] [PMC free article] [PubMed] [Google Scholar]
- 45.Wang C, et al. Gain of toxic apolipoprotein E4 effects in human iPSC-derived neurons is ameliorated by a small-molecule structure corrector. Nat Med. 2018;24:647–657. doi: 10.1038/s41591-018-0004-z. [DOI] [PMC free article] [PubMed] [Google Scholar]
- 46.Tenner AJ, Stevens B, Woodruff TM. New tricks for an ancient system: Physiological and pathological roles of complement in the CNS. Mol Immunol. 2018 doi: 10.1016/j.molimm.2018.06.264. [DOI] [PMC free article] [PubMed] [Google Scholar]
- 47.Qiu C, Fratiglioni L. A major role for cardiovascular burden in age-related cognitive decline. Nat Rev Cardiol. 2015;12:267–277. doi: 10.1038/nrcardio.2014.223. [DOI] [PubMed] [Google Scholar]
- 48.Hofman A, et al. Atherosclerosis, apolipoprotein E, and prevalence of dementia and Alzheimer's disease in the Rotterdam Study. Lancet. 1997;349:151–154. doi: 10.1016/S0140-6736(96)09328-2. [DOI] [PubMed] [Google Scholar]
- 49.Macedo ACL, Isaac L. Systemic lupus erythematosus and deficiencies of early components of the complement classical pathway. Frontiers in Immunology. 2016;7 doi: 10.3389/fimmu.2016.00055. [DOI] [PMC free article] [PubMed] [Google Scholar]
- 50.Zhang B, et al. Integrated systems approach identifies genetic nodes and networks in late-onset Alzheimer's disease. Cell. 2013;153:707–720. doi: 10.1016/j.cell.2013.03.030. [DOI] [PMC free article] [PubMed] [Google Scholar]
- 51.Knouff C, et al. Apo E structure determines VLDL clearance and atherosclerosis risk in mice. J Clin Invest. 1999;103:1579–1586. doi: 10.1172/JCI6172. [DOI] [PMC free article] [PubMed] [Google Scholar]
- 52.Alafuzoff I, et al. Staging of neurofibrillary pathology in Alzheimer's disease: a study of the BrainNet Europe Consortium. Brain Pathol. 2008;18:484–496. doi: 10.1111/j.1750-3639.2008.00147.x. [DOI] [PMC free article] [PubMed] [Google Scholar]
- 53.Alafuzoff I, et al. Assessment of beta-amyloid deposits in human brain: a study of the BrainNet Europe Consortium. Acta Neuropathol. 2009;117:309–320. doi: 10.1007/s00401-009-0485-4. [DOI] [PMC free article] [PubMed] [Google Scholar]
- 54.Hyman BT, et al. National Institute on Aging-Alzheimer's Association guidelines for the neuropathologic assessment of Alzheimer's disease. Alzheimers Dement. 2012;8:1–13. doi: 10.1016/j.jalz.2011.10.007. [DOI] [PMC free article] [PubMed] [Google Scholar]
- 55.Timaran CH, McKinsey JF, Schneider PA, Littooy F. Reporting standards for carotid interventions from the Society for Vascular Surgery. J Vasc Surg. 2011;53:1679–1695. doi: 10.1016/j.jvs.2010.11.122. [DOI] [PubMed] [Google Scholar]
- 56.Abbott AL, et al. Systematic Review of Guidelines for the Management of Asymptomatic and Symptomatic Carotid Stenosis. Stroke. 2015;46:3288–3301. doi: 10.1161/STROKEAHA.115.003390. [DOI] [PubMed] [Google Scholar]
- 57.Hu D, et al. Artery Tertiary Lymphoid Organs Control Aorta Immunity and Protect against Atherosclerosis via Vascular Smooth Muscle Cell Lymphotoxin β Receptors. Immunity. 2015;42:1100–1115. doi: 10.1016/j.immuni.2015.05.015. [DOI] [PMC free article] [PubMed] [Google Scholar]
- 58.Greissel A, et al. Alternation of histone and DNA methylation in human atherosclerotic carotid plaques. Thromb Haemost. 2015;114:390–402. doi: 10.1160/TH14-10-0852. [DOI] [PubMed] [Google Scholar]
- 59.Wendorff C, et al. Carotid Plaque Morphology Is Significantly Associated With Sex, Age, and History of Neurological Symptoms. Stroke. 2015;46:3213–3219. doi: 10.1161/STROKEAHA.115.010558. [DOI] [PubMed] [Google Scholar]
- 60.Franklin K, George P. The Mouse Brain in Stereotaxic Coordinates, Compact. (3rd Edition) 2007 [Google Scholar]
- 61.Zhao L, et al. The 5-lipoxygenase pathway promotes pathogenesis of hyperlipidemia-dependent aortic aneurysm. Nat Med. 2004;10:966–973. doi: 10.1038/nm1099. [DOI] [PubMed] [Google Scholar]
- 62.Haege S, et al. CXC Chemokine Receptor 7 (CXCR7) Regulates CXCR4 Protein Expression and Capillary Tuft Development in Mouse Kidney. PLoS ONE. 2012;7 doi: 10.1371/journal.pone.0042814. e42814. [DOI] [PMC free article] [PubMed] [Google Scholar]
- 63.Yin C, et al. Generation of Aorta Transcript Atlases of Wild-Type and Apolipoprotein E-null Mice by Laser Capture Microdissection-Based mRNA Expression Microarrays. Methods Mol Biol. 2015;1339:297–308. doi: 10.1007/978-1-4939-2929-0_20. [DOI] [PubMed] [Google Scholar]
- 64.Beer M, et al. Laser-capture microdissection of hyperlipidemic/ApoE-/- mouse aorta atherosclerosis. Methods Mol Biol. 2011;755:417–428. doi: 10.1007/978-1-61779-163-5_35. [DOI] [PubMed] [Google Scholar]
- 65.Koch TK, et al. Staphylococcus aureus proteins Sbi and Efb recruit human plasmin to degrade complement C3 and C3b. PLoS One. 2012;7 doi: 10.1371/journal.pone.0047638. e47638. [DOI] [PMC free article] [PubMed] [Google Scholar]
Associated Data
This section collects any data citations, data availability statements, or supplementary materials included in this article.


