

Abstract
Intestinal absorption of ascorbic acid (AA) occurs via a Na+-dependent carrier-mediated process facilitated through the human sodium-dependent vitamin C transporters-1 &−2 (hSVCT1 and hSVCT2). Many studies have shown that hSVCT1 (product of the SLC23A1 gene) is expressed on the apical membrane of polarized enterocytes where it mediates AA absorption. hSVCT1 expression levels are therefore an important determinant of physiological vitamin C homeostasis. However, little is known about posttranscriptional mechanisms that regulate hSVCT1 expression in intestinal epithelia. In this study, we investigated regulation of hSVCT1 by microRNA (miRNA). A pmirGLO-SLC23A1-3′-UTR construct transfected into human intestinal cell lines (Caco-2 and NCM460 cells) showed markedly reduced luciferase activity. Bioinformatic analysis of the SLC23A1-3′-UTR predicted five miRNA binding sites (miR-103a, miR-107, miR-328, miR-384, and miR-499-5p) in the 3′-UTR. Expression of mature miR-103a was markedly higher compared to the other four putative miRNA regulators in both intestinal cell lines and mouse jejunal mucosa. Addition of a miR-103a mimic, but not a miR-103a mutant construct, markedly reduced the luminescence of the pmirGLO-SLC23A1-3′-UTR reporter. Reciprocally, addition of a miR-103a inhibitor significantly increased luciferase reporter activity. Addition of the miR-103a mimic led to a significant inhibition in AA uptake, associated with decreased hSVCT1 mRNA and protein expression in Caco-2 cells. In contrast, the miR-103a inhibitor increased AA uptake, associated with increased levels of hSVCT1 mRNA and protein. These findings provide the first evidence for posttranscriptional regulation of hSVCT1 by miRNA in intestinal epithelial cells.
Keywords: Vitamin C, SLC23A1, microRNA, transport, regulation, intestinal epithelia
1. Introduction
Vitamin C (ascorbic acid, AA) is an essential micronutrient needed for numerous cellular functions. This vitamin is a potent antioxidant and scavenger of free radicals and serves as a cofactor for several important enzymatic reactions [1]. Vitamin C deficiency can occur in settings where absorption and handling of this micronutrient is impaired: for example, within the elderly population, alcoholics and smokers [2–4]. Optimal vitamin C body homeostasis appears to protect against gallbladder diseases, cardiovascular disease, cancer, osteoporosis and cataract formation [5–8]. A growing body of evidence implicates vitamin C deficiency as a contributing factor in the pathogenesis of inflammatory bowel disease (IBD) [9, 10].
Humans have lost the ability to synthesis vitamin C endogenously due to the absence of the enzyme, gulonolactone oxidase (GLO), which catalyzes the last enzymatic step in ascorbate synthesis [11]. Humans therefore obtain vitamin C via intestinal absorption. Vitamin C exists in two forms as ascorbic acid (AA; reduced active form) and dehydroascorbic acid (DHA; oxidized form). Absorption of AA by intestinal epithelial cells occurs via a Na+-dependent carrier-mediated process that involves two human sodium-dependent vitamin C transporters −1 and −2 (hSVCT1 and hSVCT2, products of SLC23A1 and SLC23A2 genes, respectively) [12–14]. Both vitamin C transporters are expressed in the intestinal epithelial cells with hSVCT1 and hSVCT2 differentially targeted to the apical and basolateral membrane domains, respectively [15–17].
Recent studies have begun to decipher how the vitamin C uptake process is transcriptionally regulated, assisted by the cloning and characterization of the 5′-regulatory regions containing the promoters of the SLC23A1 and SLC23A2 genes [18, 19]. Much less is known about posttranscriptional regulation of SLC23A1, including the role of microRNAs (miRNA) in expression of this transport system in the gut. miRNAs are a class of small non-coding RNA molecules that regulate gene expression by binding to the 3′-untranslated region (3′-UTR) of their target mRNAs to suppress translation and/or regulate degradation [20–25]. Expression of miRNA is tissue-specific, and this localized expression is important for their tailored roles in development and regionalized function [26]. miRNAs play important roles in posttranscriptional regulation of many genes including several water-soluble vitamin transporter genes (SLC23A2, SLC19A2, SLC52A3, SLC26A3 and SLC15A1) [20, 21, 22, 24, 25, 27]. In the intestine, non-coding miRNAs also play roles in differentiation, cell migration, and barrier function [28]. Intriguingly, the expression patterns of intestinal miRNAs are altered in various intestinal diseases, including small bowel syndrome and IBD [29–32].
Here, we have examined the role of miRNAs in posttranscriptional regulation of hSVCT1 and vitamin C uptake using intestinal epithelial cell lines. Results demonstrate a regulation of hSVCT1 by miR-103a which interacts with the 3′-UTR region of SLC23A1 to decrease transcription and lower AA uptake.
2. Materials and methods
2.1. Materials
14C-AA (specific activity 2.8 mCi/mmol; radiochemical purity > 97%) was from Perkin Elmer (Boston MA). Caco-2 and NCM460 cells were from American Type Culture Collection (ATCC, Manassas, VA) and INCELL (San Antonio, TX), respectively. Primers for PCR amplifications, microRNA mimics and inhibitors were from Sigma (Sigma, St. Louis, MO/Thermo Fisher, Huntington Beach, CA). TaqMan probes and primers for mature microRNAs amplification were from Applied Biosystems (Foster City, CA). The monoclonal hSVCT1 antibody was from Santa Cruz Biotechnology Inc., (Santa Cruz, CA).
2.2. Generation of 3′-UTR reporter constructs for SLC23A1
A full length (453bp) and truncated fragments (322 and 240bp) of the SLC23A1-3′-UTR were amplified from human intestinal cDNA (Clontech, CA) by PCR. These sequences were cloned using primer sequences containing the XhoI and SalI sites into the multiple cloning site of the pmirGLO vector (Promega, Madison, WI; Table 1) as described previously [25]. The cloned full-length and truncated pmirGLO- SLC23A1-3′-UTR constructs were confirmed by DNA sequencing (Laragen, CA).
Table 1.
Combination of primers used in this study
| Gene name | Forward and Reverse Primers (5′-3′) |
|---|---|
| Primers used for cloning SLC23A1-3-UTR and truncations in pmirGLO vector | |
| SLC23A1 (1-453) | CCGCTCGAGATGACTTCCAGGAAAGGAA; |
| GCGTCGACATTTCTTCAACATGATGTTTA | |
| SLC23A1(1-322) | CCGCTCGAGATGACTTCCAGGAAAGGAA; |
| GCGTCGACTTTCAACTTGCAGTCTAA | |
| SLC23A1 (1-240) | CCGCTCGAGATGACTTCCAGGAAAGGAA; |
| GCGTCGACAAGATTTAGAGACATAGC | |
| Real-time PCR | |
| hSVCT1 | TCATCCTCTTCTCCCAGTACCT; AGAGCAGCCACACGGTCAT |
| hβ-actin | CATCCTGCGTCTGGACCT; TAATGTCACGCACGATTTCC |
| Site-directed mutagensis | |
| miR-103a | |
| CCAGGGCCTGAAATGTAGGTGTACCACAAGGCTTTTACATTGAATTTG; | |
| CAAATTCAATGTAAAAGCCTTGTGGTACACCTACATTTCAGGCCCTGG | |
Bold italics XhoI; Bold face Sal I
2.3. Bioinformatic analyses
The commonly used prediction algorithms TargetScan (http://www.targetscan.org/), MicroCosm Targets (http://www.ebi.ac.uk/enright-srv/microcosm/htdocs/targets/v5/) and microRNA.org (http://www.microRNA.org/microrna/home.do) were used to identify putative miRNAs targeting the SLC23A1-3′-UTR (hSVCT1) [20, 21, 25, 33]. The putative regulatory miRNAs were prioritized based on their target/free energy scores (Table 2) as well as their expression levels within the intestine [34–39].
Table 2.
The context score and context score percentile based on TargetScan 7.1 program for predicted miRNAs to target 3′-UTR of SLC23A1.
| miRNAs name | Context score | Context score Percentile | Conserved branch length | Binding position in SLC23A1-3′-UTR |
|---|---|---|---|---|
| miR-103/107 | −0.40 | 98 | 0.32 | 372-379 |
| miR-328 | −0.28 | 94 | 2.02 | 186-192 |
| miR-384 | −0.15 | 90 | 0.22 | 271-277 |
| miR-499-5p | −0.07 | 65 | 0.55 | 199-205 |
2.4. Site-directed mutagenesis
Site-directed mutations were carried out in the miR-103a binding site of SLC23A1-3′-UTR using the Quick-change XL site-directed mutagenesis kit (Agilent, La Jolla, CA) and a mutant primer set (Table 1) as described previously [25]. The specific mutation in the SLC23A1-3′-UTR (103a binding site) were verified by DNA sequencing (Laragen, CA).
2.5. Cell culture, transient transfection, and luciferase assay
Human intestinal epithelial Caco-2 cells and human-derived colonic epithelial NCM460 cells were grown in Eagle’s minimal essential medium (EMEM) and Ham’s F-12 culture medium, respectively. Media was supplemented with fetal bovine serum (10% for Caco-2 cells and 20% for NCM460), penicillin, and streptomycin at 37°C in 5% CO2-95% air environment in T-75 flasks. Caco-2 and NCM460 cells, grown in 12 well plates, were transiently transfected with 1.5μg of full-length or truncated pmirGLO-SLC23A1-3´-UTR or pmirGLO vector alone. The Caco-2 cells were transiently transfected with 1.5μg of pmirGLO-SLC23A1-3′-UTR or pmirGLO-SLC23A1-3′-UTR [103a mutant] in combination with 20 nM of different miRNA mimics (miR-103a, miR-107, miR-328, miR-384 and miR-499-5p), or a negative control miRNA mimic (Sigma /Thermo Fisher). For inhibitor experiments, Caco-2 cells were transiently transfected with 1.5μg of pmirGLO-SLC23A1-3´-UTR, or pmirGLO-SLC23A1-3´-UTR [103a mutant], in combination with miR-103a inhibitor or negative control miRNA inhibitor (50 nM; Sigma, St. Louis, MO/Thermo Fisher). Lipofectamine 2000 (Invitrogen, Carlsbad, CA) was used for transfecting miRNA mimics/inhibitor and/or the negative control mimic/inhibitor along with plasmids (SLC23A1-3′-UTR or pmirGLO vector). RNAiMax reagent (Invitrogen) was used for transfecting mimic/inhibitor or negative control mimic/inhibitor in Caco-2 cells. After 48h of post-transfection, cells were lysed in passive lysis buffer (Promega) and luciferase activity was measured using a dual luciferase assay kit (Promega). The 3′-UTR activity on the luciferase reporter gene was calculated as a ratio of firefly luciferase to renilla luciferase luminescence and expressed as percentage of relative luciferase units of control samples.
2.6. 14C-AA uptake
AA uptake by confluent Caco-2 monolayers treated with either miRNA mimic or inhibitor was performed as described previously [40, 41]. Briefly, Caco-2 cells were incubated in Krebs-Ringer (K-R) buffer (pH 7.4) at 37°C in the presence of 14C-AA (0.4μCi/ml) for 30 min. Monolayers were washed twice with ice-cold K-R buffer after this incubation period, before cells were lysed with NaOH followed by a neutralization with HC1. Radioactivity was measured using liquid scintillation counting (Beckman Coulter).
2. 7. Real-time PCR (RT-qPCR)
Total RNA 2μg) isolated from Caco-2 cells was used to synthesize cDNA using i-Script reverse transcriptase kit (Bio-Rad, CA). These samples were used for quantitative real-time PCR (RT-qPCR) analyses with hSVCT1 or human β-actin (hβ-actin) specific primers (Table 1) as reported previously [40, 41]. hSVCT1 mRNA expression level was normalized relative to hβ-actin as a representative house-keeping gene and quantified by ΔΔCt method [42].
2.8. Quantification of mature miRNA expression
To quantify expression levels of mature miRNAs, total RNA was isolated from Caco-2, NCM460 cell lines and mouse jejunal mucosa (C57BL/6J wild-type, 4-6 weeks old male mice were euthanized by cervical dislocation and jejunum was removed, washed with cold PBS, then longitudinally opened to separate the mucosa) using the miRNeasy mini kit (Qiagen, Germantown, MD). Total RNA (lOng) was reverse transcribed using the TaqMan microRNA reverse transcription kit (Applied Biosystems, Foster city, CA) to synthesize cDNA. The reverse-transcription primers used for cDNA synthesis were provided within the TaqMan miRNA assay kit (Applied Biosystems). Mature miRNA levels [miR-103a (assay ID 000439), miR-107 (assay ID 000443), miR-328 (assay ID 000543), miR-384 (assay ID 000574) and miR-499-5p (assay ID 001352)] in Caco-2, NCM460 cell lines, and mouse jejunum were quantified utilizing TaqMan probes and Universal PCR master mix (Applied Biosystems). The constitutively expressed RNU6B miRNA (assay ID 001093) supplied by Applied Biosystems was used as a representative house-keeping gene. Animal use in this study was approved by the Institutional Animal Care and Use Committee (IACUC) at the Veterans Affairs Medical Center, Long Beach, CA.
2.9. Western blot analysis
Protein samples were isolated from ‘103a mimic’ or ‘103a inhibitor’ transfected Caco-2 cells as described previously [40, 41]. To determine the hSVCT1 expression level, 60 μg of total protein was loaded onto a NuPAGE 4-12% mini gel (Invitrogen). After separation, the gel was transferred to polyvinylidene difluoride (PVDF) membranes. To minimize non-specific binding, the blot was blocked with Odyssey blocking buffer (LI-COR Biosciences, Lincoln, NE) and membranes were probed with hSVCT1 (1:200 dilution) and hβ-actin (1:3000 dilution) antibodies. The membranes were then washed three times (7 min each) with a wash buffer containing PBS and 0.01% Tween-20. Subsequently, the PVDF membranes were probed with corresponding secondary antibodies (1:30000, anti-rabbit IRDye 800 and/or anti-mouse IRDye 680; LI-COR Biosciences) for 1 h at room temperature. Fluorescence of immunoreactive bands was visualized using Odyssey infrared imaging system and specific band intensity was quantified using Odyssey application software [LI-COR Biosciences, (version 3.0)].
2.10. Statistical analyses
AA uptake data represent mean ± SE of at least three independently transfected experiments. Uptake was expressed as percentage relative to levels achieved with simultaneously performed negative controls. The carrier-mediated AA uptake process was determined by subtracting uptake of 14C-AA in the presence of 1 mM of unlabeled AA from uptake in its absence. Statistical significance was determined using the student’s t-test with the cutoff for statistical significance set at P < 0.05. Quantification of luciferase assays, western blotting and RT-qPCR analyses are expressed as mean ± SE of at least three independent experiments from different batches of cells.
3. Results
3.1. SLC23A1-3′-UTR regulates luciferase expression in intestinal cell lines
To determine whether the SLC23A1-3′-UTR is a target for miRNAs in intestinal epithelial cells, we generated a reporter construct in which the firefly luciferase gene (from the pmirGLO dual luciferase miRNA target expression vector) was ligated to full-length SLC23A1-3′-UTR (453bp). When the cloned construct (pmirGLO-SLC23A1-3′-UTR) was expressed in intestinal epithelial cells, results revealed a significant decrease in luciferase activity for the pmirGLO-SLC23A1-3′-UTR construct in both Caco-2 and NCM460 cells (P < 0.01 for both cell lines) compared to cells transfected with pmirGLO empty vector (Fig. 1). These results suggest that miRNAs may regulate the SLC23A7-3′-UTR.
Fig. 1. Effect of cloned pmirGLO-SLC23A1-3′-UTR construct on firefly luciferase activity:
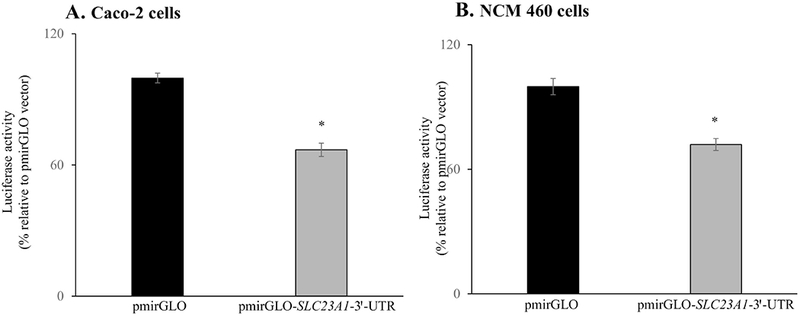
(A) Caco-2 and (B) NCM460 cells were transiently transfected with pmirGLO vector or the pmirGLO-SLC23A1-3′-UTR construct. After 48 h of transfection, cells were used for determining the luciferase activities as described in the “Methods”. Data are mean ± SE of 3-5 independent experiments (*P < 0.01).
3.2. MiRNAs that target the SLC23A1-3′-UTR and their expression in Caco-2, NCM460 cell lines and mouse jejunum mucosa
To identify miRNAs that may regulate SLC23A1 (hSVCT1) expression, we utilized three bioinformatic algorithms (TargetScan, microcosm, miRbase [20, 21, 25, 33]) to predict miRNAs that may bind within the SLC23A1-3′-UTR. These prediction programs identified five potential miRNA interactors and three putative binding sites in the SLC23A1-3′-UTR (Fig. 2A). These miRNAs were miR-103a, miR-107, miR-328 (predicted by TargetScan only), miR-384, and miR-499 (Fig. 2A). From these predictions, miR-103a and miR-107 were associated with a high context score and percentile predictor (Table 2). Next, the level of expression of each miRNA (miR-103a, miR-107, miR-328, miR-384, and miR-499-5p) was determined in both Caco-2, NCM460 cell lines as well as mouse jejunum mucosa (Fig. 2B). The level of expression of the mature miR-103a was significantly higher than that of other candidate miRNA regulators in each system (Fig. 2B).
Fig. 2.
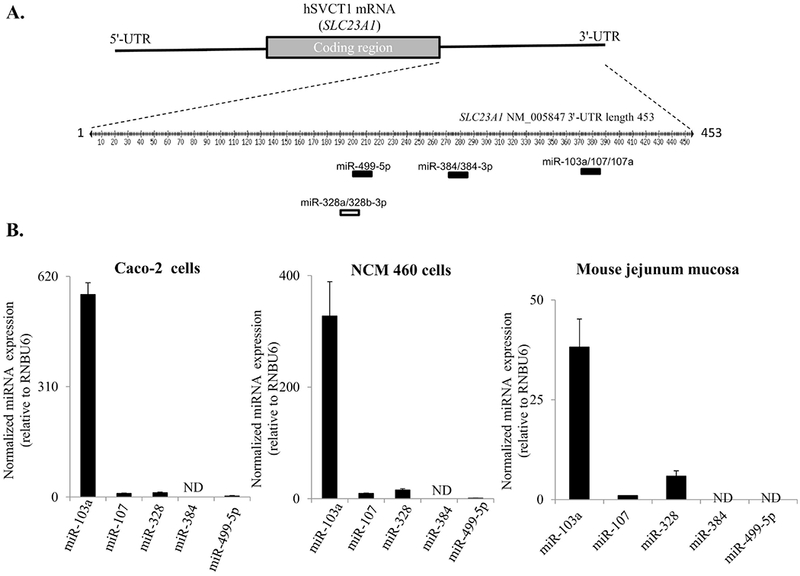
(A) The SLC23A1-3′-UTR and location of target scan predicted miRNA target sites. Depicted figure is based on website http://www.targetscan.org. (B)Relative expression of mature miRNAs in Caco-2 and NCM460 cell lines and mouse jejunum mucosa: The mature miRNA expression levels were determined utilizing TaqMan microRNA assay system as described in “Methods”. Data of miRNA expression levels were determined after normalizing constitutively expressed RNU6B (house-keeping gene) miRNA. Values are mean ± SE of at least from 3 independent experiments with different batches of cells. Open rectangle: predicted by only targetScan and closed rectangle: predicted by all three programs as described in “Methods”. ND-not detectable.
3.3. Effect of truncation of SLC23A1-3′-UTR on firefly luciferase activity in Caco-2 cells
In order to determine which region(s) within the SLC23A1-3′-UTR are important for miRNA regulation, two truncation constructs (1-240bp and 1-322bp) were made in the SLC23A1 −3′-UTR (Fig. 3A). As seen previously, transient transfection of Caco-2 cells with the full-length SLC23A1 −3′-UTR construct caused a decrease in luciferase activity relative to the control construct (Fig. 3B). However, transfection of either truncated constructs did not cause any decrease in observed luminescence values in Caco-2 cells (Fig. 3B). These data implicate the region between 322-453bp as an important region for miRNA binding within the SLC23A1-3′-UTR. Both miR-103a and miR-107 are predicted to bind within this region (Fig. 3). Collectively both the mature miRNA expression data (Fig. 2B) and truncation analyses (Fig. 3) pointing towards miR-103a as an important interactor with SLC23A1 −3′-UTR. Therefore, our subsequent studies were focused on determining the role of miR-103a in posttranscriptional regulation of SLC23A1 gene.
Fig. 3. Effect of truncation of SLC23A1-3′-UTR on firefly luciferase activity in Caco-2 cells:
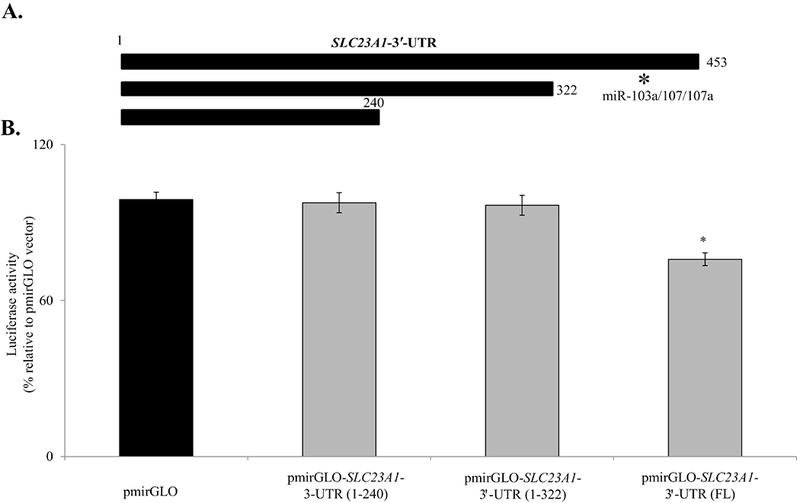
(A) Schematic representation of the regions of SLC23A1-3’-UTR used to generate truncated constructs. (B) Caco-2 cells were transiently transfected with full-length and truncated constructs and luciferase activity was determined after 48 h. Data are mean ± SE of at least from 3 independent experiments with different batches of cells. (*P < 0.01). *indicates the approximate location of the miR-103a/107/107a in 3′-UTR of SLC23A1.
3.4. MiR-103a targets SLC23A1-3′-UTR in Caco-2 cells
To examine whether miR-103a directly targets the SLC23A1-3′-UTR, the pmirGLO-SLC23A1-3′-UTR construct was transfected into Caco-2 cells together in the presence of either a miR-103a mimic, or a negative control miR mimic. Luciferase activity was not changed when pimrGLO vector with 103a mimic transfected compared to pimrGLO vector with 103a negative control mimic (Fig. 4). However, transfection of the Caco-2 cells with the pmirGLO-SLC23A1-3′-UTR in the presence of the 103a mimic led to a significant (P < 0.05) inhibition in luciferase activity compared to cells transfected with the pmirGLO-SLC23A1-3´-UTR with negative control mimic (Fig. 4). Further to determine the specific interaction of the miR-103a with SLC23A1-3′-UTR, we also examined the effect of other predicted miR-107, miR-328, miR-384 and miR-499-5p in Caco-2 cells. The results showed that there is no significant inhibition in luciferase activity between pmirGLO-SLC23A1-3´-UTR with miR-107 or miR-328 or miR-384 or miR-499-5p and pmirGLO-SLC23A1-3´-UTR with negative control mimic alone transfected Caco-2 cells (73. 41 ± 4.21 and 63.13 ± 4.82; 71.69 ± 3.82 and 61.38 ± 4.13; 72.75 ± 4.82 and 80.30 ± 4.66 and 76.0 ± 3.37 and 78.44 ± 3.31 for miR-107, miR-328, miR-384 and miR-499-5p, respectively). These findings suggest that miR-103a has a role in modulating hSVCT1 expression in Caco-2 cells.
Fig. 4. Effect of transient co-transfection of mimic-103a with pmirGLO-SLC23A1-3′-UTR on luciferase activity in Caco-2 cells:
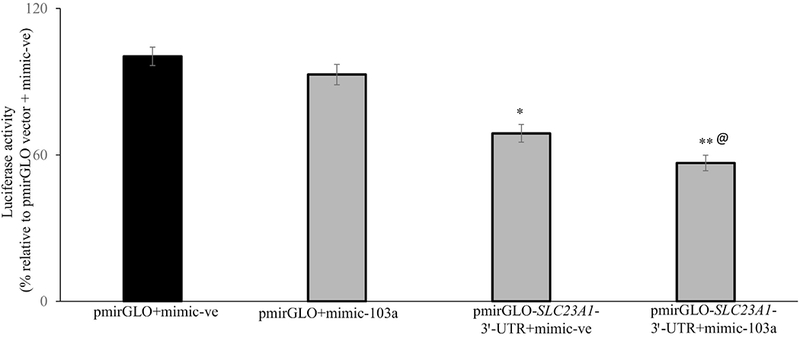
Caco-2 cells were transiently co-transfected with pmirGLO-vector alone or the pmirGLO-SLC23A1-3′-UTR plasmid along with miRNA mimic (either negative control mimic or mimic-103a, 20nM, 48h) and measured luciferase activity. Data are mean ± SE of at least 3 independent experiments. @ indicates the pmirGLO-SLC23A1-3′-UTR with mimic-103a is significantly decreased in the luciferase activity compared to pmirGLO-SLC23A1-3′’-UTR with mimic-ve (**P < 0.05, *P < 0.01).
3.5. Effect of mutating the miR-103a putative site in the SLC23A1-3′-UTR on luciferase activity
To further assess the interaction between miR-103a and its predicted binding site in the SLC23A1-3´-UTR region, we mutated the miR-103a binding site (Fig. 5A). First, we transfected Caco-2 cells with wild-type and miR-103a binding mutant construct. After 48 h of transfection, we determined the luciferase activity. The results showed a significant (P < 0.05) increase in luciferase activity in mutant transfected cells compared to wild-type (Fig. 5B). Next, the wild-type or miR-103a binding mutant construct were transfected into Caco-2 cells in the presence of the miR-103a mimic or a miR-103a inhibitor. The results showed that miR-103a mimic reduced significantly the luciferase activity in Caco-2 cells transfected with wild-type construct (P <0.01, Fig. 5C) and this inhibition was lost when the miR-103a binding mutant construct was used (Fig. 5D). On the other hand, the miR-103a inhibitor increased significantly (P < 0.01) the luciferase activity in Caco-2 cells transfected with wild-type (Fig. 5E) but not with mutant construct (Fig. 5F). These findings suggest that the miR-103a putative site in the SLC23A1-3´-UTR plays a role in the interaction between the miR-103a and the SLC23A1-3′-UTR.
Fig. 5. Effect of mutating the miR-103a putative binding site in the SLC23A1-3′-UTR on luciferase activity in Caco-2 cells:
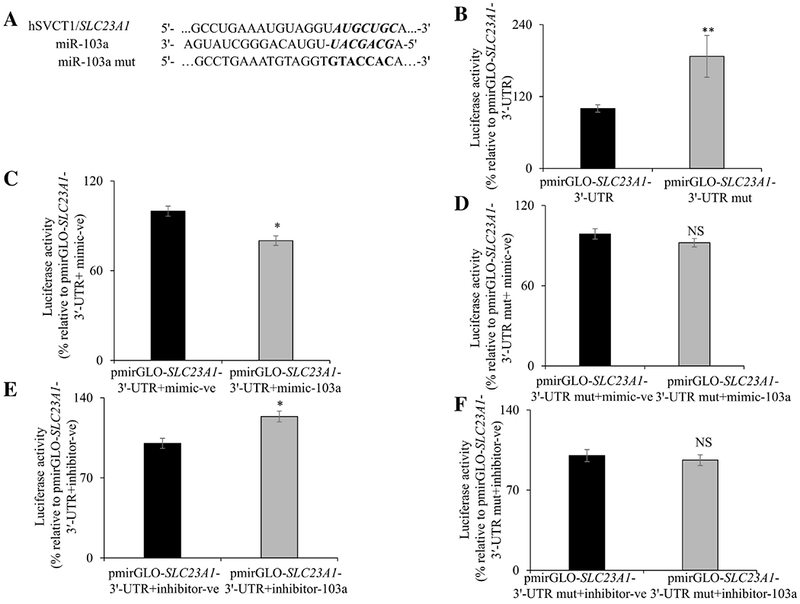
miR-103a binding mutant nucleotide sequence (A). pmirGLO-SLC23A1-3′-UTR miR-103a binding mutant construct transfected Caco-2 cells increases the firefly luciferase activity (B). MiR-103a mimic transfected Caco-2 cells reduced the luciferase activity of wild-type construct (C) but not the 103a mutant construct (D). MiR-103a inhibitor transfected Caco-2 cells increased the luciferase activity of wild-type construct (E) but not the miR-103a mutant construct (F). Firefly luciferase activities were measured and normalized with respective renilla luciferase activities. Data are mean ± SE of at least 3 independent experiments (*P < 0.01, NS-not significant).
3.6. Effect of miR-103a mimic on carrier-mediated AA uptake in Caco-2 cells
To determine whether miR-103a regulation impacts the function of hSVCT1, we transfected a miR-103a mimic (20 nM) into Caco-2 cells. After 48 h of transfection, AA uptake was performed and results showed a significant (P < 0.01) inhibition in AA uptake in cells transfected with the miR-103a mimic compared with those transfected with a negative control mimic (Fig. 6A). Additionally, transfecting cells with a mimic for miR-499-5p showed no significant effect on AA uptake (Fig. 6). On the other hand, transfecting Caco-2 cells with miR-103a inhibitor (50 nM) showed a significant (P < 0.01) increase in AA uptake compared to negative control inhibitor or miR-499-5p inhibitor transfected cells (Fig. 6B). These results suggest that miR-103a interaction with the SLC23A1-3′-UTR has functional relevance for intestinal AA transport.
Fig. 6. Effect of transfection with miR-103a mimic or inhibitor on carrier-mediated intestinal AA uptake:
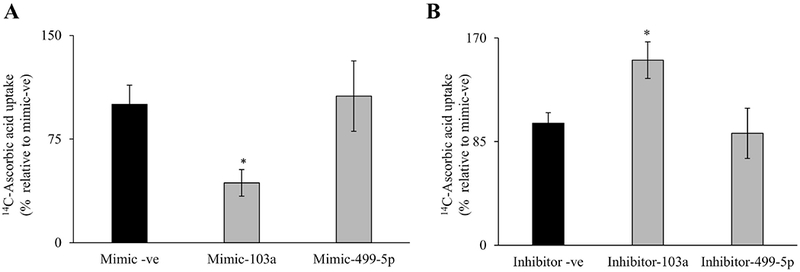
Carrier-mediated AA uptake was determined after transiently transfecting with (A) mimic [negative control mimic, or mimic-103a or mimic-499-5p (20 nM, 48h)] or (B) inhibitor [negative control inhibitor, or inhibitor-103a or inhibitor-499-5p (50 nM, 48h)]. Data are mean ± SE of at least from 3 independent experiments (*P < 0. 01).
3. 7. Effect of miR-103a on hSVCT1 mRNA and protein expression in Caco-2 cells
To determine whether miR-103a directly involved in regulating hSVCT1 mRNA and protein expression, we transfected miR-103a mimic and negative control mimic into Caco-2 cells. After 48h, we examined the hSVCT1 mRNA and protein expression levels. The results showed that hSVCT1 mRNA and protein expression were significantly (P < 0.01 for both) decreased compared to negative control mimic transfected cells (Fig. 7A & B). In another study, we also transfected miR-103a inhibitor and negative control inhibitor to further confirm the miR-103a role in regulating hSVCT1 mRNA and protein expression in Caco-2 cells. Our results showed that hSVCT1 mRNA and protein expression was significantly (P < 0.01 for both) increased compared to negative control inhibitor transfected cells (Fig. 7C & D). These finding shows that miR-103a directly involved in regulating hSVCT1 expression in Caco-2 cells.
Fig. 7. Effect of miR-103a mimic or inhibitor transfection on level of hSVCT1 mRNA and protein expression:
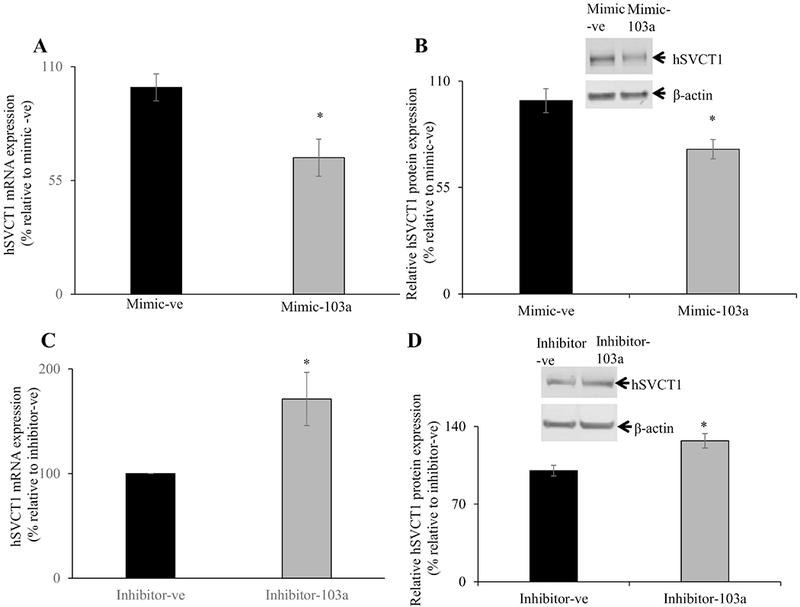
(A&C) total RNA was isolated from cells transfected with either negative control mimic/inhibitor or mimic/inhibitor-103a and hSVCT1 mRNA levels were determined by RT-qPCR. (B&D) membranous fractions isolated from cells transfected with either negative control mimic/inhibitor or mimic/inhibitor-103a and hSVCT1 protein expression levels were determined by western blot analysis. Data are mean ± SE of at least from 3 independent experiments (*P < 0.01).
4. Discussion
Vitamin C is an essential micronutrient for normal cellular function, growth and development. The apically localized intestinal vitamin C transporter-1 (hSVCT1) plays a key role in AA absorption in the intestine [15–17]. Studies on the transcriptional regulation of this transport system have been forthcoming in recent years, including demonstration of the effects of extemal/internal regulators such as lipopolysaccharides (LPS) and pro-inflammatory cytokines (e.g., TNF-α) [40, 41]. However, far less is known about posttranscriptional regulation of this transport system including the role of microRNAs which play an important role in the posttranscriptional regulation of transporters involved in nutrient absorption [20–22, 24, 25, 27]. For these reasons, we investigated the role of miRNA in the posttranscriptional regulation of hSVCT1 in intestinal epithelial cells.
First, we subjected the SLC23A1-3′-UTR to different bioinformatic analyses and identified five putative potential miRNA binding sites (miR-103a, miR-107, miR-328, miR-384 and 499-5p). In order to establish whether the 3′-UTR of SLC23A1 is a target for miRNA binding/interaction in intestinal epithelial cells, we transiently over expressed pmirGLO-SLC23A1-3´-UTR and pmirGLO vector alone in Caco-2 and NCM460 cells. Initial transient expression of this construct showed the relative luciferase activity was markedly decreased compared to pmirGLO vector alone establishing that the SLC23A1-3′-UTR harbors interacting sites for miRNAs binding in intestinal epithelial cells. Next, we determined the expression level of the five putative regulatory miRNAs in intestinal epithelial cells and mouse jejunum tissue. We found that the expression level of miR-103a was markedly higher than that of the other four miRNAs in Caco-2 and NCM460 cells as well as native mouse jejunum. It is worth mentioning here that the expression of miR-103a is also higher in carcinogenic human Caco-2 cells compared to either normal human colonic NCM460 cells or native normal mouse jejunum tissue (Fig. 2B). These findings are similar to results from Geng et al. demonstrating miR-103a expression is higher in cancerous samples compared to normal intestinal samples [35]. Interestingly, the genes for miR-103 and SLC23A1 are located in the long arm of chromosome 5 (5q) [34, 43]. Further, this region of chromosome 5 (5q31-33) is associated with enhanced risk of developing gastrointestinal disorders such as IBD [44]. In addition, a genetic polymorphism in SLC23A1 gene has been shown to be associated with IBD [43] and low levels of vitamin C have been found in IBD patients [9].
To investigate whether the interaction between miR-103a and SLC23A1-3′-UTR has a functional role, we examined the effect of treatment with a miR-103a mimic or inhibitor on AA uptake in Caco-2 cells. We found that the miR-103a mimic inhibited AA uptake, whereas the miR-103a inhibitor increased AA uptake. This effect may be specific for SLC23A1 (hSVCT1) and not SLC23A2 (hSVCT2) which expresses at the basolateral membrane domain of intestinal epithelial cells [15] as we did not find the binding/interacting site for miR-103a in SLC23A2-3′-UTR using bioinformatics analyses. This inhibitory effect of miR-103a mimic is associated with reduced expression of hSVCT1 mRNA and protein. In contrast, miR-103a inhibitor markedly increased AA uptake and expression of hSVCT1 mRNA and protein levels in intestinal epithelial cells.
Collectively, these data suggest that hSVCT1 is a target for posttranscriptional regulation by miR-103a in intestinal epithelial cells, and this regulation has functional significance on intestinal AA absorption.
Acknowledgements
This study was supported by grants from the National Institute of Health [grants DK107474 to VSS and DK58057 & DK56057 to HMS, GM088790 to JSM] and the Department of Veterans Affairs.
Footnotes
Publisher's Disclaimer: This is a PDF file of an unedited manuscript that has been accepted for publication. As a service to our customers we are providing this early version of the manuscript. The manuscript will undergo copyediting, typesetting, and review of the resulting proof before it is published in its final citable form. Please note that during the production process errors may be discovered which could affect the content, and all legal disclaimers that apply to the journal pertain.
References
- [1].Packer L, Fuchs J. Vitamin C in health and disease Marcel Dekker Inc, New York, 1997. [Google Scholar]
- [2].Alcantara-Martos T, Delgado-Martinez AD, Vega MV, Carrascal MT, Munuera-Martinez L. Effect of vitamin C on fracture healing in elderly Osteogenic Disorder Shionogi rats. J Bone Joint Surg Br 2007; 89:402–407. [DOI] [PubMed] [Google Scholar]
- [3].Schectman G, Byrd JC, Gruchow HW. The influence of smoking on vitamin C status in adults. Am J Public Health 1989; 79:158–162. [DOI] [PMC free article] [PubMed] [Google Scholar]
- [4].Schleicher RL, Carroll MD, Ford ES, Lacher DA. Serum vitamin C and the prevalence of vitamin C deficiency in the United States: 2003-2004 National Health and Nutrition Examination Survey (NHANES). Am J Clin Nutr 2009; 90:1252–1263. [DOI] [PubMed] [Google Scholar]
- [5].Carr AC, Frei B. Toward a new recommended dietary allowance for Vitamin C based on antioxidant and health effects in humans. Am J Clin Nutr 1999; 69:1086–1107. [DOI] [PubMed] [Google Scholar]
- [6].Rondanelli M, Opizzi A, Perna S, Faliva MA. Update on nutrients involved in maintaining healthy bone. Endocrinol Nutr 2013; 60:197–210. [DOI] [PubMed] [Google Scholar]
- [7].Simon JA, Hudes ES. Serum ascorbic acid and gallbladder disease prevalence among US adults. Arch Intern Med 2000; 160: 931–936. [DOI] [PubMed] [Google Scholar]
- [8].Harrison SA, Torgerson S, Hayashi P, Ward J, Schenker S. Vitamin E and vitamin C treatment improves fibrosis in patients with nonalcoholic steatohepatitis. Am J Gastroenterol 2003; 98:2485–2490. [DOI] [PubMed] [Google Scholar]
- [9].Buffinton GD, Doe WF. Altered ascorbic acid status in the mucosa from inflammatory dowel disease patients. Free Radic Res 1995; 22:131–143. [DOI] [PubMed] [Google Scholar]
- [10].Hengstermann S, Valentini L, Schaper L, Buning C, Koernicke T, Maritschnegg M et al. Altered status of antioxidant vitamins and fatty acids in patients with inactive inflammatory bowel disease. Clin Nutr 2008; 27: 571–578. [DOI] [PubMed] [Google Scholar]
- [11].Nishikimi M, Udenfriend S. Immunologic evidence that the gene for L-gulono-gammalactone oxidase is not expressed in animals subject to scurvy. Proc Natl Acad Sci U S A. 1976; 73: 2066–2068. [DOI] [PMC free article] [PubMed] [Google Scholar]
- [12].Bürzle M, Suzuki Y, Ackermann D, Miyazaki H, Maeda N, Clémençon B et al. The sodium-dependent ascorbic acid transporter family SLC23. Mol Aspects Med 2013; 34: 436–454. [DOI] [PubMed] [Google Scholar]
- [13].Daruwala R, Song J, Koh WS, Rumsey SC, Levine M. Cloning and functional characterization of the human sodium-dependent vitamin C transporters hSVCT1 and hSVCT2. FEBS Lett 1999; 460: 480–484. [DOI] [PubMed] [Google Scholar]
- [14].Wang H, Dutta B, Huang W, Devoe LD, Leibach FH, Ganapathy V et al. Human Na+-dependent vitamin C transporter 1 (hSVCT1): primary structure, functional characteristics and evidence for a non-functional splice variant. Biochim Biophys Acta 1999; 1461: 1–9. [DOI] [PubMed] [Google Scholar]
- [15].Boyer JC, Campbell CE, Sigurdson WJ, Kuo SM. Polarized localization of vitamin C transporters, SVCT1 and SVCT2, in epithelial cells. Biochem Biophys Res Commun 2005; 334: 150–156. [DOI] [PubMed] [Google Scholar]
- [16].Maulen NP, Henriquez EA, Kempe S, Carcamo JG, Schmid-Kotsas A, Bachem M, et al. Up-regulation and polarized expression of the sodium-ascorbic acid transporter SVCT1 in postconfluent differentiated Caco-2 Cells. J Biol Chem 2003; 278: 9035–9041. [DOI] [PubMed] [Google Scholar]
- [17].Subramanian VS, Marchant JS, Boulware MJ, Said HM. A C-terminal region dictates the apical plasma membrane targeting of the human sodium-dependent vitamin C transporter-1 in polarized epithelia. J Biol Chem 2004; 279: 27719–27728. [DOI] [PubMed] [Google Scholar]
- [18].Reidling JC, Subramanian VS, Dahhan T, Sadat M, Said HM. Mechanism and Regulation of vitamin C uptake: Studies of the hSVCT systems in human liver epithelial cells. Am J Physiol Gastrointest Liver Physiol 2008; 295: G1217–G1227. [DOI] [PMC free article] [PubMed] [Google Scholar]
- [19].Reidling JC, Rubin SA. Promoter analysis of the human ascorbic acid transporters SVCT1 and 2: mechanisms of adaptive regulation in liver epithelial cells. J Nutr Biochem 2011; 22: 344–350. [DOI] [PMC free article] [PubMed] [Google Scholar]
- [20].Anbazhagan AN, Priyamvada S, Kumar A, Maher DB, Borthakur A, Alrefai WA et al. Translation repression of SLC26A3 by miR-494 in intestinal epithelial cells. Am J Physiol 2014; 306: G123–G131. [DOI] [PMC free article] [PubMed] [Google Scholar]
- [21].Dalmasso G, Nguyen HT, Yan Y, Laroui H, Charania MA, Obertone TS et al. MicroRNA-92b regulates expression of the oligopeptide transporter PepT1 in intestinal epithelial cells. Am J Physiol 2011; 300: G52–G59. [DOI] [PMC free article] [PubMed] [Google Scholar]
- [22].Ikemura K, Yamamoto M, Miyazaki S, Mizutani H, Iwamoto T, Okuda M. MicroRNA-145 Post-transcriptionally Regulates the Expression and Function of P-glycoprotein in intestinal epithelial cells. Mol Pharmacol 2013; 83: 399–405. [DOI] [PubMed] [Google Scholar]
- [23].Li Z, Rana TM. Therapeutic targeting of microRNAs: current status and future challenges. Nature Rev 2014; 13:622–638. [DOI] [PubMed] [Google Scholar]
- [24].Sangani R, Periyasamy-Thandavan S, Kolhe R, Bhattacharyya MH, Chutkan N, Hunter M et al. MicroRNAs-141 and 200a regulate the SVCT2 transporter in bone marrow stromal cells. Mol Cell Endocrinol 2015; 410: 19–26. [DOI] [PMC free article] [PubMed] [Google Scholar]
- [25].Lakhan R, Subramanian VS, Said HM. Role of MicroRNA-423-5p in posttranscriptional regulation of the intestinal riboflavin transporter-3. Am J Physiol Gastrointest Liver Physiol 2017; 313:G589–G598. [DOI] [PMC free article] [PubMed] [Google Scholar]
- [26].Gao Y, Schug J, McKenna LB, Le Lay J, Kaestner KH, Greenbaum LE. Tissue-specific regulation of mouse microRNA genes in endoderm-derived tissues. Nucleic Acids Res 2011; 39:454–463. [DOI] [PMC free article] [PubMed] [Google Scholar]
- [27].Kim S, Rhee JK, Yoo HJ, Lee HJ, Lee EJ, Lee JW et al. Bioinformatic and metabolomics analysis reveals miR-155 regulates thiamine level in breast cancer. Cancer Lett 2015; 357:488–497. [DOI] [PMC free article] [PubMed] [Google Scholar]
- [28].McKenna LB, Schug J, Vourekas A, McKenna JB, Bramswig NC, Friedman JR et al. MicroRNAs control intestinal epithelial differentiation, architecture, and barrier function. Gastroenterology 2010; 139:1654–1664. [DOI] [PMC free article] [PubMed] [Google Scholar]
- [29].Balakrishnan A, Stearns AT, Park PJ, Dreyfuss JM, Ashley SW, Rhoads DB et al. Upregulation of proapoptotic microRNA mir-125a after massive small bowel resection in rats. Ann Surg 2012; 255:747–753. [DOI] [PMC free article] [PubMed] [Google Scholar]
- [30].Wu F, Zikusoka M, Trindade A, Dassopoulos T, Harris ML, Bayless TM et al. MicroRNAs are differentially expressed in ulcerative colitis and alter expression of macrophage inflammatory peptide-2 alpha. Gastroenterology 2008; 135:1624–1635. [DOI] [PubMed] [Google Scholar]
- [31].Wu F, Zhang S, Dassopoulos T, Harris ML, Bayless TM, Meltzer SJ et al. Identification of microRNAs associated with ileal and colonic Crohn’s disease. Inflamm Bowel Dis 2010; 16:1729–1738. [DOI] [PMC free article] [PubMed] [Google Scholar]
- [32].Soroosh A, Koutsioumpa M, Pothoulakis C, Iliopoulos D. Functional role and therapeutic targeting of microRNAs in inflammatory bowel disease. Am J Physiol Gastrointest Liver Physiol 2018; 314:G256–G262. [DOI] [PMC free article] [PubMed] [Google Scholar]
- [33].Grimson A, Farh KK, Johnston WK, Garrett-Engele P, Lim LP, Bartel DP. MicroRNA targeting specificity in mammals; determinants beyond seed pairing. Mol Cell 2007; 27: 91–105. [DOI] [PMC free article] [PubMed] [Google Scholar]
- [34].Liao Y, Lönnerdal B. Global microRNA characterization reveals that miR-103 is involved in IGF-1 stimulated mouse intestinal cell proliferation. PLoS One 2010; 5: e12976. [DOI] [PMC free article] [PubMed] [Google Scholar]
- [35].Geng L, Sun B, Gao B, Wang Z, Quan C, Wei F et al. MicroRNA-103 promotes colorectal cancer by targeting tumor suppressor DICER and PTEN. Int J Mol Sci 2014; 15: 8458–8472. [DOI] [PMC free article] [PubMed] [Google Scholar]
- [36].Xue X, Cao AT, Cao X, Yao S, Carlsen ED, Soong L et al. Downregulation of microRNA-107 in intestinal CD11c(+) myeloid cells in response to microbiota and proinflammatory cytokines increases IL-23p19 expression. Eur J Immunol 2014; 44:673–682. [DOI] [PMC free article] [PubMed] [Google Scholar]
- [37].Liu X, Zhang Z, Sun L, Chai N, Tang S, Jin J, et al. MicroRNA-499-5p promotes cellular invasion and tumor metastasis in colorectal cancer by targeting FOXO4 and PDCD4. Carcinogenesis 2011; 32:1798–1805. [DOI] [PubMed] [Google Scholar]
- [38].Gotanda K, Hirota T, Saito J, Fukae M, Egashira Y, Izumi N, et al. Circulating intestinederived exosomal miR-328 in plasma, a possible biomarker for estimating BCRP function in the human intestines. Sci Rep 2016; 6:32299. [DOI] [PMC free article] [PubMed] [Google Scholar]
- [39].Wang YX, Chen YR, Liu SS, Ye YP, Jiao HL, Wang SY et al. MiR-384 inhibits human colorectal cancer metastasis by targeting KRAS and CDC42. Oncotarget 2016;7:84826–84838. [DOI] [PMC free article] [PubMed] [Google Scholar]
- [40].Subramanian VS, Sabui S, Subramenium GA, Marchant JS, Said HM. Tumor Necrosis Factor alpha (TNF-α) reduces intestinal vitamin C uptake: a role for NF-κB mediated signaling. Am J Physiol Gastrointest Liver Physiol 2018; 315:G241–G248. [DOI] [PMC free article] [PubMed] [Google Scholar]
- [41].Subramanian VS, Sabui S, Moradi H, Marchant JS, Said HM. Inhibition of intestinal ascorbic acid uptake by lipopolysaccharide is mediated via transcriptional mechanisms. Biochim Biophys Acta 2018; 1860:556–565. [DOI] [PMC free article] [PubMed] [Google Scholar]
- [42].Livek KJ, Schmittgen TD. Analysis of relative gene expression data using real-time quantitative PCR and the 2(-delta DeltaC (T)) method. Methods 2001; 25: 402–408. [DOI] [PubMed] [Google Scholar]
- [43].Amir Shaghaghi M, Bernstein CN, Serrano León A, El-Gabalawy H, Eck P. Polymorphisms in the sodium-dependent ascorbate transporter gene SLC23A1 are associated with susceptibility to Crohn disease. Am J Clin Nutr 2014; 99:378–83. [DOI] [PubMed] [Google Scholar]
- [44].McGovern D, Ahmad T. New IBD genes? Gut 2005; 54:1060–1061. [DOI] [PMC free article] [PubMed] [Google Scholar]