

Abstract
Studies have implicated the extracellular matrix (ECM) of adipose tissue in insulin resistance. The proteoglycan decorin, a component of ECM, has been associated with glucose tolerance, but possible causal effects on metabolism remain to be explored. We here sought to determine metabolic consequences of loss of decorin in mice (DcnKO). DcnKO mice were fed a low-fat (LF) or high-fat (HF) diet for 10 weeks and body weight and food intake was recorded. An intraperitoneal glucose tolerance test was performed after eight weeks. Blood samples and adipose, liver and muscle tissues were collected at sacrifice. Global gene expression was measured in adipose tissue, and expression of decorin was also analyzed in human adipose samples. DcnKO mice showed increased feed efficiency during overfeeding and impaired glucose tolerance. Adipose leptin mRNA and circulating leptin levels were elevated in DcnKO mice, along with a downregulation of genes involved in ECM organization and triglyceride biosynthesis, and an upregulation of adipose genes involved in complement and coagulation cascades. Consistent with a protective metabolic role for decorin, in obese patients we found increased adipose decorin expression after profound fat loss, particularly in the stromal vascular fraction. Loss of decorin in mice caused impaired glucose tolerance in association with increased feed efficiency and altered gene expression in adipose tissue. Our data provide evidence that decorin is an important factor for maintaining glucose tolerance.
Introduction
Obesity has become more prevalent during the last decades, and it is associated with metabolic disturbances which can be related to structural changes in tissues and cross-talk between different organs. During development of obesity, gene programs are activated within adipose tissue to support tissue expansion1,2. Adipose tissue is a loose connective tissue where adipocytes and adipocyte precursors are embedded in an extracellular matrix (ECM) composed of structural proteins (e.g., collagens and elastin) and adhesion proteins (e.g., proteoglycans), providing structural support and also regulating intercellular communication3,4. Synthesis and degradation of ECM proteins may play an important role in the regulation of adipose tissue size and function during obesity progression5, and expression of ECM proteins and ECM remodeling pathway are altered in obesity and type 2-diabetes6. Several ECM components, including collagen type VI, biglycan and tenascin C, have been implicated in metabolic dysregulation in obesity7–13.
The small leucine rich proteoglycan decorin (Dcn) is a component of the ECM in many tissues. It is highly expressed in adipose tissue, and more highly expressed in visceral compared to subcutaneous adipose tissue depots14,15. Experiments with fractionized adipose tissue show that expression of decorin is highest in the non-adipocyte stromal vascular fraction (SVF) that contains, e.g., adipocyte precursors14. Previous studies of rodents and humans with obesity and glucose intolerance have suggested increased expression of decorin mRNA in whole adipose tissue and secreted decorin protein in plasma14,16. Leptin may be involved in the regulation of decorin expression since ob/ob mice, despite a massive increase in body weight, have a reduced expression of decorin in epididymal adipose tissue16. Furthermore, decorin polymorphisms were recently found to associate with higher serum glucose in humans17. Decorin may at least partly influence metabolism and adipose tissue expansion through its function as a receptor on adipocyte progenitors for the adipokine resistin18, and SNPs near the decorin (DCN) gene were found to associate with circulating resistin in Japanese people19. Furthermore, decorin interacts with several molecules present in the ECM, including structural proteins such as types VI, XII and XIV collagen, fibronectin and elastin20–24, and growth factors such as EGF, TGFβ, TNFα and myostatin25–28. These interactions may, in addition to stabilizing the extracellular matrix, also participate in regulating the metabolism29 and activity of these growth factors at its receptors. These findings indicate that decorin may play an important role in adipose tissue function and in the pathophysiology of obesity.
In the present study, we used the well-established C57BL/6 mouse model for obesity and impaired glucose tolerance and type 2 diabetes30, to test a possible causal impact of decorin on body weight, glucose tolerance and adipose tissue in high-fat challenged Dcn null (dcnKO) C57BL/6J mice.
Materials and Methods
Animals and diets
The animal experiment was performed in accordance with the Norwegian regulation on animal experimentation. The protocol was approved by the Norwegian State Board of Biological Experiments with Living Animals (Approval No. 2013–6770). The male mice were kept at the Vivarium, University of Bergen, Norway. The Dcn knock-out strain was created by the use of homologous recombination, which was performed by genOway, Lyon, France. Removal of exon 8 by mating with Cre-expressing mice resulted in degradation of Dcn mRNA. No decorin protein could be detected by western blot in the Dcn KO strain31 and Fig. 1B. The strain was back-crossed for 9 generations using C57BL/6J (BomTac) before experiments and is available at The Jackson Laboratory Repository with the JAX Stock No. 27672, B6.129S(Cg)-Dcntm1.2Geno/AecmJ (http://jaxmice.jax.org/query). C57BL/6J (BomTac) (WT) mice or DcnKO on the same background were housed, one per cage, at constant temperature (22 ± 2 °C) and humidity (55 ± 5%), and exposed to a 12 h light–dark cycle with unrestricted access to food and tap water.
Figure 1.

Dcn mRNA and protein expression in different metabolic tissues of DcnKO and wild-type (WT) C57BL/6J mice. Male mice were fed a low-fat (LF, n = 8) or high-fat (HF, n = 10) diet for 10 weeks, and tissues were collected immediately after being euthanized. RNA was purified, cDNA was synthesized and relative gene expression was measured by qPCR using Rps13 as a reference gene. iWAT, inguinal white adipose tissue; eWAT, epididymal white adipose tissue; BAT, interscapular brown adipose tissue. *p-value < 0.05. (A) Protein levels of Dcn in different adipose tissues was determined by western blotting relative to the reference Vinculin (B).
Eight male WT mice and eight male DcnKO mice were fed a low fat diet (LF) with 3,85 kcal/g, 10 kcal% fat, 70 kcal% carbohydrates, 20 kcal% protein and 35 kcal% sucrose (Research Diets, New Brunswick, NJ; Cat. No. D12450B) and 10 WT mice and 10 DcnKO mice were fed a high fat diet (HF) with 4,73 kcal/g, 45 kcal% fat, 35 kcal% carbohydrates, 20 kcal% protein and 17 kcal% sucrose (Research Diets, New Brunswick, NJ; Cat. No. D12451) for 10 weeks starting at an age of 12 weeks. Diets were packed airtight and stored at 4 °C until used to prevent lipid oxidation. Body weights were measured once each week.
Food intake
The weights of food given and remaining in cages were measured once each week and the consumed total amount of food was calculated.
RNA isolation and qPCR analysis
Total RNA was extracted from 10–100 mg of tissue using the RNA/Protein Purification Kit (product 24100, Norgen Biotek Corporation, Canada) following the manufacturer protocols. The concentration of RNA was determined by spectrophotometry (Nanodrop ND-1000; NanoDrop Technologies, Wilmington, DE), and RNA integrity was confirmed by bioanalysis (Agilent 2100 bioanalyzer; Agilent Technologies, Inc., Santa Clara, CA).
RNA samples (0.5 μg) were reverse transcribed using the Applied Biosystems™ High-Capacity cDNA Reverse Transcription Kit. The cDNA template was synthesized following the protocol that includes 10 uL RNA sample, 2.0 uL 10X RT Buffer, 0.8 uL dNTP Mix, 2.0 uL10X RT Random Primers, 1.0 uL MultiScribe™ Reverse Transcriptase, 1.0 uL RNase Inhibitor, and 3.2 uL nuclease-free H2O. Total volume per reaction was 20.0 uL.
Genes of interest were analyzed by individual real-time SYBR green PCR assays with HPRT or RPS13 used as an internal control. The SYBR Green based PCR was carried out on the LightCycler® 480 Real-Time PCR System (Roche). The PCR reaction was prepared in a total volume of 10 uL containing 1.5 ul cDNA template, 0.5 ul of each primer (20 uM), 5 ul of SYBR Green and 2.75 deionized water. A negative control was established by replacing cDNA template with deionized water. The expression level of each gene was calculated relative to the expression of the reference gene using the 2−ΔΔCt method.
Protein isolation and western blot analysis
Protein was isolated from tissues using the RNA/Protein Purificatiion Plus kit (Cat. 48200); Norgen Biotek. Protein samples (10 µg total protein) were separated by electrophoresis in a 10% SDS-polyacrylamide gel (TGX Precast Protein Gels) and subsequently transferred to a nitrocellulose membrane (Nitrocellulose Transfer Pack) using the Trans-Blot® Turbo Transfer System (Bio-Rad Laboratories, Inc.). All membranes were transferred by the 7 minute pre-set setting and blocked for 1 hour at room temperature (RT) in 5% non-fat dry milk in Tris-buffered saline (TBS; 20 mm Tris-HCl, 140 mM NaCl pH 7.4), containing 0.1% Tween® 20 (0.1% TBS-T). Immunodetection was carried out by incubating the primary antibody of interest at 4 °C overnight in either 3% BSA (α-hDecorin (1:2000); AF143 R&D Systems and α-pAKT, Ser473, (1:1000); Cell Signaling Tech.®) or 5% BSA (α-Vinculin (1:2000); Abcam and α-AKT (1:1000); Cell Signaling Tech.®). HRP-conjugated goat-anti-rabbit IgG or goat-anti-rabbit IgG was used as the respective secondary antibodies (Cell Signaling Tech.®). Between all steps throughout the procedure, membranes were washed extensively in 0.1% TBS-T at RT. Anti-Vinculin was verified by comparing signals to stain-free total protein measurements and subsequently used as loading control in all immunoblots. Chemiluminescence of secondary antibody-HRP conjugates was elicited using SuperSignal West Femto Maximum Sensitivity Substrate (Thermo Scientific) and imaged with Gel DocTM XR+ (Bio-Rad Laboratories, Inc.) and quantified using Image Lab 6.0 software (Bio-Rad Laboratories, Inc.).
Blood and tissue samples
Animals were fasted for 6 hours, anesthetized with 2% isoflurane (Schering-Plough, Kent, UK) and blood was collected by heart puncture before the mouse was euthanized. The blood was centrifuged, EDTA-plasma separated and stored at −80 °C prior to further analysis. Liver, epididymal white adipose tissue (eWAT), inguinal WAT (iWAT), skeletal muscle (gastrocnemius) and BAT were collected and immediately frozen in liquid nitrogen and stored at −80 °C until further analysis.
Fasting EDTA-plasma samples at study endpoint were analyzed for Total Cholesterol, HDL Cholesterol, LDL Cholesterol, Triglycerides, Non-esterified fatty acids (NEFA) using the Cobas C111 System (Roche Diagnostics GmbH, Mannheim, Germany). Standard kits were used for all except for NEFAs that were analyzed using the NEFA FS kit (DiaSys, Diagnostic Systems GmbH, Germany). Lipids were measured by enzymatic colorimetric assays with specific reagents from Roche Diagnostics for total cholesterol (CHOL2, Cat. No. 04718917190), triglycerides (TRIGL, Cat. No. 04657594190), HDL cholesterol (HDL, Cat. No. 05401488190), and LDL cholesterol (LDL C, Cat. No. 04657578190). Insulin (Cat. No. 90080) and Leptin (Cat. No. 90030) were measured by ELISA from (Crystal Chem, Downers Grove, IL, USA).
Glucose tolerance test (GTT)
Intraperitoneal (IP) GTTs were performed at 20 weeks of age (after 8 weeks on HF or low fat diet (LF)). For GTTs animals were fasted for 5 hours, and glucose (2 g/kg body weight) was injected IP. Blood glucose was measured from the saphenous vein using a glucometer (Contour, Bayer) at 0, 15, 30, 60, 120 and 180 min after glucose injection in un-anesthetized mice.
Histology and adipocyte size measurement
Formalin fixed, paraffin embedded eWAT was sectioned (5 μm) on a Leica RM2255 microtome. Hematoxylin and eosin (H&E) staining was performed on three to five sections per animal. Images were captured under bright-field illumination using a Nikon microscope (E800; Tokyo, Japan) with a Plan Apo ×10 (NA 0.75) objective.
Microarray analysis
Global gene expression analysis was performed in iWAT from 8 WT and 8 DcnKO mice on LFD or HFD using Illumina Mouse Microarray at The Genomics Core Facility (GCF) at the University of Bergen.
Patients
A description of human patients can be found in32. The study of human subjects was approved by the Regional committee for medical and health research ethics, western Norway (REC West). Each subject gave written informed consent, and the study was performed in accordance with the declaration of Helsinki.
Statistical analyses
Statistical analyses were conducted using SPSS Statistics 22. All values are represented as the mean ± sem. Significance between two groups was assessed using 2-way ANOVAs or two-tailed unpaired or paired Student’s t-test. P < 0.05 was considered significant. Number of animals and persons used for all measures are provided in figure legends.
Results
Diet-induced increase in Dcn mRNA expression in different adipose tissues
Studies have shown that rodents and humans with obesity and glucose intolerance have increased expression of decorin in adipose tissue14,16. In this study we further examined diet-dependent decorin expression in different adipose tissue depots and other metabolic tissues of mice fed a control low-fat diet. As expected we found that high-fat (HF) feeding increased Dcn mRNA in epididymal white adipose tissue (eWAT) (Fig. 1A). We also found increased expression of Dcn in inguinal white adipose tissue (iWAT), brown adipose tissue (BAT), and skeletal muscle, whereas there was no difference in the hepatic gene expression (Fig. 1A). To confirm loss of Dcn protein in tissues of DcnKO mice, we purified protein from iWAT and eWAT of WT and DcnKO mice fed a LF or a HF diet. We could not detect expression of Dcn in inguinal white adipose tissue (iWAT) or epididymal white adipose tissue (eWAT) of DcnKO mice. The reference gene, Vinculin, was detected as a technical control (Fig. 1B).
Increased weight gain and feed efficiency in DcnKO
To test the role of decorin in body weight regulation, we fed WT and DcnKO mice a HF or LF diet. At study start the body weights were not different in the LF groups 25.2 ± 0.6 g (WT) and 26.1 ± 0.7 g (DcnKO), or in the HF groups 27.5 ± 0.3 g (WT) and 26.7 ± 0.7 g (DcnKO) respectively. Both WT and KO mice gained considerably more weight on HF compared to LF diet (Fig. 2A). During the first four weeks, the WT and DcnKO mice fed HF gained similar amounts of weight. In contrast, the DcnKO mice gained surprisingly more weight, with a significant difference in accumulated weight gain seen at 8 weeks (Fig. 2A). However, after the full 10 weeks on HF, weight gain did not differ significantly between the two genotypes (Fig. 2A), which was also the case on LF (Fig. 2A). Moreover, we did not find an interaction between diet and genotype calculated by a 2-way ANOVA. However, while food intake was not different between the genotypes on either HF or LF diet (Fig. 2B), the DcnKO mice showed significantly higher feed efficiency (amount of weight gained relative to food intake) compared to WT on the HF diet (week 10, Fig. 2C). Feed efficiency was not significantly different between the two genotypes after 10 weeks of LF feeding (Fig. 2C).
Figure 2.

Changes in metabolic phenotype in Dcn knock-out (DcnKO) relative to wild-type (WT) C57BL/6J mice. Twelve week old male mice were subjected to a low-fat (LF) or high-fat (HF) diet for 10 weeks. Body weight (A) and food intake (B) were measured every week, and feed efficiency (grams of weight gain per unit of caloric intake) was calculated (C). Lep mRNA in adipose tissue was measured by qPCR calculated relative to the reference gene Rps13 (D), and circulating levels of leptin were measured in plasma by ELISA (E). Adipoq and Retn mRNA in adipose tissue was measured by qPCR calculated relative to the reference gene Rps13 (F,G). Mean adipocyte size in inguinal white adipose tissue (iWAT) was calculated by measuring 50–100 adipocytes on 3–5 slides per animal (H). Representative images of the hematoxylin and eosin (H&E) stained adipose tissue are shown (I). A glucose tolerance test (GTT) was performed after 8 weeks on the diets, with intraperitoneal glucose injection (2 g/kg body weight) after a 5 hour fast (J), and area under the curve (AUC) was measured based on the repeated measurements of blood glucose (K). *p-value < 0.05, **p-value < 0.01.
Higher concentration of leptin in DcnKO mice
The difference in body weight and feed efficiency between WT and KO mice upon HF feeding prompted us to measure circulating leptin, which reflects fat mass33. As expected, HF feeding increased the levels of leptin both in plasma and in iWAT and eWAT compared to LF (Fig. 2D,E). Interestingly, plasma leptin as well as mRNA levels of leptin in eWAT and iWAT were higher in DcnKO than in WT fed a LF diet, but the higher level of leptin upon HF feeding in both genotypes gave no significant difference during HF (Fig. 2D,E). Moreover, we found no significant differences in the expression of adiponectin or resistin mRNA in iWAT or eWAT between WT and DcnKO animals (Fig. 2F,G).
Leptin has previously been shown to associate more closely with adipocyte hypertrophy than hyperplasia34, and we therefore further assessed adipocyte size in eWAT of the DcnKO and WT mice. In agreement with the higher leptin upon HF compared to LF feeding, adipocytes in eWAT were larger in mice after the HF diet for both genotypes (Fig. 2H,I). However, we observed no significant differences between the genotypes after either diet (Fig. 2H,I), suggesting that adipocytes in the DcnKO mice were unable to expand in size beyond the diet effect. Because leptin has a proadipogenic (i.e. hyperplasic) effect on preadipocytes35, the higher leptin upon LF feeding in the DcnKO mice may reflect an effect of decorin on leptin-mediated adipogenesis/hyperplasia, rather than primarily on hypertrophy.
Reduced glucose tolerance in DcnKO mice on HF
Changes in the extracellular matrix have been demonstrated to play a causal role in fat mass regulation as well as in whole-body glucose tolerance8. Accordingly, we wanted to find out whether DcnKO mice would show altered glucose metabolism in response to HF feeding. After 8 weeks on HF, the fasting glucose level was significantly higher in DcnKO mice (10.6 ± 0.6 mmol/L) compared to WT mice (8.3 ± 0.4 mmol/L) (Fig. 2J). Further, we performed an intraperitoneal glucose tolerance test (GTT), revealing higher glucose levels at 60 and 120 min in DcnKO mice given HF feeding compared to WT mice on the same diet. This translated into a significantly higher area under the curve (AUC) glucose for DcnKO compared to WT mice (Fig. 2K). No difference in glucose tolerance was found between WT and DcnKO mice on LF. No significant differences in plasma insulin concentrations were observed between the groups, even though it was higher in DcnKO mice in both the LF and HF groups (Table 1), suggesting that DcnKO mice had some increase in insulin resistance compared to WT animals. The difference in glucose levels could not be explained by differences in the expression levels of different glucose transporters or any apparent differences in insulin signaling (Fig. S1). However, we found a small but significantly decreased expression of Ucp1 in BAT from DcnKO mice fed HF (Fig. S2).
Table 1.
Biochemical parameters in plasma of wt and DcnKO mice.
| LF | HF | |||
|---|---|---|---|---|
| Wt | DcnKO | Wt | DcnKO | |
| Cholesterol (mmol/L) | 2,14 ± 0,07 | 2,05 ± 0,14 | 2,87 ± 0,25 | 2,50 ± 0,07 |
| HDL (mmol/L) | 2,01 ± 0,04 | 1,94 ± 0,13 | 2,76 ± 0,27 | 2,45 ± 0,10 |
| LDL (mmol/L) | 0,41 ± 0,06 | 0,30 ± 0,02 | 0,39 ± 0,07 | 0,22 ± 0,04 |
| TG (mmol/L) | 0,45 ± 0,03 | 0,58 ± 0,04*# | 0,58 ± 0,03 | 0,69 ± 0,04 |
| NEFA (mmol/L) | 0,24 ± 0,03 | 0,28 ± 0,02 | 0,23 ± 0,03 | 0,24 ± 0,06 |
| Insulin (ng/ml) | 0,40 ± 0,08 | 0,64 ± 0,14 | 0,62 ± 0,14 | 0,87 ± 0,24 |
| Bile acids (mmol/L) | 6,2 ± 2,3 | 4,3 ± 1,5 | 2,6 ± 1,1 | 3,8 ± 0,4 |
LF, low-fat; HF, high-fat; HDL, high-density lipoprotein; LDL, low-density lipoprotein; TG, triglycerides; NEFA, Non-esterified fatty acids. #Significance level for comparison of Wt mice with DcnKO mice.
Effect of genotype and diet on lipids
To gain further insight into the metabolic consequences of loss of decorin circulating lipids were analyzed (Table 1). Plasma concentrations of total cholesterol, HDL cholesterol, LDL cholesterol, Non-Esterified Fatty Acids (NEFA) and total bile acids were not different between the WT and DcnKO groups on either diet. However, the triglyceride concentration was significantly higher in the DcnKO group on the LF diet, and a similar tendency was seen for the HF diet.
Differentially expressed genes in adipose tissue
To evaluate possible mechanisms involved in the lower glucose tolerance in the DcnKO mice, we measured global gene expression in iWAT from the WT and DcnKO mice after 10 weeks on either diet. For the LF diet, we found 10 transcripts with higher expression and 10 transcripts with lower expression in DcnKO compared to WT, within a false discovery rate (FDR) cut-off of 0 (Table 2). With the same cutoff on the HF diet, we found 22 transcripts with higher expression and 20 transcripts with lower expression in DcnKO compared to WT. Decorin was confirmed to be the most downregulated gene after both diets, and Prtn3 was one of the most downregulated and Hal the most upregulated gene in DcnKO compared to WT mice on both diets (Tables 2 and 3). Prtn3 (proteinase 3) is a serine protease that degrades elastin, fibronectin, laminin, vitronectin, and collagen types I, III, and IV36, whereas Hal (Histidine ammonia-lyase) catalyzes breakdown of histidine, an amino acid shown to improve insulin resistance in obese women37.
Table 2.
Differentially expressed genes in adipose tissue of low fat fed mice.
| Probe-ID | Gene symbol | Full Gene Name | Fold Change |
|---|---|---|---|
| ILMN_2747959 | Dcn | Decorin | −74.85 |
| ILMN_2596346 | Dcn | Decorin | −6.10 |
| ILMN_2666864 | Atp2a1 | ATPase Sarcoplasmic/Endoplasmic Reticulum Ca2+ Transporting 1 | −6.44 |
| ILMN_2758029 | Prtn3 | Proteinase 3 | −2.82 |
| ILMN_2481133 | Tnni2 | Troponin I2, Fast Skeletal Type | −5.35 |
| ILMN_1218223 | Pvalb | Parvalbumin | −4.49 |
| ILMN_2977331 | Mylpf | Myosin Light Chain, Phosphorylatable, Fast Skeletal Muscle | −3.92 |
| ILMN_2882658 | Tnnc2 | Troponin C2, Fast Skeletal Type | −4.08 |
| ILMN_2482209 | Tpm2 | Tropomyosin 2 (Beta) | −3.33 |
| ILMN_2469018 | Tnnt3 | Troponin T3, Fast Skeletal Type | −3.00 |
| ILMN_2875730 | Mup1 | Major urinary protein 1 | 2.38 |
| ILMN_1213817 | Mup3 | Major urinary protein 3 | 3.55 |
| ILMN_2443330 | Ttr | Transthyretin | 3.39 |
| ILMN_2623393 | Apoa1 | Apolipoprotein A1 | 2.62 |
| ILMN_2788223 | Kng1 | Kininogen 1 | 1.96 |
| ILMN_2659680 | Serpina1b | Serpin Family A Member 1 | 2.38 |
| ILMN_1247156 | Apoa2 | Apolipoprotein A2 | 4.01 |
| ILMN_2614752 | Elovl6 | ELOVL Fatty Acid Elongase 6 | 2.38 |
| ILMN_1225730 | Fdps | Farnesyl Diphosphate Synthase | 1.82 |
| ILMN_2984332 | Hal | Histidine Ammonia-Lyase | 3.31 |
Table 3.
Differentially expressed genes in adipose tissue of high fat fed mice.
| Probe-ID | Gene symbol | Full Gene Name | Fold Change |
|---|---|---|---|
| ILMN_2747959 | Dcn | Decorin | −168.9 |
| ILMN_2596346 | Dcn | Decorin | −7.61 |
| ILMN_2758029 | Prtn3 | Proteinase 3 | −2.57 |
| ILMN_2661366 | Tmem45b | Transmembrane Protein 45B | −2.18 |
| ILMN_3105563 | Dmkn | Dermokine | −1.31 |
| ILMN_1229763 | Dmkn | Dermokine | −1.34 |
| ILMN_1232524 | Hist1h4i | Histone Cluster 1 H4 Family Member I | −1.68 |
| ILMN_3125966 | Kcnj15 | Potassium Voltage-Gated Channel Subfamily J Member 15 | −1.61 |
| ILMN_2798129 | C6 | Complement C6 | −1.67 |
| ILMN_2710905 | S100a8 | S100 Calcium Binding Protein A8 | −1.60 |
| ILMN_2868152 | Krtdap | Keratinocyte Differentiation Associated Protein | −1.30 |
| ILMN_1216720 | C6 | Complement C6 | −1.55 |
| ILMN_1256775 | Thrsp | Thyroid Hormone Responsive | −1.50 |
| ILMN_1220275 | Nrg4 | Neuregulin 4 | −1.48 |
| ILMN_2863532 | Lipf | Lipase F, Gastric Type | −1.43 |
| ILMN_2948296 | Wfdc12 | WAP Four-Disulfide Core Domain 12 | −1.41 |
| ILMN_2870696 | Hfe | Hemochromatosis | −1.45 |
| ILMN_1218981 | Aldh1a7 | Aldehyde Dehydrogenase 1 Family Member A1 | −1.39 |
| ILMN_1244513 | Gbp3 | Guanylate Binding Protein 3 | −1.42 |
| ILMN_2671165 | Krt23 | Keratin 23 | −1.03 |
| ILMN_2486906 | Wisp2 | WNT1 Inducible Signaling Pathway Protein 2 | 1.37 |
| ILMN_3143404 | Mup2 | Major urinary protein 2 | 2.35 |
| ILMN_1213817 | Mup3 | Major urinary protein 3 | 2.69 |
| ILMN_3065459 | Mup2 | Major urinary protein 2 | 3.47 |
| ILMN_2873822 | Aebp1 | AE Binding Protein 1 | 1.45 |
| ILMN_2635229 | Thbs2 | Thrombospondin 2 | 1.59 |
| ILMN_2875730 | Mup1 | Major urinary protein 1 | 2.95 |
| ILMN_2659680 | Serpina1b | Serpin Family A Member 1 | 1.94 |
| ILMN_1215859 | Serpina1b | Serpin Family A Member 1 | 1.96 |
| ILMN_2953807 | Mup6 | Major urinary protein 6 | 2.72 |
| ILMN_1225570 | Serpina1d | Serpin Family A Member 1 | 1.99 |
| ILMN_2443330 | Ttr | Transthyretin | 3.03 |
| ILMN_1247156 | Apoa2 | Apolipoprotein A2 | 2.83 |
| ILMN_1213954 | Sgk1 | Serum/Glucocorticoid Regulated Kinase 1 | 1.48 |
| ILMN_2904137 | Ambp | Alpha-1-Microglobulin/Bikunin Precursor | 2.09 |
| ILMN_2623393 | Apoa1 | Apolipoprotein A1 | 2.38 |
| ILMN_2749037 | Chchd10 | Coiled-Coil-Helix-Coiled-Coil-Helix Domain Containing 10 | 1.92 |
| ILMN_2753809 | Mmp3 | Matrix Metallopeptidase 3 | 1.37 |
| ILMN_2993745 | Ahsg | Alpha 2-HS Glycoprotein | 1.91 |
| ILMN_3158499 | Mdk | Midkine | 1.48 |
| ILMN_2788223 | Kng1 | Kininogen 1 | 1.88 |
| ILMN_2984332 | Hal | Histidine Ammonia-Lyase | 5.25 |
To more systematically assess biological functions represented by the top regulated genes, we performed pathway enrichment analysis based on the Kyoto Encyclopedia of Genes and Genomes (KEGG) database. Consistent with the role of decorin in extracellular matrix, transcripts induced in DcnKO on LF were enriched in the pathways Extracellular matrix organization, Collagen biosynthesis and modifying enzymes, and Collagen degradation (Fig. 3A), and transcripts downregulated in DcnKO mice were enriched in the pathways Striated muscle contraction and Muscle contraction (Fig. 3A). On the HF diet, upregulated transcripts in DcnKO were enriched in the pathways, e.g. complement and coagulation cascades and platelet degranulation (Fig. 3B), while downregulated transcripts were enriched in the pathways, e.g., triglyceride biosynthesis and metabolism (Fig. 3B), supporting a role for decorin in adipose tissue lipid metabolism and inflammation.
Figure 3.

Enriched KEGG pathways for differentially expressed genes in iWAT comparing DcnKO and WT C57BL/6J mice. Total RNA was purified from adipose tissue and subjected to microarray analysis. Genes with a false discovery rate (FDR) below 20% were analyzed in the Kyoto Encyclopedia of Genes and Genomes (KEGG) gene ontology database, and data are presented as log fold enrichment for each significantly enriched category (p < 0.05) for up- and down-regulated genes in DcnKO vs. WT, respectively. iWAT, inguinal white adipose tissue; LF, low-fat diet; HF, high-fat diet; DcnKO, decorin knock-out mice; WT, wild-type mice.
Adipose DCN expression increases upon profound fat loss in humans
Finally, we analyzed DCN mRNA expression by qPCR in subcutaneous adipose tissue of human subjects before and one year after bariatric surgery (biliopancreatic diversion with duodenal switch (n = 13)32. A significantly increased expression of decorin mRNA was observed one year after surgery (Fig. 4A). The results were confirmed in another set of patients with another surgical procedure (gastric sleeve), (n = 6) (Fig. 4B). Subcutaneous adipose tissue samples from these patients were fractionized into an adipocyte fraction and a stromal vascular fraction (SVF). Decorin was predominantly expressed in the SVF and the significant increase in expression one year after surgery is only seen in the SVF although the same tendency seems to be present in the adipocyte fraction (Fig. 4B).
Figure 4.
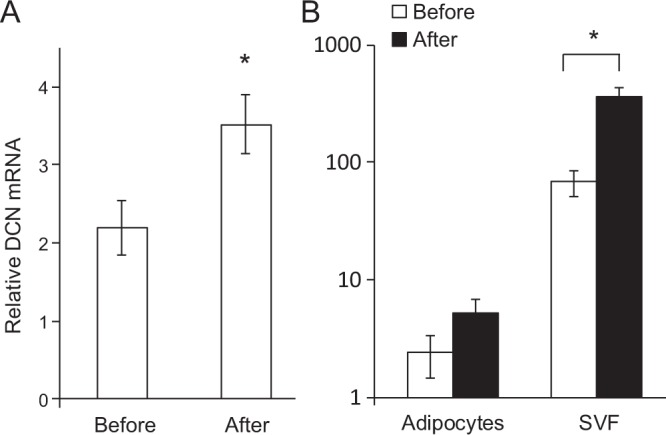
Adipose expression of DCN mRNA before and after bariatric surgery. Subcutaneous adipose tissue was collected from morbidly obese patients before and one year after bariatric surgery (gastric sleeve). RNA was purified, cDNA was synthesized and DCN mRNA was measured by qPCR and calculated relative to the reference gene HPRT, in whole tissue (A, n = 16) as well as in pairs of isolated adipocytes (n = 6) and stromal-vascular fraction (SVF, n = 6) (B). *p-value < 0.05.
Discussion
We here studied the impact of loss of decorin on obesity-related phenotypes, hypothesizing that decorin plays an important role in the regulation of body weight, glucose tolerance and adipose tissue function. Our primary finding is that loss of decorin in mice impaired glucose tolerance and increased feed efficiency upon overfeeding, indicating that decorin plays a causal role in regulating glucose metabolism. We further mapped the global gene expression in adipose tissue associated with this phenotype, which pointed to reduced extracellular matrix organization and triglyceride biosynthesis in the DcnKO mice exposed to HF diet, as well as increased complement and coagulation cascades. Our findings in patients showing increased decorin expression one year after bariatric surgery support the observation in the mice.
Insulin resistance associates with adipocyte hypertrophy in humans38. Interestingly, despite the impaired glucose tolerance and tendency of increased weight gain in the DcnKO mice, we found no evidence of increased adipocyte size. This suggests that loss of decorin negatively affected glucose homeostasis independently of adipocyte hypertrophy. Such a dissociation of insulin resistance and adipocyte hypertrophy is consistent with that seen in collagen VI knockout mice, which show a marked hypertrophy of individual adipocytes concomitant with improved glucose tolerance8.
Our genome-wide gene expression data indicate that decorin exerts positive metabolic effects by different mechanisms. Firstly, several ECM-related genes were differentially regulated in adipose tissue of the DcnKO mice, consistent with decorin serving as a component of the ECM in various tissues, including adipose tissue where it is highly expressed particularly in the visceral depot and in the stromal-vascular fraction14,15. Obesity is characterized by extensive reorganization of the extracellular matrix in adipose tissue39, and factors related to adipose ECM function have been implicated in obesity-related pathogenesis40 particularly linked to excess collagen fibril formation (fibrosis)8,41. Increased ECM deposition and rigidity in adipose tissue is thought to prevent adipose tissue expansion, while also increasing the risk of glucose intolerance during overfeeding due to ectopic lipid accumulation. Previous reports have shown increased expression of decorin along with several other ECM components in obesity6,14,16, and we also found increased decorin expression in both adipose tissue and muscle after overfeeding. However, our causal mouse data and prospective human data indicate that decorin does not promote adipose fibrosis and insulin resistance. To the contrary, the reduced glucose tolerance in the DcnKO mice is consistent with previous observations that decorin inhibits TGFβ and connective tissue growth factor, two established pro-fibrotic factors25,42.
Further, in the knockout compared to wild-type mice we found up-regulation of adipose genes involved in complement and coagulation cascades, platelet degranulation and response to elevated platelet cytosolic Ca2+. Thrombin-induced increases in cytosolic Ca2+ promote platelet reactivity, a response that is augmented in insulin resistant cells because insulin signaling normally counteracts these pro-coagulation effects of thrombin43,44. Reducing thrombin action was found to directly improve insulin sensitivity in leptin resistant obese mice, suggesting a causal role for prothrombrotic processes in obesity-related insulin resistance45. Thus, an effect of decorin knockout on pro-coagulation cascades may have contributed to the increased diet-induced insulin resistance in these mice.
An isoform of decorin has been described as a receptor for the adipose-expressed factor resistin18 named for its ability to promote insulin resistance in animal models46. The resistin receptor is formed after cleavage of a glycanation site from full-length decorin, and was found to specifically present on the surface of adipose stromal cells18. It could be expected that loss of this decorin-derived resistin receptor improves glucose tolerance, but we rather found reduced glucose tolerance in the DcnKO mice. In humans, resistin is primarily expressed in peripheral-blood mononuclear cells (PMBCs), which along with vascular cells show pro-inflammatory responses to resistin47. However, the importance of adipose resistin as a causal factor in insulin resistance remains unclear47.
In our search for specific genes that might have mediated effects of decorin knockout on glucose tolerance via adipose tissue, we performed global gene expression profiling and identified two particularly regulated genes, Prtn3 (downregulated in knockout mice) (Fig. 5A) and Hal (upregulated in knockout mice) (Fig. 5B). Prtn3 encodes Proteinase 3 which degrades ECM components including elastin, fibronectin and several collagen subtypes48. Prtn3 is highly expressed in polymorphonuclear leukocytes such as neutrophils, and plays an important role in antimicrobial defense mechanisms. Prtn3 also plays a role in noninfectious inflammation49 and elastin-derived peptides accumulate with aging and directly promote insulin resistance50. Of note, a dense mesh of elastin fibers forms in visceral adipose tissue during development of obesity, while in subcutaneous adipose tissue the elastin fibers occur more linearly and colocalize with macrophages51. However, the downregulation of Prtn3 does not readily explain the reduced glucose tolerance in the DcnKO mice, based on the proposed stimulatory roles of Prtn3 in inflammation and insulin resistance. More likely, the decreased glucose tolerance involved the most upregulated gene, Hal, which encodes a histidase that degrades the amino acid histidine. Histidine supplementation has been found to reduce oxidative stress, inflammation and fat mass and to improve glucose metabolism in mice, humans and pre-adipocyte cultures37,52–54. Thus, increased Hal expression in the DcnKO mice may have contributed to the insulin resistant phenotype by increasing the degradation of histidine.
Figure 5.

Tissue expression of the two most differentially expressed genes between DcnKO and WT C57BL/6J mice. Global gene expression was measured in iWAT by Illumina microarrays, revealing Prtn3 and Hal as the most down- and up-regulated genes, respectively, comparing dcnKO and WT mice. mRNA expression levels of Prtn3 (A) and Hal (B) in different metabolic tissues were measured by qPCR and calculated relative to the reference gene Rps13. iWAT, inguinal white adipose tissue; eWAT, epididymal white adipose tissue; BAT, interscapular brown adipose tissue. *p-value < 0.05; **p-value < 0.01; *p-value < 0.001.
Decorin is expressed in several tissues and cell types, therefore we cannot say with certainty which tissues were primarily responsible for the metabolic phenotype of the knockout mice. We found that decorin mRNA expression increased upon overfeeding in white and brown adipose tissues as well as in skeletal muscle. The decorin expression was relatively low in liver where overfeeding did not notably affect decorin levels. Interestingly, we found that Uncoupling protein 1 (Ucp1) mRNA was downregulated in brown adipose tissue (BAT) of dcnKO mice on a HF diet, suggesting that decreased thermogenesis may have contributed to the phenotype of these mice (Fig. S2). No differences in mRNA expression of Pgc1a or Prdm1 were found (Fig. S2). To know the effect of decorin loss specifically in adipose tissue, we would need conditional knockout models targeting the most relevant stromal vascular cell types. This was beyond the scope of the present study.
In conclusion, we found that decorin plays a causal role in protecting against diet-induced hyperglycemia. Previous reports have showed elevated decorin gene expression coupled with increased circulating insulin levels and insulin resistance in rodents and humans14,16. In contrast we found that fasting blood glucose was increased in absence of Dcn in mice fed HF diet in addition to higher glucose levels throughout the GTT. Moreover, the upregulation of decorin in adipose tissue following profound fat loss in humans after bariatric surgery, which has a substantial effect on improving glucose homeostasis, further supports a role for decorin in maintaining glucose tolerance. Loss of decorin associated with adipose genes involved in complement and coagulation cascades, as well as elevated adipose expression of Hal which has been implicated in inflammation and glucose intolerance through degradation of histidine. Taken together, our data show that loss of decorin causes glucose intolerance upon overfeeding, at least in part via changes in adipose tissue function.
Supplementary information
Acknowledgements
We thank Margit Solsvik, Elise Grytten, Alba Kaci, Linn Skartveit and Karen Toska for technical assistance and acknowledge the research infrastructure provided by the Norwegian Microarray Consortium (NMC; www.microarray.no) at the Genomics Core Facility, University of Bergen and by the laboratory animal facility (Vivarium), University of Bergen. Funding for this project was provided by the Western Norway Regional Health Authority, the KG Jebsen Foundation and Mohn Nutrition Research Laboratory.
Author Contributions
Study was designed by J.S., S.N.D., J.V.S. and G.M. and data were collected by J.S., T.H.R., C.E.N.S., C.H., O.A.G., A.E.M., E.R., J.F., S.N.D. Data analyses and interpretation were performed by J.S., T.H.R., C.E.N.S., C.H., O.A.G., A.E.M., J.F., S.N.D., J.V.S. and G.M. Manuscript was written by J.S., O.A.G., E.R., J.F., S.N.D., J.V.S. and G.M. and reviewed by all co-authors.
Competing Interests
The authors declare no competing interests.
Footnotes
Publisher’s note: Springer Nature remains neutral with regard to jurisdictional claims in published maps and institutional affiliations.
Therese H. Røst and Camilla E. N. Sommervoll contributed equally.
Electronic supplementary material
Supplementary information accompanies this paper at 10.1038/s41598-018-37501-x.
References
- 1.Faust IM, Johnson PR, Stern JS, Hirsch J. Diet-induced adipocyte number increase in adult rats: a new model of obesity. The American journal of physiology. 1978;235:E279–286. doi: 10.1152/ajpendo.1978.235.3.E279. [DOI] [PubMed] [Google Scholar]
- 2.Klyde BJ, Hirsch J. Increased cellular proliferation in adipose tissue of adult rats fed a high-fat diet. Journal of lipid research. 1979;20:705–715. [PubMed] [Google Scholar]
- 3.Alkhouli N, et al. The mechanical properties of human adipose tissues and their relationships to the structure and composition of the extracellular matrix. American journal of physiology. Endocrinology and metabolism. 2013;305:E1427–1435. doi: 10.1152/ajpendo.00111.2013. [DOI] [PubMed] [Google Scholar]
- 4.Divoux A, Clement K. Architecture and the extracellular matrix: the still unappreciated components of the adipose tissue. Obesity reviews: an official journal of the International Association for the Study of Obesity. 2011;12:e494–503. doi: 10.1111/j.1467-789X.2010.00811.x. [DOI] [PubMed] [Google Scholar]
- 5.Divoux A, et al. Fibrosis in human adipose tissue: composition, distribution, and link with lipid metabolism and fat mass loss. Diabetes. 2010;59:2817–2825. doi: 10.2337/db10-0585. [DOI] [PMC free article] [PubMed] [Google Scholar]
- 6.Williams AS, Kang L, Wasserman DH. The extracellular matrix and insulin resistance. Trends in endocrinology and metabolism: TEM. 2015;26:357–366. doi: 10.1016/j.tem.2015.05.006. [DOI] [PMC free article] [PubMed] [Google Scholar]
- 7.Pasarica M, et al. Adipose tissue collagen VI in obesity. The Journal of clinical endocrinology and metabolism. 2009;94:5155–5162. doi: 10.1210/jc.2009-0947. [DOI] [PMC free article] [PubMed] [Google Scholar]
- 8.Khan T, et al. Metabolic dysregulation and adipose tissue fibrosis: role of collagen VI. Molecular and cellular biology. 2009;29:1575–1591. doi: 10.1128/MCB.01300-08. [DOI] [PMC free article] [PubMed] [Google Scholar]
- 9.Spencer M, et al. Adipose tissue macrophages in insulin-resistant subjects are associated with collagen VI and fibrosis and demonstrate alternative activation. American journal of physiology. Endocrinology and metabolism. 2010;299:E1016–1027. doi: 10.1152/ajpendo.00329.2010. [DOI] [PMC free article] [PubMed] [Google Scholar]
- 10.Bolton K, Segal D, Walder K. The small leucine-rich proteoglycan, biglycan, is highly expressed in adipose tissue of Psammomys obesus and is associated with obesity and type 2 diabetes. Biologics: targets & therapy. 2012;6:67–72. doi: 10.2147/BTT.S27925. [DOI] [PMC free article] [PubMed] [Google Scholar]
- 11.Kim J, et al. Enhanced biglycan gene expression in the adipose tissues of obese women and its association with obesity-related genes and metabolic parameters. Scientific reports. 2016;6:30609. doi: 10.1038/srep30609. [DOI] [PMC free article] [PubMed] [Google Scholar]
- 12.Catalan V, et al. Increased tenascin C and Toll-like receptor 4 levels in visceral adipose tissue as a link between inflammation and extracellular matrix remodeling in obesity. The Journal of clinical endocrinology and metabolism. 2012;97:E1880–1889. doi: 10.1210/jc.2012-1670. [DOI] [PMC free article] [PubMed] [Google Scholar]
- 13.Dankel SN, et al. COL6A3 expression in adipocytes associates with insulin resistance and depends on PPARgamma and adipocyte size. Obesity. 2014;22:1807–1813. doi: 10.1002/oby.20758. [DOI] [PubMed] [Google Scholar]
- 14.Bolton K, et al. Decorin is a secreted protein associated with obesity and type 2 diabetes. International journal of obesity. 2008;32:1113–1121. doi: 10.1038/ijo.2008.41. [DOI] [PubMed] [Google Scholar]
- 15.Su AI, et al. A gene atlas of the mouse and human protein-encoding transcriptomes. Proceedings of the National Academy of Sciences of the United States of America. 2004;101:6062–6067. doi: 10.1073/pnas.0400782101. [DOI] [PMC free article] [PubMed] [Google Scholar]
- 16.Zhang J, Wright W, Bernlohr DA, Cushman SW, Chen X. Alterations of the classic pathway of complement in adipose tissue of obesity and insulin resistance. American journal of physiology. Endocrinology and metabolism. 2007;292:E1433–1440. doi: 10.1152/ajpendo.00664.2006. [DOI] [PubMed] [Google Scholar]
- 17.Kunnas T, Solakivi T, Maatta K, Nikkari ST. Decorin Genotypes, Serum Glucose, Heart Rate, and Cerebrovascular Events: The Tampere Adult Population Cardiovascular Risk Study. Genetic testing and molecular biomarkers. 2016;20:416–419. doi: 10.1089/gtmb.2016.0049. [DOI] [PubMed] [Google Scholar]
- 18.Daquinag AC, Zhang Y, Amaya-Manzanares F, Simmons PJ, Kolonin MG. An isoform of decorin is a resistin receptor on the surface of adipose progenitor cells. Cell stem cell. 2011;9:74–86. doi: 10.1016/j.stem.2011.05.017. [DOI] [PubMed] [Google Scholar]
- 19.Onuma H, et al. Plasma resistin is associated with single nucleotide polymorphisms of a possible resistin receptor, the decorin gene, in the general Japanese population. Diabetes. 2013;62:649–652. doi: 10.2337/db12-0058. [DOI] [PMC free article] [PubMed] [Google Scholar]
- 20.Font B, Aubert-Foucher E, Goldschmidt D, Eichenberger D, van der Rest M. Binding of collagen XIV with the dermatan sulfate side chain of decorin. The Journal of biological chemistry. 1993;268:25015–25018. [PubMed] [Google Scholar]
- 21.Font B, Eichenberger D, Rosenberg LM, van der Rest M. Characterization of the interactions of type XII collagen with two small proteoglycans from fetal bovine tendon, decorin and fibromodulin. Matrix biology: journal of the International Society for Matrix Biology. 1996;15:341–348. doi: 10.1016/S0945-053X(96)90137-7. [DOI] [PubMed] [Google Scholar]
- 22.Wiberg C, et al. Biglycan and decorin bind close to the n-terminal region of the collagen VI triple helix. The Journal of biological chemistry. 2001;276:18947–18952. doi: 10.1074/jbc.M100625200. [DOI] [PubMed] [Google Scholar]
- 23.Reinboth B, Hanssen E, Cleary EG, Gibson MA. Molecular interactions of biglycan and decorin with elastic fiber components: biglycan forms a ternary complex with tropoelastin and microfibril-associated glycoprotein 1. The Journal of biological chemistry. 2002;277:3950–3957. doi: 10.1074/jbc.M109540200. [DOI] [PubMed] [Google Scholar]
- 24.Gendelman R, Burton-Wurster NI, MacLeod JN, Lust G. The cartilage-specific fibronectin isoform has a high affinity binding site for the small proteoglycan decorin. The Journal of biological chemistry. 2003;278:11175–11181. doi: 10.1074/jbc.M211799200. [DOI] [PubMed] [Google Scholar]
- 25.Hildebrand A, et al. Interaction of the small interstitial proteoglycans biglycan, decorin and fibromodulin with transforming growth factor beta. The Biochemical journal. 1994;302(Pt 2):527–534. doi: 10.1042/bj3020527. [DOI] [PMC free article] [PubMed] [Google Scholar]
- 26.Iozzo RV, Moscatello DK, McQuillan DJ, Eichstetter I. Decorin is a biological ligand for the epidermal growth factor receptor. The Journal of biological chemistry. 1999;274:4489–4492. doi: 10.1074/jbc.274.8.4489. [DOI] [PubMed] [Google Scholar]
- 27.Tufvesson E, Westergren-Thorsson G. Tumour necrosis factor-alpha interacts with biglycan and decorin. FEBS letters. 2002;530:124–128. doi: 10.1016/S0014-5793(02)03439-7. [DOI] [PubMed] [Google Scholar]
- 28.Miura T, et al. Decorin binds myostatin and modulates its activity to muscle cells. Biochemical and biophysical research communications. 2006;340:675–680. doi: 10.1016/j.bbrc.2005.12.060. [DOI] [PubMed] [Google Scholar]
- 29.Gubbiotti MA, Vallet SD, Ricard-Blum S, Iozzo RV. Decorin interacting network: A comprehensive analysis of decorin-binding partners and their versatile functions. Matrix biology: journal of the International Society for Matrix Biology. 2016;55:7–21. doi: 10.1016/j.matbio.2016.09.009. [DOI] [PMC free article] [PubMed] [Google Scholar]
- 30.Winzell MS, Ahren B. The high-fat diet-fed mouse: a model for studying mechanisms and treatment of impaired glucose tolerance and type 2 diabetes. Diabetes. 2004;53(Suppl 3):S215–219. doi: 10.2337/diabetes.53.suppl_3.S215. [DOI] [PubMed] [Google Scholar]
- 31.Mellgren AE, et al. Development of congenital stromal corneal dystrophy is dependent on export and extracellular deposition of truncated decorin. Investigative ophthalmology & visual science. 2015;56:2909–2915. doi: 10.1167/iovs.14-16014. [DOI] [PubMed] [Google Scholar]
- 32.Dankel SN, et al. Switch from stress response to homeobox transcription factors in adipose tissue after profound fat loss. Plos one. 2010;5:e11033. doi: 10.1371/journal.pone.0011033. [DOI] [PMC free article] [PubMed] [Google Scholar]
- 33.Caro JF, Sinha MK, Kolaczynski JW, Zhang PL, Considine RV. Leptin: the tale of an obesity gene. Diabetes. 1996;45:1455–1462. doi: 10.2337/diab.45.11.1455. [DOI] [PubMed] [Google Scholar]
- 34.Couillard C, et al. Hyperleptinemia is more closely associated with adipose cell hypertrophy than with adipose tissue hyperplasia. International journal of obesity and related metabolic disorders: journal of the International Association for the Study of Obesity. 2000;24:782–788. doi: 10.1038/sj.ijo.0801227. [DOI] [PubMed] [Google Scholar]
- 35.Machinal-Quelin F, Dieudonne MN, Leneveu MC, Pecquery R, Giudicelli Y. Proadipogenic effect of leptin on rat preadipocytes in vitro: activation of MAPK and STAT3 signaling pathways. American journal of physiology. Cell physiology. 2002;282:C853–863. doi: 10.1152/ajpcell.00331.2001. [DOI] [PubMed] [Google Scholar]
- 36.Sturrock AB, et al. Structure, chromosomal assignment, and expression of the gene for proteinase-3. The Wegener’s granulomatosis autoantigen. The Journal of biological chemistry. 1992;267:21193–21199. [PubMed] [Google Scholar]
- 37.Feng RN, et al. Histidine supplementation improves insulin resistance through suppressed inflammation in obese women with the metabolic syndrome: a randomised controlled trial. Diabetologia. 2013;56:985–994. doi: 10.1007/s00125-013-2839-7. [DOI] [PubMed] [Google Scholar]
- 38.Kloting N, et al. Insulin-sensitive obesity. American journal of physiology. Endocrinology and metabolism. 2010;299:E506–515. doi: 10.1152/ajpendo.00586.2009. [DOI] [PubMed] [Google Scholar]
- 39.Crandall DL, Hausman GJ, Kral JG. A review of the microcirculation of adipose tissue: anatomic, metabolic, and angiogenic perspectives. Microcirculation. 1997;4:211–232. doi: 10.3109/10739689709146786. [DOI] [PubMed] [Google Scholar]
- 40.Lee MJ, Wu Y, Fried SK. Adipose tissue remodeling in pathophysiology of obesity. Current opinion in clinical nutrition and metabolic care. 2010;13:371–376. doi: 10.1097/MCO.0b013e32833aabef. [DOI] [PMC free article] [PubMed] [Google Scholar]
- 41.Chun TH, et al. Genetic link between obesity and MMP14-dependent adipogenic collagen turnover. Diabetes. 2010;59:2484–2494. doi: 10.2337/db10-0073. [DOI] [PMC free article] [PubMed] [Google Scholar]
- 42.Vial C, Gutierrez J, Santander C, Cabrera D, Brandan E. Decorin interacts with connective tissue growth factor (CTGF)/CCN2 by LRR12 inhibiting its biological activity. The Journal of biological chemistry. 2011;286:24242–24252. doi: 10.1074/jbc.M110.189365. [DOI] [PMC free article] [PubMed] [Google Scholar]
- 43.Gerrits AJ, et al. Induction of insulin resistance by the adipokines resistin, leptin, plasminogen activator inhibitor-1 and retinol binding protein 4 in human megakaryocytes. Haematologica. 2012;97:1149–1157. doi: 10.3324/haematol.2011.054916. [DOI] [PMC free article] [PubMed] [Google Scholar]
- 44.Randriamboavonjy V, Fleming I. Insulin, insulin resistance, and platelet signaling in diabetes. Diabetes care. 2009;32:528–530. doi: 10.2337/dc08-1942. [DOI] [PMC free article] [PubMed] [Google Scholar]
- 45.Mihara M, et al. Inhibition of thrombin action ameliorates insulin resistance in type 2 diabetic db/db mice. Endocrinology. 2010;151:513–519. doi: 10.1210/en.2009-0661. [DOI] [PubMed] [Google Scholar]
- 46.Steppan CM, et al. The hormone resistin links obesity to diabetes. Nature. 2001;409:307–312. doi: 10.1038/35053000. [DOI] [PubMed] [Google Scholar]
- 47.Huang X, Yang Z. Resistin’s, obesity and insulin resistance: the continuing disconnect between rodents and humans. Journal of endocrinological investigation. 2016;39:607–615. doi: 10.1007/s40618-015-0408-2. [DOI] [PubMed] [Google Scholar]
- 48.Sturrock A, Franklin KF, Wu S, Hoidal JR. Characterization and localization of the genes for mouse proteinase-3 (Prtn3) and neutrophil elastase (Ela2) Cytogenetics and cell genetics. 1998;83:104–108. doi: 10.1159/000015144. [DOI] [PubMed] [Google Scholar]
- 49.Kessenbrock K, et al. Proteinase 3 and neutrophil elastase enhance inflammation in mice by inactivating antiinflammatory progranulin. The Journal of clinical investigation. 2008;118:2438–2447. doi: 10.1172/JCI34694. [DOI] [PMC free article] [PubMed] [Google Scholar]
- 50.Blaise S, et al. Elastin-derived peptides are new regulators of insulin resistance development in mice. Diabetes. 2013;62:3807–3816. doi: 10.2337/db13-0508. [DOI] [PMC free article] [PubMed] [Google Scholar]
- 51.Martinez-Santibanez G, et al. Obesity-induced remodeling of the adipose tissue elastin network is independent of the metalloelastase MMP-12. Adipocyte. 2015;4:264–272. doi: 10.1080/21623945.2015.1027848. [DOI] [PMC free article] [PubMed] [Google Scholar]
- 52.Lee YT, Hsu CC, Lin MH, Liu KS, Yin MC. Histidine and carnosine delay diabetic deterioration in mice and protect human low density lipoprotein against oxidation and glycation. European journal of pharmacology. 2005;513:145–150. doi: 10.1016/j.ejphar.2005.02.010. [DOI] [PubMed] [Google Scholar]
- 53.Ali AT, et al. Ethnic differences in pre-adipocyte intracellular lipid accumulation and alkaline phosphatase activity. Clinica chimica acta; international journal of clinical chemistry. 2015;438:382–387. doi: 10.1016/j.cca.2014.09.022. [DOI] [PubMed] [Google Scholar]
- 54.Sun X, et al. Histidine supplementation alleviates inflammation in the adipose tissue of high-fat diet-induced obese rats via the NF-kappaB- and PPARgamma-involved pathways. The British journal of nutrition. 2014;112:477–485. doi: 10.1017/S0007114514001056. [DOI] [PubMed] [Google Scholar]
Associated Data
This section collects any data citations, data availability statements, or supplementary materials included in this article.