

Abstract
Lysine crotonylation (Kcr) is a recently identified post-translational modification (PTM) that is regulated by an acetyltransferase, p300. The p300-catalyzed histone Kcr is able to stimulate transcription to a greater degree than the well-studied histone lysine acetylation (Kac). Despite these progresses, the global Kcr substrates regulated by p300 remain largely unknown, hindering efforts to establish mechanistic links between Kcr and p300-mediated phenotypes. Here, a quantitative proteomics study to characterize the p300-regulated lysine crotonylome is reported. A total of 816 unique endogenous crotonylation sites are identified across 392 proteins, with 88 sites from 69 proteins being decreased by more than 0.7-fold (log2 < 0.5) and 31 sites from 17 proteins being increased by more than 1.4-fold (log2 > 0.5) in response to p300 knockout (KO). The most downregulated crotonylome alterations under p300 deficiency concern components of the nonsense-mediated decay, infectious disease, and viral/eukaryotic translation pathways. Moreover, some p300-targeted Kcr substrates are potentially linked to diseases such as cancer. Taken together, this study reveals the lysine crotonylome in response to p300, which sheds light on the role for lysine crotonylation in regulation of diverse cellular processes and provides new insights into mechanisms of p300 functions.
Keywords: acetyltransferase, lysine crotonylation, p300, post-translational modification, quantitative proteomics
1. Introduction
The human gut is populated with trillions of microorganisms.[1] Diverse metabolites generated by gut microbes and host metabolism, including short chain fatty acids and their derivatives, have been shown to play important roles in modulating a variety of physiological processes in the host, such asmetabolism and immune responses.[2–4] Moreover, perturbations of gut microbiota are relevant to many human diseases.[5] Despite the recent progress in studying functions of gut microbes and their metabolites, it remains a fundamental challenge to understand the underlying mechanisms by which these metabolites influence host phenotypes.
Emerging evidences suggest that the human gut microbes participate in the creation of epigenetic marks, which serves as a new mechanism that links gut microbes to transcriptional regulation. For example, we have demonstrated that some gut microbial fermentation products, such as propionate and butyrate, are precursors of their corresponding PTMs that play important roles in diverse biological processes.[4,6] Remarkably, crotonyl-CoA, the precursor of Kcr, could be generated by Acidaminococcus fermentans that was isolated from the human and pig intestinal tracts.[7] Kcr is a new type of abundant and evolutionarily conserved histone mark that correlates with active gene expression.[8] In male germinal cells immediately following meiosis, histone Kcr, but not histone Kac, is enriched on sex chromosomes and specifically marks testis-specific genes. In addition, recent studies have revealed the unique binding modules of histone Kcr and supported a role of histone Kcr in the modulation of kidney injury.[9,10] The unique features of histone Kcr suggest that it is dynamic and functionally different from histone Kac, the well-studied PTM with diverse functions.[11]
Histone acetyltransferases and histone deacetylases are two classes of enzymes that regulate the dynamics of histone Kac.[12] Recent studies showed that p300, a member of the lysine acetyltransferase family, could also catalyze lysine crotonylation using crotonyl-CoA as a donor.[13] Genetic and environmental perturbations could alter the cellular concentration of crotonyl-CoA and in turn regulate the histone crotonylation level. The p300-catalyzed histone Kcr can directly stimulate transcription to a greater degree than histone Kac.[13,14] These studies therefore expanded our knowledge of p300 and linked cellularmetabolism or a microbial product to the regulation of gene expression.However, it remains unclear exactly how the p300 regulates diverse cellular processes through Kcr, especially through non-histone Kcr.
More recently, couple global crotonylome in mammalian cells was reported and it revealed the potential roles of Kcr in multiple cellular functions.[10,15] However, no Kcr substrates of its regulatory enzyme are revealed, hindering characterization of mechanisms by which this modification exerts its biological functions. Here, we seek to better understand the Kcr pathway by carrying out the first global quantitative proteomics study of Kcr in response to its regulatory enzyme p300. Our study identified 816 unique endogenous Kcr sites from wild type (WT) and p300 null HCT116 cells and quantified 775 of them, among which 88 sites from 69 proteins were decreased by more than 0.7-fold (log2 < 0.5) and 31 sites from 17 proteins were increased by more than 1.4-fold (log2 > 0.5) in response to p300 KO. Pathway analysis of the p300-targeted Kcr proteome revealed important roles of p300 in regulating RNA processes such as RNA metabolism and translation. In addition, this study reveals potential links of p300 to diverse human diseases through its regulation of Kcr on disease-related proteins.
2. Experimental Section
Materials:
Pan anti-Kcr antibody was purchased from PTM Biolabs (Chicago, IL, catalog number: PTM-501). LMNB2 antibody was purchased from Cell Signaling Technology, Inc. (Danvers, MA, catalog number: 12255). WT and p300 null HCT116 cells were kind gifts from Professor Robert G. Roeder at The Rockefeller University. 12C614N2-L-Lysine and 13C614N2-L-Lysine were purchased from Cambridge Isotope Laboratories (catalog number: ULM-8766-PK and CNLM-291-H-PK). Modified sequencing-grade trypsin was purchased from Promega (Madison, WI). C18 ZipTips were bought from Millipore Corporation (Bedford, MA). Protein A agarose beads were bought from GE Healthcare Biosciences (Pittsburgh, PA).
Stable Isotope Labeling of Cells:
WT and p300 null HCT116 cells were grown in lysine-free DMEM supplemented with 10% dialyzed FBS, and either “light” (12C614N2-L-Lysine) or “heavy” (13C614N2-L-Lysine) lysine (100 mg L−1). Cells were grown for more than seven generations before being harvested, to achieve more than 98% labeling efficiency (based on MS analysis).
Preparation of Cell Lysate:
For each replicate, the “heavy” and “light” cells (2 × 10⁷) were harvested and washed twice with cold phosphate-buffered saline, respectively. The cells were sonicated for 3 min on ice using a sonic dismembrator (Model 500, Fisher Scientific, Hampton, NH) in lysis buffer (8 m urea, 2 mm EDTA, 3 μm Trichostatin A, 50 mm Nicotinamide, 5 mm DTT, and 1% Protease inhibitor cocktail (Roche, Basel, Switzerland). After centrifugation (18 000 g) at 4 °C for 3 min, the supernatant was collected and equal amounts of proteins from the WT and p300 null HCT116 cells were mixed.
Trypsin Digestion of Cell Lysate and Peptide Fractionation:
The mixed proteins (6 mg) were reduced with 10 mm DTT for 1 h at 37 °C, alkylated with 20 mM iodoacetamide for 45 min at room temperature in darkness, and the excess iodoacetamide was blocked by 20 mm cysteine. The protein sample was then diluted by 100 mm NH4HCO3 to make the urea concentration less than 2 m. Trypsin was added at 1:50 trypsin-to-protein ratio (weight to weight) for the first digestion overnight and then at 1:100 trypsin-to-protein ratio (weight to weight) for a second digestion for 4 h. Finally, the resulting proteolytic peptides were separated on preparative HPLC into six fractions using Agilent 300 Extend C18 column (5 μm particles, 4.6 mm ID, 250 mm length) followed by drying in SpeedVac (ThermoFisher Scientific, Waltham, MA).
Immunoaffinity Enrichment:
Pan anti-Kcr antibody was first immobilized to pre-washed protein A agarose beads at a density of 5 mg of antibody per mL drained beads. A peptide powder obtained from above (1 mg) was dissolved in NETN buffer (100 mm NaCl, 1 mm EDTA, 50 mm Tris-HCl, 0.5% Nonidet P-40, pH 8.0) and incubated with 20 μL of antibody-immobilized protein A beads at 4 °C overnight with gentle shaking. After incubation, the beads were washed four times with NETN buffer and twice with ddH2O. The bound Kcr peptides were eluted from the beads with 0.1% trifluoroacetic acid, and the eluted fractions were combined, vacuum-dried, and desalted with C18 ZipTip (EMD Millipore, Billerica, MA).
Mass Spectrometry:
The affinity-enriched Kcr peptides obtained above were dissolved in 0.1% formic acid in water and directly loaded onto a reversed-phase HPLC column (10 cm length with 75 μm inner diameter) packed in-house with Reprosil 100 C18 resin (3 μm particle size, Dr. Maisch GmbH, Beim Brückle, Germany). The loaded samples were eluted with a gradient of 5–80% HPLC buffer B (0.1% formic acid in 90% acetonitrile, v/v) in buffer A (0.1% formic acid in water, v/v) at a flow rate of 200 nL min−1 over 60 min by an EASY-nLC 1000 UHPLC (ThermoFisher Scientific, Waltham, MA). The samples were analyzed by a Q Exactive mass spectrometer (ThermoFisher Scientific). A data-dependent procedure that alternated between one full mass scan followed by the top 15 most intense precursor ions was applied with 25 second-dynamic exclusion. Intact peptides were detected with a resolution of 70 000, and the tandem mass spectra were acquired with a mass resolution of 17 500 at 27% normalized collision energy.
Database Search and Data Filter Criteria:
The resulting MS/MS data was searched against UniProt Human protein database (88 277 entries, http://http://www.uniprot.org) using MaxQuant with integrated Andromeda search engine (v.1.3.0.5).[16] Trypsin was specified as cleavage enzyme allowing a maximum of two missing cleavages. Carbamidomethylation on cysteine was specified as fixed modification. Oxidation on methionine, acetylation on protein N-terminal, crotonylation on lysine, and acetylation on lysine were specified as variable modifications. FDR thresholds for protein, peptide, and modification sites were specified at 1%. The following Kcr peptides were considered as false positives and therefore removed from our list: Kcr identified on peptides from reverse or contaminant protein sequences, peptides with score below 40, site localization probability below 0.75, and Kcr sites on peptide C-terminus unless the peptide C-terminal was also the corresponding protein C-terminal.
To ensure that the Kcr level changes in p300 KO cells did not result from changes in protein levels, the protein expression levels were quantified. Briefly, 200 μg of proteolytic peptides obtained in previous step were separated on HPLC into 20 fractions, or 30 μg of whole cell lysates were separated into 12 fractions with SDS-PAGE. These samples were analyzed using the same procedures for the Kcr peptides quantification. Finally, all the ratios of quantified Kcr peptides were normalized by the ratios of their corresponding protein expression levels.
Bioinformatics Analysis:
Pathway enrichment analysis was performed using a hypergeometric test in ReactomePA package in R.[17] Protein complexes were enriched basing on manually curated CORUM protein complex database for all mammals using hypergeometric test.[18] The protein–protein interaction network of p300-regulated Kcr proteome was determined basing on STRING database (v10, http://www.string-db.org/) and visualized in Cytoscape (v.3.2.1).[19]
Mutations and protein substrate/co-factor binding sites were extracted from UniProt database (http://www.uniprot.org). Cancer gene and cancer biomarkers were extracted from Catalogue of Somatic Mutations in Cancer (COSMIC, http://cancer.sanger.ac.uk/cosmic) and Early Detection Research Network (EDRN, https://edrn.nci.nih.gov/) databases, respectively.[20]
Statistical Analysis:
Significance B algorithm embedded in Perseus software was employed to identify Kcr sites with statistically significant changes.[21] Briefly, logarithmic mean ratio values and average intensities of each Kcr peptide were used for the analysis. Random values between −2 and −6 were assigned to the “WT only” sites because the majority of the logarithmic mean ratios are higher than −2 and the lowest ratio value is about −6. Finally, a both-side Significance B test with a p-value or Benjamini–Hochberg FDR threshold of 0.05 was performed.
3. Results
3.1. Systematic Profiling of Kcr in Response to p300 KO
To globally identify Kcr substrates and quantify their changes in response to p300 KO, we used SILAC coupled with immunoaffinity enrichment and MS analysis, and the depletion of p300 was confirmed by western blot (Figure 1A).[22] Three biological replicate experiments were performed wherein p300 null and WT HCT116 cells were metabolically labeled with “heavy” lysine (13C615N2-Lys) and “light” lysine (12C614N2-Lys), respectively (Figure 1B). The cells were lysed and equal amount of proteins from “heavy” and “light” cells were combined. The mixed proteins were digested by trypsin and the resulting peptides were then resolved into six HPLC fractions. The Kcr-containing peptides in each fraction were enriched with immobilized anti-Kcr antibodies and analyzed by nano-HPLC-MS/MS on a Q Exactive mass spectrometer. The resulting MS/MS data were processed using MaxQuant software (v 1.3.0.5) with an overall FDR for protein, peptide, and modification site of less than 1%. To improve the reliability of the identified Kcr peptides, we removed those low score and low localization probability peptide hits.
Figure 1.
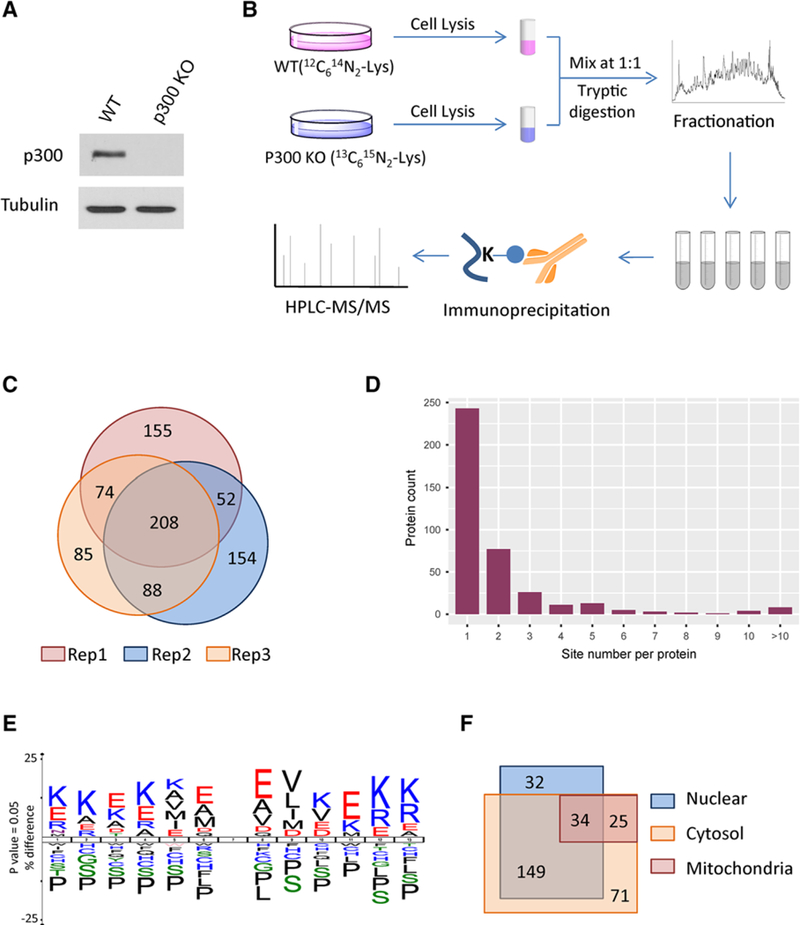
Systematic Profiling of Kcr proteome. A) Validation of the p300 depletion by Western blot. B) Schematic representation of experimental workflow for the identification and quantification of Kcr in WT and p300 KO cells. C) Pie chart shows experimental reproducibility of three biological replicates. D) Distribution of the number of Kcr sites per protein. E) Consensus sequence logo shows a representative sequence for all Kcr sites. F) Venn diagram shows cellular compartment distribution of Kcr proteins.
Using this approach, we identified 816 unique Kcr sites on 392 proteins (Table S1, Supporting Information). These results demonstrated good reproducibility of our procedure, as 52% of these sites were identified in at least two biological replicates (Figure 1C). Finally, we obtained 775 quantifiable sites, in which 45 Kcr sites decreased in abundance by more than ≈30% (−log2(KO/WT) < 0.5) in response to p300 KO and 43 Kcr sites were only detected in WT HCT116 cells.
3.2. Characterization of Kcr Proteome
Across the identified Kcr proteins, 243 (62%) had a single Kcr site and 150 (38%) had two or more Kcr sites (Figure 1D). To determine statistically enriched motifs within the identified Kcr substrates, we used IceLogo to compare the amino acid sequences around observed Kcr sites against all human background sequences.[23] We found that negatively charged amino acid glutamic acid was enriched at −4, −1, +1, and +4 positions relative to the Kcr site (Figure 1E). In addition, hydrophobic amino acid valine was overrepresented at +2 position, while positively charged amino acid lysine was enriched at other positions. Interestingly, proline, serine, and leucine were largely depleted at most of the positions. This is distinct from the reported motifs of Kac, lysine malonylation, and succinylation,[24,25] indicating that Kcr has unique structural preferences and therefore may lead to different readouts from the other PTMs.
Next, we performed a cellular compartment analysis of the Kcr proteome to explore the subcellular distribution of Kcr substrates in cells. We found that 69 and 89% of Kcr proteins localized exclusively or partially in nucleus and cytosol, respectively (Figure 1F). Unlike the reported lysine malonylation and succinylation that are mainly enriched in mitochondrion,[25] only ≈19% of Kcr proteins were annotated in mitochondria. Additionally, 89% of p300-targeted Kcr proteins localized exclusively or partially in nucleus, which is consistent with the subcellular distribution of p300, suggesting that Kcr pathway may be involved in p300-mediated nuclear cellular functions.
3.3. Quantitative Analysis of Kcr Proteome
Our quantitative analysis identified Kcr sites whose intensity decreased markedly in response to p300 KO. In total, 45 Kcr sites (represented in 33 proteins) were quantified with log2(KO/WT) ratios lower than −0.5 and 43 Kcr sites (represented in 38 proteins) could only be detected in WT HCT116 cells (Table S1, Supporting Information), which we designated as potential p300 substrates (Figure 2A). Further both-side Significance B analysis of the quantifiable Kcr sites showed that logarithmic ratio threshold of “statistical significance” (p < 0.05) is −0.49 for downregulation (Figure S1 and Table S1, Supporting Information; please note that the ratio threshold will be −0.62 under Benjamini–Hochberg FDR correction), indicating the cutoff of −0.5 is reasonable in this case. Some of these proteins contain multiple Kcr sites and have median KO/WT ratios lower than 1. For example, seven of ten Kcr sites in Heterogeneous nuclear ribonucleoproteins C1/C2 (HNRNPC) were greatly decreased in response to p300 KO, giving a median KO/WT ratio of 0.46 (Figure 2B). In addition, Lamin-B2, a protein that provides framework for the nuclear envelope and may also interact with chromatin, contains four p300-targeted Kcr sites and has a median KO/WT ratio of 0.49 (Figure 2B). The multiple Kcr sites and low median KO/WT ratios of these proteins indicate that they are most likely high-confidence p300 targets, suggesting biological roles for p300 beyond transcription. Please note that although no Kcr site could be detected in p300 KO cells, we detected 31 Kcr sites with log2(KO/WT) ratios higher than 0.5. As an acyltransferase, p300 plays broad roles in the regulation of diverse cellular processes through acetylation, including the regulation of HDACs.[26] Therefore, the upregulation of some Kcr sites might be caused by indirect regulation of p300, such as hampering some HDACs’ activity.
Figure 2.
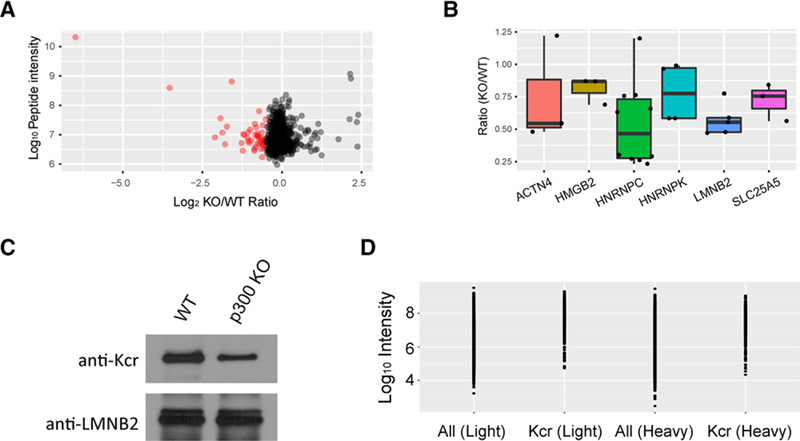
A) Scatter plot shows the quantification of Kcr sites in relation to peptide intensities. The Kcr sites that could only be detected in WT cells are not shown in this scatter plot. B) Box plot shows representative proteins with p300-regulated Kcr sites. C) Validation of the Kcr level change in response to p300 KO by Western blot. D) Graph indicates the abundance distribution of Kcr modified proteins and all proteins in either “light” or “heavy” labeled cells.
To validate our findings of p300-mediated Kcr, we performed a pull-down assay of one p300-targeted protein LMNB2 in either WT or p300 KO cells using pan anti-LMNB2 antibody. Western blot analysis with pan-Kcr antibody showed that Kcr level of LMNB2 decreased obviously under p300 depletion condition (Figure 2C), which confirms our quantitative Kcr proteome results well. In addition, the abundance of Kcr proteins is spread over four orders of magnitudes in either the WT or the p300 KO cells, indicating that our screening is not biased toward high abundant proteins (Figure 2D).
3.4. Function Annotation of Kcr Proteome
To understand the biological functions of the total Kcr and p300-targeted Kcr substrates, we performed enrichment analysis with the GO database.[27] Our data showed that the Kcr proteins are significantly enriched in translation and transcription processes with specific enrichments in co-translational protein-targeting membrane (adjusted p = 3.7 × 10−46), nuclear-transcribed mRNA catabolic process (adjusted p = 3.7 × 10−46), and translational initiation (adjusted p = 6.3 × 10−39) (Figure 3). Similarly, the nuclear-transcribed mRNA catabolic processes (adjusted p = 3.6 × 10⁻⁹) are also among the most enriched biological processes of p300-targeted Kcr proteins (Figure 3). Remarkably, RNA metabolic process (adjusted p = 2.0 × 10⁻¹⁰) and RNA processing (adjusted p = 2.0 × 10⁻¹⁰) are also among the most prominent biological processes enriched with decreased Kcr levels in p300 KO cells, which is consistent with the established role of p300 in transcription regulation and reveals the role of Kcr in p300-mediated biological processes.
Figure 3.
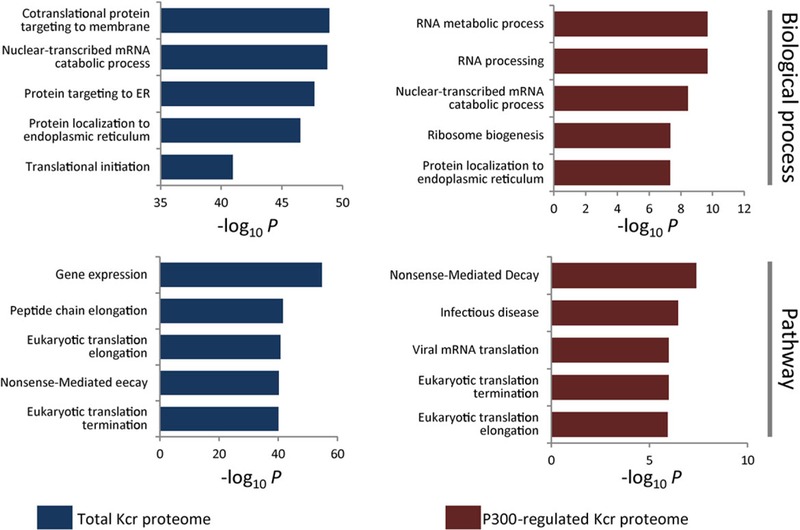
Bar graphs showing representative biological process and pathway annotations enriched with total and p300-regulated Kcr proteome, respectively.
3.5. Cellular Pathways Analysis of Kcr Proteome
Next, to understand the cellular pathways involving Kcr substrates and p300-targeted Kcr proteins, we performed pathway enrichment analysis with Reactome database (http://www.reactome.org). Our data showed that the enriched pathways of total Kcr proteins and p300-targeted Kcr proteins are similar. Both of them are highly associated with RNA processing such as nonsense-mediated decay, eukaryotic translation termination, and eukaryotic translation elongation (Figure 3). Additionally, we found that the total Kcr proteins were enriched for gene expression (adjusted p = 1.1 × 10−52) because of the identification of crotonylated histones, transcription factors, and heterogeneous nuclear ribonucleoproteins (Figure 3). Interestingly, the p300-targeted Kcr proteins were also enriched in infection disease (adjusted p = 3.4 × 10⁻⁷) and viral mRNA translation (adjusted p = 1.0 × 10⁻⁶). The pathway analysis is consistent with the function annotation and suggests that p300 may regulate RNA processing via reversible protein Kcr.
3.6. Interaction Network of p300-Targeted Kcr Proteins
Many proteins carry out their cellular functions through interacting with binding partners, and loss of specific protein–protein interactions (PPIs) in the organism leads to diverse diseases. PTMs can serve as docking sites to recruit binding proteins, and therefore have the potential to regulate PPIs. To explore the roles of p300 in regulating PPIs through Kcr, we visualized the protein interaction networks with p300-regulated Kcr proteins basing on STRING database.[19] Our results showed a highly connected protein interaction network (Figure 4). Some high-degree protein nodes, such as the HNRNPC, have multiple p300-targeted sites and represent the sub-hubs of the p300-regulated protein interaction network. Fluctuation of these Kcr sites caused by p300 may greatly change the protein interaction network and lead to dysfunction of this complex. Further protein complex analysis basing on the CORUM database revealed that several groups of proteins, including the nop56p-associated pre-rRNA complex (adjusted p = 2.1 × 10⁻¹⁴), parvulin-associated pre-rRNA complex (adjusted p = 4.0 × 10⁻⁸), and C complex spliceosome (adjusted p = 1.1 × 10⁻⁴), are closely linked, suggesting a role of p300 in regulation of these complexes. The nop56p-associated pre-rRNA complex is important in the early-to-middle stages of 60 S subunit synthesis in human cells.[28] Our data showed that p300 regulates Kcr on ten components of this complex. Crotonylation of K416 on the core component Nucleolar protein 56 decreased more than 50% upon p300 KO. Moreover, five Kcr sites on four of these components could only be detected in p300 WT cells. C complex spliceosome is essential for removing non-coding introns from nascent pre-mRNAs.[29] In this study, we found that crotonylation of four proteins in this complex, including HNRNPC, heterogeneous nuclear ribonucleoprotein A1, splicing factor 3B subunit 2, and eukaryotic initiation factor 4A-III, decreased markedly upon p300 KO. Our data therefore reveal a potentially important role of p300 in the RNA-splicing process.
Figure 4.
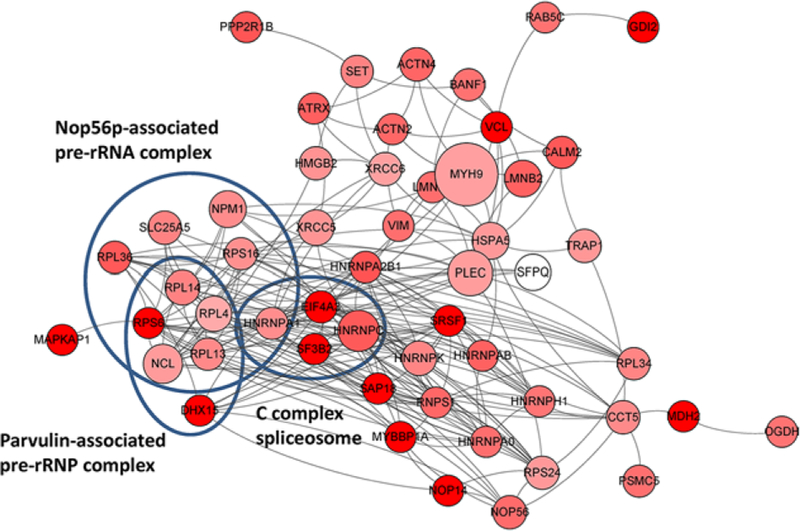
Interaction network of p300-regulated Kcr proteome based on STRING database (v10). The network is visualized in Cytoscape, and the size of the node is positively corresponded to the number of Kcr sites per protein. The proteins with median ratios (KO/WT) lower than 1 are marked in red (darker red color represents lower median ratio).
3.7. Possible Impact of Kcr on Protein Functions
To investigate the possible effect of Kcr on protein functions, we compared the Kcr sites with reported mutations that are associated with protein dysfunction in UniProt database (http://www.uniprot.org). In total, we identified nine Kcr sites where the mutations greatly affected protein functions (Table 1). For example, Nucleophosmin acts as a chaperonin for core histones and is involved in diverse cellular processes such as histone assembly, ribosome biogenesis, and cell proliferation.[30] Mutations of K248A, K250A, and K267A on Nucleophosmin can influence its structural stabilization.[31] Mitochondrial malate dehydrogenase is an enzyme in the citric acid cycle that catalyzes the conversion of malate into oxaloacetate and vice versa. A mutation of K301R on this protein can affect its enzyme activity.[32] These results provided insight into potential links between Kcr and protein dysfunction–related genetic mutations.
Table 1.
Kcr sites on key residues involving protein dysfunctions or substrates/cofactors binding.
| Name | Site | Function |
|---|---|---|
| LMNA | 201 | K → L mutation is associated with increased cell death |
| NPM1 | 248 | K → A mutation leads to partial destabilization of the structure |
| NPM1 | 250 | K → A mutation increases in the stabilization of the structure |
| NPM1 | 267 | K → A mutation increases in the stabilization of the structure |
| MDH2 | 301 | K → R mutation impacts enzyme activity |
| CTNND1 | 401 | K → M mutation leads to complete loss of cadherin interaction |
| RPS27A | 48 | K → R mutation impacts polyubiquitination of PCNA |
| BANF1 | 54 | K → E mutation reduces binding to dsDNA |
| BANF1 | 6 | K → E mutation leads to complete loss of dsDNA binding |
| NME1 (isoform 2) | 37 | ATP-binding site |
| ALDOA (isoform 2) | 147 | Substrate-binding site |
| HSP90B1 | 162 | ATP-binding site |
| AK2 | 186 | AMP-binding site |
| TKT | 318 | Substrate-binding site |
| PKM | 70 | Serine-binding site |
| LATS1 | 734 | ATP-binding site |
| CALR | 62 | Calcium binding site |
In addition to the mutations, we also found that many substrate or cofactor binding sites were crotonylated (Table 1). For example, K37 of nucleoside diphosphate kinase A (isoform 2), K162 of endoplasmin, and K734 of serine/threonine-protein kinase LATS1 are critical residues for ATP binding (www.uniprot.com); K147 of fructose-bisphosphate aldolase A (isoform2) and K318 of Transketolase (isoform2) are known to be important for their substrates binding (www.uniprot.com). Kcr on these positions is most likely to affect the protein functions by disrupting the binding interaction.
4. Discussion
This quantitative proteomics study represents the first systematic analysis of Kcr proteins in response to p300 KO. We identified 816 unique endogenous Kcr sites on 392 proteins in mammalian cells. Among these Kcr sites, 464 sites (56.8%) have not been reported in mammalian cells; therefore, this study expanded the depth of the Kcr proteome. Furthermore, 88 sites from 69 proteins were decreased by more than 0.7-fold (log2 < 0.5) and 31 sites from 17 proteins were increased by more than 1.4-fold (log2 > 0.5) in response to p300 KO. Comparing with the reported lysine acetylome,[24,33] 43% of the p300-targeted Kcr sites could overlap with known Kac sites. Additionally, only six of the 88 p300-targeted Kcr sites are annotated in mitochondria, the cellular compartment that may generate non-enzymatic lysine acylation due to the high pH and high concentration of acetyl-CoA.[34] Therefore, these Kcr sites are most likely the p300-regulated Kcr substrates, instead of chemical reaction products.
In our study, some crotonylated proteins related to RNA processing and RNA metabolic processes are targeted by p300. Consistent with these results, we found that nonsense-mediated decay and several translation-related pathways are among the most dynamically regulated pathways. Monitoring the Kcr proteome thus not only identifies the crotonylation events but also sheds additional light on the role of p300 in nuclei-related cellular processes.
Emerging evidences have demonstrated that short chain fatty acid metabolites and their corresponding CoAs generated by gut microbes affect host physiology significantly.[2] However, the underlying mechanism is poorly understood. Crotonyl-CoA, the precursor of Kcr, could be generated by Acidaminococcus fermentans that was isolated from the intestinal tracts of pig and human.[7] Given that fluctuation of Crotonyl-CoA leads to the dynamics of Kcr levels, our study provides an example that links microbial metabolites, including the Crotonyl-CoA, to various cellular processes revealed in this study.
Our study also links Kcr to cancer (Table S1, Supporting Information). We showed that 4.5% (20 out of 443) of the cancer protein biomarkers in the EDRN database were crotonylated. In addition, 32 Kcr proteins are related to cancer genes, accounting for 5.9% of the total genes in the COSMIC cancer gene database. Notably, six p300-targeted proteins were identified as cancer gene– related proteins. The cancer genes in COSMIC database have been causally implicated in cancer. Given that Kcr is able to dysregulate proteins in an alternative way to mutation, our finding is likely to yield unrevealed insights of Kcr and p300 in cancer.
The mass spectrometry proteomics data have been deposited to the ProteomeXchange Consortium via the PRIDE[35] partner repository with the dataset identifier PXD006407.
Supplementary Material
Significance Statement.
Lysine crotonylation (Kcr) is an abundant, evolutionary conserved, and physiological relevant PTM. Recently, it was demonstrated that p300 could catalyze histone Kcr that in turn stimulates transcription to a greater degree than histone lysine acetylation (Kac). These studies expanded our knowledge of p300; however, it remains unclear exactly how the p300 regulate diverse cellular processes through Kcr, especially through non-histone Kcr. In this study, the first global quantitative crotonylome in response to its regulatory enzyme p300 is reported. In total 816 unique endogenous crotonylation sites are identified, including 88 sites from 69 proteins that were decreased by more than 0.7-fold (log2 < 0.5) and 31 sites from 17 proteins that were increased by more than 1.4-fold (log2 > 0.5) in response to p300 KO. Quantitative crotonylome analysis indicates that p300 regulates Kcr states of diverse cellular pathways. Moreover, bioinformatics analysis provides new insights into mechanisms of p300 functions. Together, this study illustrates a broad landscape of the Kcr pathway and therefore offers a rich source for studying the role of p300 in regulation of Kcr pathway in diverse cellular process and disease development.
Acknowledgements
This work was supported by National Institutes of Health (NIH) award DK107868 and GM115961 (Z.Y.).
Footnotes
Supporting Information
Supporting Information is available from the Wiley Online Library or from the author.
Conflict of Interest
Y.Z. is on the science advisory board of PTM Biolabs. The authors declare no other competing interests.
Contributor Information
He Huang, Ben May Department for Cancer Research, The University of Chicago, 60637 Chicago, IL, USA, hehuang@uchicago.edu.
Dan-Li Wang, School of Marine Sciences, Ningbo University, 315211 Ningbo, China.
Yingming Zhao, Ben May Department for Cancer Research, The University of Chicago, 60637 Chicago, IL, USA, Yingming.Zhao@uchicago.edu.
References
- [1].Eckburg PB, Bik EM, Bernstein CN, Purdom E, Dethlefsen L, Sargent M, Gill SR, Nelson KE, Relman DA, Science 2005, 308, 1635. [DOI] [PMC free article] [PubMed] [Google Scholar]
- [2].Smith PM, Howitt MR, Panikov N, Michaud M, Gallini CA, Bohlooly YM, Glickman JN, Garrett WS, Science 2013, 341, 569. [DOI] [PMC free article] [PubMed] [Google Scholar]
- [3].Tremaroli V, Backhed F, Nature 2012, 489, 242. [DOI] [PubMed] [Google Scholar]
- [4].Sabari BR, Zhang D, Allis CD, Zhao Y, Nat. Rev. Mol. Cell Biol 2017, 18, 90. [DOI] [PMC free article] [PubMed] [Google Scholar]
- [5].Lozupone CA, Stombaugh JI, Gordon JI, Jansson JK, Knight R, Nature 2012, 489, 220. [DOI] [PMC free article] [PubMed] [Google Scholar]
- [6].a) Chen Y, Sprung R, Tang Y, Ball H, Sangras B, Kim SC, Falck JR, Peng J, Gu W, Zhao Y, Mol. Cell. Proteomics 2007, 6, 812. [DOI] [PMC free article] [PubMed] [Google Scholar]; b) Huang H, Lin S, Garcia BA, Zhao Y, Chem. Rev 2015, 115, 2376. [DOI] [PMC free article] [PubMed] [Google Scholar]; c) Huang H, Sabari BR, Garcia BA, Allis CD, Zhao Y, Cell 2014, 159, 458. [DOI] [PMC free article] [PubMed] [Google Scholar]
- [7].a) Cook GM, Rainey FA, Chen G, Stackebrandt E, Russell JB, Int. J. Syst. Bacteriol 1994, 44, 576. [DOI] [PubMed] [Google Scholar]; b) Buckel W, Semmler R, FEBS Lett 1982, 148, 35. [DOI] [PubMed] [Google Scholar]
- [8].a) Tan M, Luo H, Lee S, Jin F, Yang JS, Montellier E, Buchou T, Cheng Z, Rousseaux S, Rajagopal N, Lu Z, Ye Z, Zhu Q, Wysocka J, Ye Y, Khochbin S, Ren B, Zhao Y, Cell 2011, 146, 1016. [DOI] [PMC free article] [PubMed] [Google Scholar]; b) Olsen CA, Angew. Chem. Int. Ed. Engl 2012, 51, 3755. [DOI] [PubMed] [Google Scholar]; c) Tweedie-Cullen RY, Brunner AM, Grossmann J, Mohanna S, Sichau D, Nanni P, Panse C, Mansuy IM, PLoS One 2012, 7, e36980. [DOI] [PMC free article] [PubMed] [Google Scholar]
- [9].a) Ruiz-Andres O, Sanchez-Nino MD, Cannata-Ortiz P, Ruiz-Ortega M, Egido J, Ortiz A, Sanz AB, Dis. Model. Mech 2016, 9, 633. [DOI] [PMC free article] [PubMed] [Google Scholar]; b) Xiong X, Panchenko T, Yang S, Zhao S, Yan P, Zhang W, Xie W, Li Y, Zhao Y, Allis CD, Li H, Nat. Chem. Biol 2016, 12, 1111. [DOI] [PMC free article] [PubMed] [Google Scholar]; c) Zhang Q, Zeng L, Zhao C, Ju Y, Konuma T, Zhou MM, Structure 2016, 24, 1606. [DOI] [PMC free article] [PubMed] [Google Scholar]
- [10].Wei W, Mao A, Tang B, Zeng Q, Gao S, Liu X, Lu L, Li W, Du JX, Li J, Wong J, Liao L, J. Proteome Res 2017, 16, 1743. [DOI] [PubMed] [Google Scholar]
- [11].Andrews FH, Shinsky SA, Shanle EK, Bridgers JB, Gest A, Tsun IK, Krajewski K, Shi X, Strahl BD, Kutateladze TG, Nat. Chem. Biol 2016, 12, 396. [DOI] [PMC free article] [PubMed] [Google Scholar]
- [12].Legube G, Trouche D, EMBO Rep 2003, 4, 944. [DOI] [PMC free article] [PubMed] [Google Scholar]
- [13].Sabari BR, Tang Z, Huang H, Yong-Gonzalez V, Molina H, Kong HE, Dai L, Shimada M, Cross JR, Zhao Y, Roeder RG, Allis CD, Mol. Cell 2015, 58, 203. [DOI] [PMC free article] [PubMed] [Google Scholar]
- [14].Montellier E, Rousseaux S, Zhao Y, Khochbin S, Bioessays 2012, 34, 187. [DOI] [PubMed] [Google Scholar]
- [15].Xu W, Wan J, Zhan J, Li X, He H, Shi Z, Zhang H, Cell Res 2017. [DOI] [PMC free article] [PubMed] [Google Scholar]
- [16].Cox J, Mann M, Nat. Biotechnol 2008, 26, 1367. [DOI] [PubMed] [Google Scholar]
- [17].Yu G, He QY, Mol. Biosyst 2016, 12, 477. [DOI] [PubMed] [Google Scholar]
- [18].Ruepp A, Brauner B, Dunger-Kaltenbach I, Frishman G, Montrone C, Stransky M, Waegele B, Schmidt T, Doudieu ON, Stumpflen V, Mewes HW, Nucleic Acids Res 2008, 36, D646. [DOI] [PMC free article] [PubMed] [Google Scholar]
- [19].Szklarczyk D, Morris JH, Cook H, Kuhn M, Wyder S, Simonovic M, Santos A, Doncheva NT, Roth A, Bork P, Jensen LJ, von Mering C, Nucleic Acids Res 2017, 45, D362. [DOI] [PMC free article] [PubMed] [Google Scholar]
- [20].Forbes SA, Tang G, Bindal N, Bamford S, Dawson E, Cole C, Kok CY, Jia M, Ewing R, Menzies A, Teague JW, Stratton MR, Futreal PA, Nucleic Acids Res 2010, 38, D652. [DOI] [PMC free article] [PubMed] [Google Scholar]
- [21].Tyanova S, Temu T, Sinitcyn P, Carlson A, Hein MY, Geiger T, Mann M, Cox J, Nat. Methods 2016, 13, 731. [DOI] [PubMed] [Google Scholar]
- [22].Ong SE, Blagoev B, Kratchmarova I, Kristensen DB, Steen H, Pandey A, Mann M, Mol. Cell. Proteomics 2002, 1, 376. [DOI] [PubMed] [Google Scholar]
- [23].Colaert N, Helsens K, Martens L, Vandekerckhove J, Gevaert K, Nat. Methods 2009, 6, 786. [DOI] [PubMed] [Google Scholar]
- [24].Svinkina T, Gu HB, Silva JC, Mertins P, Qiao J, Fereshetian S, Jaffe JD, Kuhn E, Udeshi ND, Carr SA, Mol. Cell. Proteomics 2015, 14, 2429. [DOI] [PMC free article] [PubMed] [Google Scholar]
- [25].a) Park J, Chen Y, Tishkoff DX, Peng C, Tan M, Dai L, Xie Z, Zhang Y, Zwaans BM, Skinner ME, Lombard DB, Zhao Y, Mol. Cell 2013, 50, 919. [DOI] [PMC free article] [PubMed] [Google Scholar]; b) Nishida Y, Rardin MJ, Carrico C, He WJ, Sahu AK, Gut P, Najjar R, Fitch M, Hellerstein M, Gibson BW, Verdin E, Mol. Cell 2015, 59, 321. [DOI] [PMC free article] [PubMed] [Google Scholar]; c) Rardin MJ, He W, Nishida Y, Newman JC, Carrico C, Danielson SR, Guo A, Gut P, Sahu AK, Li B, Uppala R, Fitch M, Riiff T, Zhu L, Zhou J, Mulhern D, Stevens RD, Ilkayeva OR, Newgard CB, Jacobson MP, Hellerstein M, Goetzman ES, Gibson BW, Verdin E, Cell Metab 2013, 18, 920. [DOI] [PMC free article] [PubMed] [Google Scholar]
- [26].Eom GH, Nam YS, Oh JG, Choe N, Min HK, Yoo EK, Kang G, Nguyen VH, Min JJ, Kim JK, Lee IK, Bassel-Duby R, Olson EN, Park WJ, Kook H, Circ. Res 2014, 114, 1133. [DOI] [PubMed] [Google Scholar]
- [27].Yu G, Wang LG, Han Y, He QY, OMICS 2012, 16, 284. [DOI] [PMC free article] [PubMed] [Google Scholar]
- [28].Hayano T, Yanagida M, Yamauchi Y, Shinkawa T, Isobe T, Takahashi N, J. Biol. Chem 2003, 278, 34309. [DOI] [PubMed] [Google Scholar]
- [29].Ilagan J, Yuh P, Chalkley RJ, Burlingame AL, Jurica MS, J. Mol. Biol 2009, 394, 363. [DOI] [PMC free article] [PubMed] [Google Scholar]
- [30].Box JK, Paquet N, Adams MN, Boucher D, Bolderson E, O’Byrne KJ, Richard DJ, BMC Mol. Biol 2016, 17, 19. [DOI] [PMC free article] [PubMed] [Google Scholar]
- [31].Grummitt CG, Townsley FM, Johnson CM, Warren AJ, Bycroft M, J. Biol. Chem 2008, 283, 23326. [DOI] [PMC free article] [PubMed] [Google Scholar]
- [32].Zhao S, Xu W, Jiang W, Yu W, Lin Y, Zhang T, Yao J, Zhou L, Zeng Y, Li H, Li Y, Shi J, An W, Hancock SM, He F, Qin L, Chin J, Yang P, Chen X, Lei Q, Xiong Y, Guan KL, Science 2010, 327, 1000. [DOI] [PMC free article] [PubMed] [Google Scholar]
- [33].Chen Y, Zhao W, Yang JS, Cheng Z, Luo H, Lu Z, Tan M, Gu W, Zhao Y, Mol. Cell. Proteomics 2012, 11, 1048. [DOI] [PMC free article] [PubMed] [Google Scholar]
- [34].Verdin E, Ott M, Nat. Rev. Mol. Cell Biol 2015, 16, 258. [DOI] [PubMed] [Google Scholar]
- [35].Vizcaino JA, Csordas A, del-Toro N, Dianes JA, Griss J, Lavidas I, Mayer G, Perez-Riverol Y, Reisinger F, Ternent T, Xu QW, Wang R, Hermjakob H, Nucleic Acids Res 2016, 44, D447. [DOI] [PMC free article] [PubMed] [Google Scholar]
Associated Data
This section collects any data citations, data availability statements, or supplementary materials included in this article.