

Abstract
Huntington's disease (HD) involves preferential and progressive degeneration of striatum and other subcortical regions as well as regional cortical atrophy. It is caused by a CAG repeat expansion in the Huntingtin gene, and the longer the expansion the earlier the age of onset. Atrophy begins prior to manifest clinical signs and symptoms, and brain atrophy in premanifest expansion carriers can be studied. We employed a diffeomorphometric pipeline to contrast subcortical structures’ morphological properties in a control group with three disease groups representing different phases of premanifest HD (far, intermediate, and near to onset) as defined by the length of the CAG expansion and the participant's age (CAG‐Age‐Product). A total of 1,428 magnetic resonance image scans from 694 participants from the PREDICT‐HD cohort were used. We found significant region‐specific atrophies in all subcortical structures studied, with the estimated abnormality onset time varying from structure to structure. Heterogeneous shape abnormalities of caudate nuclei were present in premanifest HD participants estimated furthest from onset and putaminal shape abnormalities were present in participants intermediate to onset. Thalamic, hippocampal, and amygdalar shape abnormalities were present in participants nearest to onset. We assessed whether the estimated progression of subcortical pathology in premanifest HD tracked specific pathways. This is plausible for changes in basal ganglia circuits but probably not for changes in hippocampus and amygdala. The regional shape analyses conducted in this study provide useful insights into the effects of HD pathology in subcortical structures.
Keywords: circuit, premanifest Huntington's disease, shape, subcortical structures, subregion
1. INTRODUCTION
HD is an inherited, progressive, neurodegenerative brain disorder caused by a CAG (polyglutamine) repeat expansion in the gene encoding HTT protein (The Huntington's Disease Collaborative Research Group, 1993). Clinical manifestations of HD include progressive deterioration of motor, cognitive, and emotional function (Folstein, 1991; Kirkwood, Su, Conneally, & Foroud, 2001; Paulsen et al., 2001; Ross et al., 2014). Within the expanded CAG repeat range (>35), longer repeats forecast an earlier age of onset and a slightly more rapid rate of progression (Andrew et al., 1993; Brandt et al., 1996; Rosenblatt et al., 2006).
A diagnosis of “manifest” HD is based on the presence of characteristic extrapyramidal motor signs (Liu et al., 2015; Long et al., 2014; Reilmann, Leavitt, & Ross, 2014). Large multicenter studies showed that subtle motor, cognitive, and often emotional changes begin in the “premanifest” period and progress slowly until an unequivocal diagnosis based on motor abnormalities is established (Epping et al., 2016; Investigators of the Huntington Study Group PHAROS, 2016; Paulsen et al., 2014; Tabrizi et al., 2013).
Striatal atrophy is the neuropathologic hallmark of HD. Neuroimaging studies showed that atrophy of striatum and other brain regions typical of manifest HD begins many years prior to onset of manifest disease. These studies demonstrated steady progression of atrophy throughout the premanifest phase (Aylward et al., 2004; Aylward, 2007; Paulsen et al., 2008; Tabrizi et al., 2009; Van den Bogaard et al., 2011; Wolf, Vasic, Schonfeldt‐Lecuona, Landwehrmeyer, & Ecker, 2007). The striatal complex, particularly the caudate and putamen, is affected the earliest (Aylward, 2007; Paulsen et al., 2008; Tabrizi et al., 2009) and exhibits the greatest atrophy (De la Monte, Vonsattel, & Richardson, 1988; Lange, Thorner, Hopf, & Schroder, 1976). The globus pallidus is also affected relatively early (De la Monte et al., 1988; Douaud et al., 2006; Faria et al., 2016; Van den Bogaard et al., 2011; Younes, Ratnanather, et al., 2014b). In addition to these basal ganglia structures, abnormalities in other subcortical structures such as the thalamus (De la Monte et al., 1988; Douaud et al., 2006; Faria et al., 2016; Van den Bogaard et al., 2011) and the hippocampus (Faria et al., 2016; Van den Bogaard et al., 2011) were detected, although with milder degrees of abnormality. Atrophy was also observed in the cerebral cortex and subcortical white matter (Bohanna , Georgiou‐Karistianis, Hannan, & Egan, 2008; Douaud et al., 2006; Rub et al., 2016).
Among subcortical structures, the amygdala received relatively little attention in HD. Irritability, disinhibition and apathy are important features of HD‐related emotional changes (Kloppel et al., 2010) and are plausibly related to amygdala dysfunction (Mason et al., 2015; Van den Stock et al., 2015).
The caudate, putamen, thalamus, hippocampus, and amygdala are all comprised of multiple, functionally distinguishable, subregions (Ball et al., 2007; Behrens et al., 2003; Fukutani et al., 1995; Gamer, Zurowski, & Buchel, 2010; Morris, Buchel, & Dolan, 2001; Small, Nava, Perera, Delapaz, & Stern, 2000; West, Kawas, Stewart, Rudow, & Troncoso, 2004). These subregions exhibit differential susceptibilities to neurodegenerative pathologies. We showed that distinct subregions of the amygdala and the hippocampus were affected differently, in terms of atrophy degree and rates of atrophy, by Alzheimer's disease (AD) (Tang et al., 2014; Tang, Holland, Dale, Younes, Miller, et al., 2015), and distinct subregions of the basal ganglia were also affected differently in HD (Younes, Ratnanather, et al., 2014b). With the aid of shape analysis methods, it is possible to understand how the pathology of HD affects subregions of these subcortical structures. The identification of subregional abnormalities may be useful in delineating circuit abnormalities underlying important clinical features of HD.
Clinical features of HD are often attributed to the disruption of circuits interconnecting the striatum and other subcortical structures with the cerebral cortex. The basal ganglia are generally conceptualized as key nodes in functionally specialized and partly anatomically segregated parallel cortico‐basal ganglionic‐thalamocortical circuits (Alexander, DeLong, & Strick, 1986). To a considerable extent, these circuits reflect the functional organization of the cortex. A basic feature of basal ganglia circuitry organization is the topographic organization of corticostriate projections (Haber & Knutson, 2010; Haber, 2016; Kemp & Powell, 1970; Ratnanather et al., 2013). While there is some overlap of corticostriate projections (Selemon & Goldman‐Rakic, 1985; Yeterian & Pandya, 1993), the mapping of cortical functional domains onto striatal subregions is an important feature of striatal organization and preserved to some extent throughout the parallel cortico‐basal ganglionic–thalamocortical circuits. Longitudinal assessment of changes in striatal subregions would be useful for understanding the basis for specific clinical features of HD.
There are additional reasons to assess the longitudinal evolution of atrophy of the striatal complex and other subcortical structures. Identification of patterns of circuit‐related degeneration may be useful in assessing proposed noncell autonomous mechanisms of pathogenesis such as prion‐like spread of proteinopathy (Pecho‐Vrieseling et al., 2014; Ross et al., 2014). Clinical trials of disease‐modifying therapies in premanifest HD cannot be performed with conventional clinical outcome measures. Magnetic resonance imaging (MRI) based morphometry measures are plausible surrogate outcome measures for disease‐modifying trials. Understanding the trajectory of morphometric changes in the premanifest phase of HD is critical to the development of useful surrogate markers.
In this study, we investigate the shape morphometry of six subcortical structures (caudate, putamen, globus pallidus, thalamus, hippocampus, and amygdala) in both hemispheres in HD participants during premanifest phases. Participants were stratified into those far from, intermediate to, and close to onset of manifest disease. We further investigate shape morphometry changes in subregions with the goal of identifying possible specific circuit related patterns involved in the pathology of premanifest HD.
2. MATERIALS AND METHODS
2.1. PREDICT‐HD
The dataset used in this study is part of the PREDICT‐HD study (Paulsen et al., 2006, 2008, 2014) (https://www.predict-hd.net/) where all enrolled participants were at risk of HD and had previously received elective predictive genetic testing. Participants labeled as premanifest HD are those found to be “gene expanded,” possessing HTT CAG repeats ≥36 but not exhibiting the motor criteria consistent with manifest HD (Reilmann et al., 2014; The Huntington's Disease Collaborative Research Group, 1993). Premanifest HD participants in PREDICT‐HD were classified with standard subdivision criteria into three subgroups (see below); far from manifest disease onset (low‐CAP), intermediate to manifest disease onset (mid‐CAP), and near to manifest disease onset (high‐CAP). The control group was defined as participants possessing CAG repeats ≤30. Participants in PREDICT‐HD were recruited from 32 sites across the United States, Canada, Europe, and Australia. Participants received longitudinal study visits consisting of neurological motor examinations, standardized cognitive assessments, brain MRIs, psychiatric and functional rating scales, and blood testing for genetic and biochemical analyses. Informed written consent was obtained from all participants prior to participation.
2.2. Subgroup definition
A useful measure of the degree of exposure to expanded CAG repeats is the “CAG‐Age‐Product” or “CAP” score (“age × (CAG − L)”), where “age” is the age of the participant at time of measurement, “CAG” is the participant's number of CAG repeats, and “L” is a constant close to the threshold for a repeat count suggestive of HD (Penney, Vonsattel, MacDonald, Gusella, & Myers, 1997). In a commonly used formulation, “L” is taken to be equal to 33.66 (Zhang et al., 2011). Higher CAP scores predict increasing proximity of manifest HD. In the premanifest population, CAP scores can be conveniently categorized into three groups—low CAP score group (CAP < 290), medium CAP score group (290 ≤ CAP ≤ 368), and high CAP score group (CAP > 368).
2.3. Participants
A total of 649 participants (168 control and 481 premanifest HD) participated in this study, 319 of whom received two or more sequential MR scans with the remaining 330 receiving a single scan. Demographics at the time of the baseline scans for the control group and the three premanifest HD groups are presented in Table 1. In this longitudinal dataset, the total number of available scans varies from participant to participant and a summary of the sequential scans as well as the inter‐scan interval information for each of the four groups (control, low‐CAP, mid‐CAP, and high‐CAP) is listed in Supporting Information Table S1.
Table 1.
Demographic information and CAP scores of the baseline scans for each of the four groups in this study
| No. | Gender (M/F) | Age | CAP | |
|---|---|---|---|---|
| Control | 168 | 62/106 | 47.63 ± 12.01 | NA |
| Low‐CAP | 124 | 31/93 | 33.35 ± 9.20 | 232.11 ± 42.75 [79.06–287.00] |
| Mid‐CAP | 150 | 46/104 | 42.36 ± 10.58 | 332.28 ± 23.92 [287.76–367.05] |
| High‐CAP | 207 | 85/122 | 49.17 ± 10.79 | 446.50 ± 73.83 [367.3–1,013.81] |
2.4. MRI data
High resolution, T1‐weighted, 3D‐volume MPRAGE images were used in this study. Given that the PREDICT‐HD study was both multi‐centered and longitudinal in nature, implementation of the standardized image acquisition protocol was heterogeneous secondary to multiple vendors (GE, Phillips, and Siemens) and different field strengths (1.5 and 3 Tesla), and culminated in more than 20 variations in MR acquisition. Details of the acquisition information can be found in previous PREDICT‐HD studies (Harrington et al., 2016; Misiura et al., 2017). Our study data is comprised of MPRAGE data from 3 T scanners at 21 collection sites. Detailed demographic information for data acquired from each site is summarized in Supporting Information Table S2.
2.5. Automated structure segmentation
Twelve subcortical structures (caudate, putamen, globus pallidus, thalamus, hippocampus, and amygdala; left and right of each) were extracted from each T1‐weighted image using a fully automated structure segmentation pipeline (Tang, Crocetti, et al., 2015) consisting of two steps, skull‐stripping and brain structure segmentation. The underlying theoretical basis of this approach is multi‐atlas likelihood‐fusion (MALF) in the framework of a random deformable template model (Tang et al., 2013). This segmentation pipeline has been tested and validated on a number of datasets with relevance to various brain structures including the subcortical structures (Liang et al., 2015; Tang, Crocetti, et al., 2015).
2.6. Shape processing
Shape‐based diffeomorphometric analysis is initiated by a creation of triangulated surfaces to contour the boundary of each segmented structure (Tang et al., 2018), as applied previously to other neurodegenerative disorders (Tang et al., 2014; Tang, Holland, Dale, Younes, & Miller, 2015; Tang, Holland, Dale, Younes, Miller, et al., 2015). Each bounding surface was created by deforming a triangulated model surface for the corresponding subcortical structure of interest. The 12 model surfaces were created manually to ensure sufficient smoothness and correct anatomical topology (e.g., no holes). Large deformation diffeomorphic metric mapping (LDDMM) was employed to deform the model surfaces, resulting in close approximations to the contouring surfaces of the segmented volumes. These resultant triangulated surfaces are the “target shapes” whose diffeomorphometrics were analyzed subsequently.
In shape‐based diffeomorphometry, we analyzed the vertex‐wise local surface areas of target shapes via connecting a common template shape to those target shapes for each of 12 subcortical structures diffeomorphically. The common template shape of each structure was generated from the collection of target shapes extracted from all baseline scans using a Bayesian template estimation algorithm (Ma, Miller, & Younes, 2010). A population‐centered template surface avoids potential statistical bias and allows for a more accurate mapping between the template surface and each target surface as compared with using an arbitrary single template surface.
For each structure of interest, a target‐specific diffeomorphism, as generated by an LDDMM‐surface mapping (Vaillant & Glaunes, 2005), was used to carry the common template surface to each target surface. From each of these diffeomorphisms, a vertex‐based scalar field was subsequently calculated; the log‐determinant of the Jacobian of the diffeomorphism. This scalar field, or deformation marker, quantified the factor by which the diffeomorphism expands or shrinks the vertex‐based localized surface area in the target relative to the template in a logarithmic scale; that is, a positive value corresponds to a localized surface area expansion of the target surface relative to the template while a negative value suggests a localized surface area contraction. The deformation marker was compared between the control group and each of the three CAP groups for each of the 12 subcortical structures.
2.7. Statistical analysis
For cross‐sectional comparisons of the vertex‐based diffeomorphometrics of each subcortical structure of interest, we utilized the statistical model described in our previous work (Miller et al., 2013; Younes, Ratnanather, et al., 2014b),
| (1) |
where, ykj (s) is the deformation marker for the jth scan of participant s at vertex k on the template surface, g(s) is a binary group variable such that g(s) = 0 if participant s belongs to the control group and g(s) = 1 if it belongs to a CAP group (Low, Mid, or High), Xcov(s) denotes the covariate information of participant s included in the analysis (sex and intracranial volume), and εkj (s) represents the random noise. A linear mixed‐effects model is used to model the noise structure as a sum of two distinct Gaussian processes, εkj (s) = ηk (s) + ζkj (s), with and .
The parameters and ρ of our statistical model were obtained from maximum‐likelihood estimation. To check whether there is any group difference at vertex k, we tested the null hypothesis against the general hypothesis , with the complete null hypothesis being simultaneously for all k. Since there are many vertices on each template surface, multiple comparison correction was performed by controlling the family‐wise error rate (FWER) at a level of 0.05. The statistical significance of group differences was quantified by p values obtained from Fisher's method of randomization; a nonparametric permutation test was conducted by randomizing the model's residuals. More in‐depth discussion of the statistical analysis can be found in Younes, Albert, Miller, and BIOCARD Research Team (2014a).
Furthermore, we tested whether there is any interaction between the disease pathology and the aging effect via the following statistical model
| (2) |
where, Δtj(s) denotes the age difference between the jth scan of participant s and its baseline scan, with the null hypothesis being . Please note the aforementioned two tests were conducted sequentially; the second test was performed only when the null hypothesis was rejected in the first one. In addition to analyzing the shape characteristics, we performed volumetric analyses using the same statistical models, without any need to correct for multiple comparisons when evaluating the statistical significance of a group difference.
2.8. Template surface partition
The amygdala, hippocampus, and thalamus consist of multiple subregions, defined on the basis of cytoarchitecture, connectivity, and function. The striatum is more cytoarchitecturally uniform, but as described above, has subregions defined by the pattern of cortical afferents. We divided our hippocampal shapes into four subregions, CA1, CA2, CA3/DG, and subiculum. Amygdalar shapes were subdivided into basolateral, basomedial, centromedial, and lateral nucleus using an approach described previously (Tang et al., 2014; Tang, Holland, Dale, Younes, Miller, et al., 2015). This published procedure on sub‐segmenting the hippocampus and the amygdala was adopted to transfer connectivity‐based subdivision segmentations to surface sub‐divisions for the bilateral thalamus, caudate, and putamen.
For the thalamus, we used a seven‐subregion division based on an atlas using cortical connectivity to define subregions (Behrens et al., 2003). The thalamic subregions were assigned connections to cortical regions of the cortex according to the most likely DTI tractography. The seven thalamic subregions are defined as those connected to the primary motor cortex, sensory cortex, occipital cortex, pre‐frontal cortex, pre‐motor cortex, posterior parietal cortex, and temporal cortex (Behrens et al., 2003). The striatum was similarly subdivided into seven subregions based on the same probabilistic connectivity algorithm. The seven subregions were those connected to limbic, executive, rostral‐motor, caudal‐motor, parietal, occipital, and temporal cortical zones (Tziortzi et al., 2014). In order to obtain the sub‐segmented putamen and caudate, we separated the striatum into those two structures manually, ensuring both accuracy and smoothness of the structural boundaries, and projected the striatal subdivisions onto these two structures. The putaminal parcellation included subdivisions from all seven subregions of the striatum partition while caudate parcellation did not include a subregion connecting to the occipital cortex. The occipital cortex projects to the caudate tail, which is not identified in this analysis. For the globus pallidus, such a template that had been divided into multiple subregions is not available. As such, we did not conduct subregional shape analysis of the globus pallidus.
In Supporting Information Table S3, we tabulate the ratio of the surface area of each subregion to the entire surface area for both the pre‐defined atlases and our study‐specific templates.
3. RESULTS
3.1. Volume analysis
The p‐values obtained from comparing the volumes of each structure between the control group and each of the three premanifest HD groups using the first statistical model are tabulated in Table 2, with the corresponding estimated group differences listed in Table 3. The mean and standard deviations of the volumetric measurements of each structure of interest for each of the four groups, restricted to only baseline scans, are also listed in Table 3.
Table 2.
The structure‐specific p‐values obtained from the first test
| C vs. L | C vs. M | C vs. H | ||||
|---|---|---|---|---|---|---|
| Volume | Shape | Volume | Shape | Volume | Shape | |
| Lcaud | <1.00E‐05 | 1.00E‐04 | <1.00E‐05 | <1.00E‐05 | <1.00E‐05 | <1.00E‐05 |
| Rcaud | 4.00E‐04 | <1.00E‐05 | <1.00E‐05 | <1.00E‐05 | <1.00E‐05 | <1.00E‐05 |
| Lpal | 7.48E‐01 | 2.87E‐01 | <1.00E‐05 | <1.00E‐05 | <1.00E‐05 | <1.00E‐05 |
| Rpal | 8.90E‐01 | 5.23E‐02 | <1.00E‐05 | <1.00E‐05 | <1.00E‐05 | <1.00E‐05 |
| Lput | 1.26E‐02 | 5.30E‐03 | <1.00E‐05 | <1.00E‐05 | <1.00E‐05 | <1.00E‐05 |
| Rput | 2.07E‐02 | <1.00E‐05 | <1.00E‐05 | <1.00E‐05 | <1.00E‐05 | <1.00E‐05 |
| Ltha | 1.18E‐01 | 2.10E‐01 | 3.71E‐01 | 9.30E‐03 | <1.00E‐05 | <1.00E‐05 |
| Rtha | 9.90E‐02 | 2.40E‐01 | 5.96E‐01 | 2.96E‐01 | <1.00E‐05 | <1.00E‐05 |
| Lam | 4.40E‐01 | 2.30E‐02 | 2.26E‐02 | 5.90E‐03 | 2.00E‐04 | <1.00E‐05 |
| Ram | 4.62E‐01 | 1.57E‐01 | 1.45E‐02 | 2.00E‐04 | <1.00E‐05 | <1.00E‐05 |
| Lhi | 8.46E‐01 | 2.29E‐02 | 5.99E‐01 | 2.00E‐04 | 5.46E‐01 | <1.00E‐05 |
| Rhi | 4.10E‐01 | 1.83E‐01 | 1.25E‐01 | 1.00E‐04 | 7.90E‐02 | 1.00E‐03 |
L = Low‐CAP; M = Mid‐CAP; H = High‐CAP. Keys: Lcaud, Left caudate; Rcaud, Right caudate; Lpal, Left globus pallidus; Rpal, Right globus pallidus; Ltha, Left thalamus; Rtha, Right thalamus; lam, Left amygdala; ram, Right amygdala; Lhi, Left hippocampus; Rhi, Right hippocampus.
Table 3.
The mean and standard deviations of the volumetric measurements (in mm3) of each structure of interest for each of the four groups (baseline scans only), and the volumetric group differences (in mm3) estimated from the first test (a positive value indicates volumetric reductions in the latter group relative to the former one)
| Baseline statistics | Group differences | ||||||
|---|---|---|---|---|---|---|---|
| Control | Low‐CAP | Mid‐CAP | High‐CAP | C vs. L | C vs. M | C vs. H | |
| Lcaud | 3,952.65 ± 534.48 | 3,714.66 ± 524.17 | 3,533.90 ± 487.70 | 3,138.98 ± 571.29 | 225.81 | 451.81 | 779.79 |
| Rcaud | 3,728.02 ± 499.55 | 3,529.84 ± 503.44 | 3,309.71 ± 473.43 | 2,912.90 ± 538.40 | 192.90 | 455.14 | 784.27 |
| Lpal | 1,305.46 ± 153.70 | 1,288.53 ± 152.05 | 1,198.36 ± 168.40 | 1,076.85 ± 162.59 | / | 97.36 | 216.47 |
| Rpal | 1,298.83 ± 156.81 | 1,274.17 ± 160.28 | 1,188.64 ± 172.32 | 1,068.10 ± 168.32 | / | 92.22 | 218.74 |
| Lput | 4,105.35 ± 461.96 | 3,961.44 ± 465.68 | 3,605.25 ± 443.01 | 3,158.69 ± 526.64 | 113.49 | 473.25 | 912.76 |
| Rput | 4,238.89 ± 484.34 | 4,098.34 ± 493.42 | 3,742.15 ± 498.44 | 3,257.29 ± 572.74 | 102.90 | 476.36 | 935.05 |
| Ltha | 7,024.22 ± 709.71 | 7,102.89 ± 705.16 | 6,981.40 ± 730.52 | 6,631.25 ± 736.42 | / | / | 380.82 |
| Rtha | 6,832.43 ± 677.26 | 6,925.67 ± 677.63 | 6,825.56 ± 716.10 | 6,470.76 ± 722.03 | / | / | 377.47 |
| Lam | 1,231.34 ± 145.98 | 1,193.19 ± 139.60 | 1,194.56 ± 138.41 | 1,181.56 ± 148.73 | / | 27.40 | 39.89 |
| Ram | 1,166.79 ± 134.28 | 1,126.27 ± 136.42 | 1,128.02 ± 131.44 | 1,111.02 ± 137.31 | / | 27.91 | 50.63 |
| Lhi | 2,908.86 ± 287.06 | 2,867.93 ± 305.94 | 2,879.17 ± 300.44 | 2,886.41 ± 312.08 | / | / | / |
| Rhi | 2,984.97 ± 297.12 | 2,920.60 ± 326.77 | 2,935.21 ± 301.00 | 2,939.64 ± 309.99 | / | / | / |
L = Low‐CAP; M = Mid‐CAP; H = High‐CAP. Keys: Lcaud, Left caudate; Rcaud, Right caudate; Lpal, Left globus pallidus; Rpal, Right globus pallidus; Ltha, Left thalamus; Rtha, Right thalamus; lam, Left amygdala; ram, Right amygdala; Lhi, Left hippocampus; Rhi, Right hippocampus. A symbol “/” denotes no significant group difference.
From the first test, significant volumetric reductions were detected in the bilateral caudate and putamen in all three premanifest HD groups (low‐CAP, mid‐CAP, and high‐CAP). The degree of reduction increased with increasing CAP scores (low‐CAP < mid‐CAP < high‐CAP). For the globus pallidus and amygdala, in both hemispheres, significant volumetric reductions were observed in the mid‐CAP and high‐CAP groups but not the low‐CAP group. For the bilateral thalamus, significant volumetric reductions were only found in the high‐CAP group. And for the bilateral hippocampus, no significant group differences were detected in all three volumetric comparisons.
For all structures exhibiting significant volumetric differences in the first test (Equation (1)), we did not observe any significant interaction effects between the clinical status and the aging effect from our second hypothesis testing (Equation (2)).
3.2. Shape analysis
The overall p‐values obtained from comparing the shape characteristics of all structures of interest between the control group and each of the three premanifest HD groups using the first statistical model are also tabulated in Table 2. The vertex‐based shape findings of all the six structures, namely the bilateral caudate, putamen, globus pallidus, thalamus, amygdala, and hippocampus, are, respectively, presented in Figures 1, 2, 3, 4, 5, 6. It is worth noting that, in each figure, only vertices the statistical significance of which had survived the FWER correction at a level of 0.05 are highlighted. For vertices with no significant group shape difference, the percentages of change were shown as 0%.
Figure 1.
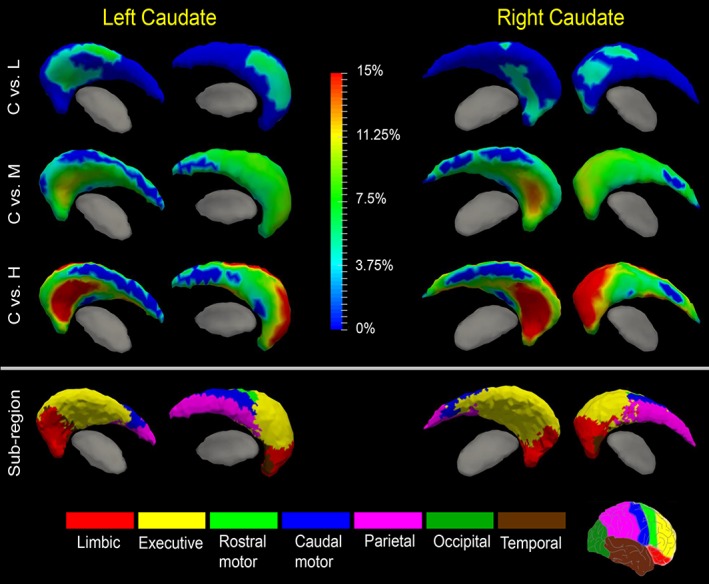
Shape analysis results for the caudate. Statistically significant group comparison results between the control group and each of the three premanifest HD groups (L: Low‐CAP, M: Mid‐CAP, H: High‐CAP) for the caudate shape in each hemisphere as well the corresponding subregion definitions. The color bar represents the percentage of atrophy at a specific vertex in the disease group relative to the control group. The bottom panel illustrates the seven subregions of the bilateral caudate. Two views (left: Lateral, right: Medial) are presented for each case [Color figure can be viewed at http://wileyonlinelibrary.com]
Figure 2.
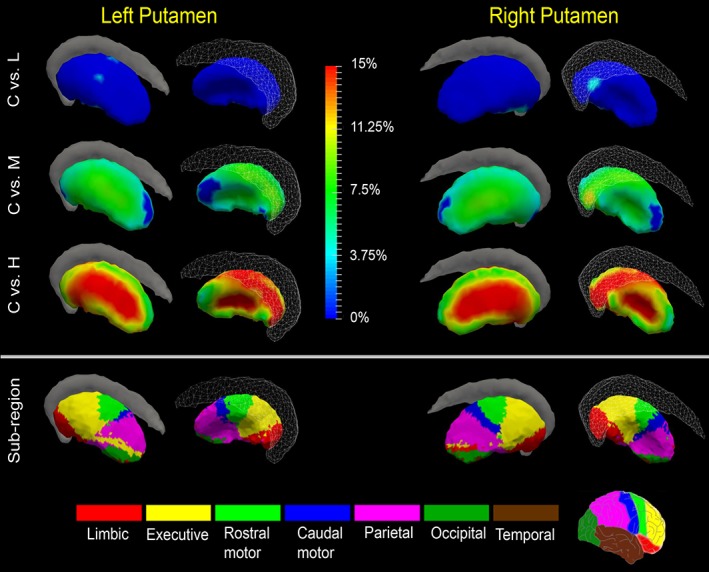
Shape analysis results for the putamen. Statistically significant group comparison results between the control group and each of the three premanifest HD groups (L: Low‐CAP, M: Mid‐CAP, H: High‐CAP) for the putamen shape in each hemisphere as well the corresponding subregion definitions. The color bar represents the percentage of atrophy at a specific vertex in the disease group relative to the control group. The bottom panel illustrates the seven subregions of the bilateral putamen. Two views (left: Lateral, right: Medial) are presented for each case [Color figure can be viewed at http://wileyonlinelibrary.com]
Figure 3.
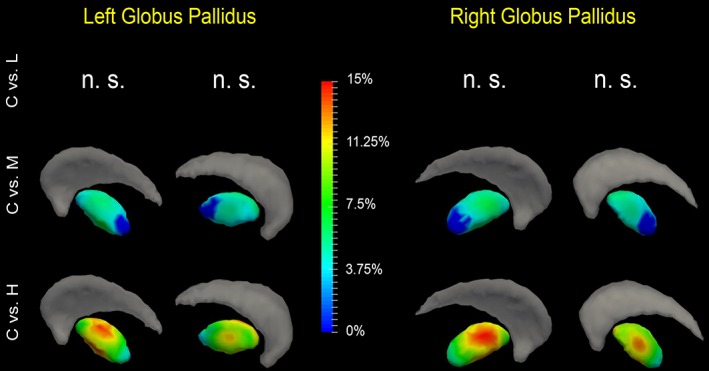
Shape analysis results for the globus pallidus. Statistically significant group comparison results between the control group and each of the three premanifest HD groups (L: Low‐CAP, M: Mid‐CAP, H: High‐CAP) for the globus pallidus shape in each hemisphere. The color bar represents the percentage of atrophy at a specific vertex in the disease group relative to the control group. Two views (left: Lateral, right: Medial) are presented for each case [Color figure can be viewed at http://wileyonlinelibrary.com]
Figure 4.
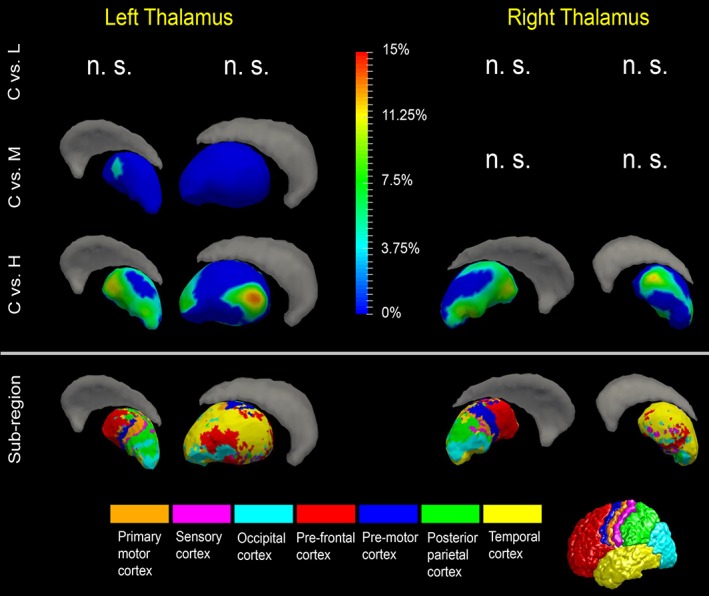
Shape analysis results for the thalamus. Statistically significant group comparison results between the control group and each of the three premanifest HD groups (L: Low‐CAP, M: Mid‐CAP, H: High‐CAP) for the thalamus shape in each hemisphere as well the corresponding subregion definitions. The color bar represents the percentage of atrophy at a specific vertex in the disease group relative to the control group. The bottom panel illustrates the seven subregions of the bilateral thalamus. Two views (left: Lateral, right: Medial) are presented for each case [Color figure can be viewed at http://wileyonlinelibrary.com]
Figure 5.
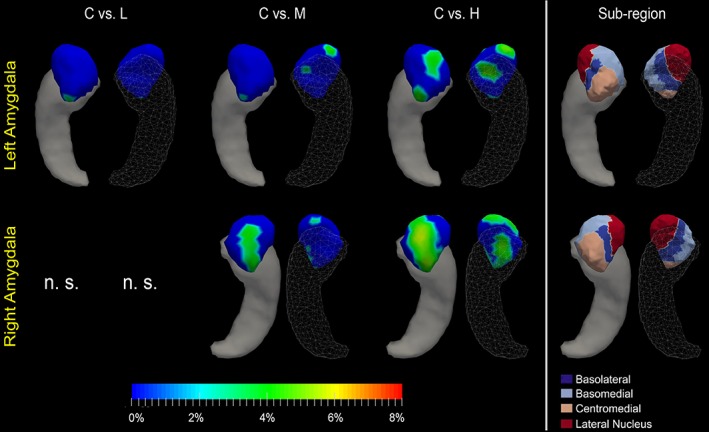
Shape analysis results for the amygdala. Statistically significant group comparison results between the control group and each of the three premanifest HD groups (L: Low‐CAP, M: Mid‐CAP, H: High‐CAP) for the amygdala shape in each hemisphere as well the corresponding subregion definitions. The color bar represents the percentage of atrophy at a specific vertex in the disease group relative to the control group. The rightmost panel illustrates the four subregions of the bilateral amygdala. Two views (left: Dorsal, right: Ventral) are presented for each case [Color figure can be viewed at http://wileyonlinelibrary.com]
Figure 6.
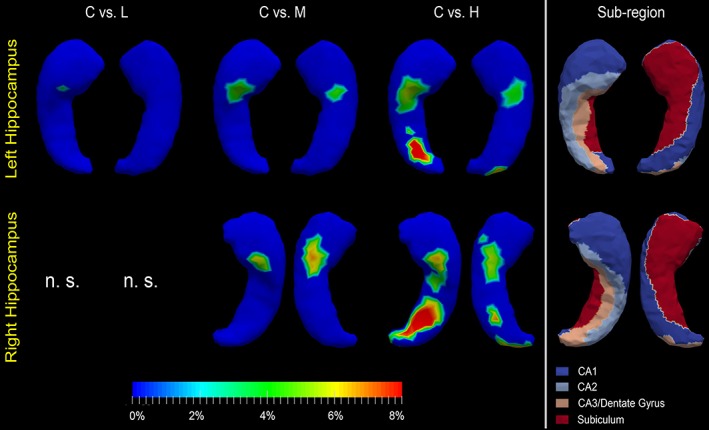
Shape analysis results for the hippocampus. Statistically significant group comparison results between the control group and each of the three premanifest HD groups (L: Low‐CAP, M: Mid‐CAP, H: High‐CAP) for the hippocampus shape in each hemisphere as well the corresponding subregion definitions. The color bar represents the percentage of atrophy at a specific vertex in the disease group relative to the control group. The rightmost panel illustrates the four subregions of the bilateral hippocampus. Two views (left: Dorsal, right: Ventral) are presented for each case [Color figure can be viewed at http://wileyonlinelibrary.com]
Being consistent with our volume findings, significant surface atrophy was detected in the bilateral caudate and putamen in all three HD groups, and in the bilateral globus pallidus in the mid‐CAP and high‐CAP groups but not the low‐CAP group. For the left thalamus, significant surface atrophy was observed in the mid‐CAP and high‐CAP groups whereas for the right thalamus only in the high‐CAP group. For the amygdala and hippocampus in the left hemisphere, significant surface atrophy was detected in all three disease groups whereas for those two structures in the right hemisphere, significant surface atrophy was detected only in the mid‐CAP and high‐CAP groups. As indicated by the p‐values listed in Table 2, the shape characteristics are more sensitive to the neurodegeneration in premanifest HD than the volume measurements.
From the first test, we found significant caudate atrophy bilaterally in all three premanifest HD groups (low‐CAP, mid‐CAP, and high‐CAP). As illustrated in Figure 1 and Table 4, the magnitudes of atrophy and the area of the atrophy regions increased with increasing CAP scores (low‐CAP < mid‐CAP < high‐CAP). Based on visual inspections of the results in Figure 1 and the quantitative results provided in Table 5, the greatest degree of atrophy and the largest areas of atrophy in all three groups were found in two subregions connected to the limbic and executive cortices. Because of prominent shape change in vertices belonging to the subregion connected to executive cortex in low‐CAP, it indicates that this subregion atrophies the earliest.
Table 4.
The mean and standard deviations of the degrees of surface atrophy and the area (in mm2) of the vertices exhibiting significant atrophy and the area ratio (in %) of the vertices exhibiting significant atrophy to the entire structure surface obtained from the first test
| Atrophy degree | Atrophy area | |||||
|---|---|---|---|---|---|---|
| C vs. L | C vs. M | C vs. H | C vs.L | C vs. M | C vs. H | |
| Lcaud | 5.09% ± 0.94% | 7.00% ± 1.62% | 11.15% ± 4.36% | (663.93) 34.13% | (1,688.02) 86.77% | (1,582.90) 81.36% |
| Rcaud | 4.64% ± 0.60% | 7.60% ± 1.95% | 12.17% ± 4.69% | (450.17) 23.95% | (1,695.37) 90.21% | (1,677.72) 89.27% |
| Lpal | / | 4.47% ± 0.91% | 9.48% ± 2.51% | / | (631.87) 87.15% | (725.02) 100% |
| Rpal | / | 4.63% ± 0.96% | 10.01% ± 2.45% | / | (588.85) 82.14% | (716.93) 100% |
| Lput | 3.37% ± 0.83% | 6.38% ± 1.39% | 12.27% ± 2.80% | (38.67) 2.23% | (1,601.79) 92.42% | (1,733.08) 100% |
| Rput | 3.92% ± 0.55% | 6.24% ± 1.57% | 12.06% ± 2.94% | (92.47) 5.17% | (1,703.50) 95.33% | (1,786.99) 100% |
| Ltha | / | 4.01% ± 0.32% | 6.13% ± 2.22% | / | (42.86) 2.12% | (1,074.23) 53.03% |
| Rtha | / | / | 6.18% ± 2.01% | / | / | (1,011.64) 50.89% |
| Lam | 3.38% ± 0.83% | 3.83% ± 0.38% | 3.78% ± 0.55% | (9.63) 14.69% | (24.03) 3.66% | (148.37) 22.63% |
| Ram | / | 3.52% ± 0.38% | 3.91% ± 0.74% | / | (89.23) 14.26% | (299.32) 47.84% |
| Lhi | 4.09% ± 0.00% | 4.27% ± 0.35% | 5.58% ± 1.79% | (3.95) 0.25% | (60.73) 3.87% | (175.56) 11.19% |
| Rhi | / | 5.64% ± 0.58% | 5.98% ± 1.42% | / | (85.02) 5.29% | (283.03) 17.60% |
L = Low‐CAP; M = Mid‐CAP; H = High‐CAP. Keys: Lcaud, Left caudate; Rcaud, Right caudate; Lpal, Left globus pallidus; Rpal, Right globus pallidus; Ltha, Left thalamus; Rtha, Right thalamus; lam, Left amygdala; ram, Right amygdala; Lhi, Left hippocampus; Rhi, Right hippocampus. A symbol “/” denotes no significant group difference.
Table 5.
The mean and standard deviations of the degrees of voxel‐wise surface atrophy, restricted to each subregion of the bilateral caudate, and the area (in mm2) of the vertices exhibiting significant atrophy and the area ratio (in %) of the vertices exhibiting significant atrophy to the entire subregion obtained from the first test
| Atrophy degree | Atrophy area | ||||||
|---|---|---|---|---|---|---|---|
| C vs. L | C vs. M | C vs. H | C vs. L | C vs. M | C vs. H | ||
| Left caudate | Limbic | 5.17% ± 0.74% | 7.41% ± 1.92% | 12.30% ± 4.52% | (101.14) 23.56% | (413.34) 96.29% | (429.26) 100% |
| Executive | 5.05% ± 0.98% | 6.94% ± 1.60% | 11.61% ± 4.06% | (516.89) 53.84% | (828.67) 86.31% | (778.18) 81.05% | |
| Rostral motor | 5.09% ± 0.83% | 8.24% ± 0.39% | 12.15% ± 4.55% | (13.46) 39.48% | (34.09) 100% | (34.09) 100% | |
| Caudal motor | 5.89% ± 0.40% | 7.29% ± 0.80% | 9.37% ± 4.36% | (14.60) 9.73% | (120.47) 80.30% | (105.34) 70.21% | |
| Parietal | 5.08% ± 0.00% | 6.34% ± 1.00% | 7.89% ± 3.06% | (3.46) 1.12% | (228.00) 73.89% | (176.43) 57.18% | |
| Occipital | / | / | / | / | / | / | |
| Temporal | 5.18% ± 1.43% | 6.10% ± 1.83% | 9.48% ± 4.59% | (14.37) 22.64% | (63.44) 100% | (59.60) 93.94% | |
| Right caudate | Limbic | 4.69% ± 0.66% | 8.07% ± 1.83% | 13.92% ± 4.18% | (171.90) 43.03% | (399.51) 100% | (399.51) 100% |
| Executive | 4.59% ± 0.57% | 7.87% ± 2.17% | 12.98% ± 4.81% | (269.43) 27.23% | (886.12) 89.57% | (850.31) 85.95% | |
| Rostral motor | / | 7.75% ± 0.12% | 12.73% ± 4.47% | / | (5.50) 100% | (5.50) 100% | |
| Caudal motor | / | 6.91% ± 0.94% | 10.10% ± 3.41% | / | (96.65) 81.18% | (101.44)85.20% | |
| Parietal | 5.17% ± 0.19% | 6.45% ± 10.82% | 8.49% ± 2.95% | (8.86) 2.67% | (273.24) 82.37% | (286.61) 86.41% | |
| Occipital | / | / | / | / | / | / | |
| Temporal | / | 6.42% ± 1.96% | 10.43% ± 4.05% | / | (34.34) 100% | (34.34) 100% | |
L = Low‐CAP; M = Mid‐CAP; H = High‐CAP. A symbol “/” denotes no significant group difference.
The putamen exhibited significant, regionally specific atrophy in all three premanifest HD groups, though changing vertices in the low‐CAP group were sparse. As demonstrated in Figure 2 and Table 4, significant atrophy was detected across more than 90% of the whole putamen surfaces in both hemispheres in the mid‐CAP group and the entire surfaces in the high‐CAP group. Prominent atrophy involved vertices belonging to multiple subregions, including those connected to limbic, executive, rostral motor, and parietal cortices (Figure 2 and Table 6).
Table 6.
The mean and standard deviations of the degrees of voxel‐wise surface atrophy, restricted to each subregion of the bilateral putamen, and the area (in mm2) of the vertices exhibiting significant atrophy and the area ratio (in %) of the vertices exhibiting significant atrophy to the entire subregion obtained from the first test
| Atrophy degree | Atrophy area | ||||||
|---|---|---|---|---|---|---|---|
| C vs. L | C vs. M | C vs. H | C vs. L | C vs. M | C vs. H | ||
| Left putamen | Limbic | 4.07% ± 0.55% | 6.48% ± 1.54% | 12.01% ± 2.66% | (8.61) 2.54% | (319.26) 94.31% | (338.53) 100% |
| Executive | 3.14% ± 0.00% | 6.85% ± 1.12% | 13.50% ± 2.00% | (5.13) 0.97% | (523.33) 99.33% | (526.86) 100% | |
| Rostral motor | 2.23% ± 0.15% | 6.56% ± 1.36% | 13.28% ± 2.52% | (10.14) 4.60% | (220.21) 100% | (220.21) 100% | |
| Caudal motor | / | 5.69% ± 0.99% | 11.88% ± 1.83% | / | (56.21) 100% | (56.21) 100% | |
| Parietal | 3.76% ± 0.28% | 5.93% ± 1.38% | 11.07% ± 3.36% | (14.79) 3.19% | (355.66) 76.62% | (464.17) 100% | |
| Occipital | / | 5.33% ± 1.38% | 10.64% ± 1.51% | / | (106.95) 100% | (106.95) 100% | |
| Temporal | / | 6.03% ± 1.20% | 11.29% ± 2.02% | / | (20.16) 100% | (20.16) 100% | |
| Right putamen | Limbic | 3.99% ± 0.61% | 6.60% ± 2.05% | 12.34% ± 3.18% | (62.63) 17.66% | (334.14) 94.22% | (354.63) 100% |
| Executive | 3.56% ± 0.24% | 6.22% ± 1.25% | 12.89% ± 2.26% | (17.79) 3.44% | (517.32) 100% | (517.32) 100% | |
| Rostral motor | / | 6.69% ± 1.34% | 12.76% ± 2.55% | / | (205.35) 100% | (205.35) 100% | |
| Caudal motor | / | 6.19% ± 1.32% | 12.62% ± 2.82% | / | (124.33) 100% | (124.33) 100% | |
| Parietal | 3.96% ± 0.44% | 5.96% ± 1.58% | 11.27% ± 3.29% | (12.04) 2.83% | (367.86) 86.41% | (425.73) 100% | |
| Occipital | / | 5.46% ± 1.34% | 9.41% ± 1.69% | / | / | (124.91) 100% | |
| Temporal | / | 5.88% ± 0.82% | 10.34% ± 1.45% | / | (34.71) 100% | (34.71) 100% | |
L = Low‐CAP; M = Mid‐CAP; H = High‐CAP. A symbol “/” denotes no significant group difference.
For the globus pallidus (Figure 3 and Table 4), significant shape abnormalities were detected in the mid‐CAP and high‐CAP groups. Interpretation of pallidal atrophy is complicated by the fact that the globus pallidus has a relatively low density of neurons with many striatal neuron terminals and fibers of passage. Pallidal atrophy likely reflects both a loss of intrinsic neurons and striatal afferent terminals.
There were no significant shape abnormalities in the left thalamus in the low‐CAP group, but significant atrophy was detected in both the mid‐CAP and the high‐CAP groups (Figure 4). For the right thalamus, shape abnormalities were only detected in the high‐CAP group (Figure 4). Regarding subregions, affected vertices were found in every subregion, with a majority associated with subregions connected to the pre‐frontal and temporal cortices (Figure 4 and Table 7).
Table 7.
The mean and standard deviations of the degrees of voxel‐wise surface atrophy, restricted to each subregion of the bilateral thalamus, and the area (in mm2) of the vertices exhibiting significant atrophy and the area ratio (in %) of the vertices exhibiting significant atrophy to the entire subregion obtained from the first test
| Atrophy degree | Atrophy area | ||||||
|---|---|---|---|---|---|---|---|
| C vs. L | C vs. M | C vs. H | C vs. L | C vs. M | C vs. H | ||
| Left thalamus | Primary motor | / | 3.84% ± 0.00% | 6.71% ± 1.81% | / | (4.45) 3.40% | (67.46) 51.46% |
| Sensory | / | / | 5.34% ± 1.27% | / | / | (39.92) 56.44% | |
| Occipital | / | 3.91% ± 0.21% | 5.64% ± 1.82% | / | (6.25) 1.83% | (149.02) 43.70% | |
| Pre‐frontal | / | 4.06% ± 0.37% | 6.98% ± 2.44% | / | (32.17) 8.00% | (240.71) 59.86% | |
| Pre‐motor | / | / | 6.63% ± 1.34% | / | / | (55.39) 45.85% | |
| Posterial parietal | / | / | 5.12% ± 1.36% | / | / | (202.51) 75.67% | |
| Temporal | / | / | 6.28% ± 2.59% | / | / | (319.22) 46.10% | |
| Right thalamus | Primary motor | / | / | 5.81% ± 0.94% | / | / | (45.94) 55.87% |
| Sensory | / | / | 5.19% ± 1.46% | / | / | (52.81) 56.93% | |
| Occipital | / | / | 6.67% ± 1.92% | / | / | (113.06) 49.09% | |
| Pre‐frontal | / | / | 6.22% ± 2.04% | / | / | (249.38) 73.62% | |
| Pre‐motor | / | / | 5.60% ± 1.41% | / | / | (118.71) 66.46% | |
| Posterial parietal | / | / | 5.72% ± 1.45% | / | / | (66.01) 36.46% | |
| Temporal | / | / | 6.42% ± 2.31% | / | / | (365.71) 41.37% | |
L = Low‐CAP; M = Mid‐CAP; H = High‐CAP. A symbol “/” denotes no significant group difference.
The hippocampus and the amygdala showed less dramatic and less widespread shape abnormalities when compared with the caudate and putamen (Table 4). As shown in Table 2 and Figures 5 and 6, for the two structures in the left hemisphere, all three premanifest HD groups experienced significant shape atrophies, whereas only mid‐CAP and high‐CAP abnormalities were detected as being significant for the corresponding right structures. For the amygdala, according to Figure 5 and Table 8, vertices belonging to the centromedial subregion atrophied the earliest and exhibited the most prominent deformations. In high‐CAP participants, atrophic vertices belonged also to the basolateral and basomedial subregions and a small region of the lateral nucleus. For the hippocampus of both hemispheres (Figure 6 and Table 9), unequivocal atrophy was present in mid‐CAP participants at vertices belonging to the CA2 subregion. In high‐CAP participants, atrophy was found in all hippocampal subregions—CA1, CA2, CA3/DG, and subiculum. The mostly affected subregion in high‐CAP participants was CA3/DG, consistent across both hemispheres. In the left hippocampus, vertices belonging to CA2 were the next most atrophied subregion whereas vertices belonging to CA1 were the second mostly affected in the right hippocampus.
Table 8.
The mean and standard deviations of the degrees of voxel‐wise surface atrophy, restricted to each subregion of the bilateral amygdala, and the area (in mm2) of the vertices exhibiting significant atrophy and the area ratio (in %) of the vertices exhibiting significant atrophy to the entire subregion obtained from the first test
| Atrophy degree | Atrophy area | ||||||
|---|---|---|---|---|---|---|---|
| C vs. L | C vs. M | C vs. H | C vs. L | C vs. M | C vs. H | ||
| Left amygdala | Basolateral | / | 4.27% ± 0.00% | 4.20% ± 0.49% | / | (5.27) 4.47% | (31.72) 26.91% |
| Basomedial | / | / | 3.71% ± 0.32% | / | / | (39.34) 20.95% | |
| Centramedial | 3.38% ± 0.25% | 3.66% ± 0.00% | 3.44% ± 0.55% | (9.63) 7.66% | (3.53) 2.80% | (37.52) 29.81% | |
| Lateral nucleus | / | 3.79% ± 0.40% | 3.94% ± 0.55% | / | (15.23) 6.80% | (39.80) 17.76% | |
| Right amygdala | Basolateral | / | 3.45% ± 0.39% | 3.89% ± 0.63% | / | (26.26) 23.20% | (90.46) 79.92% |
| Basomedial | / | 3.74% ± 0.06% | 3.84% ± 0.64% | / | (5.13) 3.02% | (74.99) 44.11% | |
| Centramedial | / | 3.457% ± 0.39% | 4.25% ± 0.88% | / | (51.68) 39.63% | (92.00) 70.55% | |
| Lateral nucleus | / | 3.15% ± 0.16% | 3.46% ± 0.56% | / | (6.17) 2.91% | (41.88) 19.74% | |
L = Low‐CAP; M = Mid‐CAP; H = High‐CAP. A symbol “/” denotes no significant group difference.
Table 9.
The mean and standard deviations of the degrees of voxel‐wise surface atrophy, restricted to each subregion of the bilateral hippocampus, and the area (in mm2) of the vertices exhibiting significant atrophy and the area ratio (in %) of the vertices exhibiting significant atrophy to the entire subregion obtained from the first test
| Atrophy degree | Atrophy area | ||||||
|---|---|---|---|---|---|---|---|
| C vs. L | C vs. M | C vs. H | C vs. L | C vs. M | C vs. H | ||
| Left hippocampus | CA1 | / | / | 7.51% ± 1.12% | / | / | (7.06) 1.16% |
| CA2 | 4.09% ± 0.00% | 4.27% ± 0.39% | 5.16% ± 1.34% | (3.95) 1.52% | (34.24) 13.14% | (65.21) 25.03% | |
| CA3/DG | / | 4.50% ± 0.39% | 6.34% ± 1.78% | / | (9.22) 4.88% | (57.11) 30.22% | |
| Subiculum | / | 4.14% ± 0.29% | 4.70% ± 2.01% | / | (17.27) 3.38% | (46.17) 9.05% | |
| Right hippocampus | CA1 | / | 5.53% ± 0.40% | 5.87% ± 0.58% | / | (17.35) 2.76% | (33.21) 5.29% |
| CA2 | / | 5.05% ± 0.88% | 5.06% ± 1.07% | / | (8.41) 4.14% | (31.48) 15.48% | |
| CA3/DG | / | / | 6.31% ± 1.58% | / | / | (115.98) 50.40% | |
| Subiculum | / | 5.76% ± 0.58% | 5.94% ± 1.47% | / | (59.25) 10.85% | (102.37) 18.74% | |
L = Low‐CAP; M = Mid‐CAP; H = High‐CAP. A symbol “/” denotes no significant group difference.
Based on visual examinations of Figures 1, 2, 3, 4, 5, 6 and the quantitative results reported in Table 3, across all six subcortical structures, striatum (caudate and putamen) are affected in low‐CAP participants with variable involvement of other structures (globus pallidus, thalamus, amygdala, and hippocampus) in mid‐CAP and high‐CAP participants. These results are consistent with previous longitudinal studies indicating a temporal gradient of atrophy, with very early involvement of the striatum and variable involvement of other structures with disease progression.
Keeping in line with our volume analysis results, for all structures exhibiting significant shape differences in the first test (Equation (1)), we did not observe any significant interaction effects between the clinical status and the aging effect from our second hypothesis testing (Equation (2)). As such, we conclude that the reported group differences, in terms of both volume and shape, were induced more by the disease pathology but not the aging effect.
4. DISCUSSION
We conducted volume analysis and regional subcortical shape analysis on a large sample of participants with premanifest HD compared with controls. Low‐CAP participants are estimated by statistical algorithm to be relatively far from predicted manifest disease onset, high‐CAP participants are assessed to be relatively close to predicted manifest disease onset, and mid‐CAP participants are intermediate in their distance from predicted manifest disease onset. Subregional abnormality patterns were characterized for caudate, putamen, thalamus, hippocampus, and amygdala.
According to the results observed from this study, the shape deformation based morphometry measures are more sensitive to the neuropathology of premanifest HD than the conventional volume measures. Given that MRI morphometry may be used as a primary surrogate endpoint in clinical trials in premanifest HD and that premanifest HD is a rare disease, being able to do trials with a sensitive and robust measure that allows a smaller number of samples would be advantageous.
This study is the first of its kind to investigate amygdala shape morphometrics in premanifest HD. A majority of previous imaging studies focused on basal ganglia structures, especially the striatum, with some studies assessing the thalamus and hippocampus.
The estimated temporal evolution of regional and subregional atrophy may be useful in assessing whether progression of pathology in HD follows circuit‐related patterns (Ross et al., 2014). Noncell autonomous mechanisms such as the trans‐synaptic spread of prion‐like protein aggregates, altered transport or effect of neurotrophic factors such as BDNF or excitotoxicty are suggested as possible mechanisms of cell‐to‐cell spread of neurodegeneration in HD and other disorders (Pecho‐Vrieseling et al., 2014; Surmeier, Obeso, & Halliday, 2017). These hypothesized mechanisms predict that evolution of pathology should be related to anatomic connectivity.
All subcortical structures studied were affected in premanifest HD, though the estimated timing of atrophy onset varied from structure to structure. Subcortical shape abnormalities were increased with increasing CAP scores. Our findings are consistent with those of previous studies focusing on HD‐induced subcortical shape abnormalities (Faria et al., 2016; Van den Bogaard et al., 2011; Younes et al., 2014b), with some exceptions. In the work of Van den Bogaard et al. (2011), the hippocampal and amygdalar shape abnormalities were detected only in patients with manifest HD and not those with premanifest HD. We conjecture that this indicates higher sensitivity in our shape analysis pipeline, though other methodological differences may have contributed to some degree; differences, for example, in automated segmentation approach (FSL‐FIRST vs. MALF) and shape analysis pipeline (GAMEs vs. diffeomorphometry).
Consistent with prior results, we found striatal changes in low‐CAP patients, primarily in the caudate. The putaminal changes were manifest in mid‐CAP participants and those changes appeared to progress relatively rapidly with marked atrophy in high‐CAP participants. Meanwhile, other regions (globus pallidus, thalamus, hippocampus, amygdala) had detectable atrophy at the mid‐CAP stage with worsening atrophy detected in high‐CAP participants.
Subregional analyses of the caudate and putamen revealed early atrophy in subregions connected to the limbic and executive–function related cortices. It is important to note that our analysis did not include the caudate tail, which is described as an early site of neurodegeneration in HD (Vonsattel et al., 1985). Our caudate and putamen results are consistent with cognitive and behavioral changes described in premanifest HD participants (Ille et al., 2011; Kloppel et al., 2010; Lawrence et al., 1996; Lemiere, Decruyenaere, Evers‐Kiebooms, Vandenbussche, & Dom, 2004; Misiura et al., 2017; Petersen & Gabery, 2012) and plausibly reflect dysfunction of frontostriatal circuits (Tziortzi et al., 2014; Wolf et al., 2007).
The globus pallidus findings from this study are consistent with our prior imaging study, namely the extent of atrophy in high‐CAP participants was greater in lateral than medial pallidum (Reiner et al., 2012; Richfield & Herkenham, 1994; Younes, Ratnanather, et al., 2014b), a likely correlate of the preferential loss of striato‐lateral pallidal neurons found in post‐mortem studies (Albin et al., 1992; Deng et al., 2004; Sapp et al., 1995).
The changes in the globus pallidus and thalamus at higher CAP scores might be consistent with evolution of pathology following anatomically defined connections. Major striatal outputs synapse within the two segments of the globus pallidus (and the substantia nigra). HD is characterized by a preferential loss of projections to the lateral globus pallidus, the site of the greatest pallidal atrophy in our analyses. This result could be consistent with preferential loss of lateral globus pallidus neurons as predicted by a circuit‐based spread of pathology. The pallidum, however, has a relatively low density of neurons and pallidal atrophy may also reflect the substantial loss of striatal afferents and fibers of passage. Our subregional shape analysis results revealed that the thalamic subregions connecting to pre‐frontal cortices and temporal lobe were affected the most. Basal ganglia outputs from the pallidum and substantia nigra pars reticulata innervate the mediodorsal, ventral anterior, and ventrolateral thalamic nuclei. These thalamic nuclei are densely connected to prefrontal cortices and our results could partially reflect atrophy of thalamic nuclei intimately linked to the striatum.
On the other hand, these basal ganglia associated thalamic nuclei are not connected to the temporal lobe and our shape analysis indicates significant atrophy in thalamic subregions connected to temporal cortices, something that would not be explained easily by a circuit based model of pathology progression. Some components of medial and anterior thalamic nuclei that project to temporal cortices, however, are closely adjacent to and may overlie thalamic subregions projecting to frontal cortices (Behrens et al., 2003). It is possible that atrophy of mediodorsal/ventral anterior subregions receiving basal ganglia inputs might result in a deformation of closely adjacent and overlying subregions projecting to temporal cortices.
Subregional shape analysis of the hippocampus and amygdala were featured in several studies investigating AD (Apostolova et al., 2010; Miller et al., 2013; Tang et al., 2014; Tang, Holland, Dale, Younes, Miller, et al., 2015; West, Kawas, Martin, & Troncoso, 2000). By contrast, we believe this study is the first for HD. Vertices belonging to hippocampal and amygdala subregions exhibited changes in premanifest HD. The CA2 and CA3/DG subregions of the hippocampus seemed to be more affected than other subregions, with the changes occurring in the lowest CAP scores in CA2. In the amygdala, the centromedial subregion was affected in mid‐CAP participants with atrophy involving other regions occurring only in high‐CAP participants. These results are distinct from findings in AD, where basolateral amygdala and CA1 were found to be most affected (Tang et al., 2014; Tang, Holland, Dale, Younes, Miller, et al., 2015; West et al., 2000).
Our findings are relevant to the question of whether progression of pathology in HD follows a noncell autonomous “circuit” pattern (Ross et al., 2014). Our analysis of changes in the basal ganglia and thalamus may be at least in part consistent with this model. As discussed above, striatal deformation changes were found in the low‐CAP score participants and apparently followed by changes in the pallidum and thalamus, which are hodologically downstream from the striatum.
Our results for the hippocampal and amygdala changes, however, appear inconsistent with a simple circuit based spreading model. In these structures, deformation changes were found in mid‐CAP participants in CA2 of the hippocampus and centromedial amygdala. Neither of these regions are strongly connected to the dorsal striatum. While the striatum receives afferents from both the hippocampal formation and amygdala, these projections terminate mainly in the ventral striatum, which appears to be relatively spared in HD (Vonsattel et al., 1985). In addition, CA2 is primarily part of the intrinsic circuitry of the hippocampus and consequently, a less likely candidate as a recipient of spreading pathology from other regions. Similarly, the centromedial amygdala is primarily an output structure, receiving input from other amygdala nuclei and projecting to hypothalamic and brainstem structures (Benarroch, 2015). Overall, thus our results are only partially consistent with a simple spreading model of HD pathology, and also suggest the possibility of multiple foci of cell autonomous neurodegeneration.
Our hippocampal and amygdala results suggest some potentially interesting clinical correlations. The pattern of hippocampal changes is distinct from prior results in AD, and memory dysfunction in AD and HD are clearly different. The centromedial amygdala is felt to be a key node in the regulation of social behaviors, and apathy, irritability, and socially inappropriate conduct are commonly seen in premanifest HD and early manifest HD. Dysfunction of social behavior networks involving the medial amygdala are implicated in Tourette syndrome and tics are commonly observed phenomenon in HD patients (Albin, 2017). The observation that emotional changes are less consistent in premanifest HD (Investigators of the Huntington Study Group PHAROS, 2006) compared with cognitive and motor changes is consistent with the pattern of brain changes—striatum at lowest CAP scores, and amygdala at higher CAP scores.
Finally, we note that even in high‐CAP participants, there are regions of the thalamus, amygdala, and hippocampus exhibiting no shape abnormalities. It is plausible that at least some of these relatively spared subregions will atrophy with disease progression, probably during the manifest HD stage. To confirm this, study of patients in the later phases of HD are required. To understand the causal relationship between the progression of pathology in HD and the trajectories of subcortical shape atrophy, prospective longitudinal studies will be necessary. Understanding the temporal progression patterns of HD and its correlated effects on the morphometry of the subcortical structures and their associated subregions with prospective longitudinal data is something we anticipate as a future endeavor.
One limitation of this study is that it was limited to subcortical structures but not cortical regions which are also involved in the progression of premanifest HD. The reasons were twofold: (1) We currently do not have a fully validated approach to automatically segment cortical regions. (2) The shape analysis approaches for subcortical and cortical regions should be different. One of our future research directions is to resolve this issue, extending the shape analysis pipeline employed in this work to various cortical regions. Another future work is to investigate the associations between subcortical regional shape abnormalities and different clinical measures in premanifest HD. Detailed descriptions of the clinical phenotypes in PREDICT‐HD can be found elsewhere (Misiura et al., 2017).
Supporting information
Table AI. A summary of the entire dataset. The variable “interval” represents the average time (in years) of the interval between two sequential MRI scans of the same subject.
Table AII. Demographic information and CAP scores of the baseline scans used in this study, grouped according to their acquisition sites, including the number of subjects, gender (number of male subjects), age (mean ± std), control/premanifest HD (number of control subjects), CAP score (mean ± std), and subjects in each of the three HD groups (number and percentage).
Table AIII. A comparison of the percentage of the surface area of each subregion with respect to the entire surface area for both the pre‐defined atlases and our study‐specific templates. Keys: Lcaud – left caudate, Rcaud – right caudate, Lput – left putamen, Rput – right putamen, Ltha – left thalamus, Rtha – right thalamus, Lhi – left hippocampus, Rhi – right hippocampus, Lam – left amygdala, Ram – right amygdala.
ACKNOWLEDGMENTS
We acknowledge the contribution of all PREDICT‐HD participants and sites who gave their time to be involved in this study. We would also like to acknowledge Jingyuan Li from Carnegie Mellon University for her contribution to the template sub‐segmentation of the caudate and putamen. Xiaoying Tang is supported by the National Natural Science Foundation of China (NSFC 81501546), the SYSU‐CMU Shunde International Joint Research Institute Start‐up Grant (20150306), and the National Key R&D Program of China (2017YFC0112404). Michael I. Miller and Tilak Ratnanather are partially supported by NIH P41 EB015909, NIH R01 EB000975 and NIH R01 EB008171. PREDICT‐HD and Jane S. Paulsen are supported by the National Institute of Neurological Disorders and Stroke (NS40068) and CHDI Foundation, Inc. (A3917). Roger Albin is supported by NIH R21 NS088302 and P50 NS091856. Michael I. Miller owns an equal share in Anatomyworks LLC. The terms of this arrangement have been reviewed and approved by the Johns Hopkins University, in accordance with its conflict of interest policy.
Tang X, Ross CA, Johnson H, et al. Regional subcortical shape analysis in premanifest Huntington's disease. Hum Brain Mapp. 2019;40:1419–1433. 10.1002/hbm.24456
Funding information National Institutes of Health, Grant/Award Numbers: NIH R01 EB008171, NIH R01 EB000975, NIH P41 EB015909, NIH P50 NS091856, NIH R21 NS088302; CHDI Foundation, Grant/Award Number: A3917; National Institute of Neurological Disorders and Stroke, Grant/Award Number: NS40068; National Key R&D Program of China, Grant/Award Number: 2017YFC0112404; Shunde International Joint Research Institute Start‐up Grant, Grant/Award Number: 20150306; National Natural Science Foundation of China, Grant/Award Number: NSFC 81501546
REFERENCES
- Albin, R. L. , Reiner, A. , Anderson, K. D. , Dure, L. S. , Handelin, B. , Balfour, R. , … Young, A. B. (1992). Preferential loss of striato‐external pallidal projection neurons in presymptomatic Huntington's disease. Annals of Neurology, 31, 425–430. [DOI] [PubMed] [Google Scholar]
- Albin, R. L. (2017). Tourette syndrome: A disorder of the social decision‐making network. Brain, 14, 332–347. [DOI] [PMC free article] [PubMed] [Google Scholar]
- Alexander, G. E. , DeLong, M. R. , & Strick, P. L. (1986). Parallel organization of functionally segregated circuits linking basal ganglia and cortex. Annual Review of Neuroscience, 9, 357–381. [DOI] [PubMed] [Google Scholar]
- Andrew, S. E. , Paul Goldberg, Y. , Kremer, B. , Telenius, H. , Theilmann, J. , Adam, S. , … Hayden, M. R. (1993). The relationship between trinucleotide (CAG) repeat length and clinical features of Huntington's disease. Nature Genetics, 4, 398. [DOI] [PubMed] [Google Scholar]
- Apostolova, L. G. , Mosconi, L. , Thompson, P. M. , Green, A. E. , Hwang, K. S. , Ramirez, A. , … de Leon, M. J. (2010). Subregional hippocampal atrophy predicts Alzheimer's dementia in the cognitively normal. Neurobiology of Aging, 31, 1077–1088. [DOI] [PMC free article] [PubMed] [Google Scholar]
- Aylward, E. H. (2007). Change in MRI striatal volumes as a biomarker in preclinical Huntington's disease. Brain Research Bulletin, 72, 152–158. [DOI] [PubMed] [Google Scholar]
- Aylward, E. H. , Sparks, B. F. , Field, K. M. , Yallapragada, V. , Shpritz, B. D. , Rosenblatt, A. , … Ross, C. A. (2004). Onset and rate of striatal atrophy in preclinical Huntington disease. Neurology, 63, 66–72. [DOI] [PubMed] [Google Scholar]
- Ball, T. , Rahm, B. , Eickhoff, S. B. , Schulze‐Bonhage, A. , Speck, O. , & Mutschler, I. (2007). Response properties of human amygdala subregions: Evidence based on functional MRI combined with probabilistic anatomical maps. PLoS One, 2, e307. [DOI] [PMC free article] [PubMed] [Google Scholar]
- Behrens, T. E. , Johansen‐Berg, H. , Woolrich, M. W. , Smith, S. M. , Wheeler‐Kingshott, C. A. , Boulby, P. A. , … Matthews, P. M. (2003). Noninvasive mapping of connections between human thalamus and cortex using diffusion imaging. Nature Neuroscience, 6, 750–757. [DOI] [PubMed] [Google Scholar]
- Benarroch, E. E. (2015). The amygdala: Functional organization and involvement in neurologic disorders. Neurology, 84, 313–324. [DOI] [PubMed] [Google Scholar]
- Bohanna, I. , Georgiou‐Karistianis, N. , Hannan, A. J. , & Egan, G. F. (2008). Magnetic resonance imaging as an approach towards identifying neuropathological biomarkers for Huntington's disease. Brain Research Reviews, 58, 209–225. [DOI] [PubMed] [Google Scholar]
- Brandt, J. , Bylsma, F. W. , Gross, R. , Stine, O. C. , Ranen, N. , & Ross, C. A. (1996). Trinucleotide repeat length and clinical progression in Huntington's disease. Neurology, 46, 527–531. [DOI] [PubMed] [Google Scholar]
- De la Monte, S. M. , Vonsattel, J. P. , & Richardson, E. P., Jr. (1988). Morphometric demonstration of atrophic changes in the cerebral cortex, white matter, and neostriatum in Huntington's disease. Journal of Neuropathology and Experimental Neurology, 47, 516–525. [DOI] [PubMed] [Google Scholar]
- Deng, Y. P. , Albin, R. L. , Penney, J. B. , Young, A. B. , Anderson, K. D. , & Reiner, A. (2004). Differential loss of striatal projection systems in Huntington's disease: A quantitative immunohistochemical study. Journal of Chemical Neuroanatomy, 27, 143–164. [DOI] [PubMed] [Google Scholar]
- Douaud, G. , Gaura, V. , Ribeiro, M. J. , Lethimonnier, F. , Maroy, R. , Verny, C. , … Remy, P. (2006). Distribution of grey matter atrophy in Huntington's disease patients: A combined ROI‐based and voxel‐based morphometric study. NeuroImage, 32, 1562–1575. [DOI] [PubMed] [Google Scholar]
- Epping, E. A. , Kim, J.‐I. , Craufurd, D. , Brashers‐Krug, T. M. , Anderson, K. E. , McCusker, E. , … Paulsen, J. S. (2016). Longitudinal psychiatric symptoms in prodromal Huntington’s disease: A decade of data. The American Journal of Psychiatry, 173, 184–192. [DOI] [PMC free article] [PubMed] [Google Scholar]
- Faria, A. V. , Ratnanather, J. T. , Tward, D. J. , Lee, D. S. , van den Noort, F. , Wu, D. , … PREDICT‐HD Investigators and Coordinators of the Huntington Study Group . (2016). Linking white matter and deep gray matter alterations in premanifest Huntington disease. Neuroimage: Clinical, 11, 450–460. [DOI] [PMC free article] [PubMed] [Google Scholar]
- Folstein, S. E. (1991). The psychopathology of Huntington's disease. Research Publications ‐ Association for Research in Nervous and Mental Disease, 69, 181–191. [PubMed] [Google Scholar]
- Fukutani, Y. , Kobayashi, K. , Nakamura, I. , Watanabe, K. , Isaki, K. , & Cairns, N. J. (1995). Neurons, intracellular and extracellular neurofibrillary tangles in subdivisions of the hippocampal cortex in normal ageing and Alzheimer's disease. Neuroscience Letters, 200, 57–60. [DOI] [PubMed] [Google Scholar]
- Gamer, M. , Zurowski, B. , & Buchel, C. (2010). Different amygdala subregions mediate valence‐related and attentional effects of oxytocin in humans. Proceedings of the National Academy of Sciences of the United States of America, 107, 9400–9405. [DOI] [PMC free article] [PubMed] [Google Scholar]
- Haber, S. N. (2016). Corticostriatal circuitry. Dialogues in Clinical Neuroscience, 18, 7–21. [DOI] [PMC free article] [PubMed] [Google Scholar]
- Haber, S. N. , & Knutson, B. (2010). The reward circuit: Linking primate anatomy and human imaging. Neuropsychopharmacology, 35, 4–26. [DOI] [PMC free article] [PubMed] [Google Scholar]
- Harrington, D. L. , Long, J. D. , Durgerian, S. , Mourany, L. , Koenig, K. , Bonner‐Jackson, A. , … Rao, S. M. (2016). Cross‐sectional and longitudinal multimodal structural imaging in prodromal Huntington's disease. Movement Disorders, 31, 1664–1675. [DOI] [PMC free article] [PubMed] [Google Scholar]
- Ille, R. , Schäfer, A. , Scharmüller, W. , Enzinger, C. , Schöggl, H. , Kapfhammer, H. , & Schienle, A. (2011). Emotion recognition and experience in Huntington disease: A voxel‐based morphometry study. Journal of Psychiatry & Neuroscience, 36, 383–390. [DOI] [PMC free article] [PubMed] [Google Scholar]
- Investigators of the Huntington Study Group PHAROS . (2016). Clinical‐genetic associations in the prospective Huntington at risk observational study (pharos): Implications for clinical trials. JAMA Neurology, 73, 102–110. [DOI] [PubMed] [Google Scholar]
- Investigators of the Huntington Study Group PHAROS . (2006). At risk for Huntington disease: The pharos (prospective Huntington at risk observational study) cohort enrolled. Archives of Neurology, 63, 991–996. [DOI] [PubMed] [Google Scholar]
- Kemp, J. M. , & Powell, T. P. (1970). The cortico‐striate projection in the monkey. Brain, 93, 525–546. [DOI] [PubMed] [Google Scholar]
- Kirkwood, S. C. , Su, J. L. , Conneally, P. , & Foroud, T. (2001). Progression of symptoms in the early and middle stages of Huntington disease. Archives of Neurology, 58, 273–278. [DOI] [PubMed] [Google Scholar]
- Kloppel, S. , Stonnington, C. M. , Petrovic, P. , Mobbs, D. , Tuscher, O. , Craufurd, D. , … Frackowiak, R. S. (2010). Irritability in pre‐clinical Huntington's disease. Neuropsychologia, 48, 549–557. [DOI] [PMC free article] [PubMed] [Google Scholar]
- Lange, H. , Thorner, G. , Hopf, A. , & Schroder, K. F. (1976). Morphometric studies of the neuropathological changes in choreatic diseases. Journal of the Neurological Sciences, 28, 401–425. [DOI] [PubMed] [Google Scholar]
- Lawrence, A. D. , Sahakian, B. J. , Hodges, J. R. , Rosser, A. E. , Lange, K. W. , & Robbins, T. W. (1996). Executive and mnemonic functions in early Huntington's disease. Brain, 119(Pt 5), 1633–1645. [DOI] [PubMed] [Google Scholar]
- Lemiere, J. , Decruyenaere, M. , Evers‐Kiebooms, G. , Vandenbussche, E. , & Dom, R. (2004). Cognitive changes in patients with Huntington's disease (HD) andasymptomatic carriers of the HD mutation. Journal of Neurology, 251, 935–942. [DOI] [PubMed] [Google Scholar]
- Liang, Z. , He, X. , Ceritoglu, C. , Tang, X. , Li, Y. , Kutten, K. S. , … Faria, A. V. (2015). Evaluation of cross‐protocol stability of a fully automated brain multi‐atlas Parcellation tool. PLoS One, 10, e0133533. [DOI] [PMC free article] [PubMed] [Google Scholar]
- Liu, D. , Long, J. D. , Zhang, Y. , Raymond, L. A. , Marder, K. , Rosser, A. , … PREDICT‐HD Investigators and Coordinators of the Huntington Study Group . (2015). Motor onset and diagnosis in Huntington disease using the diagnostic confidence level. Journal of Neurology, 262, 2691–2698. [DOI] [PMC free article] [PubMed] [Google Scholar]
- Long, J. D. , Paulsen, J. S. , Marder, K. , Zhang, Y. , Kim, J. I. , Mills, J. A. , & Researchers of the PREDICT‐HD Huntington's Study Group . (2014). Tracking motor impairments in the progression of Huntington's disease. Movement Disorders, 29, 311–319. [DOI] [PMC free article] [PubMed] [Google Scholar]
- Ma, J. , Miller, M. I. , & Younes, L. (2010). A bayesian generative model for surface template estimation. International Journal of Biomedical Imaging, 2010, 974957. [DOI] [PMC free article] [PubMed] [Google Scholar]
- Mason, S. L. , Zhang, J. , Begeti, F. , Guzman, N. V. , Lazar, A. S. , Rowe, J. B. , … Hampshire, A. (2015). The role of the amygdala during emotional processing in Huntington's disease: From pre‐manifest to late stage disease. Neuropsychologia, 70, 80–89. [DOI] [PMC free article] [PubMed] [Google Scholar]
- Miller, M. I. , Younes, L. , Ratnanather, J. T. , Brown, T. , Trinh, H. , Postell, E. , … BIOCARD Research Team . (2013). The diffeomorphometry of temporal lobe structures in preclinical Alzheimer's disease. Neuroimage: Clinical, 3, 352–360. [DOI] [PMC free article] [PubMed] [Google Scholar]
- Misiura, M. B. , Lourens, S. , Calhoun, V. D. , Long, J. , Bockholt, J. , Johnson, H. , … PREDICT‐HD Investigators & Working Group . (2017). Cognitive control, learning, and clinical motor ratings are Most highly associated with basal ganglia brain volumes in the Premanifest Huntington's disease phenotype. Journal of the International Neuropsychological Society, 23, 159–170. [DOI] [PMC free article] [PubMed] [Google Scholar]
- Morris, J. S. , Buchel, C. , & Dolan, R. J. (2001). Parallel neural responses in amygdala subregions and sensory cortex during implicit fear conditioning. NeuroImage, 13, 1044–1052. [DOI] [PubMed] [Google Scholar]
- Paulsen, J. S. , Hayden, M. , Stout, J. C. , Langbehn, D. R. , Aylward, E. , Ross, C. A. , … Predict‐HD Investigators of the Huntington Study Group . (2006). Preparing for preventive clinical trials: The predict‐HD study. Archives of Neurology, 63, 883–890. [DOI] [PubMed] [Google Scholar]
- Paulsen, J. S. , Langbehn, D. R. , Stout, J. C. , Aylward, E. , Ross, C. A. , Nance, M. , … Predict‐HD Investigators and Coordinators of the Huntington Study Group . (2008). Detection of Huntington's disease decades before diagnosis: The predict‐HD study. Journal of Neurology, Neurosurgery, and Psychiatry, 79, 874–880. [DOI] [PMC free article] [PubMed] [Google Scholar]
- Paulsen, J. S. , Long, J. D. , Johnson, H. J. , Aylward, E. H. , Ross, C. A. , Williams, J. K. , … PREDICT‐HD Investigators and Coordinators of the Huntington Study Group . (2014). Clinical and biomarker changes in premanifest Huntington disease show trial feasibility: A decade of the PREDICT‐HD study. Frontiers in Aging Neuroscience, 6, 78. [DOI] [PMC free article] [PubMed] [Google Scholar]
- Paulsen, J. S. , Zhao, H. , Stout, J. C. , Brinkman, R. R. , Guttman, M. , Ross, C. A. , … Huntington Study Group . (2001). Clinical markers of early disease in persons near onset of Huntington's disease. Neurology, 57, 658–662. [DOI] [PubMed] [Google Scholar]
- Pecho‐Vrieseling, E. , Rieker, C. , Fuchs, S. , Bleckmann, D. , Esposito, M. S. , Botta, P. , … Di Giorgio, F. P. (2014). Transneuronal propagation of mutant huntingtin contributes to noncell autonomous pathology in neurons. Nature Neuroscience, 17, 1064–1072. [DOI] [PubMed] [Google Scholar]
- Penney, J. B., Jr. , Vonsattel, J. P. , MacDonald, M. E. , Gusella, J. F. , & Myers, R. H. (1997). CAG repeat number governs the development rate of pathology in Huntington's disease. Annals of Neurology, 41, 689–692. [DOI] [PubMed] [Google Scholar]
- Petersen, A. , & Gabery, S. (2012). Hypothalamic and limbic system changes in Huntington's disease. The Journal of Huntington's Disease, 1, 5–16. [DOI] [PubMed] [Google Scholar]
- Ratnanather, J. T. , Lal, R. M. , An, M. , Poynton, C. B. , Li, M. , Jiang, H. , … Miller, M. I. (2013). Cortico‐cortical, cortico‐striatal, and cortico‐thalamic white matter fiber tracts generated in the macaque brain via dynamic programming. Brain Connectivity, 3, 475–490. [DOI] [PMC free article] [PubMed] [Google Scholar]
- Reilmann, R. , Leavitt, B. R. , & Ross, C. A. (2014). Diagnostic criteria for Huntington's disease based on natural history. Movement Disorders, 29, 1335–1341. [DOI] [PubMed] [Google Scholar]
- Reiner, A. , Wang, H. B. , Del Mar, N. , Sakata, K. , Yoo, W. , & Deng, Y. P. (2012). BDNF may play a differential role in the protective effect of the mGluR2/3 agonist LY379268 on striatal projection neurons in R6/2 Huntington's disease mice. Brain Research, 1473, 161–172. [DOI] [PMC free article] [PubMed] [Google Scholar]
- Richfield, E. K. , & Herkenham, M. (1994). Selective vulnerability in Huntington's disease: Preferential loss of cannabinoid receptors in lateral globus pallidus. Annals of Neurology, 36, 577–584. [DOI] [PubMed] [Google Scholar]
- Rosenblatt, A. , Liang, K. , Zhou, H. , Abbott, M. H. , Gourley, L. M. , Margolis, R. L. , … Ross, C. A. (2006). The association of CAG repeat length with clinical progression in Huntington disease. Neurology, 66, 1016–1020. [DOI] [PubMed] [Google Scholar]
- Ross, C. A. , Aylward, E. H. , Wild, E. J. , Langbehn, D. R. , Long, J. D. , Warner, J. H. , … Tabrizi, S. J. (2014). Huntington disease: Natural history, biomarkers and prospects for therapeutics. Nature Reviews Neurology, 10, 204–216. [DOI] [PubMed] [Google Scholar]
- Rub, U. , Seidel, K. , Heinsen, H. , Vonsattel, J. P. , den Dunnen, W. F. , & Korf, H. W. (2016). Huntington's disease (HD): The neuropathology of a multisystem neurodegenerative disorder of the human brain. Brain Pathology, 26, 726–740. [DOI] [PMC free article] [PubMed] [Google Scholar]
- Sapp, E. , Ge, P. , Aizawa, H. , Bird, E. , Penney, J. , Young, A. B. , … DiFiglia, M. (1995). Evidence for a preferential loss of enkephalin immunoreactivity in the external globus pallidus in low grade Huntington's disease using high resolution image analysis. Neuroscience, 64, 397–404. [DOI] [PubMed] [Google Scholar]
- Selemon, L. D. , & Goldman‐Rakic, P. S. (1985). Longitudinal topography and interdigitation of corticostriatal projections in the rhesus monkey. The Journal of Neuroscience, 5, 776–794. [DOI] [PMC free article] [PubMed] [Google Scholar]
- Small, S. A. , Nava, A. S. , Perera, G. M. , Delapaz, R. , & Stern, Y. (2000). Evaluating the function of hippocampal subregions with high‐resolution MRI in Alzheimer's disease and aging. Microscopy Research and Technique, 51, 101–108. [DOI] [PubMed] [Google Scholar]
- Surmeier, D. J. , Obeso, J. A. , & Halliday, G. M. (2017). Parkinson's disease is not simply a prion disorder. The Journal of Neuroscience, 37, 9799–9807. [DOI] [PMC free article] [PubMed] [Google Scholar]
- Tabrizi, S. J. , Langbehn, D. R. , Leavitt, B. R. , Roos, R. A. , Durr, A. , Craufurd, D. , … TRACK‐HD Investigators . (2009). Biological and clinical manifestations of Huntington's disease in the longitudinal TRACK‐HD study: Cross‐sectional analysis of baseline data. Lancet Neurology, 8, 791–801. [DOI] [PMC free article] [PubMed] [Google Scholar]
- Tabrizi, S. J. , Scahill, R. I. , Owen, G. , Durr, A. , Leavitt, B. R. , Roos, R. A. , … TRACK‐HD Investigators . (2013). Predictors of phenotypic progression and disease onset in premanifest and early‐stage Huntington's disease in the TRACK‐HD study: Analysis of 36‐month observational data. Lancet Neurology, 12, 637–649. [DOI] [PubMed] [Google Scholar]
- Tang, X. , Crocetti, D. , Kutten, K. , Ceritoglu, C. , Albert, M. S. , Mori, S. , … Miller, M. I. (2015). Segmentation of brain magnetic resonance images based on multi‐atlas likelihood fusion: Testing using data with a broad range of anatomical and photometric profiles. Frontiers in Neuroscience, 9, 61. [DOI] [PMC free article] [PubMed] [Google Scholar]
- Tang, X. , Holland, D. , Dale, A. M. , Younes, L. , & Miller, M. I. (2015). Baseline shape diffeomorphometry patterns of subcortical and ventricular structures in predicting conversion of mild cognitive impairment to Alzheimer's disease. Journal of Alzheimer's Disease, 44, 599–611. [DOI] [PMC free article] [PubMed] [Google Scholar]
- Tang, X. , Holland, D. , Dale, A. M. , Younes, L. , Miller, M. I. , & Alzheimer's Disease Neuroimaging Initiative . (2014). Shape abnormalities of subcortical and ventricular structures in mild cognitive impairment and Alzheimer's disease: Detecting, quantifying, and predicting. Human Brain Mapping, 35, 3701–3725. [DOI] [PMC free article] [PubMed] [Google Scholar]
- Tang, X. , Holland, D. , Dale, A. M. , Younes, L. , Miller, M. I. , & Alzheimer's Disease Neuroimaging Initiative . (2015). The diffeomorphometry of regional shape change rates and its relevance to cognitive deterioration in mild cognitive impairment and Alzheimer's disease. Human Brain Mapping, 36, 2093–2117. [DOI] [PMC free article] [PubMed] [Google Scholar]
- Tang, X. , Luo, Y. , Chen, Z. , Huang, N. , Johnson, H. J. , Paulsen, J. S. , & Miller, M. I. (2018). A fully‐automated subcortical and ventricular shape generation pipeline preserving smoothness and anatomical topology. Frontiers in Neuroscience, 12, 321 10.3389/fnins.2018.00321 [DOI] [PMC free article] [PubMed] [Google Scholar]
- Tang, X. , Oishi, K. , Faria, A. V. , Hillis, A. E. , Albert, M. S. , Mori, S. , & Miller, M. I. (2013). Bayesian parameter estimation and segmentation in the multi‐atlas random orbit model. PLoS One, 8, e65591. [DOI] [PMC free article] [PubMed] [Google Scholar]
- The Huntington's Disease Collaborative Research Group . (1993). A novel gene containing a trinucleotide repeat that is expanded and unstable on Huntington's disease chromosomes. Cell, 72, 971–983. [DOI] [PubMed] [Google Scholar]
- Tziortzi, A. C. , Haber, S. N. , Searle, G. E. , Tsoumpas, C. , Long, C. J. , Shotbolt, P. , … Gunn, R. N. (2014). Connectivity‐based functional analysis of dopamine release in the striatum using diffusion‐weighted MRI and positron emission tomography. Cerebral Cortex, 24, 1165–1177. [DOI] [PMC free article] [PubMed] [Google Scholar]
- Vaillant, M. , & Glaunes, J. (2005). Surface matching via currents. Information Processing in Medical Imaging, 19, 381–392. [DOI] [PubMed] [Google Scholar]
- Van den Bogaard, S. J. , Dumas, E. M. , Acharya, T. P. , Johnson, H. , Langbehn, D. R. , Scahill, R. I. , … TRACK‐HD Investigator Group . (2011). Early atrophy of pallidum and accumbens nucleus in Huntington's disease. Journal of Neurology, 258, 412–420. [DOI] [PMC free article] [PubMed] [Google Scholar]
- Van den Stock, J. , De Winter, F. L. , Ahmad, R. , Sunaert, S. , Van Laere, K. , Vandenberghe, W. , & Vandenbulcke, M. (2015). Functional brain changes underlying irritability in premanifest Huntington's disease. Human Brain Mapping, 36, 2681–2690. [DOI] [PMC free article] [PubMed] [Google Scholar]
- Vonsattel, J. P. , Myers, R. H. , Stevens, T. J. , Ferrante, R. J. , Bird, E. D. , & Richardson, E. P., Jr. (1985). Neuropathological classification of Huntington's disease. Journal of Neuropathology and Experimental Neurology, 44, 559–577. [DOI] [PubMed] [Google Scholar]
- West, M. J. , Kawas, C. H. , Martin, L. J. , & Troncoso, J. C. (2000). The CA1 region of the human hippocampus is a hot spot in Alzheimer's disease. Annals of the New York Academy of Sciences, 908, 255–259. [DOI] [PubMed] [Google Scholar]
- West, M. J. , Kawas, C. H. , Stewart, W. F. , Rudow, G. L. , & Troncoso, J. C. (2004). Hippocampal neurons in pre‐clinical Alzheimer's disease. Neurobiology of Aging, 25, 1205–1212. [DOI] [PubMed] [Google Scholar]
- Wolf, R. C. , Vasic, N. , Schonfeldt‐Lecuona, C. , Landwehrmeyer, G. B. , & Ecker, D. (2007). Dorsolateral prefrontal cortex dysfunction in presymptomatic Huntington's disease: Evidence from event‐related fMRI. Brain, 130, 2845–2857. [DOI] [PubMed] [Google Scholar]
- Yeterian, E. H. , & Pandya, D. N. (1993). Striatal connections of the parietal association cortices in rhesus monkeys. The Journal of Comparative Neurology, 332, 175–197. [DOI] [PubMed] [Google Scholar]
- Younes, L. , Albert, M. , Miller, M. I. , & BIOCARD Research Team . (2014a). Inferring changepoint times of medial temporal lobe morphometric change in preclinical Alzheimer's disease. Neuroimage Clinical, 5, 178–187. [DOI] [PMC free article] [PubMed] [Google Scholar]
- Younes, L. , Ratnanather, J. T. , Brown, T. , Aylward, E. , Nopoulos, P. , Johnson, H. , … PREDICT‐HD Investigators and Coordinators of the Huntington Study Group . (2014b). Regionally selective atrophy of subcortical structures in prodromal HD as revealed by statistical shape analysis. Human Brain Mapping, 35, 792–809. [DOI] [PMC free article] [PubMed] [Google Scholar]
- Zhang, Y. , Long, J. D. , Mills, J. A. , Warner, J. H. , Lu, W. , Paulsen, J. S. , & PREDICT‐HD Investigators and Coordinators of the Huntington Study Group . (2011). Indexing disease progression at study entry with individuals at‐risk for Huntington disease. American Journal of Medical Genetics. Part B, Neuropsychiatric Genetics, 156B, 751–763. [DOI] [PMC free article] [PubMed] [Google Scholar]
Associated Data
This section collects any data citations, data availability statements, or supplementary materials included in this article.
Supplementary Materials
Table AI. A summary of the entire dataset. The variable “interval” represents the average time (in years) of the interval between two sequential MRI scans of the same subject.
Table AII. Demographic information and CAP scores of the baseline scans used in this study, grouped according to their acquisition sites, including the number of subjects, gender (number of male subjects), age (mean ± std), control/premanifest HD (number of control subjects), CAP score (mean ± std), and subjects in each of the three HD groups (number and percentage).
Table AIII. A comparison of the percentage of the surface area of each subregion with respect to the entire surface area for both the pre‐defined atlases and our study‐specific templates. Keys: Lcaud – left caudate, Rcaud – right caudate, Lput – left putamen, Rput – right putamen, Ltha – left thalamus, Rtha – right thalamus, Lhi – left hippocampus, Rhi – right hippocampus, Lam – left amygdala, Ram – right amygdala.