

SUMMARY
PD-L1 and PD-L2 are ligands for the PD-1 immune inhibiting checkpoint that can be induced in tumors by interferon exposure, leading to immune evasion. This process is important for immunotherapy based on PD-1 blockade. We examined the specific molecules involved in interferon-induced signaling that regulates PD-L1 and PD-L2 expression in melanoma cells. These studies revealed that the interferon-gamma-JAK1/JAK2-STAT1/STAT2/STAT3-IRF1 axis primarily regulates PD-L1 expression, with IRF1 binding to its promoter. PD-L2 responded equally to interferon beta and gamma and is regulated through both IRF1 and STAT3, which bind to the PD-L2 promoter. Analysis of biopsy specimens from patients with melanoma confirmed interferon signature enrichment and upregulation of gene targets for STAT1/STAT2/STAT3 and IRF1 in anti-PD-1-responding tumors. Therefore, these studies map the signaling pathway of interferon-gamma-inducible PD-1 ligand expression.
In Brief
Garcia-Diaz et al. performed a small hairpin RNA screen and genetic and functional studies to map the signaling pathways that result in reactive PD-L1 and PD-L2 on melanoma cells upon interferon gamma exposure. The authors highlight the importance of the JAK1/JAK2-STAT1/STAT2/STAT3-IRF1 axis for clinical responses to PD-1 blockade therapy.
INTRODUCTION
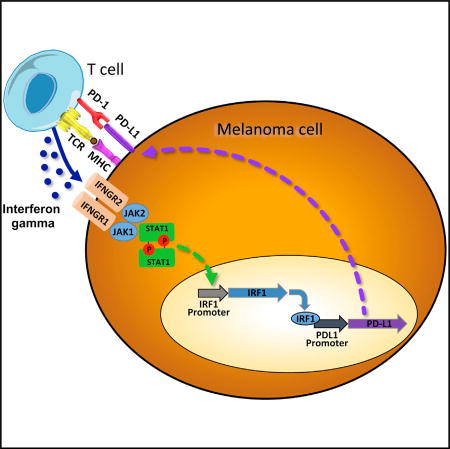
The signaling pathway resulting in adaptive expression of PD-L1 and PD-L2 upon exposure to interferons is of high importance for the clinical development of PD-1 blockade therapies for cancer. Upon tumor antigen recognition by T cells, the released interferons trigger the inducible expression of PD-L1 by cancer cells or other tumor microenvironment cells, thereby inhibiting the antitumor immune response in a process known as adaptive immune resistance. Adaptive immune resistance allows the specific inhibition of T cell recognition of cancer while it spares the rest of the immune responses to other antigens, avoiding a systemic immune-suppressive state (Pardoll, 2012; Ribas, 2015). Interferons were first described in the 1950s as agents that interfere with viral replication (Isaacs and Lindenmann, 1957), and signaling from the interferon receptors has been well characterized (Domanski and Colamonici, 1996; Novick et al., 1994; Velazquez et al., 1992). Janus kinase (JAK) and signal transducer and activators of transcription (STAT) are the main signaling pathways mediating interferon-induced gene expression (Darnell et al., 1994; Velazquez et al., 1992) and resulting in the activation of interferon-stimulated response elements (ISREs) (Darnell et al., 1994; Kessler et al., 1988) and gamma interferon activation sites (GASs) (Decker et al., 1991; Lew et al., 1991). There is a renewed interest in interferon signaling given its key role in regulating PD-1 ligand expression and emerging evidence of its role in primary and acquired resistance to immune checkpoint blockade therapy for cancer (Shin et al., 2017; Gao et al., 2016; Zaretsky et al., 2016).
Type I interferons (alpha, beta, and omega) bind to interferon receptor type 1, which is composed of two subunits, IFNAR1 and IFNAR2, and they signal through JAK1 and TYK2, which phosphorylate STAT1, STAT2, and STAT3, as well as other STAT family members, depending on the cellular context. Activated phosphorylated STAT1 (pSTAT1) typically dimerizes with pSTAT2 to form the ISGF3 complex together with the interferon regulatory factor 9 (IRF9) (Smith et al., 2005). This complex binds at the genomic level to the ISRE sequences to control a long list of interferon-induced genes (Friedman and Stark, 1985). Type I interferons can also trigger phosphorylation and subsequent activation of homo- or hetero-dimers of STAT1, STAT3, STAT4, STAT5, and STAT6.
Type II interferon gamma binds to the interferon gamma receptor, leading to phosphorylation of JAK1 and JAK2, with receptor phosphorylation followed by receptor attachment and phosphorylation of STAT1 in most cells and STAT3 in some cells. The activated dimers then accumulate in the nucleus to act as transcription factors (Schroder et al., 2004; Aaronson and Horvath, 2002). There, they bind to the GAS elements present in most interferon gamma inducible genes, such as the IRF1 gene (Platanias, 2005). Negative regulators of interferon signaling, such as the suppressor of cytokine signaling protein family (SOCS; mostly SOCS1 and SOCS3) are involved in negative feedback regulation of cytokines that signal mainly through JAK2 binding, thereby modulating the activity of both STAT1 and STAT3 (Qing and Stark, 2004).
PD-1 has two known ligands, PD-L1 (CD274 or B7-H1) and PD-L2 (CD273 or B7-DC), and both have been reported to be expressed on cell surfaces upon exposure to interferons, in particular interferon gamma (Kim et al., 2005; Dong et al., 2002; Tseng et al., 2001). Evidence has been generated for the role of STAT1 and STAT3, as well as the downstream transcription factor IRF1, in regulating the surface expression of PD-L1 upon interferon gamma exposure (Lee et al., 2006; Loke and Allison, 2003). However, there has not been a systematic analysis of the molecules involvedin this signal transduction pathway. Given the importance of this process, we undertook a detailed analysis of molecules responsible for interferon receptor signaling and mapping of the PD-L1 and PD-L2 promoters to define the specific signaling that regulates their expression. Our studies demonstrate the key roles of signaling through the interferon-gamma-JAK1/JAK2-STAT1/STAT2/STAT3-IRF1 axis, resulting in binding of the IRF1 transcription factor tothePD-L1 promoter and weaker binding to thePD-L2 promoter, which is also regulated by STAT3 in melanoma cells.
RESULTS
Interferon Receptor Signal Transduction Pathway Regulating PD-L1 Expression
We analyzed the interferon-inducible surface expression of PD-L1 in three human melanoma cell lines, M244, M263, and M381, using flow cytometry (Figures 1A–1C). In all three cell lines, upregulation of PD-L1 was strongest with interferon gamma. Western blot analysis in the three cell lines (Figures 1D–1F) revealed the induction of proteins and phosphorylated proteins involved in the JAK-STAT signaling pathway, including STAT1/pSTAT1, STAT2/pSTAT2, and STAT3/pSTAT3 and increased expression of IRF1 and IRF9. Induction of pSTAT1 and IRF1 was consistently stronger upon interferon gamma exposure compared to interferon alpha or beta exposure. pSTAT1, pSTAT3, and IRF9 induction was also observed through interferon alpha and beta, consistent with the canonical type I interferon signaling pathway (Ivashkiv and Donlin, 2014). We also analyzed interferon receptor mRNA expression in these three lines. Expression of interferon receptor type II was higher than that of interferon receptor type I (Figure S1), which could explain in part the increased sensitivity of these cells lines to interferon gamma. Interestingly, IFNGR1 expression correlated with the PD-L1 induction under interferon gamma stimulation.
Figure 1. Induction of PD-L1 by Interferon Alpha, Beta, and Gamma.

(A–C) Flow cytometry analysis of PD-L1 surface expression upon interferon treatment in the human melanoma cell lines M244 (A), M263 (B), and M381 (C) exposed to interferon alpha, beta, or gamma for 18 hr. Histograms represent changes in mean fluorescence intensity by flow cytometry compared to baseline. (D–F) Western blot analysis of interferon receptor signaling proteins in M244 (D), M263 (E), and M381 (F), including a set of proteins involved in interferon signaling pathways. Basal and activated (phosphorylated) states of the proteins are included to compare the induction trough these different mediators. The first lane of each panel represents untreated control cells. Each cell line was exposed 30 min or 18 hr with interferon alpha, beta, or gamma, respectively.
Interferon Receptor Pathway shRNA Screen to Define Signaling Molecules Involved in PD-L1 Regulation
To analyze PD-L1 regulation upon interferon gamma exposure, we generated reporter cell lines with luciferase expression downstream of the PD-L1 promoter to be used in a small hairpin RNA (shRNA) screen. The human melanoma cell lines M244, M263, and M381 were infected with a lentiviral vector carrying the PD-L1 promoter driving a polycistronic reporter cassette expressing both a DsRed-expressDR protein and firefly luciferase linked by a 2A picornavirus sequence (Figure 2A). This vector also included an elongation factor alpha promoter (EF1a)-BSD cassette as selectable marker. Cells were also transduced with a second vector used for assay signal normalization containing a constitutively expressed EF1-alpha promoter driving Renilla luciferase and RSV-Neo as selectable marker. After transduction and antibiotic selection, double stably transduced melanoma cell lines were validated for interferon gamma response and reporter expression (Figure S2).
Figure 2. Effects on PD-L1 Reporter Expression upon shRNA Silencing of 33 Genes Involved in the Interferon Signaling Pathway.

(A) Schematic representation of the PD-L1Prom-DSRed-FireflyLuciferase/Neo and EF1AProm-Renilla luciferase/RSV-BSD constructs used to generate the reporter melanoma cell lines. Reporter cells contain the PD-L1 promoter driving the expression of a DSRedDR-T2A-Firefly luciferase cassette and also an EF1-alpha promoter driving the Renilla luciferase gene used for normalization.
(B–D) Normalized luciferase reporter expression of each cell line, M244 (B), M263 (C), and M381 (D), transduced with different sets of lentiviral shRNA hairpins. Black and checkered white bars represent the cells transduced with a lentiviral control containing no shRNA, with (black) or without (checkered) interferon gamma treatment. Gray bars represent the expression level of the cells transduced with a set of lentiviral shRNA hairpins with interferon gamma treatment to compare changes upon the interferon gamma induction of PD-L1 expression. Results are represented as a percentage of luciferase expression compared with the interferon-gamma-treated negative control.
(E) Schematic representation of the interferon receptor signaling pathway depicting the hits taking into account the redundant siRNA/shRNA activity (RSA) score obtained for each factor in the three reporter cell lines. Color heatmap represents the summed rank score, with red indicating the greatest impact on interferon-gamma-induced PD-L1 reporter activity and dark blue the least impact. Spatial orientation places each gene in the context of its signaling pathway.
In order to screen for individual targets known or anticipated to be involved in interferon receptor signaling and related pathways, we selected 180 shRNA hairpins targeting 33 genes to carry out the shRNA screen of known interferon receptor pathway signaling molecules. The doubly transduced reporter cell lines were then additionally transduced with the 180 shRNA lentiviral vectors. A non-hairpin-containing vector was used as a negative control. Transduced cells were induced for 8 hr with 100 U/mL interferon gamma, and firefly luciferase expression was normalized to the Renilla luciferase signal and the percentage of transduction of each virus. A redundant small interfering RNA (siRNA) activity (RSA) statistical analysis was performed to compensate for the effects of nonfunctional hairpins.
Inhibition of several genes involved in both type I and type II interferon signaling strongly affected PD-L1 reporter expression (Figures 2B–2D). We calculated the percentage of inhibition for each hairpin, and we assigned a score depending on the effect of each silenced gene on the reporter expression in the three different cell lines. We then rank listed the silenced genes that had the strongest global effect in inhibiting PD-L1 expression. Each gene was then represented in a color heatmap in a schematic representation of the interferon receptor signaling pathways (Figure 2E). The data suggest that there are two converging bottlenecks in the signaling pathway: at the upstream tyrosine kinases JAK1, JAK2, and TYK2 and at the downstream transcription factors IRF1 and IRF9. In between, silencing of STAT1, STAT2, or STAT3 had a moderate effect on the PD-L1 reporter expression, suggesting redundancy in the signaling at this level. There was a strong effect in PD-L1 expression when silencing MAK14 (p38), CRKL, and phosphatidylinositol 3-kinase (PI3K), which have been previously reported to be involved in modulating interferon signaling pathways (Platanias et al., 1999). However, when we knocked out these three genes using CRISPR/Cas9, we could not detect a detrimental effect on PDL1 expression upon interferon gamma exposure (Figure S3); therefore, we believe these were off-target effects of the shRNA screen. We finally confirmed the role of JAK1, JAK2, STAT1, and IRF1 silencing in inhibiting PD-L1 expression using M381 cells stably transduced with shRNAs and analyzed by qPCR (Figure S4), and for JAK1 and JAK2, we have previously reported that their CRISPR/Cas9 knockout results in loss of PD-L1 upregulation upon interferon gamma exposure (Zaretsky et al., 2016).
IRF1 Is the Key Factor for PD-L1 Promoter Function
Analysis of the PD-L1 promoter sequence using the MotEvo algorithm (Pachkov et al., 2007) revealed putative binding sites for STAT1/STAT3, STAT2/STAT5, and IRF1 (Figure 3A). We performed site-directed mutagenesis to delete the STAT1/STAT3, STAT2/STAT5, and IRF1 putative binding sites in a PD-L1 promoter firefly luciferase reporter plasmid. Transiently transfected M381 cells were exposed to interferon gamma, and luciferase activity was quantitated (Figure 3B). Deletion of the IRF1 site dramatically decreased the expression of the PD-L1 reporter construct upon interferon gamma induction. Deletion of the putative STAT2/STAT5 site also affected interferon-gamma-induced luciferase expression, but at a lower level than IRF1. It should be noted that the proximity of these two sequences might be affecting the same activity. On the other hand, deletion of the STAT1/STAT3 putative binding site resulted in strong activation of the PD-L1 reporter upon interferon gamma induction. These data suggest the binding of a putative repressor factor at this level or the presence of genomic elements as silencers or insulator/boundary elements that could block the action of distal enhancers.
Figure 3. Transient Luciferase Reporter Assays and ChIP Analysis for the PD-L1 Promoter in M381 Melanoma Cells.

(A) Sequence of the PD-L1 promoter showing the position of the most representative putative binding sites of the promoter, STAT1/STAT3, STAT2/STAT5, and IRF1.
(B) PD-L1 promoter transient reporter assay including deletions of the putative binding sites. Results are represented as normalized relative luciferase units (RLUs).
(C) ChIP assay in M381 cells at the PD-L1 promoter (gray), the HLA-B promoter as a positive control (white), and the human tRNA-Leu anti-codon (TAG) as irrelevant sequence for IRF1 binding (negative control). Results are represented as percent enrichment relative to input. Asterisks denote significance in an unpaired t test (*p < 0.005, **p < 0.001), and error bars denote SD.
In order to confirm the binding of the predicted factors to the specific sequence sites, we carried out chromatin immunoprecipitation (ChIP) assays at the PD-L1 promoter. We confirmed IRF1 binding to the PD-L1 promoter in an interferon-gamma-inducible manner at a level that was much stronger than the positive control HLA-B promoter (Figure 3C). We also detected IRF1 binding to the PD-L1 promoter upon interferon beta exposure but at lower rates than under interferon gamma treatment (Figure S5A). ChIP analysis using STAT3 antibodies did not reveal direct binding of this factor at the PD-L1 promoter in M381 melanoma cells (Figure S5B), which is different from the reported binding of STAT3 to the PD-L1 promoter in a chimeric nucleophosmin (NPM)/anaplastic lymphoma kinase (ALK) T cell lymphoma (ALK-TCL) (Marzec et al., 2008).
The JAK1/JAK2-STAT1/STAT2/STAT3-IRF1 Axis Controls PD-1 Ligand and Antigen-Presenting Machinery upon Interferon Gamma Exposure
In order to analyze the relevant genes activated at transcriptional level by interferon gamma, we analyzed transcripts of 750 immune-related genes that capture the great majority of known interferon response genes (Table S2). Upon interferon gamma exposure of the three melanoma cell lines, there was strong activation of PD-L1 transcripts compared with PD-L2 (Figures 4A– 4C). We documented a very repetitive pattern of activation of JAK2, STAT1, STAT2, STAT3, IRF1, IRF9, and SOCS1 transcription upon interferon gamma stimulation. All of these molecules are known to be involved in the JAK-STAT signaling pathway downstream of the interferon gamma receptor (Aaronson and Horvath, 2002).
Figure 4. Selected mRNA Expression Profiling of Interferon-Gamma-Induced Genes.

(A–C) Changes in selected gene expression upon interferon gamma exposure in three melanoma cell lines: M244 (A), M263 (B), and M381 (C). Purple and blue dots represent the expression level of the transcripts at basal level in two different biological duplicates (untreated cells), and red and green dots represent the expression level of the transcripts after 3 hr of interferon gamma treatment.
(D) Expression profile analysis of the good interferon gamma responder M233 cell line using the JAK2-specific inhibitor CEP33779. Dark blue dots represent untreated cells, green dots represent interferon-gamma-treated cells, and red dots represent cells treated with the JAK2 inhibitor CEP-33779 and interferon gamma. Data are presented as normalized counts (log2) of each transcript.
(E) Same analysis of the JAK2 mutant cell line M368 with (red) or without (light blue) interferon gamma treatment.
(F) Expression profile of the JAK1 mutant cell line M395 with (red) or without (light blue) interferon gamma treatment.
We also observed upregulation of a second group of genes (light-blue labels) related to immunoregulation and the antigen processing-presentation machinery through major histocompatibility complex (MHC) class I, including the transporters associated with antigen processing 1 and 2 (TAP1/TAP2) and the proteasome subunit beta types 8, 9, and 10 (PSMB9/LMP2, PSMB8/LMP7, and PSMB10/LMP10). Most of these genes are also known to be regulated by interferon gamma. TAP1 and PSMB9 share a bidirectional promoter activated through the interferon gamma-STAT1-IRF1 axis (Saha et al., 2010), and they work at the antigen-processing and antigen-presentation level through the immunoproteasome.
In order to confirm the importance of the JAK1/JAK2-STAT1/STAT3-IRF1 axis, we analyzed the expression profile induced by interferon gamma in three additional human melanoma cell lines with altered interferon receptor signaling (Figures 4D–4F). M368 has a JAK2 loss-of-function mutation and M395 has a JAK1 loss-of-function mutation, and we tested the effect of pharmacological JAK2 inhibition in M233, which is a good interferon gamma responder cell line (Shin et al., 2015, 2017). Interferon-related gene expression was tested in each cell line with or without interferon gamma exposure, and M233 was treated with or without co-incubation with the JAK2 inhibitor CEP33779 (Stump et al., 2011).
The JAK1 mutated M395 cell line was strongly affected and dramatically failed to upregulate most of the previously seen interferon-inducible genes, such as JAK2, STAT1, STAT3, IRF1, PD-L1, and PD-L2, although it still conserved some degree of interferon gamma activation for some genes. The JAK2 mutated M368 cell line presented a complete loss of the interferon gamma induction of the JAK-STAT genes, IRF1, and both PD-1 ligands. The antigen-presentation-related group of genes had equally flat responses to interferon gamma. To confirm the critical role of JAK2 in regulating interferon response, we treated the good responder M233 with the JAK2 inhibitor CEP-33779, which led to a downregulation of STAT3, IRF1, and the two PD-1 ligands, as well as some of the antigen-presentation-related group of genes, such as TAP1 and TAP2. Other interesting genes that were not induced are the chemokine CXCL10 and the interferon-inducible metabolic immune suppressor indoleamine 2,3-dioxygenase-1 (IDO1). These results confirm the importance of the JAK1/JAK2-STAT1/STAT2/STAT3-IRF1 axis in the PD-L1 induction upon interferon gamma exposure.
PD-L1 and PD-L2 Differential Regulation
Given the observations of different regulation of PD-L2 compared to PD-L1, we extended our studies to the PD-L2 promoter function and expression pattern. Flow cytometry analysis of PD-L2 surface expression (Figures 5A–5C) revealed similar or even stronger effect of interferon beta, compared to interferon gamma, in two of the three analyzed cell lines, suggesting a shared role of type I and II interferon signaling and differential regulation for the PD-1 ligands, as previously reported in other cell types (Loke and Allison, 2003). Because the expression of interferon type I receptors is lower than that of type II receptors in all the analyzed cell lines, there must be contribution of downstream elements to explain the similar or higher expression of PD-L2 in M244 and M263 under interferon beta exposure compared to interferon gamma exposure.
Figure 5. PD-L2 Expression and Promoter Function Analysis.

(A–C) Flow cytometry analysis of PD-L2 surface expression upon interferon treatment in M244 (A), M263 (B), and M381 (C).
(D) Sequence of the PD-L2 promoter and position of the putative transcription factor binding sites.
(E) Transient reporter assay including deletions of STAT1/STAT3, IRF1, or double mutations for the putative binding sites. Analysis was performed in untreated cells (white bars) and under interferon beta (gray bars) and interferon gamma exposure (black bars).
(F) ChIP assay using IRF1 antibody in interferon-gamma-treated cells, including primers for the PD-L2 promoter (gray), HLA-B promoter as positive control (white), and TAG gene (black) as an irrelevant sequence for IRF1 binding.
(G) ChIP assay using STAT3 antibody in interferon-beta-treated cells, including primers for the C-FOS promoter as a positive control (white), the PD-L2 promoter (gray), the PD-L1 promoter (checkered), and TAG gene (black) as an irrelevant sequence for STAT3 binding.
Asterisks denote significance in an unpaired t test (*p < 0.05, **p < 0.005, ***p < 0.001), and error bars denote SD.
PD-L1 and PD-L2 are paralog genes, and their promoters share a similar architecture in terms of putative binding sites. We generated PD-L2 luciferase reporter constructs with specific deletions in STAT1/STAT3 and two IRF1 putative binding sites (α and β) (Figure 5D). First, we checked that PD-L2 promoter behaved very similar under interferon beta or gamma exposure (no statistically significant differences) in M381 and M244 cells (Figures 5E and S6), and then we performed reporter truncation assays comparing the PD-L2 reporter expression under interferon beta and gamma exposure or in untreated cells.
All mutations had a very similar effect on the PD-L2 promoter function independently of the type of interferon stimulation. Deletion of the IRF1α putative binding site decreased PD-L2 reporter expression upon interferon gamma induction, but at lower rates than on the PD-L1 promoter compared to the intact promoter (compare Figures 3B and 5E). In contrast, IRF1β site deletion had no effect on PD-L2 expression. Disruption of the STAT1/STAT3 putative binding site dramatically decreased PD-L2 promoter activation. These data suggest opposite effects of these sites at the PD-L1 and PD-L2 promoters, which is consistent with a differential regulation of the two PD-1 ligands. Interestingly, the double mutation of these sites had the lower reporter expression of the PD-L2 promoter, suggesting the cooperation of both sites and their binding factors IRF1 and STAT3 in the regulation of the PD-L2 expression.
In order to confirm the IRF1 and STAT3 participation in PD-L2 regulation, ChIP analysis was performed upon interferon gamma or beta exposure for both PD-L1 and PD-L2 promoters in M381 cells (Figures 5F and 5G). Upon interferon gamma exposure, binding of IRF1 to the PD-L2 promoter was strong, yet weaker than PD-L1 promoter binding. We also demonstrated a moderated, interferon-beta-inducible binding of STAT3 to the PD-L2 promoter, but not to the PD-L1 promoter or under interferon gamma exposure (Figures 5G and S5B). These results support the key role of IRF1 with STAT3 contribution to the differential regulation of PD-L1 and PD-L2 expression in melanoma cells, respectively.
STAT1 and IRF1 Upregulation Correlates with PD-1 Ligand Expression and Interferon Signatures Enrichment in Biopsy Specimens of Patients Responding to Anti-PD-1 Blockade Therapy
To address whether our observations were recapitulated in human melanoma tumors, we analyzed RNA-sequencing (RNAseq) data from The Cancer Genome Atlas (TCGA) skin cutaneous melanoma RNA-seq database (Figures 6A and 6B). We found a strong correlation between IRF1 and PD-L1 or PD-L2 expression (Pearson correlation: R = 0.73 and R = 0.83, respectively), as well as between STAT1 and PD-L1 or PD-L2 expression (R = 0.78 and R = 0.74, respectively). These data support our observations in the cell line analyses that the correlation between STAT1/IRF1 and PD-L1 expression is strong.
Figure 6. RNA-Seq Analysis of TCGA Tumors and Anti-PD-1-Treated Biopsies.

(A) Pearson correlations between log2 normalized mRNA expression levels (RPKM) of IRF1 and STAT1 versus PD-L1 in the TCGA skin cutaneous melanoma RNA-seq database.
(B) Pearson correlations between log2 normalized mRNA expression levels (RPKM) of IRF1 and STAT1 versus PD-L2 in the TCGA skin cutaneous melanoma RNA-seq database.
(C) Potential target genes of IRF1, STAT1, STAT3, and STAT1:STAT2 heterodimer among all up-expressed genes in anti-PD1 on-treatment tumor samples (upexpression is defined by fold change ≥1.5). Gray lines indicate the occurrence of the respective transcription factor binding motifs in the target genes.
(D) Tilling of differential immune cell marker genes in on-treatment anti-PD1 tumors compared to their respective baselines (red and green, up- and down-regulation of at least 1.5 (log2) fold changes.
(E) Tiling of differential IFNG expression (red and green, up- and down-expression) and interferon signature enrichment (orange and blue, positive and negative enrichments) in on-treatment tumors derived from patients receiving anti-PD1 treatment (red, patients who responded to treatment; black, patients who did not respond to treatment).
We analyzed by RNA-seq the differential expression of interferon gamma and interferon gamma responsive gene signatures (Figure 6E) and of immune cell marker genes (Figure 6D) in biopsy specimens from five patients responding (red, n = 2) or not responding (black, n = 3) to anti-PD-1 therapy. These biopsy specimens represented a range of baseline CD8 and PD-L1 expression both in the tumor center and the invasive margin that were felt to be representative of most cases with melanoma (Table S3). Biopsy specimens from patients responding to anti-PD-1 had enriched expression of interferon gamma responsive genes. The non-responding biopsy specimens did not show interferon gamma upregulation or increased interferon signatures, which is supportive of our in vitro data.
On the other hand, we observed at least 1.5 (log2) fold changes in the expression of immune cell marker genes in on-treatment tumors compared to their respective baselines (Figure 6D). For the on-treatment tumors of the two responders, there was a general increase in the mRNA expression levels of multiple immune lineage markers, especially T cell and natural killer (NK) cell. On the contrary, for the three non-responders, T cell and NK cell markers were either not changed or downregulated.
Finally, we analyzed the expression of target genes of the IRF1, STAT1, STAT2, and STAT3 transcription factors in anti-PD-1 on-treatment biopsy specimens (Figure 6C). The small nodes represent the up-expressed genes in each sample, with binding associations indicted by the gray lines connected to the transcription factors. The absolute numbers of upregulated genes with the motifs of IRF1, STAT1, STAT1/STAT2 dimer, and STAT3 were higher in the responder biopsy specimens than in those from biopsy specimens of patients who did not respond to therapy (n indicates the number of up-expressed genes with binding motifs of transcription factors, while indicates N the total number of up-expressed genes in each sample).
DISCUSSION
Blocking the inducible PD-L1 expression upon tumor-antigen-specific T cell infiltration is the key event leading to response to anti-PD-1 or anti-PD-L1 antibody therapy in patients with cancer (Herbst et al., 2014; Tumeh et al., 2014). The clinical significance of the current work mapping the pathways that allow interferons to regulate the expression of PD-L1 and PD-L2 is highlighted by recent evidence that biopsy specimens of patients with metastatic melanoma who do not respond to anti-CTLA-4 or anti-PD-1 therapy are enriched for mutations in the interferon receptor pathway (Gao et al., 2016; Shin et al., 2017) and the evidence that the selective pressure induced by a longstanding T cell response to melanoma with anti-PD-1 therapy can result in acquired resistance with loss-of-function mutations, with concomitant loss of heterozygosity, of JAK1 or JAK2 (Zaretsky et al., 2016). Therefore, a detailed understanding of the signaling pathways regulating the induction of PD-L1 and PD-L2 may help in defining additional mechanisms of primary or acquired resistance and test further improvements in this mode of therapy.
Our studies show that PD-L1 is mainly regulated by the type II interferon receptor singling pathway through JAK1 and JAK2, several STATs, and other modulators of the pathway and converged on the binding of IRF1 to the PD-L1 promoter. On the contrary, PD-L2 is regulated by both interferon beta and interferon gamma, with STAT3 and IRF1 being the transcription factors binding to its promoter in melanoma cells. This detailed knowledge may allow defining patients who cannot respond to PD-1 blockade therapy due to the cancer’s inability to engage downstream interferon signaling, resulting in adaptive immune resistance when mutating or epigenetically silencing key molecules in this signaling, as demonstrated in preclinical models in vitro and in vivo (Dunn et al., 2005; Kaplan et al., 1998). Furthermore, this knowledge would allow defining new druggable molecules that could specifically modulate PD-L1 or PD-L2 signaling pathways, which may have advantages over current antitumor approaches given the lower cost of small molecules compared to antibodies. These agents may increase or decrease this signaling pathway, thereby having opposing potential uses in autoimmunity and transplantation tolerance or for cancer treatment.
Our studies document a differential regulation between the two PD-1 ligands depending on the cytokine signals, as well as cross talk between the interferon signaling pathways. Interferon gamma treatment resulted in a clear and repetitive upregulation pattern of the JAK2/STAT1/IRF1 axis and PD-L1, which is typical of the type II interferon canonical pathway. However, there was also upregulation of STAT2, STAT3 and IRF9 genes, more typically related to the type I interferon-signaling pathway, further highlighting the overlap between the pathways. We also found a very consistent IL-6 activation between the cell lines that could be contributing to the STAT3 upregulation via autocrine/paracrine action as previously described for other cancer cells (Sriuranpong et al., 2003).
To find the link between the interferon signaling pathways and the regulation of the expression of the PD-1 ligands, we dissected the promoters of both genes. It had been previously reported using electrophoretic mobility shift assays (EMSAs) that IRF1 binds to the PD-L1 promoter in vitro in human lung cancer cells (Lee et al., 2006). We carried out ChIP assays in M381melanoma cells, and we confirmed a strong binding of IRF1 to the PD-L1 promoter in an interferon-gamma-inducible manner. The PD-L1 promoter truncation assay indicated the likely presence of a repressor at the STAT1/STAT3 in-silico-predicted putative binding site, although a ChIP assay failed to detect STAT3 binding to this region, indicating possible participation of additional factors. For the PD-L2 promoter, both a transient truncation reporter assay and a ChIP assay revealed STAT3 participation in the regulation of this promoter. Interestingly, STAT3 binding was only detected upon interferon beta induction, pointing out again the fact of the differential regulation of these two promoters.
The importance of the JAK1/JAK2-STAT1/STAT2/STAT3-IRF1 axis for the activation of the PD-1 ligands and many other interferon response genes is highlighted by the transcriptional profile of the two mutant melanoma cell lines that had loss of function of JAK1 or JAK2 genes and studies of the pharmacological inhibition of JAK2. Furthermore, we confirmed the relevance of our laboratory findings in patient-derived biopsy specimens. Tumor biopsy specimens from patients treated with PD-1 blocking antibody therapy upregulated interferon gamma signatures and target genes for IRF1, STAT1, STAT2, and STAT3 in anti-PD-1 on-treatment tumors. These data provide evidence of the importance of the related signaling pathway for an effective response to anti-PD-1 therapy. Whether this response is related exclusively to PD-1 ligand expression or is a consequence of antigen- presentation machinery regulation should be further investigated.
In conclusion, understanding the signaling pathway used by melanomas to respond to interferon exposure leading to the expression of PD-L1 and PD-L2 is of high importance to develop prognostic molecular markers and PD-1 blockade cancer immunotherapy. Genetic or epigenetic alterations affecting molecules in this pathway that result in lack of adaptive PD-1 ligand expression could be used for better patient selection for PD-1 blockade therapy. Modulation of the expression of factors involved in these pathways could define pharmaceutical targets to develop inhibitors that may block specific signaling resulting in adaptive immune resistance.
EXPERIMENTAL PROCEDURES
Cell Lines
Human melanoma cell lines of the M series were established from patient’s biopsies under University of California, Los Angeles (UCLA) institutional review board (IRB) approval (11-003254), as previously described (Atefi et al., 2014). The double stable (DS) reporter cell lines DS244, DS263, and DS381 were generated by transducing M244, M263, and M381 cell lines with two different lentiviral particles (Figure 2A): EF1AProm-Renilla luciferase/RSV-BSD (GenTarget) and PD-L1Prom-DSRed-FireflyLuciferase/Neo lentivirus. Cells were infected at MOI 5–10 with 5 µg/mL polybrene (Santa Cruz Biotechnology) and then selected using 500–1,000 µg/mL G418 and 3–60 µg/mL of BSD during 3 weeks in RPMI media (Invitrogen, Thermo Fisher Scientific) with 10% fetal calf serum (FCS; Omega Scientific), 2 mM L-glutamine, and 1% penicillin, streptomycin (Invitrogen). Expression of both luciferases was validated after interferon gamma treatment for each generated reporter cell line as described in the reporter assay section (Figure S2).
Plasmids and Vectors
For the transient reporter analyses, PD-L1 and PD-L2 promoters were amplified by PCR from genomic DNA obtained from Jurkat cells using the primers listed in Table S1 and cloned into the multicloning site (MCS) of the PGL3 Basic Vector (Promega Corporation) as previously described (Sambrook et al., 1989; full methods can be found in Supplemental Experimental Procedures). Specific deletions of the putative binding sites were carried out using the Q5 Site-Directed Mutagenesis Kit (New England Biolabs), with primers and templates listed in Table S1. Normalization pRL-SV40P plasmid (Addgene plasmid 27163) was a gift from Ron Prywes (Chen and Prywes, 1999), who deposited the plasmid at the Addgene public repository.
For the stable reporter cell lines, the PD-L1Prom-DSRed-FireflyLuciferase/Neo lentiviral construct was cloned as described in Supplemental Experimental Procedures. shRNA lentiviral particles based on the pGIPZ lentiviral vector (Dharmacon) carrying hairpins for the specific genes were generated at UCLA’s Molecular Screening Shared Resource (MSSR) from the shRNA Hannon collection. Plasmids were prepared using the PureLink HiPure Filter Plasmid Maxiprep Kit (Invitrogen) or NucleoSpin 96-well Miniprep kits (Macherey-Nagel), and lentiviral particles were produced as previously described (Kappes and Wu, 2001; Silva et al., 2005).
Surface Flow Cytometry Analysis of PD-L1 and PD-L2
Melanoma cell lines were seeded into six-well plates on day 1, targeting 70%–80% of confluence on the day of surface staining. On day 2, cells were exposed to 5,000 IU/mL interferon alpha (Merck Millipore), 500 IU/mL interferon beta (Merck Millipore), or 100 IU/mL interferon gamma (Becton Dickinson) for 18 hr. Interferon concentrations were defined after dose-response curve (PD-L1 mean fluorescence intensity as a function of interferon concentration) optimization processes for all three interferons (Shin et al., 2017).
On day 3, cells were trypsinized and incubated at 37°C for 2 hr with media containing the same concentrations of interferon alpha, beta, or gamma. After 2 hr of incubation, cells were stained with allophycocyanin (APC) anti-PD-L1 and phycoerythrin (PE) anti-PD-L2 antibodies on ice for 20 min and analyzed by flow cytometry using an LSRII (Becton, Dickinson and Company). Data were analyzed using FlowJo software (Tree Star). Experiments were performed at least twice for each cell line. Specificity of the PD-L1 antibody was previously reported (Atefi et al., 2014), while PDL2 antibody specificity was checked as described below using a PD-L2 siRNA approach (Figure S7).
siRNA Transfection
PD-L2 antibody specificity checking was performed on the two cell lines (M244 and M381), which were seeded on a six-well plate (target confluency of ~80% on the day of flow cytometry analysis) on day 1. Cells were transfected with 25 nM of a PD-L2 siRNA (GE Dharmacon, SMARTpool: siGENOME PDCD1LG2 siRNA and non-targeting control siRNA) as per the manufacturer’s protocol on day 2. On day 3, the selected groups were exposed to 100 IU/mL interferon gamma, and flow cytometry analyses were performed on day 4 as described above.
Western Blot
Western blotting was performed as previously described (Escuin-Ordinas et al., 2014). Primary antibodies were purchased from Cell Signaling Technology (CST). Immunoreactivity was revealed with an ECL-Plus kit (Amersham Biosciences) using the ChemiDoc MP system (Bio-Rad). Selected melanoma cells were maintained in 10-cm cell culture dishes and treated with 5,000 IU/mL interferon alpha, 500 IU/mL interferon beta, or 100 IU/mL interferon gamma for 30 min and 18 hr.
Transient Luciferase Reporter Assays
M381 cells were seeded in 24-well plates for 18 hr and then transfected in triplicate using the TransIT-X2 (Mirus Bio) according to the manufacturer’s manual with 0.5 µg of each experimental plasmid and 0.5 µg of the Renilla pRL-SV40P plasmid used for normalization per well. After 24 hr in culture, relative luciferase units (RLUs) were measured in non-treated and interferon-treated cells (3 hr, 100 IU/mL interferon gamma; 500, IU/ml interferon beta) using the Dual-Glo Luciferase Assay System and a GloMax 96 Microplate Luminometer (Promega) according to the manufacturer’s instructions. RLUs from firefly luciferase signal were normalized by RLUs from Renilla signal.
shRNA Lentiviral Screen
1,000–1,500 cells of each reporter cell line were seeded in 384-well plates and transduced with 15 µL of each virus containing a shRNA hairpin or with the same empty vector without any active hairpin as a control. After 72 hr of culture, transduced cells were treated with 100 U/mL interferon gamma for 8 hr and then stained with 35 µM propidium iodide (PI) and 5 µg/mL Hoechst (Invitrogen). Cell images were acquired using an Image press XL (Molecular Devices) with a 10× objective (0.6 numerical aperture [NA]) in the DAPI, GFP (virus encoded), and CY3 channel. Images were analyzed using the MetaXpress multi-wavelength cell-scoring algorithm with standard settings in order to score cells and calculate percent viability and efficiency of transduction. RLUs for firefly and Renilla were analyzed using the Dual Glo Luciferase Assay System (Promega) according to the manufacturer instructions in a Victor3V luminometer (Perkin Elmer) with 0.1 s integration time. Firefly RLUs were normalized to the Renilla signal and the percentage of transduction to take into account any possible difference in cell viability and virus titer. A probability-based RSA analysis was performed in order to minimize the impact of the shRNA off-target activities as described in the statistical analysis section. Relative downregulation compared to the control were calculated and plotted for each gene and cell line (Figures 3B–3D). A global score based ranking was generated taking into consideration the position of each gene in the 3 cell lines and then was mapped onto the interferon pathways using PathVisio (v 3.2.1) (Kutmon et al., 2015). Pathway representation was based on interferon type I signaling (Homo sapiens) from Wikipathways (WP585) and edited for size and clarity and to include type II interferon pathway components (Kutmon et al., 2016).
ChIP
Formaldehyde-cross-linked chromatin was prepared from 2 × 10⁷ M381 melanoma cells, and ChIP was performed using the SimpleChip Plus Enzymatic Chromatin IP Kit (Magnetic Beads 9005) from CST according to the manufacturer’s instructions. Antibodies were purchased from CST (normal rabbit immunoglobulin G [IgG] 2729, STAT3 12640) and Abcam (IRF1 ab26109). To calculate DNA enrichment in the ChIP assays, Real-time qPCR was performed in an ABI 7500 (Applied Biosystems, Thermo Fisher Scientific) or a CFX96 real-time PCR system (Bio-Rad) using the iQ SYBR Green supermix (Bio-Rad) and the primers for the PD-L1, PD-L2, and HLA-B promoters listed in Table S1. SimpleChip C-FOS and human tRNA-Leu anti-codon (TAG) primers were purchased from CST, and HLA-B primers were previously reported (Stefan et al., 2011).
Gene Expression qPCR Assays
Downregulation of the genes in the generated cells lines was measured by qPCR using TaqMan gene expression assays and the TaqMan RNA-to-CT 1-Step Kit (Applied Biosystems, Thermo Fisher Scientific) following the vendor’s specifications. Total RNA was extracted from cell lines in the absence or presence of interferon-gamma (100 IU/mL) at 3 hr using the QIAGEN AllPrep DNA/RNA Mini Kit RNeasy kit according to the manufacturer’s protocol (QIAGEN).
nCounter Transcriptional Profiling Analysis
Total RNA was extracted from human melanoma cell lines in the absence or presence of interferon gamma (100 IU/mL) at 3 hr as described above. nCounter (NanoString Technologies) analysis was performed at the Center for Systems Biomedicine, a part of the Integrated Molecular Technologies Core (IMTC) at UCLA analyzing the genes detailed in Table S2. mRNA transcripts of specific cellular genes, including housekeeping genes for normalization, were quantified in untreated M233, M244, M263, M368, M381, and M395 cells and after 3 hr of interferon gamma exposure. M233 cells were also coincubated for 3 hr with 1 µM JAK2 pharmacological inhibitor CEP-33779 (Apex Bio). Results were analyzed using the 2.5 nSolver Software (NanoString Technologies).
Tumor Biopsies and Immunohistochemical Staining
Tumor biopsy specimens were obtained from patients receiving anti-PD-1 therapy under UCLA IRB 11-001918. Samples were immediately fixed in formalin followed by paraffin embedding and processed for snap-freezing in liquid nitrogen when an additional sterile piece of the tumor was present (Tumeh et al., 2014). For CD8 and PD-L1 analyses of tumor biopsy specimens, slides were stained with H&E, S100, CD8, and PD-L1 at UCLA’s anatomic pathology immunohistochemistry laboratory. Immunostaining was performed on Leica Bond III autostainers using Leica Bond ancillary reagents and REFINE polymer 3,3′-diaminobenzidine (DAB) detection system. Percent positivity in the invasive margin or intratumoral area was calculated using the Indica Labs Halo platform as previously described (Tumeh et al., 2014).
CRISPR/Cas9-Mediated Knockout
The human melanoma cell line M233 was subjected to CRISPR/Cas9-mediated knockout of MAK14 (p38), CRKL, and PI3K by lentiviral transduction using particles encoding guide RNAs, a fully functional CAS9 cassette, GFP, and puromycin as selectable markers (Sigma-Aldrich), as previously described (Zaretsky et al., 2016). Two guide sequences were used per gene. GFP-positive single-cell clones were isolated using a FACSARIA sorter (Becton Dickinson). Disruption was confirmed by Sanger sequencing with tracking of indels by decomposition (TIDE) analysis (Netherlands Cancer Institute (NKI); https://tide.nki.nl) and finally by western blot.
RNA-Seq Gene Set Enrichment and Transcription Factor Enrichment Analysis
RNA-seq data were generated using 2 × 100 bp paired-end sequencing using the Illumina HiSeq2000 platform. Paired-end reads were mapped to the UCSC hg19 reference genome using Tophat2 (Kim et al., 2013); full methods are included in Supplemental Experimental Procedures.
Statistical Analysis
Descriptive statistics such as mean and SD were calculated and are presented in the figures. Unpaired t tests were performed for reporter assay analysis as well as comparing percent input in ChIP analysis. For the shRNA screening, a probability-based RSA analysis was performed in order to minimize the impact of off-target activities of the different shRNA hairpins used in the study (König et al., 2007). The activities of the top hit shRNAs of each gene identified by RSA algorithm were then summarized and presented. nCounter expression profile analysis was carried out using the 2.5 nSolver Software (NanoString Technologies). The normalization module of this software used the popular geNorm algorithm (Vandesompele et al., 2002) to identify the most stable subset of housekeeping genes. From this, a gene expression normalization factor was calculated for each sample based on the geometric mean of the selected housekeeping genes. The normalized expression values of each sample were visualized and presented in scatterplots. Graph Pad Prism Version 6 was also used to generate plots and additional statistical analysis.
Supplementary Material
Highlights.
PD-L1 is primarily regulated by interferon gamma signaling in melanoma cells
PD-L2 is regulated by both interferon beta and gamma signaling
Regulation of PD-1 ligands works mainly through the JAK1/2-STAT1/3-IRF1 axis
Acknowledgments
This work was funded by NIH grants R35 CA197633 and P01 CA168585, the Parker Institute for Cancer Immunotherapy, the Dr. Robert Vigen Memorial Fund, the Ressler Family Foundation, the Samuels Family Fund, and the Garcia-Corsini Family Fund (to A.R.). A.R. was supported by a Stand Up To Cancer – Cancer Research Institute Cancer Immunology Dream Team Translational Research grant SU2C-AACR-DT1012). Stand Up To Cancer is a program of the Entertainment Industry Foundation administered by the American Association for Cancer Research. D.S.S. was supported by oncology (5T32CA009297-30), dermatology (5T32AR058921-05), and tumor immunology (5T32CA009120-39) training grants and a Tower Cancer Research Foundation grant. B.H.M. was supported by Juan Rodes Scholarship G83727016 from the Hospital 12 de Octubre, Madrid, Spain. Flow cytometry was performed in the UCLA Jonsson Comprehensive Cancer Center (JCCC) and Center for AIDS Research Flow Cytometry Core Facility, which is supported by NIH awards CA-16042 and AI-28697, and the JCCC, the UCLA AIDS Institute, and the David Geffen School of Medicine at UCLA. The NanoString experiments were run at the Center for Systems Biomedicine, a part of the Integrated Molecular Technologies Core (IMTC) supported by CURE/P30DK41301-26. We are grateful to Ron Prywes for the pRL-SV40P plasmid (Addgene plasmid 27163). Thanks to Bryan France and Bobby Tofig from the CNSI Molecular Screening Share Facility at UCLA for the help with the shRNA screen, Drs. Bin Liu and Kei Shuai from UCLA for guidance on interferon signaling and ChIP analyses, Shauna Gerold and Emmanuelle Faure-Kumar for assistance in NanoString data analysis, and Jeff Calimlim and the rest of the staff from the flow cytometry core laboratory at UCLA for the flow cytometry support.
Footnotes
ACCESSION NUMBERS
The accession number for the RNA-seq data reported in this paper is GEO: GSE96619. The nCounter transcriptome is listed in Table S2.
Supplemental Information includes Supplemental Experimental Procedures, seven figures, and four tables and can be found with this article online at http://dx.doi.org/10.1016/j.celrep.2017.04.031.
AUTHOR CONTRIBUTIONS
A.R. and A.G.-D. supervised the project and developed the concepts. A.G.-D., D.S.S., B.H.M., J.M.Z., G.P., C.P.S., R.D., B.C.-A., T.G.G., and A.R. designed the experiments. A.G.-D. performed vector cloning, promoter truncation analysis, qPCR assays, transcriptional profile analysis, and reporter cell line generation. A.G.-D. and D.S.S. performed ChIP analysis. J.S. assisted in the construct cloning and performed truncation studies. D.S.S. performed flow cytometry analysis. A.G.-D., R.D., and J.M.Z. carried out shRNA screen analysis. D.S.S. and H.E.O. performed western blot analysis. L.S., W.H., and R.S.L. performed RNA-seq analyses. S.H.-L. performed pathological analyses in biopsies. X.W. carried out statistical analysis. A.G.-D. and A.R. wrote the manuscript. All authors contributed to the manuscript and approved the final version.
References
- Aaronson DS, Horvath CM. A road map for those who don’t know JAK-STAT. Science. 2002;296:1653–1655. doi: 10.1126/science.1071545. [DOI] [PubMed] [Google Scholar]
- Atefi M, Avramis E, Lassen A, Wong DJ, Robert L, Foulad D, Cerniglia M, Titz B, Chodon T, Graeber TG, et al. Effects of MAPK and PI3K pathways on PD-L1 expression in melanoma. Clin. Cancer Res. 2014;20:3446–3457. doi: 10.1158/1078-0432.CCR-13-2797. [DOI] [PMC free article] [PubMed] [Google Scholar]
- Chen X, Prywes R. Serum-induced expression of the cdc25A gene by relief of E2F-mediated repression. Mol. Cell. Biol. 1999;19:4695–4702. doi: 10.1128/mcb.19.7.4695. [DOI] [PMC free article] [PubMed] [Google Scholar]
- Darnell JE, Jr, Kerr IM, Stark GR. Jak-STAT pathways and transcriptional activation in response to IFNs and other extracellular signaling proteins. Science. 1994;264:1415–1421. doi: 10.1126/science.8197455. [DOI] [PubMed] [Google Scholar]
- Decker T, Lew DJ, Mirkovitch J, Darnell JE., Jr Cytoplasmic activation of GAF, an IFN-gamma-regulated DNA-binding factor. EMBO J. 1991;10:927–932. doi: 10.1002/j.1460-2075.1991.tb08026.x. [DOI] [PMC free article] [PubMed] [Google Scholar]
- Domanski P, Colamonici OR. The type-I interferon receptor. The long and short of it. Cytokine Growth Factor Rev. 1996;7:143–151. doi: 10.1016/1359-6101(96)00017-2. [DOI] [PubMed] [Google Scholar]
- Dong H, Strome SE, Salomao DR, Tamura H, Hirano F, Flies DB, Roche PC, Lu J, Zhu G, Tamada K, et al. Tumor-associated B7-H1 promotes T-cell apoptosis: a potential mechanism of immune evasion. Nat. Med. 2002;8:793–800. doi: 10.1038/nm730. [DOI] [PubMed] [Google Scholar]
- Dunn GP, Sheehan KCF, Old LJ, Schreiber RD. IFN unresponsiveness in LNCaP cells due to the lack of JAK1 gene expression. Cancer Res. 2005;65:3447–3453. doi: 10.1158/0008-5472.CAN-04-4316. [DOI] [PubMed] [Google Scholar]
- Escuin-Ordinas H, Atefi M, Fu Y, Cass A, Ng C, Huang RR, Yashar S, Comin-Anduix B, Avramis E, Cochran AJ, et al. COX-2 inhibition prevents the appearance of cutaneous squamous cell carcinomas accelerated by BRAF inhibitors. Mol. Oncol. 2014;8:250–260. doi: 10.1016/j.molonc.2013.11.005. [DOI] [PMC free article] [PubMed] [Google Scholar]
- Friedman RL, Stark GR. α-Interferon-induced transcription of HLA and metallothionein genes containing homologous upstream sequences. Nature. 1985;314:637–639. doi: 10.1038/314637a0. [DOI] [PubMed] [Google Scholar]
- Gao J, Shi LZ, Zhao H, Chen J, Xiong L, He Q, Chen T, Roszik J, Bernatchez C, Woodman SE. Loss of IFN-γ pathway genes in tumor cells as a mechanism of resistance to anti-CTLA-4 therapy. Cell. 2016;167:397–404. doi: 10.1016/j.cell.2016.08.069. [DOI] [PMC free article] [PubMed] [Google Scholar]
- Herbst RS, Soria J-C, Kowanetz M, Fine GD, Hamid O, Gordon MS, Sosman JA, McDermott DF, Powderly JD, Gettinger SN, et al. Predictive correlates of response to the anti-PD-L1 antibody MPDL3280A in cancer patients. Nature. 2014;515:563–567. doi: 10.1038/nature14011. [DOI] [PMC free article] [PubMed] [Google Scholar]
- Isaacs A, Lindenmann J. Virus interference. I. The interferon. Proc. R. Soc. Lond. B Biol. Sci. 1957;147:258–267. [PubMed] [Google Scholar]
- Ivashkiv LB, Donlin LT. Regulation of type I interferon responses. Nat. Rev. Immunol. 2014;14:36–49. doi: 10.1038/nri3581. [DOI] [PMC free article] [PubMed] [Google Scholar]
- Kaplan DH, Shankaran V, Dighe AS, Stockert E, Aguet M, Old LJ, Schreiber RD. Demonstration of an interferon γ-dependent tumor surveillance system in immunocompetent mice. Proc. Natl. Acad. Sci. USA. 1998;95:7556–7561. doi: 10.1073/pnas.95.13.7556. [DOI] [PMC free article] [PubMed] [Google Scholar]
- Kappes JC, Wu X. Safety considerations in vector development. Somat. Cell Mol. Genet. 2001;26:147–158. doi: 10.1023/a:1021082815013. [DOI] [PubMed] [Google Scholar]
- Kessler DS, Levy DE, Darnell JE., Jr Two interferon-induced nuclear factors bind a single promoter element in interferon-stimulated genes. Proc. Natl. Acad. Sci. USA. 1988;85:8521–8525. doi: 10.1073/pnas.85.22.8521. [DOI] [PMC free article] [PubMed] [Google Scholar]
- Kim J, Myers AC, Chen L, Pardoll DM, Truong-Tran Q-A, Lane AP, McDyer JF, Fortuno L, Schleimer RP. Constitutive and inducible expression of b7 family of ligands by human airway epithelial cells. Am. J. Respir. Cell Mol. Biol. 2005;33:280–289. doi: 10.1165/rcmb.2004-0129OC. [DOI] [PMC free article] [PubMed] [Google Scholar]
- Kim D, Pertea G, Trapnell C, Pimentel H, Kelley R, Salzberg SL. TopHat2: accurate alignment of transcriptomes in the presence of insertions, deletions and gene fusions. Genome Biol. 2013;14:R36. doi: 10.1186/gb-2013-14-4-r36. [DOI] [PMC free article] [PubMed] [Google Scholar]
- König R, Chiang CY, Tu BP, Yan SF, DeJesus PD, Romero A, Bergauer T, Orth A, Krueger U, Zhou Y, Chanda SK. A probability-based approach for the analysis of large-scale RNAi screens. Nat. Methods. 2007;4:847–849. doi: 10.1038/nmeth1089. [DOI] [PubMed] [Google Scholar]
- Kutmon M, van Iersel MP, Bohler A, Kelder T, Nunes N, Pico AR, Evelo CT. PathVisio 3: an extendable pathway analysis toolbox. PLoS Comput. Biol. 2015;11:e1004085. doi: 10.1371/journal.pcbi.1004085. [DOI] [PMC free article] [PubMed] [Google Scholar]
- Kutmon M, Riutta A, Nunes N, Hanspers K, Willighagen EL, Bohler A, Mélius J, Waagmeester A, Sinha SR, Miller R, et al. WikiPathways: capturing the full diversity of pathway knowledge. Nucleic Acids Res. 2016;44(D1):D488–D494. doi: 10.1093/nar/gkv1024. [DOI] [PMC free article] [PubMed] [Google Scholar]
- Lee S-J, Jang B-C, Lee S-W, Yang Y-I, Suh S-I, Park Y-M, Oh S, Shin J-G, Yao S, Chen L, Choi IH. Interferon regulatory factor-1 is prerequisite to the constitutive expression and IFN-γ-induced upregulation of B7-H1 (CD274) FEBS Lett. 2006;580:755–762. doi: 10.1016/j.febslet.2005.12.093. [DOI] [PubMed] [Google Scholar]
- Lew DJ, Decker T, Strehlow I, Darnell JE. Overlapping elements in the guanylate-binding protein gene promoter mediate transcriptional induction by alpha and gamma interferons. Mol. Cell. Biol. 1991;11:182–191. doi: 10.1128/mcb.11.1.182. [DOI] [PMC free article] [PubMed] [Google Scholar]
- Loke P, Allison JP. PD-L1 and PD-L2 are differentially regulated by Th1 and Th2 cells. Proc. Natl. Acad. Sci. USA. 2003;100:5336–5341. doi: 10.1073/pnas.0931259100. [DOI] [PMC free article] [PubMed] [Google Scholar]
- Marzec M, Zhang Q, Goradia A, Raghunath PN, Liu X, Paessler M, Wang HY, Wysocka M, Cheng M, Ruggeri BA, Wasik MA. Oncogenic kinase NPM/ALK induces through STAT3 expression of immunosuppressive protein CD274 (PD-L1, B7-H1) Proc. Natl. Acad. Sci. USA. 2008;105:20852–20857. doi: 10.1073/pnas.0810958105. [DOI] [PMC free article] [PubMed] [Google Scholar]
- Novick D, Cohen B, Rubinstein M. The human interferon α/β receptor: characterization and molecular cloning. Cell. 1994;77:391–400. doi: 10.1016/0092-8674(94)90154-6. [DOI] [PubMed] [Google Scholar]
- Pachkov M, Erb I, Molina N, van Nimwegen E. SwissRegulon: a database of genome-wide annotations of regulatory sites. Nucleic Acids Res. 2007;35:D127–D131. doi: 10.1093/nar/gkl857. [DOI] [PMC free article] [PubMed] [Google Scholar]
- Pardoll DM. The blockade of immune checkpoints in cancer immunotherapy. Nat. Rev. Cancer. 2012;12:252–264. doi: 10.1038/nrc3239. [DOI] [PMC free article] [PubMed] [Google Scholar]
- Platanias LC. Mechanisms of type-I- and type-II-interferon-mediated signalling. Nat. Rev. Immunol. 2005;5:375–386. doi: 10.1038/nri1604. [DOI] [PubMed] [Google Scholar]
- Platanias LC, Uddin S, Bruno E, Korkmaz M, Ahmad S, Alsayed Y, Van Den Berg D, Druker BJ, Wickrema A, Hoffman R. CrkL and CrkII participate in the generation of the growth inhibitory effects of interferons on primary hematopoietic progenitors. Exp. Hematol. 1999;27:1315–1321. doi: 10.1016/s0301-472x(99)00060-0. [DOI] [PubMed] [Google Scholar]
- Qing Y, Stark GR. Alternative activation of STAT1 and STAT3 in response to interferon-γ. J. Biol. Chem. 2004;279:41679–41685. doi: 10.1074/jbc.M406413200. [DOI] [PubMed] [Google Scholar]
- Ribas A. Adaptive immune resistance: how cancer protects from immune attack. Cancer Discov. 2015;5:915–919. doi: 10.1158/2159-8290.CD-15-0563. [DOI] [PMC free article] [PubMed] [Google Scholar]
- Saha B, Jyothi Prasanna S, Chandrasekar B, Nandi D. Gene modulation and immunoregulatory roles of interferon γ. Cytokine. 2010;50:1–14. doi: 10.1016/j.cyto.2009.11.021. [DOI] [PubMed] [Google Scholar]
- Sambrook J, Fritsch EF, Maniatis T. Molecular cloning: a laboratory manual. Cold spring harbor laboratory press; 1989. [Google Scholar]
- Schroder K, Hertzog PJ, Ravasi T, Hume DA. Interferon-γ: an overview of signals, mechanisms and functions. J. Leukoc. Biol. 2004;75:163–189. doi: 10.1189/jlb.0603252. [DOI] [PubMed] [Google Scholar]
- Shin D, Garcia-Diaz A, Zaretsky J, Escuin-Ordinas H, Hu-Lieskovan S, Palaskas NJ, Hugo W, Komenan MS, Chmielowski B, Cherry G, et al. Innate resistance of PD-1 blockade through loss of function mutations in JAK resulting in inability to express PD-L1 upon interferon exposure. J. Immunother. Cancer. 2015;3:311. [Google Scholar]
- Shin DS, Zaretsky JM, Escuin-Ordinas H, Garcia-Diaz A, Hu-Lieskovan S, Kalbasi A, Grasso CS, Hugo W, Sandoval S, Torrejon DY, et al. Primary resistance to PD-1 blockade mediated by JAK1/2 mutations. Cancer Discov. 2017;7:188–201. doi: 10.1158/2159-8290.CD-16-1223. [DOI] [PMC free article] [PubMed] [Google Scholar]
- Silva JM, Li MZ, Chang K, Ge W, Golding MC, Rickles RJ, Siolas D, Hu G, Paddison PJ, Schlabach MR, et al. Second-generation shRNA libraries covering the mouse and human genomes. Nat. Genet. 2005;37:1281–1288. doi: 10.1038/ng1650. [DOI] [PubMed] [Google Scholar]
- Smith PL, Lombardi G, Foster GR. Type I interferons and the innate immune response–more than just antiviral cytokines. Mol. Immunol. 2005;42:869–877. doi: 10.1016/j.molimm.2004.11.008. [DOI] [PubMed] [Google Scholar]
- Sriuranpong V, Park JI, Amornphimoltham P, Patel V, Nelkin BD, Gutkind JS. Epidermal growth factor receptor-independent constitutive activation of STAT3 in head and neck squamous cell carcinoma is mediated by the autocrine/paracrine stimulation of the interleukin 6/gp130 cytokine system. Cancer Res. 2003;63:2948–2956. [PubMed] [Google Scholar]
- Stefan M, Jacobson EM, Huber AK, Greenberg DA, Li CW, Skrabanek L, Conception E, Fadlalla M, Ho K, Tomer Y. Novel variant of thyroglobulin promoter triggers thyroid autoimmunity through an epigenetic interferon a-modulated mechanism. J. Biol. Chem. 2011;286:31168–31179. doi: 10.1074/jbc.M111.247510. [DOI] [PMC free article] [PubMed] [Google Scholar]
- Stump KL, Lu LD, Dobrzanski P, Serdikoff C, Gingrich DE, Dugan BJ, Angeles TS, Albom MS, Ator MA, Dorsey BD, et al. A highly selective, orally active inhibitor of Janus kinase 2, CEP-33779, ablates disease in two mouse models of rheumatoid arthritis. Arthritis Res. Ther. 2011;13:R68. doi: 10.1186/ar3329. [DOI] [PMC free article] [PubMed] [Google Scholar]
- Tseng S-Y, Otsuji M, Gorski K, Huang X, Slansky JE, Pai SI, Shalabi A, Shin T, Pardoll DM, Tsuchiya H. B7-DC, a new dendritic cell molecule with potent costimulatory properties for T cells. J. Exp. Med. 2001;193:839–846. doi: 10.1084/jem.193.7.839. [DOI] [PMC free article] [PubMed] [Google Scholar]
- Tumeh PC, Harview CL, Yearley JH, Shintaku IP, Taylor EJ, Robert L, Chmielowski B, Spasic M, Henry G, Ciobanu V, et al. PD-1 blockade induces responses by inhibiting adaptive immune resistance. Nature. 2014;515:568–571. doi: 10.1038/nature13954. [DOI] [PMC free article] [PubMed] [Google Scholar]
- Vandesompele J, De Preter K, Pattyn F, Poppe B, Van Roy N, De Paepe A, Speleman F. Accurate normalization of real-time quantitative RT-PCR data by geometric averaging of multiple internal control genes. Genome Biol. 2002;3:H0034. doi: 10.1186/gb-2002-3-7-research0034. [DOI] [PMC free article] [PubMed] [Google Scholar]
- Velazquez L, Fellous M, Stark GR, Pellegrini S. A protein tyrosine kinase in the interferon α/β signaling pathway. Cell. 1992;70:313–322. doi: 10.1016/0092-8674(92)90105-l. [DOI] [PubMed] [Google Scholar]
- Zaretsky JM, Garcia-Diaz A, Shin DS, Escuin-Ordinas H, Hugo W, Hu-Lieskovan S, Torrejon DY, Abril-Rodriguez G, Sandoval S, Barthly L, et al. Mutations associated with acquired resistance to PD-1 blockade in melanoma. N. Engl. J. Med. 2016;375:819–829. doi: 10.1056/NEJMoa1604958. [DOI] [PMC free article] [PubMed] [Google Scholar]
Associated Data
This section collects any data citations, data availability statements, or supplementary materials included in this article.