Abstract
The maturation of the myelinated white matter throughout childhood is a critical developmental process that underlies emerging connectivity and brain function. In response to genetic influences and neuronal activities, myelination helps establish the mature neural networks that support cognitive and behavioral skills. The emergence and refinement of brain networks, traditionally investigated using functional imaging data, can also be interrogated using longitudinal structural imaging data. However, few studies of structural network development throughout infancy and early childhood have been presented, likely owing to the sparse and irregular nature of most longitudinal neuroimaging data, which complicates dynamic analysis. Here, we overcome this limitation and investigate through concurrent correlation the co-development of white matter myelination and volume, and structural network development of white matter myelination between brain regions as a function of age, using statistically well-supported methods. We show that the concurrent correlation of white matter myelination and volume is overall positive and reaches a peak at 580 days. Brain regions are found to differ in overall magnitudes and patterns of time-varying association throughout early childhood. We introduce time-dynamic developmental networks based on temporal similarity of association patterns in the levels of myelination across brain regions. These networks reflect groups of brain regions that share similar patterns of evolving intra-regional connectivity, as evidenced by levels of myelination, are biologically interpretable and provide novel visualizations of brain development. Comparing the constructed networks between different maternal education groups, we found that children with higher and lower maternal education differ significantly in the overall magnitude of the time-dynamic correlations.
Keywords: Whole Brain MRI, Myelination, Developmental Network, Concurrent Correlation Structure
INTRODUCTION
The maturation of the myelinated white matter is an important neurodevelopmental process that underlies brain connectivity and messaging across the brain’s eloquent neural regions and systems. From classic histological studies, e.g., Yakovlev and Lecours (1967), the elaboration of the myelin sheath around neuronal axons follows a well described spatio-temporal pattern, advancing from deep brain to superficial regions in a posterior-to-anterior arc. Comparisons of this pattern with cognitive and behavioral milestones (Casey et al., 2000; Johnson, 2001;Durston and Casey, 2006) reveal strong overlap between myelination and functional development, further highlighted in more recent neuroimaging studies (van der Knaap et al., 1991; Nagy et al., 2004; Zatorre et al., 2012; O’Muircheartaigh et al., 2014; Chevalier et al., 2015; Deoni et al., 2016).
In general, however, studies exploring the relationship(s) between structural maturation and evolving cognitive and/or behavioral skills have been cross-sectional, making it difficult to appreciate how these relationships evolve across the brain with age. Understanding of this time-dynamic association is of significant scientific interest, not only for investigating general neurodevelopment, but also with respect to understanding and characterizing sensitive windows of development (Hensch and Bilimoria, 2012) with important implications for interventional timing and approach (Maríin, 2016). Using data acquired longitudinally, prior studies have linked patterns of development to later childhood outcomes (Shaw et al., 2006; 2009; Wolff et al., 2012; Deoni et al., 2016). However, this approach also fails to elucidate how these structure-function/outcome relationships evolve and change with child age. More recently, Dean et al. (2015) has used a moving bin correlation approach in order to investigate the time-dynamic association between white matter development in infants and toddlers and cognitive ability measures obtained from the Mullen Scales of Early Learning (MSEL) (Mullen, 1995). In this study, we explore the use of concurrent correlation to investigate the maturation of white matter structures as well as the co-development of white matter myelin water fraction (MWF) and white matter volume, where the concurrent correlation was estimated by kernel smoothing.
A secondary outcome of investigating brain-behavior relationships is the illumination of the underlying brain networks and systems. Typically investigated using functional neuroimaging, the identification of neural systems that underlie differing cognitive and behavioral skills is an important goal in neuroscience research. Resting-state functional imaging, or functional connectivity imaging (Smith et al., 2013), allows the delineation of brain networks based on shared temporal signal profiles with the assumption that discrete voxels with similar temporal profiles are in some way connected or part of the same underlying network (Bullmore and Sporns, 2009; Wang et al., 2010). Comparison of the brain’s connections, or connectivity matrix, between healthy and diseased populations can provide invaluable insight into pathology-induced disruption (Fair et al., 2012; Fornito et al., 2012), and analysis across the population can inform on associations between connectivity and cognitive metrics. Characterizing connectivity across infancy and childhood also allows investigation into the brain’s functional organization and how networks emerge and are refined with age (Fair et al., 2007; Supekar et al., 2010; Uddin et al., 2010).
A similar approach (i.e., voxels with similar temporal functional signal profiles are part of the same network) may also be applied to structural imaging data, though over a longer time span (i.e., weeks, months, or years) (O’Muircheartaigh et al., 2014). Here, the assumption is that regions with similar developmental profiles are part of the same network. Previously, our group has used independent component analysis (ICA) (Beckmann, 2012) to identify spatially contiguous regions with similar temporal developmental profiles of myelination, and then related those structural profiles to developing cognitive abilities (O’Muircheartaigh et al., 2014). While informative, evaluating a single temporal correlation value across the entire developmental window limits our ability to investigate the time-dynamics of evolving structural networks. In this study, therefore, we use concurrent correlation to investigate the simultaneous and coincident maturation of white matter regions to: 1. Determine whether this methodology provides biologically meaningful measures for the concurrent development of pairs of brain regions; and 2. Construct networks that are not age-dependent but inform about (a) the total level of co-development, and (b) the dynamics of co-development, where these networks will reflect the dynamics across all ages through infancy and early childhood.
We hypothesized that structural maturation should mirror functional changes (Fair et al., 2007), with networks becoming more specialized and segregated with age.
Building on this methodological framework, we then sought to investigate differences in network structure and evolution in children stratified by socioeconomic status, for which maternal education level served as a stable and prominent proxy (Bornstein et. al. 2003), while we also evaluated the effect of SES as measured by the Hollingshead 4-Factor Index (HI) (Hollingshead 1975). Results from our analysis revealed significant differences in the overall magnitude of the time-dynamic correlation amongst identified white matter networks for different maternal education levels.
This work provides the foundation for a potentially important new way of investigating brain development that, though applied here to structural myelin water imaging data, could be readily applied to other longitudinal functional, diffusion, or structural imaging data.
METHODS
Subjects
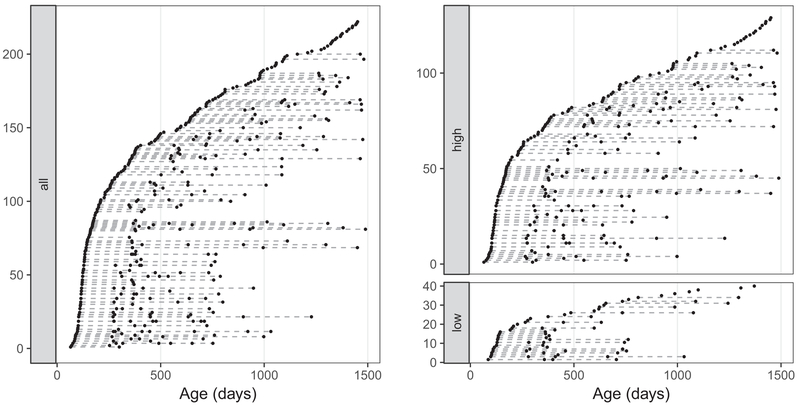
Data from 222 children (127 males) between 65 days and 1489 days of age (approximately 2 to 48 months) were included in this analysis. General demographic information is provided in Table 1. A total of 445 longitudinal MRI measurements were made at irregular time points for these children, ranging from one to six measurements per child (median = 2 measurements) at 6 to 24- month intervals (median = 15.5 months) as shown in Fig. 1.
Table 1.
Children demographics by maternal education levels (higher, ≥ college or university graduate; median, partial college; lower, ≤ high school graduate)
| Education | Higher | Medium | Lower |
|---|---|---|---|
| Participants (n) | 129 | 53 | 40 |
| Number of visits | 2.2 ± 1.2 | 1.7 ± 0.94 | 1.9 ± 0.96 |
| Female:male | 54:75 | 21:32 | 20:20 |
| Gestational age (days) | 275 ± 9 | 276 ± 9 | 278 ± 8 |
| Birth weight (kg) | 3.4 ± 0.5 | 3.4 ± 0.4 | 3.2 ± 0.5 |
| Feeding method Mixed:bottle:breast | 44:22:58 | 20:13:17 | 9:23:7 |
Fig. 1.
Left: Visit times for all subjects. Right: Visit times for subjects with higher or lower maternal education. Each row corresponds to a subject, where black dots denote visits
Children were recruited from the local Providence, Rhode Island and surrounding areas with a focus on neurotypical development. Children with known risk factors for abnormal brain or cognitive development were excluded, including in utero exposure to alcohol, cigarette smoke, or other illicit substances; premature birth before 37 weeks gestation; neurological trauma; or family history of major psychiatric or learning disorder, including maternal depression requiring medication. Specific inclusion criteria included: 1. Healthy singleton birth between 37 and 42 weeks gestation; 2. Uncomplicated pregnancy and delivery; 3. APGAR scores > 8; 4. No reported abnormalities on fetal ultrasound; 5. No reported neurological history in the child; 6. No reported psychiatric or learning disability history in the child or first-degree relatives.
MRI Protocol & Analysis
In general, children under 4 years of age were imaged during natural and non-sedated sleep. Older children who were able to tolerate awake scanning were imaged while watching a favorite movie. All imaging was performed on a 3-Tesla Siemens Tim Trio scanner equipped with a 12-channel head RF array. To minimize subject motion, children were swaddled in an infant or pediatric MedVac vacuum immobilization bag (CFI Medical Solutions, USA) and foam cushions were placed around their head. Scanner noise was reduced by limiting the peak gradient amplitudes and slew-rates to 25 mT/m/s. A noise-insulating insert (Quiet Barrier HD Composite, UltraBarrier, USA) was also fitted to the inside of the scanner bore. MiniMuff pediatric ear covers and electrodynamic headphones (MR Confon, Germany) were used for all children. A pediatric pulse-oximetry system and infrared camera were used to continuously monitor the infants and children during scanning (Dean et al., 2014a).
To assess brain development, myelin water fraction (MWF) imaging via mcDESPOT (Deoni et al., 2008) was used to characterize myelination. Through the acquisition of multiple variable flip angle T1-weighted spoiled gradient and T1/T2-weighted fully-balanced images, mcDESPOT decomposes the measured MRI signal into contributions from 3 water pools or relaxation species: water trapped within the lipid bilayers of the myelin sheath; intra and extracellular water; and a non-exchange free water component attributable to cerebral spinal fluid (CSF). The MWF is the relative volume fraction of the myelin-associated water and is generally between 0 and 25% for healthy white matter (MacKay et al, 2009). Validation of the MWF as a reliable biomarker of myelin content has been previously provided by MRI-histology correlations (Wood et al. 2016), as well as from in vivo studies of known white matter disorders, such as multiple sclerosis (Kolind et al. 2012).
Age-specific and acoustically muffled imaging protocols (Deoni et al., 2012), comprising 8 T1-weighted spoiled gradient echo images (SPGR or spoiled FLASH) and 16 balanced T1/T2-weighted steady-state free precession (bSSFP or TrueFISP) images, were used to acquire quantitative (q)T1, qT2, and MWF data in each child. Two inversion-prepared (IR)-SPGR images were additionally acquired for correction of radio-frequency (B1) inhomogeneities and bSSFP images were acquired with two phase cycling patterns (180° and 0°) for correction of main magnetic field (B0) inhomogeneities (Deoni, 2011). Total imaging times ranged from 15 minutes to 24 minutes depending on child age and head size.
Following acquisition, data were visually assessed for motion artefacts (e.g., blurring and ghosting) by the same research team member (SCLD) and standard mcDESPOT processing was performed. This includes linear co-registration of the child’s SPGR, IR-SPGR, and bSSFP images to account for subtle head movement (Jenkinson et al., 2002), non-parenchyma voxel removal (Smith, 2002), and correction of flip angle errors and off-resonance inhomogeneities using DESPOT1-HIFI and DESPOT2-FM (Deoni, 2011). The multi-angle SPGR and bSSFP data were subsequently fit to 1- and 3-pool tissue models to estimate single-component qT1 and qT2, and multi component volume fractions and relaxation times for intra/extra-axonal water, non-exchanging free water, and the myelin-associated water (MWF) (Deoni et al., 2013b). These quantitative images (‘maps’) were then non-linearly aligned to a common analysis space in the approximate Montreal Neurological Institute (MNI) space using a previously described multi-step approach that first aligns the subject’s high flip angle T1 weighted SPGR image to an age-specific template and then applies the calculated transformation matrix to the quantitative maps.
Using standardized structural (Brett, 1999) and tractography (Mori et al., 2008) atlases, regional masks were developed corresponding to bilateral cerebellar white matter, cingulum, corona radiata, internal capsule; frontal, occipital, parietal, and temporal lobes; and the genu, splenium, and body of the corpus callosum. Mean MWF values were obtained from each of these regions for each child.
We also quantified total white matter, gray matter, and brain volume using an atlas-based approach. Due to the lack of gray/white matter contrast, it is difficult to accurately delineate white matter in children under ~9 months of age using either qT1 or T1 weighted imaging data (Raschle et al., 2012). To address this, we first applied FMRIB’s Fast Automated Segmentation Tool (FAST) (Zhang et al., 2001) to a large (n=93) set of T1 weighted images from children 2-4 years of age. Calculated white and gray matter masks were then non-linearly registered to our common analysis space using the same transformation approach as described above. Aligned masks were then averaged and thresholded to create population masks, which were then transformed back to all participants by applying the inverse transformation matrix for each individual. White and gray matter volumes were then calculated for each child by summing the result of this transformation multiplied by the voxel volume.
Functional Correlation
To investigate the co-development of two longitudinal processes, for example the myelination of two different white matter regions, we calculated the time-dynamic functional or concurrent correlation between the processes. Let X(t) and Y(t), t ∈ T denote two longitudinal white matter developmental processes on which we make occasional measurements, where T denotes the period of interest. Our goal is to obtain the concurrent cross-correlation of the concurrent processes (see for example Ramsay and Silverman, 2005) evaluated at time t, given by
| [1] |
Since only sparse and irregular observations are available, this correlation cannot be estimated cross-sectionally, as each cross-sectional time slice contains only few data (see Fig. 1). We instead applied local kernel smoothing (Müller, 1987; Fan and Gijbels, 1995), with appropriate bandwidth choice for estimating the covariance and variances, which are then plugged into equation [1] for estimating the functional correlation; see Zhou and Wang, 2016, where also theoretical justifications such as consistency results are provided. Technical details about these smoothing methods are included in the Appendix. The implementation FCCor of the estimation procedure for the pairwise functional correlations is available in the R package fdapace (Dai et al, 2018), which can be accessed on CRAN.
We applied functional correlation to investigate the association of concurrent myelination processes in two separate tasks: Task 1. The whole brain white matter MWF and white matter volume; and Task 2. Pairwise MWF in the 23 white matter regions: Body, genu, and splenium of the corpus callosum; bilateral frontal, parietal, occipital, temporal, and cerebellar white matter; bilateral internal capsule, corona radiata, cingulum, and superior longitudinal fasciculus. We limited our consideration to the period when denser measurements are available and thus more stable estimates can be obtained, which is 150 to 1000 days for Task 1, and 150 to 750 days for Task 2. Task 1 was performed to better understand how myelination drives early brain volume growth, as myelin accounts for a sizeable volume fraction of mature white matter (O’Brien and Sampson, 1965), and altered myelination is a hypothesized substrate in the early brain overgrowth observed in autism (Dementieva et al., 2005; Lewis et al., 2013). Task 2 was performed to investigate how regions evolve with age and to determine if anatomically plausible networks can be identified.
Functional Principal Component Analysis (FPCA)
For Task 2, after obtaining the correlation functions we carried out an FPCA on the pairwise correlation functions between different white matter structures. Let Ck(t) denote the correlation function between a pair of the 23 regions, for k = 1,... ,253, since there are distinct pairs. Correlation functions Ck(t) are square integrable random functions and as such have Karhunen-Loève expansions (Grenander, 1950; Müller, 2005; Ramsay and Silverman, 2005; Wang et al., 2016)
| [2] |
where μC(t) = E(Ck(t)) is the mean function, the φj(t) are the orthonormal eigenfunctions of the auto-covariance operator, and the ξjk are the functional principal components (FPCs) with variance λj, for j = 1,2,.... The eigenfunctions φj(t) can be interpreted as the dominant modes of variation (Castro et al., 1986; Jones and Rice, 1992; Wang et al., 2016) in Ck(t), and the FPCs are the corresponding Fourier coefficients of the centered process Ck(t) − μC(t). By using the eigenfunctions φj as basis functions, FPCA leads to the truncated representation for some J < ∞, which is the most parsimonious representation of the processes Ck(t) in the sense that it explains the highest fraction of total variation among all such representations with J components. Further details can be found in the Appendix. In practice FPCA needs to be performed based on the sample of estimated correlation functions , which then leads to the empirical FPCA
| [3] |
where , , and are the empirical estimates of μC, ξjk, and φj, respectively.
Comparing Development in Groups with Differing Maternal Education Levels
As a preliminary and pilot application of the developed methodology, we examined network development in children stratified by their social demographic and economic environment (SES). SES has previously and consistently been linked with changes in brain structure and function (Hackman and Farah, 2009; Gao et al., 2015; Hair et al., 2015; Noble et al., 2015), as well as child cognitive abilities and academic performance (Noble et al. 2004; Sirin, 2005). We chose to use only the maternal education level as a measure reflective of overall SES, which can include numerous factors including educational attainment, family income, housing neighborhood, and social status. Maternal education has been shown to be a relatively stable measure of SES, unlike occupational status (Bornstein et al. 2003), and is not attenuated by single or stay-at-home mothers. Maternal education was measured for each family using the Hollingshead scale (Hollingshead, 1975), with maternal education quantized on a 7-level scale, with 3 = partial high school; 4 = high school graduate; 5 = partial college; 6 = college or university graduate; and 7 = professional degree. Based on maximum achieved maternal education level, children were stratified into either a higher level (>= 6) or lower level (<= 4) group. We compared the dynamic developmental patterns of MWF pairwise correlations between the higher and lower group children by comparing the projection scores of the pairwise correlation functions. The concurrent correlation between the 23 white matter regions were estimated separately for each group only between 150 days and 750 days, because there were fewer observations for the low group between 750 and 1000 days (see Fig. 1).
After obtaining the estimates and of the kth correlation function for the higher and the lower education group, respectively, where k = 1, ...,253, we projected the centered correlation functions onto , for g = hi, lo, j = 1,2, and obtained projection scores . Visualization and comparison of the higher and lower education groups were then based on these projection scores, and , where we visualized the concurrent myelination between regions as defined by the projection scores by constructing connectivity networks, separately for the first two modes of connectivity j = 1,2.
To determine whether there were differences in the co-myelination patterns between children in the higher and lower education groups we used a permutation test. To test whether the distributions of projection scores differed significantly between the two groups, we employed the L2 Wasserstein distance W2(μ, ν) between two probability measures μ and ν as test statistic, defined by , where ∥ · ∥ is the Euclidean norm, and the infimum is taken over all joint measures γ with marginals μ and ν. For distributions on the real line as considered here, it is well known that the L2 Wasserstein distance can be written as , where F and G are the cumulative distribution functions of μ and ν, respectively (Hoeffding, 1940). The p-value of the test was determined from 10,000 permutation samples.
RESULTS
Correlation between White Matter Myelination and White Matter Volume
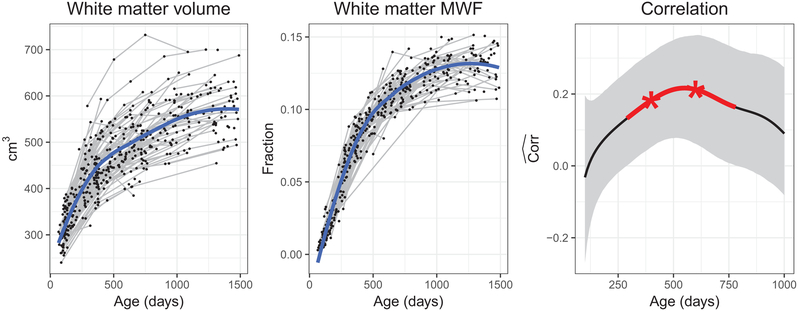
Since myelin represents a significant fraction of total white matter volume, we hypothesized that measures of myelination and white matter volume throughout childhood would be strongly correlated. The longitudinal mean trajectories of white matter myelination and white matter volume, and their concurrent correlation function are shown in Fig. 2. Pointwise significance at the 0.05 level as determined by 10,000 bootstrap samples is indicated in red and adjusted significance in asterisks, where the (conservative) Bonferroni adjustment was performed for multiple testing at 200, 400, 600, 800, and 1000 days. The correlations were found to be overall above zero, increasing until 580 days to around 0.2, and then slightly declining. The correlations between white matter myelination and volume were significantly different from zero at 400 and 600 days after multiple adjustment; unadjusted pointwise significance was observed between 290 days and 780 days. Bootstrap confidence intervals became wider towards 1000 days, as fewer observations were available at older ages. These results suggest that while being an important contributor, myelination is not the sole or perhaps even primary driver of early white matter volume growth.
Fig. 2.
Longitudinal measurements of white matter volume and MWF (left and middle) with overall mean functions (blue), and the concurrent correlation between them throughout early childhood (right). For the last correlation plot, the solid line corresponds to the functional correlation estimate and the light gray band denotes 95% pointwise bootstrap confidence intervals; pointwise significance at 0.05 level is indicated by red line segment and adjustment significance by asterisks
Pairwise Correlation Functions Between White Matter Regions
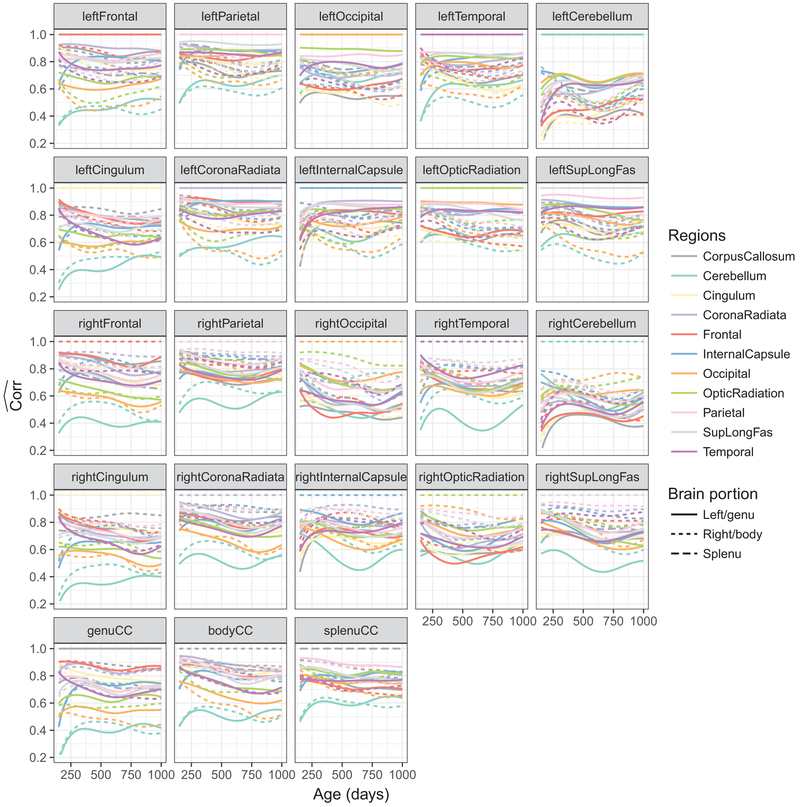
The pairwise correlation function estimates for the (j, l)th subregion are shown in Fig. 3. For better visualization, we show the correlation functions for all pairs j = 1, ...,23 and l = 1, ...,23, although . Each panel of Fig. 3 displays the correlation functions between one white matter region and all other regions, where line type denotes left/right hemisphere or genu/body/splenu corpus callosum, and color denotes brain region.
Fig. 3.
Pairwise functional correlations between different white matter structures for all children. Each panel shows the 23 functional correlations each constructed pairwise between one region (indicated in the panel title) and one of the 23 regions (indicated by color and line type), including the region itself, where the correlation is constant at 1 for all ages
FPCA on Pairwise Correlations
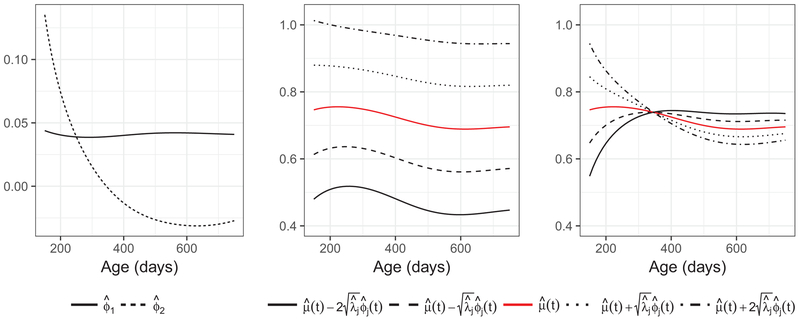
Applying FPCA on the pairwise correlations , in Fig. 4, we highlight the first two eigenfunctions (left panel) and the first two modes of variation (middle and right panels). The eigenfunctions have natural interpretations and serve as the directions on which we then project the correlation functions to obtain projection scores, which are the functional principal components. The first eigenfunction corresponds to the overall strength of correlation/codevelopment, and explains 93.5% of total variation, while the second eigenfunction corresponds to the contrast of correlations earlier and later in the early life period that we studied and accounts for 5.2% of total variation. The second and third plots illustrate the modes of variation by displaying the mean function (red solid) plus or minus 1 or 2 standard deviations times the eigenfunctions. A more detailed explanation for the modes of variation is included in the Appendix.
Fig. 4.
Eigenfunctions (left) and the first (middle) and second (right) modes of variation for pairwise correlation functions. In the middle and the right panels we show the estimates of for k = −2 (solid), −1 (dashed), 0 (red), 1 (dotted), and 2 (dash-dotted). The first mode of variation explains 93.5% of total variation for the pairwise correlation functions and corresponds to the overall magnitude. The second mode of variation accounting for 5.2% of total variation and corresponds to the increase/decrease in correlation over time.
Connectivity Networks
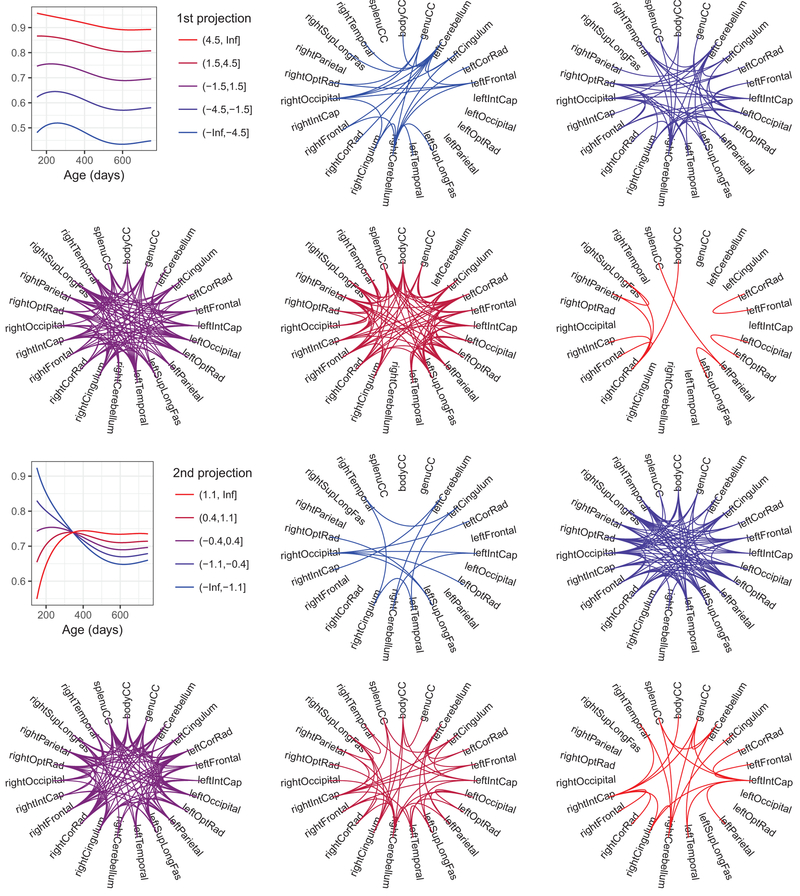
It is of interest to investigate the connectivity network between white matter regions, where the connection is defined by the overall correlation in myelination or the increase/decrease of correlation over time. We separated the observations according to the jth projection scores for j = 1,2, i.e., the first and second functional principal components, into five bins, where the four cut points are defined , , , and ; here is the estimated variance of the jth FPC ξjk as in equation [2]. In the first panels in the first and third rows of Fig. 5 we show the modes of variation μC(t) + x̄ϕj(t) where x̄ is the mean of the jth FPCs in each of the five bins. The remaining panels in Fig. 5 visualize the network of correlation functions with a Circos plot (Zhang, Meltzer, and Davis 2013). A pair of regions is marked as connected in each plot if the FPC of the correlation function falls within the corresponding bin for j = 1,2.
Fig. 5.
The overall magnitude (the first and the second rows) and time-dynamic (the third and the fourth rows) concurrent myelination network for all children. The averages of the correlation functions within each of the five bins (defined in the text) are shown in the first figures of the top and the third rows. The subsequent figures display overall (resp. time-dynamic) concurrent myelination between brain regions, where for each bin we marked as connected a pair of regions if the first (resp. second) projection of the corresponding correlation falls within that bin
Comparing Correlation Functions and Networks in Groups with Differing Maternal Education/SES
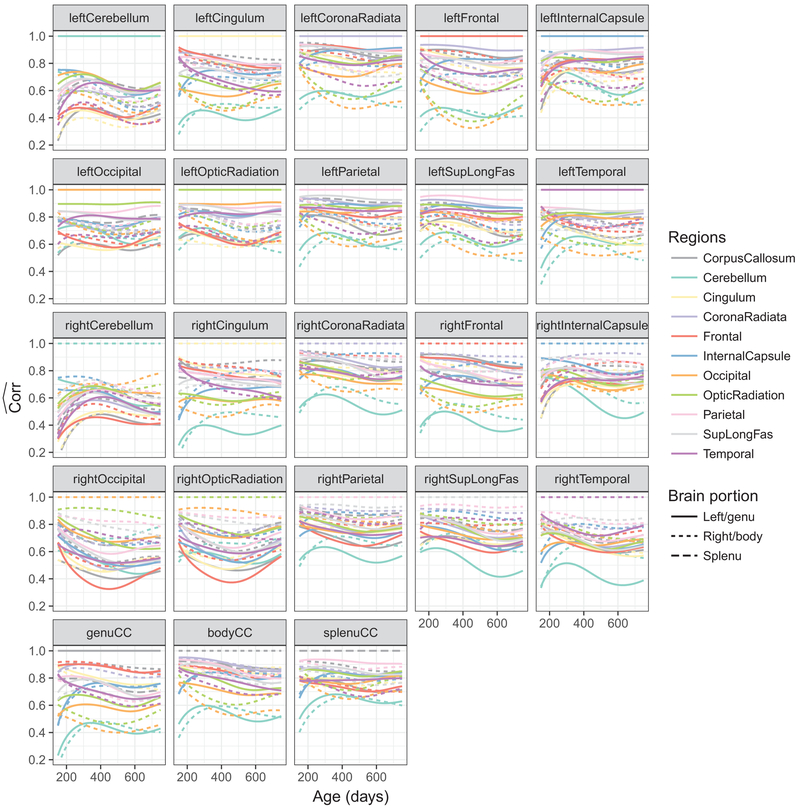
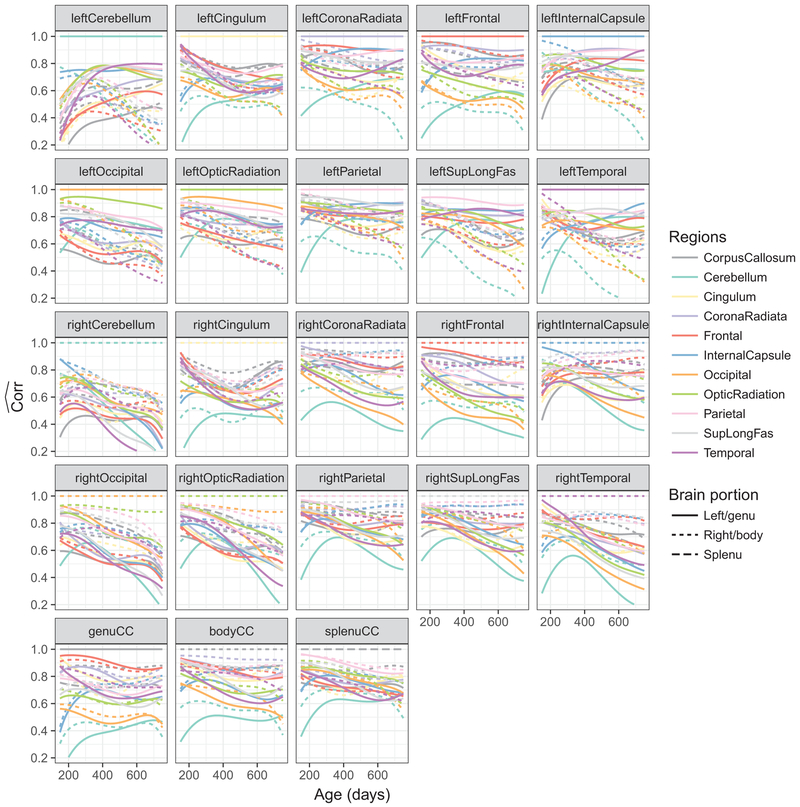
The pairwise correlation functions for the higher and lower maternal education groups were estimated separately and are shown in Fig. 6 and Fig. 7, respectively. It appears the lower education group had smaller overall correlations, especially in bilateral cerebellum, and the correlations tended to decrease with age, in contrast to the higher education group where the correlations overall were relatively stable with age between 350 days and 750 days. For an additional analysis using the HI (Holloingshead 1975) we refer to the Supplement.
Fig. 6.
Pairwise functional correlations between different white matter structures for children with higher maternal education
Fig. 7.
Pairwise functional correlations between different white matter structures for children with lower maternal education
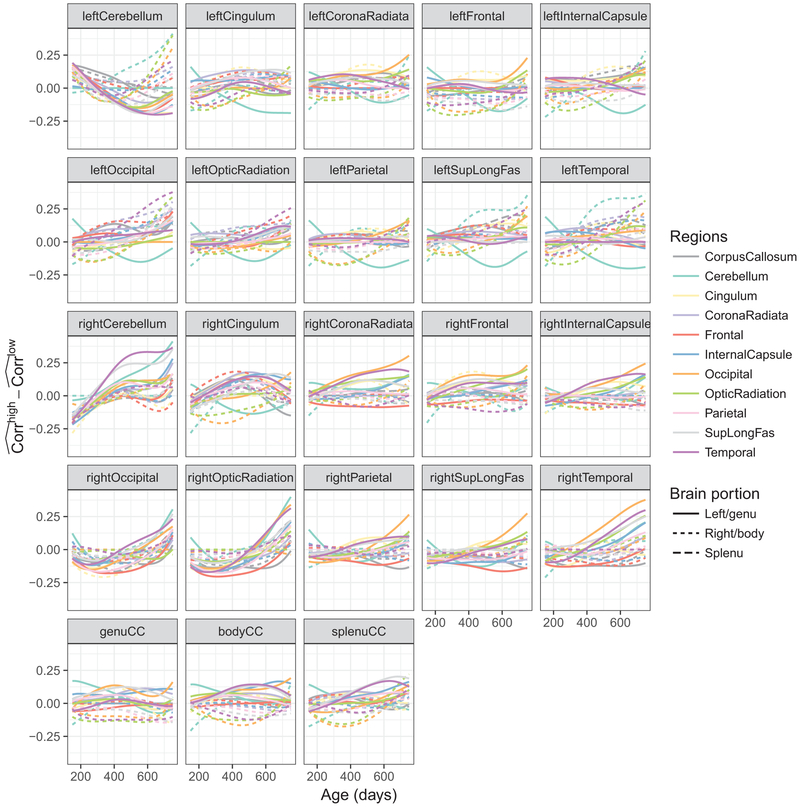
The differences between the pairwise correlation functions in the high and the low groups are shown Fig. 8. These results suggest that the correlations across hemispheres (dashed curves in the 1st and 2nd rows and solid curves in the 3rd and 4th rows) are higher in the later time period for the higher education group than the lower education group. This corresponds to slower decrease in correlation in these areas roughly after 400 days of age. The differences were largest for the bilateral occipital and temporal lobe, cerebellum, optic radiation, and corona radiata; and left superior longitudinal fasciculus. In the higher education group, the overall correlations for the genu, body, and splenu corpus callosum with the left hemisphere were stronger as compared to the lower education group, but those with the right hemisphere were weaker.
Fig. 8.
Differences between the pairwise functional correlations in the higher and lower education groups
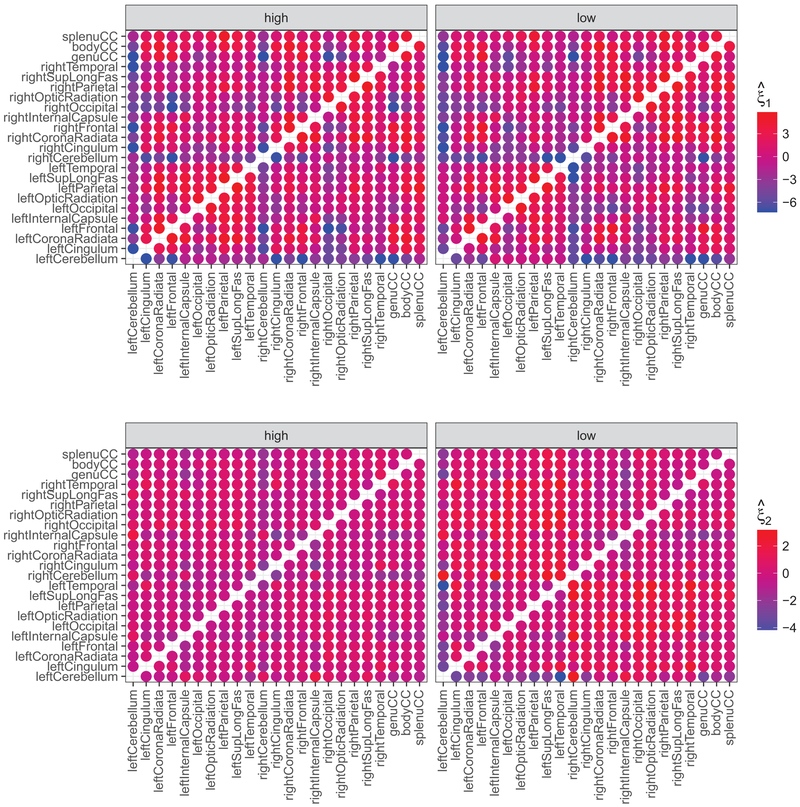
The projection scores for all the correlation functions estimated within each education group are displayed in Fig. 9, where we use color to encode the value of the first and second projection scores. Among other things, Fig. 9 demonstrates that the overall correlation tended to be higher between white matter regions within the same hemisphere than between hemispheres.
Fig. 9.
The first and second projection scores by maternal education (upper: first projection; lower: second projection; left: higher education; right: lower education). Each dot corresponds to a pair of brain regions, while color stands for the values of the projections
The kernel density estimates (Silverman, 1986) of the first and second projections were shown in Fig. S1. The higher and lower education groups had significantly different first projections (p =0.02).
To compare the overall magnitude and time-dynamic connectivity networks for the higher and the lower groups, Fig. S2 and Fig. S3 present the modes of variation and the networks of correlation functions. Differences can be seen in the time-dynamic networks (Fig. S3) between the higher and the lower education groups, especially in the networks of fast increasing correlations (red) and of fast decreasing correlations (blue).
DISCUSSION
The time-dynamic correlation between whole brain white matter myelination and volume as in the third panel of Fig. 2 reveals that their co-development increases beginning 150 days after birth, peaks at 580 days with a correlation equal to 0.2, and then decreases after 580 days. White matter MWF and white matter volume processes reflect myelin development at the population level, and this is demonstrated in Fig. 2, left and middle panels, where the mean development trajectories for both processes follow a similar pattern. While the mean trajectories are well aligned, the observed correlation between white matter MWF and white matter volume processes was found to be relatively small with a value of 0.2. So while the mean trajectories are quite similar, the deviations from the means are not strongly correlated, pointing to substantial variability between individuals. This could be due to additional drivers of white matter volume as discussed below.
To gain additional insights into age-dependent pattern changes, mean white matter and MWF growth patterns are instructive (Fig. 2, left and middle). In general, white matter volume increases logarithmically with age, whilst MWF follows a modified sigmoidal function (Dean et al., 2014b). There is a relatively stronger correlation between white matter volume and MWF during the period where they are both rapidly developing; poor correlation in early infancy (birth to 4 months) when volume is increasing but myelination has yet to begin in earnest; and poor correlation in later childhood / early adolescence when white matter volume continues to increase but myelination has plateaued. As total white matter volume is related not only to myelination, but also axonal density and axonal diameter, it is likely that changes in axonal density and diameter are the primary drivers of volume change in later childhood, a finding which has been noted previously based on diffusion imaging data (Paus, 2010). These additional contributions to white matter volume might explain the relatively low correlations with MWF.
The pairwise functional correlations between different white matter regions, shown in Figs. 3, 6, and 7 reveals that different white matter structures have distinct connectivity profiles with other regions. Bilateral cerebellum shows less overall co-development with other regions; most pairs of regions have decreasing co-myelination, with the cerebellum being a notable exception where the co-myelination with most other regions increases between 150 and 300 days. A reduction in correlation with age between differing sets of regions could reflect ongoing specialization and segregation of neural systems in-line with developing cognitive and behavioral functions.
From past studies exploring functional connectivity changes throughout early childhood, there has been a noted pattern of segregation and integration of networks with age. Globally, this is evidenced by a reduction in overall intra-hemisphere, and increased inter-hemisphere, connectivity (Fair et al., 2007; Gao et al., 2015). Our structural co-variance/connectivity measures support this and provide new insight into associated changes in the underlying brain structure. For example, sets of regions that show increasing correlation with age (Fig. 5) include: 1. Corpus callosum, cerebellum, internal capsule, and parietal regions; and 2. The frontal and temporal lobes. In contrast, regions showing decreasing correlation with age include: 1. Temporal lobes and the cingulum; and 2. Corpus callosum and cerebellum and temporal lobes. These results are consistent with prior functional connectivity network changes from childhood to adult (Vogel et al. 2013), and also align with known brain regions associated with specific skills and abilities that are maturing across the investigated age range. Corpus callosum, cerebellum, internal capsule, and parietal regions, for example, comprise parts of the motor network and, thus, would be expected to have increasing connectivity as fine and gross motor skills improve; Frontal and temporal regions are central to systems involved with language, emotion, and executive functions, which also see substantial improvements across this age range.
Although the cerebellum is involved in varied functional processing, it is predominately associated with motion and spatial processing. The temporal lobe is primary involved in auditory functioning and language processing. Thus, it is not surprising that the development of the cerebellum and the temporal lobes are not significantly correlated. While the cingulum does connect the regions within the frontal and temporal lobes, it is primarily involved in executive functioning, including attention and working memory skills. These again are divergent processes from the auditory processing of the temporal lobe.
Comparing children from the lower and higher maternal education groups, children from the lower group appeared to have more pairs of white matter regions with declining co-myelination and higher variance in the correlations than the higher education group. Regions in the same hemisphere had overall higher levels of co-development than those in different hemispheres, probably due to anatomic proximity.
The eigenfunctions obtained from the FPCA have natural interpretations and serve as the directions on which we project the correlation functions to obtain projection scores. The first eigenfunction corresponds to the overall magnitude of correlation/co-development, and the second eigenfunction corresponds to the contrast of the correlation between earlier and later days of the investigated period. These two major modes of variation can be characterized as size and dynamics, as evidenced from the modes of variation in Fig. S2 and Fig. S3 (left upper panel), so that the observed correlation functions are composed of these two components, characterizing the correlation function for each pair of regions by its size and dynamics. Subsequent analysis concerning the magnitude or time-dynamics of co-development can then be performed based on the projection scores.
The FPCA method had stable performance when applied to the pairwise correlation functions, since the correlations have bounded values with no outliers. The results produced by our FPCA as compared to a robust PCA via projection pursuit algorithm (Croux and Ruiz-Gazen, 2005, see also Bali et al., 2011) were highly similar, where the latter targets directions that maximize median absolute deviation (MAD). The first eigenfunctions and the projection scores (not reported here) were almost identical, while the second eigenfunctions and scores also exhibited a high degree of similarity. The downstream analysis including the construction of networks then also gave similar results.
The permutation test for the first and second projection scores shows that the distribution of the first projection scores is significantly different between the higher and the lower education groups, but the difference in the second projection scores is not found to be significant. Fig. S1 indicates the higher education group tended to have higher overall connectivity and slower decline in connectivity than the low group, perhaps reflecting a more mature and connected brain.
The reason for the insignificant results despite the apparent large difference in the second projections is possibly the small sample size for the lower education group (n = 40) and thus large variation in the second projections. The second projection corresponds to the decrease/increase in the correlation functions over time, which is harder to quantify than the first projection, which corresponds to overall magnitude.
Maternal education has been shown to be the component most associated with the full HI (Bornstein et al. 2003) and to be associated with brain network connectivity (Gao et al. 2015). Although the full HI is available to us, as pointed out by a reviewer, it may suffer from the instability and inaccuracy in the occupational scale. We therefore chose to measure SES by the maternal education scale only, which is also in line with our previous work (Deoni et al. 2013a). Additional analysis with SES levels defined by the full HI is included in the Supplementary Materials, which produced similar results to those defining SES levels by maternal education only, but the first projection scores were no longer significantly different in the higher and lower groups This indicates maternal education may indeed be a better measure of SES than as quantified by HI in the context of brain network development.
CONCLUSION
This work introduces an important methodological framework for investigating concurrent correlations in sparse and irregularly sampled structural imaging data. Using this framework, we investigated the development of structural brain networks throughout childhood based on white matter myelination, though similar analyses could equally be applied to other imaging metrics, including relaxation times and diffusion characteristics. Results are in line with past functional neuroimaging studies, with increasing correlation in associated regions as networks consolidate, and decreasing correlation in dissociated regions. The primary methodological innovations are illustrated with this preliminary investigation, where we demonstrate differential patterns of development in children born to mothers with higher and lower education levels. Lower maternal education level was found to be associated with a less mature and less connected developing brain.
Supplementary Material
ACKNOWLEDGEMENTS
This work was supported by the National Science Foundation (DMS-1407852, DMS-1512975), the National Institutes of Mental Health (R01 MH087510), and the Bill and Melinda Gates Foundation (OPP11002016).
APPENDIX
Estimation of Correlation Functions
The functional correlation corr(X(t), Y(t)) is estimated by the plug in estimator
| [A1] |
We propose to estimate cov(X(t), Y(t)), var(X(t)), and var(Y(t)) separately by kernel local linear smoothing the pooled centered observations, which is detailed as follows. Assume we make observations (tij, Xi,j, Yi,j) at each time tij for subject i = 1,...., n and visit j = 1,... , ni where Xij = X(tij), Yij = Y(tij), n is the number of subjects and ni is the number of measurements per subject.
We first estimate μx(t) ≔ E(X(t)) and μY(t) ≔ E(Y(t)) by kernel local linear smoothing. We define the local linear kernel smoother for μX(t) as by smoothing the pooled observation , where
| [A2] |
h > 0 is the bandwidth, and K(·) is a kernel function. The mean function μY(t) of Y(t) can be estimated similarly by smoothing . Next we obtain the centered observations
for i = 1, ..., n and j = 1,......, ni. Finally, (resp. and is obtained by smoothing (resp. and ) as in [A2]. For all kernel local smoothing we used Gaussian kernel for K(·) with bandwidth h equal to 150 days.
Note that one can write var(X(t)) = E(X2(t)) − μX(t)2 and thus construct another plug-in estimate from by smoothing for and for . This alternative procedure is known to have larger bias than the proposed procedure (see for example Fan and Yao, 1998, Zhang and Wang, 2016) and thus is not used here. An alternative approach is Frechet regression (Petersen et al 2018).
Modes of variation
The modes of variation for functional data was discussed by Castro et al. (1986) and Jones and Rice (1992). Given a random function X(t), we target to summarize its important variability using a few basis functions. Denoting XC(t) = X(t) − μ(t) as the centered process, our goal is to approximate XC(t) by using a few basis functions, where is an orthonormal basis of L2 and the ξj are the jth Fourier coefficients of XC projected onto ψj. Using a suitably defined notion of total variation for functional data, the best J-dimensional approximation to XC(t) in terms of total variation explained is given by the orthonormal basis that solves
| [A3] |
An explicit solution to [A3] is given by the eigenfunctions of G(s, t) = cov(X(s), X(t)). Covariance function G has spectral decomposition
where the λ1 ≥ λ2 ≥ ··· ≥ 0 are the eigenvalues and the φj(t) are the corresponding orthonormal eigenfunction. It is then well known the first J eigenfunctions φ1;,...... φj of the covariance operator G is a solution to [A3], corresponding to the principal modes of variation, and the eigenvalue λj associated with φj quantifies how much variation is explained by the jth eigenfunction. The fraction of total variation explained by the jth eigenfunction is .
REFERENCES
- Bali JL, Boente G, Tyler DE, Wang JL. Robust functional principal components: A projection-pursuit approach. The Annals of Statistics. 2011;39(6):2852–82. [Google Scholar]
- Beckmann CF. Modelling with independent components. Neuroimage. 2012. August;62(2):891–901. [DOI] [PubMed] [Google Scholar]
- Brett M The MNI brain and the Talairach atlas. 1999. [Google Scholar]
- Bornstein MH, Hahn CS, Suwalsky JTD, Haynes OM. Socioeconomic status, parenting, and child development: The Hollingshead Four-Factor Index of Social Status and The Socioeconomic Index of Occupations In Bornstein MH & Bradley RH (Eds.), Socioeconomic status, parenting, and child development. Mahwah, NJ, US: Lawrence Erlbaum Associates Publishers; 2003; 29–82. [Google Scholar]
- Bullmore E, Sporns O. Complex brain networks: Graph theoretical analysis of structural and functional systems. Nat. Rev. Neurosci 2009. [DOI] [PubMed] [Google Scholar]
- Casey BJ, Giedd JN, Thomas KM. Structural and functional brain development and its relation to cognitive development. Biological Psychology. 2000. October;54(1-3):241–57. [DOI] [PubMed] [Google Scholar]
- Castro PE, Lawton WH, Sylvestre EA. Principal modes of variation for processes with continuous sample curves. Technometrics. 1986. November 1;28(4):329–37. [Google Scholar]
- Chevalier N, Kurth S, Doucette MR, Wiseheart M. Myelination is associated with processing speed in early childhood: Preliminary insights. PLoS ONE. 2015. October 6;10(10):e0139897. [DOI] [PMC free article] [PubMed] [Google Scholar]
- Croux C, Ruiz-Gazen A. High breakdown estimators for principal components: the projection-pursuit approach revisited. Journal of Multivariate Analysis. 2005;95(1):206–26. [Google Scholar]
- Dai X, Hadjipantelis PZ, Han K, Ji H, Lin SC, Muller HG, Wang JL. fdapace: Functional data analysis and empirical dynamics. R package version 0.4.0. 2018. https://cran.r-project.org/package=fdapace
- Dean DC III, Dirks H, O’Muircheartaigh J, Walker L, Jerskey BA, Lehman K, et al. Pediatric neuroimaging using magnetic resonance imaging during non-sedated sleep. Pediatr Radiol. Springer Berlin Heidelberg; 2014a;44(1):64–72. [DOI] [PMC free article] [PubMed] [Google Scholar]
- Dean DC, O’Muircheartaigh J, Dirks H, Waskiewicz N, Walker L, Doernberg E, Piryatinsky I, Deoni SC. Characterizing longitudinal white matter development during early childhood. Brain Structure and Function. 2015. July 1;220(4):1921–33. [DOI] [PMC free article] [PubMed] [Google Scholar]
- Dean DC III, O’Muircheartaigh J, Dirks H, Waskiewicz N, Lehman K, Walker L, et al. Modeling healthy male white matter and myelin development: 3 through 60months of age. Neuroimage. 2014b. January;84:742–52. [DOI] [PMC free article] [PubMed] [Google Scholar]
- Dementieva YA, Vance DD, Donnelly SL, Elston LA, Wolpert CM, Ravan SA, DeLong GR, Abramson RK, Wright HH, Cuccaro ML. Accelerated head growth in early development of individuals with autism. Pediatric neurology. 2005. February 28;32(2): 102–8. [DOI] [PubMed] [Google Scholar]
- Deoni SCL, Rutt BK, Arun T. Gleaning multicomponent T1 and T2 information from steady-state imaging data. Magnetic Resonance in Medicine. 2008. December 1;60(6): 1372–87. [DOI] [PubMed] [Google Scholar]
- Deoni SCL. Correction of main and transmit magnetic field (B0 and B1) inhomogeneity effects in multicomponent- driven equilibrium single- pulse observation of T1 and T2. Magnetic Resonance in Medicine. 2011. April 1;65(4): 1021–35. [DOI] [PMC free article] [PubMed] [Google Scholar]
- Deoni SCL, Dean DC III, O’Muircheartaigh J, Dirks H, Jerskey BA. Investigating white matter development in infancy and early childhood using myelin water faction and relaxation time mapping. Neuroimage. 2012. November;63(3): 1038–53. [DOI] [PMC free article] [PubMed] [Google Scholar]
- Deoni SC, Dean III DC, Piryatinsky I, O’Muircheartaigh J, Waskiewicz N, Lehman K, Han M, Dirks H. Breastfeeding and early white matter development: A cross-sectional study. Neuroimage. 2013a. November 15;82:77–86. [DOI] [PMC free article] [PubMed] [Google Scholar]
- Deoni SCL, Matthews L, Kolind SH. One component? Two components? Three? The effect of including a nonexchanging “free” water component in multicomponent driven equilibrium single pulse observation of T1 and T2. Magn Reson Med. 2013b. July;70(1): 147–54. PMCID: 3711852 [DOI] [PMC free article] [PubMed] [Google Scholar]
- Deoni SCL, O’Muircheartaigh J, Elison JT, Walker L, Doernberg E, Waskiewicz N, Dirks H, Piryatinsky I, Dean DC III, Jumbe NL. White matter maturation profiles through early childhood predict general cognitive ability. Brain Structure and Function. 2016. March 1;221(2):1189–203. [DOI] [PMC free article] [PubMed] [Google Scholar]
- Durston S, Casey BJ. What have we learned about cognitive development from neuroimaging? Neuropsychologia. 2006. January;44(11):2149–57. [DOI] [PubMed] [Google Scholar]
- Fair DA, Dosenbach NUF, Church JA, Cohen AL, Brahmbhatt S, Miezin FM, et al. Development of distinct control networks through segregation and integration. PNAS. 2007. August 14;104(33): 13507–12. PMCID: PMC194003317679691 [Google Scholar]
- Fair DA, Nigg JT, Iyer S, Bathula D, Mills KL, Dosenbach NUF, et al. Distinct neural signatures detected for ADHD subtypes after controlling for micro-movements in resting state functional connectivity MRI data. Front Syst Neurosci. 2012;6:80. PMCID: PMC3563110 [DOI] [PMC free article] [PubMed] [Google Scholar]
- Fan J, Gijbels I. Local Polynomial Modelling and Its Applications: Monographs on Statistics and Applied Probability 66 CRC Press; 1996. March 1. [Google Scholar]
- Fan J, Yao Q. Efficient estimation of conditional variance functions in stochastic regression. Biometrika. 1998. September 1:645–60. [Google Scholar]
- Fornito A, Zalesky A, Pantelis C, Bullmore ET. Schizophrenia, neuroimaging and connectomics. Neuroimage. 2012. October 1;62(4):2296–314. [DOI] [PubMed] [Google Scholar]
- Gao W, Alcauter S, Elton A, Hernandez-Castillo CR, Smith JK, Ramirez J, et al. Functional network development during the first year: Relative sequence and socioeconomic correlations. Cerebral Cortex. 2015. September;25(9):2919–28. PMCID: PMC4537436 [DOI] [PMC free article] [PubMed] [Google Scholar]
- Hackman DA, Farah MJ. Socioeconomic status and the developing brain. Trends in Cognitive Sciences. 2009. February;13(2):65–73. PMCID: PMC3575682 [DOI] [PMC free article] [PubMed] [Google Scholar]
- Grenander U Stochastic processes and statistical inference. Arkiv för matematik. 1950. October 1;1(3): 195–277. [Google Scholar]
- Hair NL, Hanson JL, Wolfe BL, Pollak SD. Association of child poverty, brain development, and academic achievement. JAMA Pediatr. 2015. September;169(9):822–9. PMCID: PMC4687959 [DOI] [PMC free article] [PubMed] [Google Scholar]
- Hensch TK, Bilimoria PM. Re-opening windows: Manipulating critical periods for brain development. Cerebrum. 2012. July;2012:11. PMCID: PMC3574806 [PMC free article] [PubMed] [Google Scholar]
- Hoeffding Wassily. Masstabinvariante korrelationstheorie. Schriften Des Mathematischen Instituts Und Des Instituts Fur Angewandte Mathematik Der Universitat Berlin. 1940;5:181–233. [Google Scholar]
- Hollingshead AB. Four factor index of social status. 1975. [Google Scholar]
- Jenkinson M, Bannister P, Brady M, Smith S. Improved optimization for the robust and accurate linear registration and motion correction of brain images. Neuroimage. 2002. October;17(2):825–41. [DOI] [PubMed] [Google Scholar]
- Johnson MH. Functional brain development in humans. Nat. Rev. Neurosci 2001. [DOI] [PubMed] [Google Scholar]
- Jones MC, Rice JA. Displaying the important features of large collections of similar curves. The American Statistician. 1992. May 1;46(2): 140–5. [Google Scholar]
- Kolind SH, Matthews L, Johansen-Berg H, Leite MI, Williams SCR, Deoni S, Palace J. Myelin water imaging reflects clinical variability in multiple sclerosis. Neuroimage. 2012; 60:263–270. [DOI] [PMC free article] [PubMed] [Google Scholar]
- Lewis JD, Theilmann RJ, Townsend J, Evans AC. Network efficiency in autism spectrum disorder and its relation to brain overgrowth. 2013. [DOI] [PMC free article] [PubMed] [Google Scholar]
- MacKay AL, Vavasour IM, Rouscher A, Kolind SH, Madler B, Moore GR, Traboulsee AL, Li DK, Laule C. MR Relaxation in Multiple Sclerosis. Neuroimaging Clin. 2009; 19:1–26 [DOI] [PubMed] [Google Scholar]
- Marín O Developmental timing and critical windows for the treatment of psychiatric disorders. Nat. Med. 2016. November;22(11): 1229–38. [DOI] [PubMed] [Google Scholar]
- Mori S, Oishi K, Jiang H, Jiang L, Li X, Akhter K, et al. Stereotaxic white matter atlas based on diffusion tensor imaging in an ICBM template. Neuroimage. 2008. [DOI] [PMC free article] [PubMed] [Google Scholar]
- Müllen EM. Mullen scales of early learning. 1995. [Google Scholar]
- Muller HG. Weighted local regression and kernel methods for nonparametric curve fitting. Journal of the American Statistical Association. 1987. March 1;82(397):231–8. [Google Scholar]
- Müller HG. Functional modelling and classification of longitudinal data. Scandinavian Journal of Statistics. 2005. June 1;32(2):223–40. [Google Scholar]
- Nagy Z, Westerberg H, Klingberg T. Maturation of white matter is associated with the development of cognitive functions during childhood. J Cogn Neurosci. 2004. September;16(7): 1227–33. PMCID: 15453975 [DOI] [PubMed] [Google Scholar]
- Noble KG, Houston SM, Brito NH, Bartsch H, Kan E, Kuperman JM, et al. Family income, parental education and brain structure in children and adolescents. Nature Neuroscience. 2015. May;18(5):773–8. PMCID: PMC4414816 [DOI] [PMC free article] [PubMed] [Google Scholar]
- Noble KG, Norman MF, Farah MJ. Neurocognitive correlates of socioeconomic status in kindergarten children. Develop. Sci 2005; 8:74–87 [DOI] [PubMed] [Google Scholar]
- O’Brien JS, Sampson EF. Lipid composition of the normal human brain: Gray matter, white matter, and myelin. J. Lipid Res 1965. October 1;6(4):537–44. [PubMed] [Google Scholar]
- O’Muircheartaigh J, Dean DC, Ginestet CE, Walker L, Waskiewicz N, Lehman K, Dirks H, Piryatinsky I, Deoni SC. White matter development and early cognition in babies and toddlers. Human brain mapping. 2014. September 1;35(9):4475–87. [DOI] [PMC free article] [PubMed] [Google Scholar]
- Paus T Growth of white matter in the adolescent brain: Myelin or axon? Brain Cogn. 2010. February;72(1):26–35. [DOI] [PubMed] [Google Scholar]
- Petersen A, Deoni S, Muller HG Frechet estimation of time-varying covariance matrices from sparse data, with application to the regional co-evolution of myelination in the developing brain. Annals of Applied Statistics. 2018 [Google Scholar]
- Ramsay JO, Silverman BW. Functional Data Analysis. Second Ed. Springer; 2005 [Google Scholar]
- Raschle N, Zuk J, Ortiz -Mantilla S, Sliva DD, Franceschi A, Grant PE, Benasich AA, Gaab N.Pediatric neuroimaging in early childhood and infancy: Challenges and practical guidelines. Annals of the New York Academy of Sciences. 2012. April 1;1252(1):43–50. [DOI] [PMC free article] [PubMed] [Google Scholar]
- Shaw P, Greenstein D, Lerch J, Clasen L, Lenroot R, Gogtay N, et al. Intellectual ability and cortical development in children and adolescents. Nature. 2006. March 30;440(7084):676–9. PMCID: 16572172 [DOI] [PubMed] [Google Scholar]
- Shaw P, Lalonde F, Lepage C, Rabin C, Eckstrand K, Sharp W, et al. Development of cortical asymmetry in typically developing children and its disruption in attention - deficit/hyperactivity disorder. Arch. Gen. Psychiatry. 2009. August;66(8):888–96. PMCID: PMC2948210 [DOI] [PMC free article] [PubMed] [Google Scholar]
- Silverman BW. Density Estimation for Statistics and Data Analysis. London: Chapman & Hall; 1986. [Google Scholar]
- Sirin SR. Socioeconomic status and academic achievement: A meta-analytic review of research. Rev. Edu. Research. 2005; 75: 417–453. [Google Scholar]
- Smith SM. Fast robust automated brain extraction. Human Brain Mapping. 2002. November 1;17(3):143–55. [DOI] [PMC free article] [PubMed] [Google Scholar]
- Smith SM, Vidaurre D, Beckmann CF, Glasser MF, Jenkinson M, Miller KL, et al. Functional connectomics from resting-state fMRI. Trends in Cognitive Sciences. 2013. December;17(12):666–82. PMCID: PMC4004765 [DOI] [PMC free article] [PubMed] [Google Scholar]
- Sokolov AA, Erb M, Grodd W, Pavlova MA. Structural loop between the cerebellum and the superior temporal sulcus: Evidence from diffusion tensor imaging. Cerebral Cortex. 2014. March;24(3):626–32. [DOI] [PubMed] [Google Scholar]
- Supekar K, Uddin LQ, Prater K, Amin H, Greicius MD. Development of functional and structural connectivity within the default mode network in young children. Neuroimage. 2010. [DOI] [PMC free article] [PubMed] [Google Scholar]
- Uddin LQ, Supekar K, Menon V. Typical and atypical development of functional human brain networks: Insights from resting-state FMRI. Front Syst Neurosci. 2010;4:21. PMCID: PMC2889680 [DOI] [PMC free article] [PubMed] [Google Scholar]
- van der Knaap MS, Valk J, Bakker CJ, Schooneveld M, Faber JA, Willemse J, et al. Myelination as an expression of the functional maturity of the brain. Developmental Medicine & Child Neurology. 1991. October;33(10):849–57. PMCID: 1743407 [DOI] [PubMed] [Google Scholar]
- Vogel AC, Power JD, Petersen SE, Schlaggar BL. Development of the Brain’s Functional Network Architecture. Neuropsychol. Rev 2010; 20(4):362–75 [DOI] [PMC free article] [PubMed] [Google Scholar]
- Wang JL, Chiou JM, Müller HG. Review of functional data analysis. Annual Review of Statistics and Its Application. 2016. 3: 257–295. [Google Scholar]
- Wang J, Zuo X, He Y. Graph-based network analysis of resting-state functional MRI. Frontiers in systems neuroscience. 2010. June 7;4:16. [DOI] [PMC free article] [PubMed] [Google Scholar]
- Wolff JJ, Gu H, Gerig G, Elison JT, Styner M, Gouttard S, et al. Differences in white matter fiber tract development present from 6 to 24 months in infants with autism. Am J Psychiatry. 2012. June;169(6):589–600. PMCID: 3377782 [DOI] [PMC free article] [PubMed] [Google Scholar]
- Wood TC, Simmons C, Hurley SA, Wernon AC, Torres J, Dell’Acqua F, Williams SCR, Cash D. Whole Brain Ex-Vivo Quantitative MRI of the Cuprizone Mouse Model. Peer J. 2016:w2632. [DOI] [PMC free article] [PubMed] [Google Scholar]
- Yakovlev PI, Lecours AR. The myelogenetic cycles of regional maturation of the brain, Minkowski A, Regional development of the brain in early life, 1967, 3–70. Blackwell. [Google Scholar]
- Zatorre RJ, Fields RD, Johansen-Berg H. Plasticity in gray and white: Neuroimaging changes in brain structure during learning. Nature Neuroscience. Nature Publishing Group; 2012. April 1;15(4):528–36. PMCID: PMC3660656 [DOI] [PMC free article] [PubMed] [Google Scholar]
- Zhang Y, Brady M, Smith S. Segmentation of brain MR images through a hidden Markov random field model and the expectation-maximization algorithm. IEEE Trans Med Imaging. 2001;20(1):45–57. [DOI] [PubMed] [Google Scholar]
- Zhang H, Meltzer P, Davis S. RCircos: An R package for Circos 2D track plots. BMC bioinformatics. 2013. August 10;14(1):244. [DOI] [PMC free article] [PubMed] [Google Scholar]
- Zhang X, Wang JL. From sparse to dense functional data and beyond. The Annals of Statistics. 2016;44(5):2281–321. [Google Scholar]
- Zhou Y, Lin SC, Wang JL. Local and global temporal correlations for longitudinal data. Journal of Multivariate Analysis. 2018. In Press. [Google Scholar]
Associated Data
This section collects any data citations, data availability statements, or supplementary materials included in this article.


