

Abstract
A defining feature of adaptive immunity is the development of long-lived memory T cells to curtail infection. Recent studies have identified a unique stem-like T cell subset in exhausted CD8+ T cells in chronic infection1–3, but it remains unclear whether CD4+ T cell subsets with similar features exist in chronic inflammatory conditions. Among helper T cells, TH17 cells play prominent roles in autoimmunity and tissue inflammation and are characterized by inherent plasticity4–7, although the regulation of plasticity is poorly understood. Here we demonstrate that TH17 cells in autoimmune disease are functionally and metabolically heterogeneous and contain a subset with stemness-associated features but lower anabolic metabolism, and a reciprocal subset with higher metabolic activity that supports the transdifferentiation into TH1 cells. These two TH17 cell subsets are defined by selective expression of transcription factors TCF-1 and T-bet, and discrete CD27 expression levels. Moreover, we identify mTORC1 signaling as a central regulator to orchestrate TH17 cell fates by coordinating metabolic and transcriptional programs. TH17 cells with disrupted mTORC1 or anabolic metabolism fail to induce autoimmune neuroinflammation or develop into TH1-like cells, but instead upregulate TCF-1 expression and activity and acquire stemness-associated features. Single cell RNA-sequencing and experimental validation reveal heterogeneity in fate-mapped TH17 cells, and a developmental arrest in the TH1 transdifferentiation trajectory upon mTORC1 deletion or metabolic perturbation. Our results establish that the dichotomy of stemness and effector function underlies the heterogeneous TH17 responses and autoimmune pathogenesis, and point to previously unappreciated metabolic control of helper T cell plasticity.
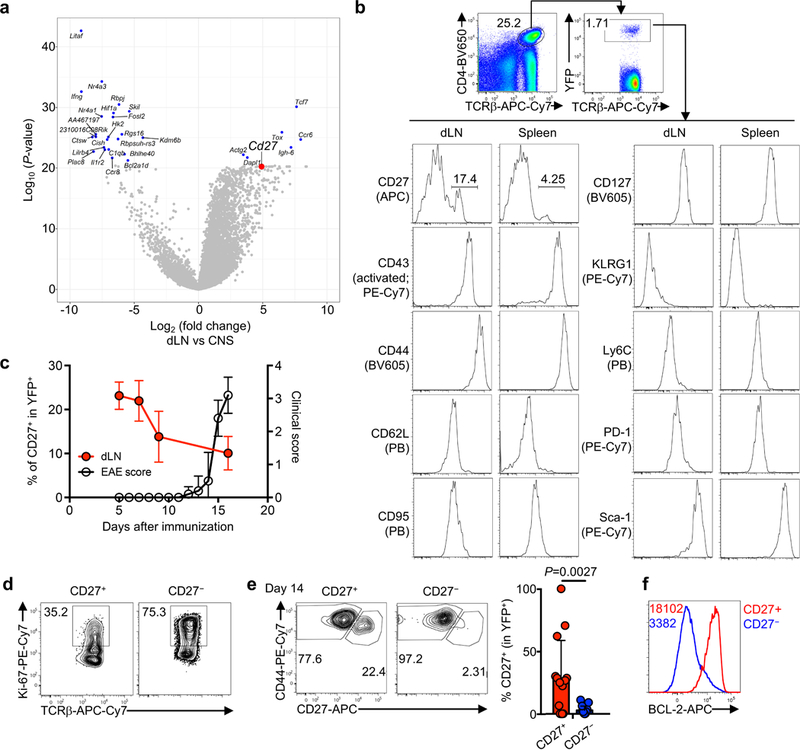
We hypothesized that TH17 cells in autoimmune microenvironments are heterogeneous and consist of sub-populations with differential extent of lineage stability and plasticity. In the transcriptome of TH17 cells from experimental autoimmune encephalomyelitis (EAE)8, Cd279 was highly expressed in cells from draining lymph nodes (dLN) relative to CNS (Extended Data Fig. 1a). We employed a fate-mapping system by crossing Il17aCre mice with R26ReYFP reporter to permanently mark cells that had expressed IL-17 (YFP+)6. Following immunization with myelin oligodendrocyte glycoprotein peptide (MOG), CD27 showed a unique bimodal expression, with distinct CD27+ and CD27– fractions observed (Extended Data Fig. 1b). With progression of EAE, the CD27+ subset in YFP+ TH17 cells was diminished in proportion initially and then stabilized (Extended Data Fig. 1c), and at the peak of disease, mainly detected in lymphoid tissues (dLN and spleen) but not spinal cord (Fig. 1a). In YFP+ TH17 cells from mice at day 9 post-immunization (used throughout the study, unless otherwise noted), CD27+ fraction expressed decreased IL-17, IFNγ (Fig. 1b) and proliferative marker Ki-67 (Extended Data Fig. 1d). After ex vivo MOG stimulation, CD27+ cells proliferated and converted into CD27– cells, while CD27– cells remained negative for CD27 expression (Fig. 1c). When transferred into naïve hosts, a fraction of CD27+ cells developed into CD27− cells, while CD27−YFP+ cells remained CD27− (Extended Data Fig. 1e). Moreover, CD27+ cells expressed high levels of TCF-1 and BCL-2 (Fig. 1d, Extended Data Fig. 1f), factors mediating CD8+ T cell memory10,11, and showed in vivo persistence upon transfer into Rag1–/– recipients (Fig. 1e). Therefore, CD27+ cells are characterized by in vivo quiescence and persistence, and the ability of differentiation into CD27− cells.
Figure 1. CD27+ TH17 cells have memory-like features and low metabolic activity.
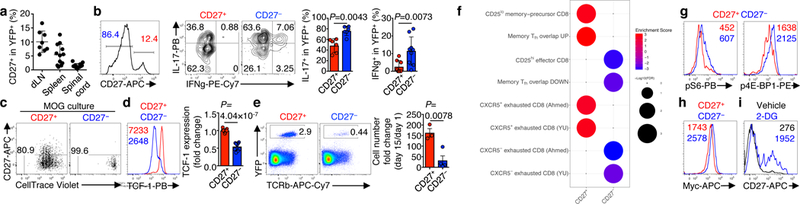
a, Summary of CD27 expression on CD4+TCRβ+YFP+ cells at day 16 post MOG-immunization in draining lymph nodes (dLN), spleen, and spinal cord of Il17aCre (R26ReYFP) mice (n = 8, dLN; n = 12, spleen and spinal cord). b–i, Analysis of CD27+ and CD27− YFP+ populations (b, left) from Il17aCre (R26ReYFP) mice at day 9 post MOG-immunization. b, IL-17 and IFNγ expression (n = 6, CD27+/CD27− IL-17; n = 8, CD27+ IFNγ; n = 9, CD27− IFNγ). c, In vitro culture with MOG for analyses of proliferation (CellTrace) and CD27 expression. d, TCF-1 expression (left) and fold change (right, expression in CD27+ population was set to 1) (n = 9). e, CD27+ or CD27− YFP+ cells were transferred into Rag1−/− mice, and analyzed at day 15 for donor cell percentages (left) and numbers (right, normalized against cell numbers at day 1) (n = 3, CD27+; n = 4, CD27−). f, GSEA using gene sets related to T cell memory from acute (top 4 panels) and chronic (bottom 4 panels) infection. g, h, Flow cytometry of phosphorylated S6 and 4E-BP1 (g) and Myc (h). i, CD27 expression on CD4+TCRβ+YFP+ cells stimulated with MOG and vehicle or 2-deoxyglucose (2-DG). Numbers within histograms represent mean fluorescence intensities. Data are means ± s.e.m; Mann-Whitney U test (two-sided) in b, Student’s t-test (two-sided) in d, e. Data are representative of three (a, e, g, i), four (b–d), one (f), or two (h) independent experiments. FDR, false discovery rate.
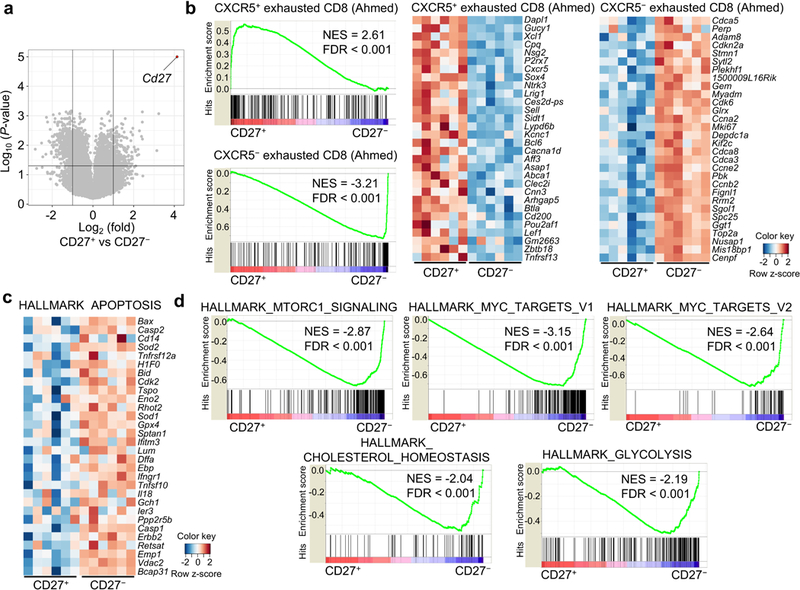
To explore underlying cellular and functional processes, we performed transcriptome analysis of CD27+ and CD27– cells (Extended Data Fig. 2a). Gene set enrichment analysis (GSEA) using effector and memory-precursor CD8+ T cell signatures12 and CD8+ memory and TFH overlapping signatures13 inferred that CD27+ subset was highly enriched for memory-associated signatures, while CD27– subset enriched for genes related to effector cells or downregulated in memory cells (Fig. 1f, Extended Data Fig. 2b). Additionally, the transcriptome of CD27+ and CD27– TH17 cells showed highly significant similarity with that of memory-like CXCR5+ and CXCR5– subsets of exhausted CD8+ T cells1–3, respectively (Fig. 1f, Extended Data Fig. 2b). In GSEA using “Hallmark” gene sets, CD27– subset showed enrichment for hallmarks of apoptosis (Extended Data Fig. 2c), and moreover, mTORC1 and Myc signaling and metabolic pathways including glycolysis and cholesterol homeostasis (Extended Data Fig. 2d). Consistent with these results, mTORC1 activity and Myc expression were higher in CD27– compared to CD27+ TH17 cells (Fig. 1g, h). Moreover, blocking glycolysis via 2-deoxyglucose (2-DG) increased CD27 expression on YFP+ cells (Fig. 1i), indicating stabilization of the CD27+ TH17 phenotype. Overall, TH17 cells are heterogeneous and consist of two sub-populations, with the CD27+ subset showing memory-like features and metabolic quiescence.
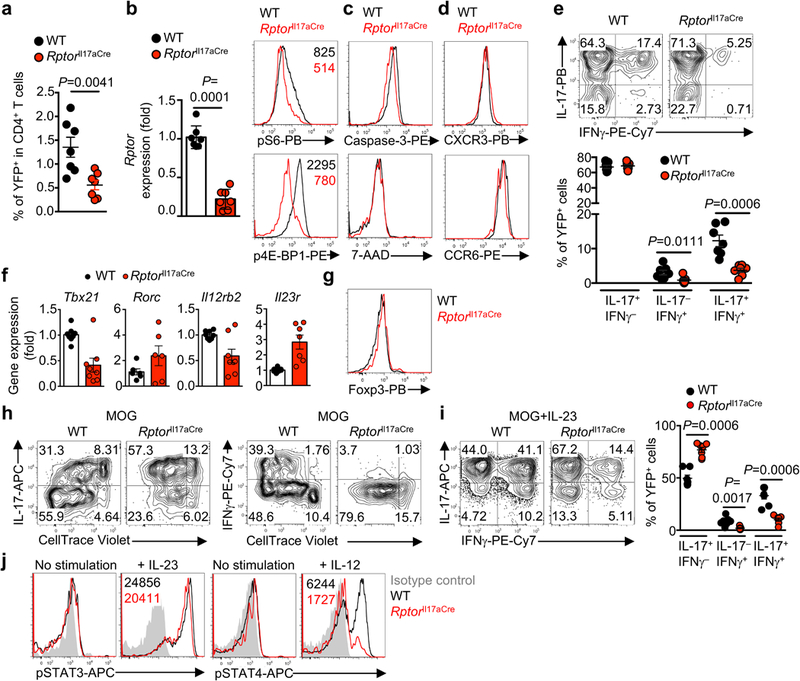
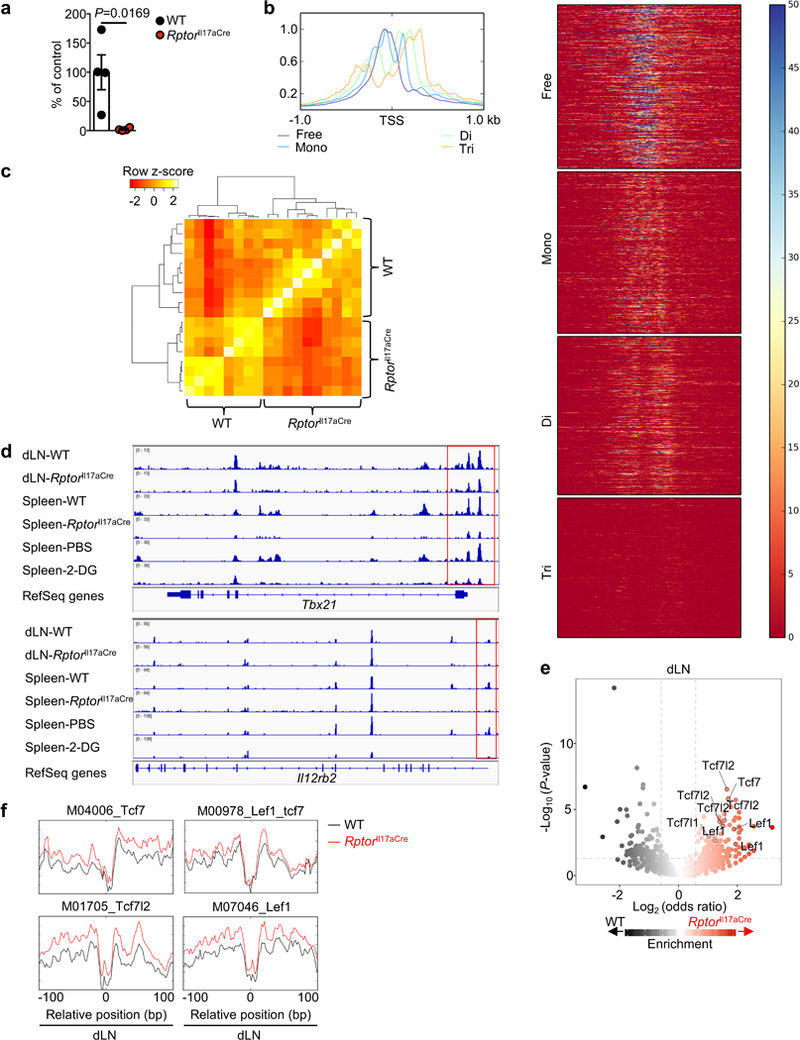
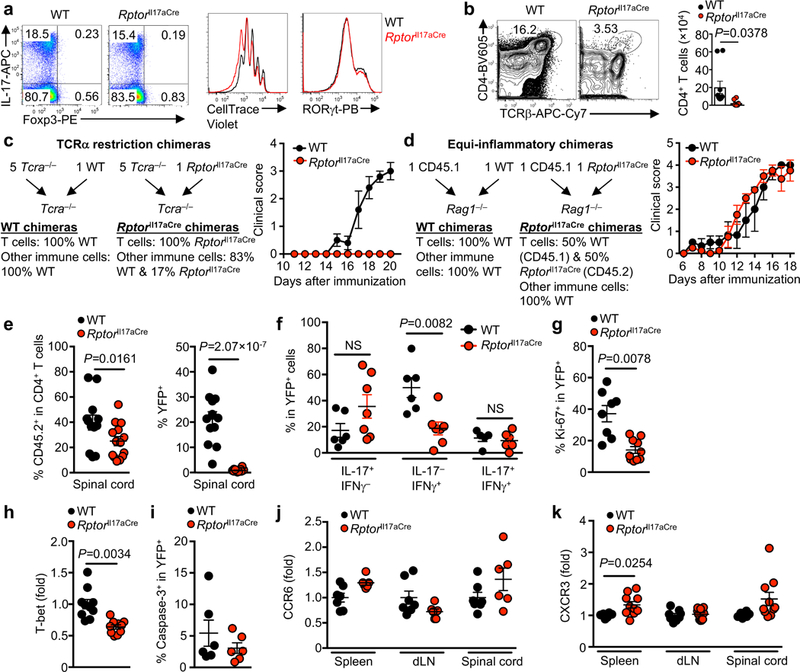
Emerging studies highlight the importance of metabolic reprogramming for T cell activation and differentiation14, but metabolic control of cellular plasticity is unclear. We therefore determined the effects of blocking mTORC1 activity by deleting the signature component Raptor (encoded by Rptor) via Il17aCre and R26ReYFP system6 on TH17 heterogeneity and plasticity. Naïve T cells from wild-type (WT) and RptorIl17aCre mice showed comparable proliferation and TH17 differentiation (Extended Data Fig. 3a). However, Rptorll17aCre mice were protected from MOG-induced EAE (Fig. 2a) associated with the absence of CNS inflammation and T cell infiltration (Fig. 2b, Extended Data Fig. 3b). Raptor-deficient YFP+ cells from CNS upregulated IL-17 but were defective to express IFNγ (Fig. 2c). Thus, mTORC1 function, beyond initial TH17 differentiation, is crucial for EAE and robust IFNγ expression.
Figure 2. Deletion of Raptor in TH17 cells diminishes autoimmune pathogenesis and transdifferentiation into TH1-like cells.
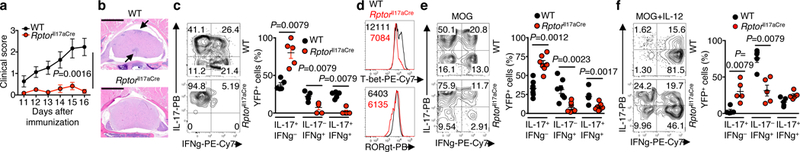
WT and RptorIl17aCre (R26ReYFP) mice were immunized with MOG. a, Clinical scores (n = 15, WT; n = 12, RptorIl17aCre). b, Histopathology of spinal cord sections at day 16 post-immunization. Bar = 1 mm; arrows indicate lesions. c, Flow cytometry analysis (left) and summary (right) of cytokine expression within YFP+ cells from spinal cord at day 16 post-immunization (n = 5 per genotype). d, T-bet and RORγt expression in YFP+ cells from draining lymph nodes (dLN) at day 9 post-immunization. e, f, Cytokine production by YFP+ cells from dLN after 4 days of stimulation with MOG (e) (n = 7 per genotype) or MOG+IL-12 (f) (n = 5 per genotype). Numbers within histograms represent mean fluorescence intensities. Data are means ± s.e.m; two-way ANOVA in a; Mann-Whitney U test (two-sided) in c, e, f. Data are pooled from three experiments (a), or representative of three (b–d), seven (e), or five (f) independent experiments.
Because IL-17 can be produced by cells other than TH17 cells, we constructed mixed bone marrow (BM) chimeras to restrict Raptor deficiency to αβ TH17 cells (Extended Data Fig. 3c). RptorIl17aCre-derived chimeras were resistant to EAE (Extended Data Fig. 3c), indicating the role of mTORC1 in TH17 cells selectively. Additionally, to exclude the effects of absent inflammation in RptorIl17aCre mice, we generated mixed chimeras using CD45.2+ RptorIl17aCre (or WT control) and CD45.1+ WT BM-derived cells, which would mediate CNS inflammation in EAE (Extended Data Fig. 3d). Following MOG immunization, Raptor-deficient cells showed reduced cellularity in CNS, with a preferential loss of IL-17–IFNγ+ cells (Extended Data Fig. 3e, f). Raptor-deficient cells also had reduced expression of Ki-67 and T-bet but normal survival and CCR6 and CXCR3 expression (Extended Data Fig. 3`g–k). These results identify an intrinsic requirement for mTORC1 in mediating IFNγ production and sustaining TH17 responses at the site of inflammation.
In dLN from MOG-immunized RptorIl17aCre (R26ReYFP) mice, we found a modestly lower percentage of YFP+ cells, which showed efficient Rptor deletion and diminished mTORC1 activity (Extended Data Fig. 4a, b). Raptor-deficient YFP+ cells exhibited normal survival, chemokine receptors, and IL-17 expression, but produced less IFNγ (Extended Data Fig. 4c−e). Also, Raptor-deficient cells had reduced expression of T-bet, Tbx21 and Il12rb2, normal RORγt and Foxp3, and elevated Rorc and Il23r (Fig. 2d, Extended Data Fig. 4f, g). Thus, loss of Raptor in TH17 cells impairs expression of TH1-associated factors. Moreover, in response to ex vivo MOG stimulation, Raptor-deficient TH17 cells produced much less IFNγ and modestly increased IL-17 (Fig. 2e), with largely unaffected proliferation (Extended Data Fig. 4h). Addition of IL-12 converted many IL-17-producing cells into IL-17–IFNγ+ cells, but Raptor-deficient cells were less capable of such conversion or transdifferentiation (Fig. 2f). Conversely, IL-23 induced a predominant IL-17+IFNγ+ population in a Raptor-dependent manner (Extended Data Fig. 4i). Whereas both cytokines induced IFNγ expression, IL-23 but not IL-12 maintained IL-17 expression, suggesting a more complete TH1 transdifferentiation induced by IL-12. Furthermore, Raptor-deficient cells were impaired to mediate IL-12-induced STAT4 phosphorylation, with only a small defect in IL-23-induced STAT3 phosphorylation (Extended Data Fig. 4j). Altogether, mTORC1 facilitates transdifferentiation of TH17 cells into IFNγ-producing cells with TH1-like features after antigen stimulation, which can be intensified by cytokine signals from IL-12 and, to a lesser extent, IL-23.
Transcriptome and functional enrichment analyses of Raptor-deficient TH17 cells identified the acetylation and cholesterol biosynthesis pathways as among the most significantly downregulated pathways (Extended Data Fig. 5a). mTORC1 signaling, Myc targets, and metabolic pathways were also attenuated (Extended Data Fig. 5b). Moreover, Raptor-deficient and CD27+ (vs CD27−) TH17 cells shared downregulated metabolic pathways, including Myc, mTORC1, and nucleotide metabolism (Extended Data Fig. 5c, d), and upregulated and downregulated expression changes in CD27+ TH17 cells were positively correlated with those of Raptor-deficient and WT cells, respectively (Extended Data Fig. 5e). In further support of mTORC1 as a differentiating feature of CD27+ and CD27− cells, Cd27 expression was upregulated in Raptor-deficient cells (Extended Data Fig. 5f). We next used Ingenuity Pathway Analysis (IPA) to identify transcription factors mediating mTORC1 function, and identified downregulation of Myc, SREBPs, and STATs in Raptor-deficient TH17 (Extended Data Fig. 6a). Flow cytometry validated lower Myc expression in Raptor-deficient cells (Extended Data Fig. 6b). To explore metabolic dependence of TH17 fates, we used the Il17aCre and R26ReYFP systems to delete Myc (Extended Data Fig. 6c, d) or Hmgcr, a SREBP-dependent rate-limiting enzyme for cholesterol biosynthesis (Extended Data Fig. 6e, f). TH17 cells from these mice largely phenocopied Raptor-deficient cells, including reduced Tbx21 and Il12rb2 expression (Extended Data Fig. 6c, e), and impaired ability to transdifferentiate into IFNγ+ cells (Extended Data Fig. 6d, f). Moreover, deletion of Myc, Hmgcr or Rptor, all upregulated expression of CD27 on TH17 cells (Extended Data Fig. 6g). Finally, to gain insight into mTORC1 downstream pathways, we used inhibitors for the S6K and 4E-BP branches. Drugs targeting 4E-BP but not S6K signaling impaired the transition of TH17 cells into IFNγ-producing cells, although both pathways contributed to cell proliferation (Extended Data Fig. 6h, i). Altogether, our transcriptome and functional perturbation studies indicate that interplay between mTORC1 signaling, especially the 4E-BP branch, and metabolic reprogramming controls TH17 plasticity.
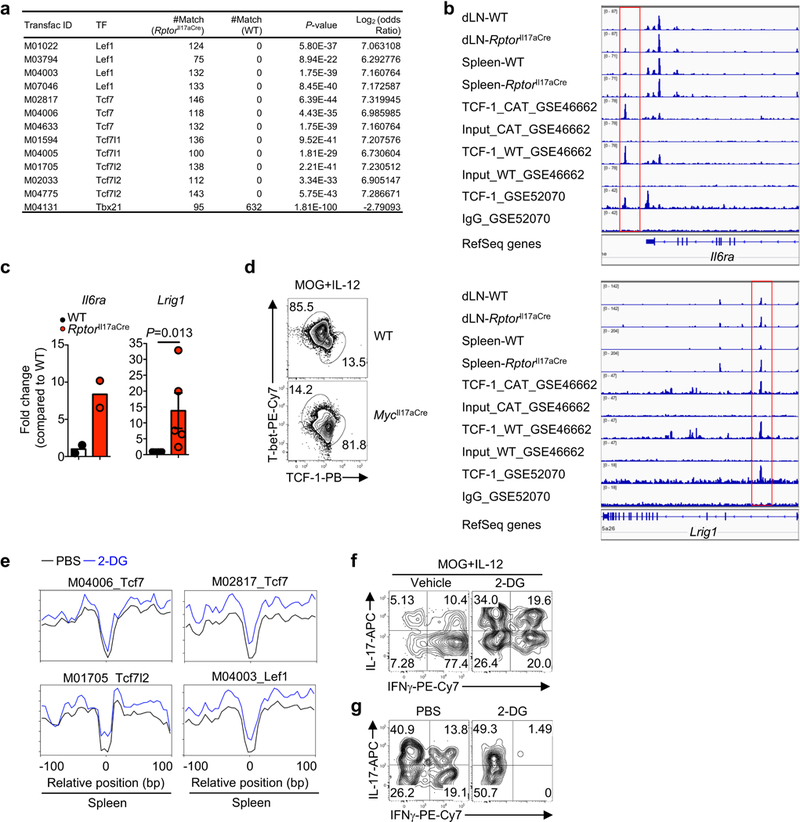
Consistent with downregulation of acetylation in Raptor-deficient cells (Extended Data Fig. 5a), we found impaired binding of acetyl histone H3 to Ifng promoter (Extended Data Fig. 7a). Also, ATAC-Seq (assay for transposase accessible chromatin using sequencing15) of chromatin accessibility (Fig. 3a, Extended Data Fig. 7b, c) showed that Raptor-deficient cells had less accessibility in Ifng promoter, corresponding to T-bet binding sites (Fig. 3b), as well as the promoters for Tbx21 and Il12rb2 (Extended Data Fig. 7d). Transcription factor motif searches on accessible regions of ATAC-Seq reads revealed enriched occupancy of the TCF-LEF family factors in Raptor-deficient cells (Fig. 3c, d, Extended Data Fig. 7e, f). In-depth footprint analysis by superimposing ATAC-Seq results with public TCF-1 ChIP-Seq datasets identified TCF-LEF binding motifs in RptorIl17aCre but not WT open chromatin regions (Extended Data Fig. 8a), whereas a much greater number of T-bet binding motifs was enriched in WT open chromatin regions (Extended Data Fig. 8a). To validate enhanced TCF-1 binding in genomic landscape of Raptor-deficient TH17 cells, we chose two candidate genes Il6ra and Lrig116,17 (Extended Data Fig. 8b) for chromatin immunoprecipitation (ChIP) assay and found much greater binding of TCF-1 to these genes in Raptor-deficient cells (Extended Data Fig. 8c). Moreover, co-staining of TCF-1 and T-bet in TH17 cells identified two reciprocal populations, with an increased TCF-1hiT-betlo but reduced TCF-1loT-bethi population upon loss of Raptor (Fig. 3e). Following culture with MOG and IL-12, WT cells became almost exclusively TCF-1loT-bethi, while Raptor deficiency reduced this transition (Fig. 3f). Similarly, Myc deletion increased TCF-1hiT-betlo at the expense of TCF-1loT-bethi subset (Extended Data Fig. 8d). Altogether, TCF-LEF factors are enriched in the genomic landscape of Raptor-deficient TH17 cells, and reciprocal expression of T-bet and TCF-1 in TH17 cells depends upon mTORC1.
Figure 3. TCF-1 expression is regulated by mTORC1 and metabolic activity in TH17 cells.
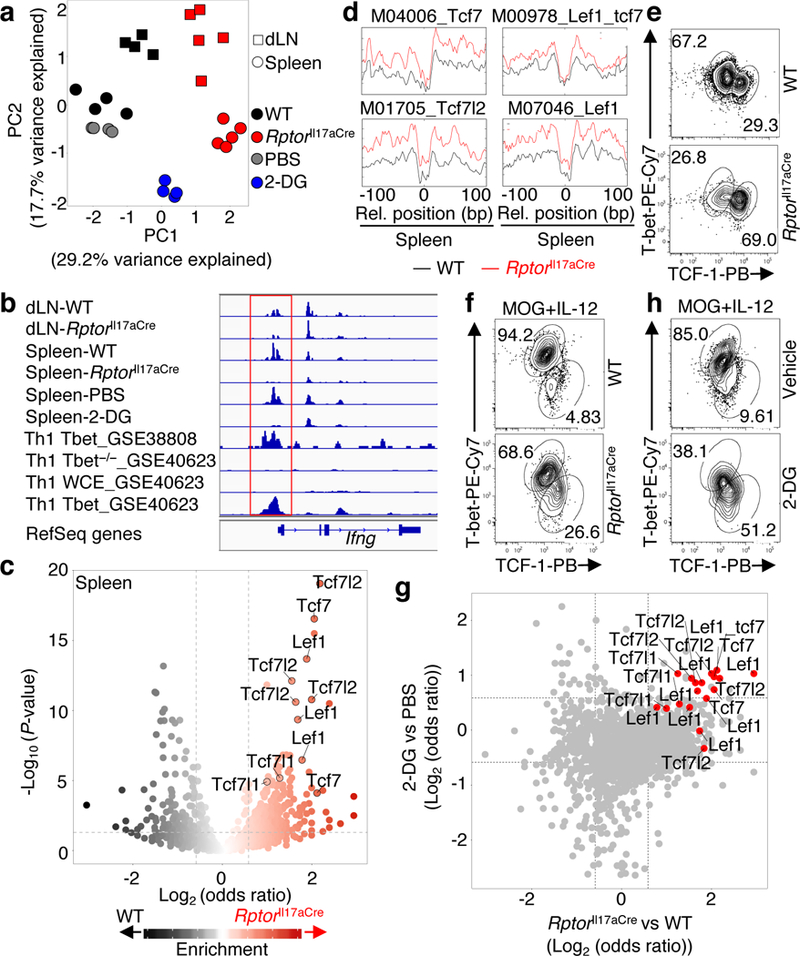
a–d, ATAC-Seq analysis of YFP+ cells isolated from draining lymph nodes (dLN) and spleen of WT and RptorIl17aCre (R26ReYFP) mice or spleen of PBS- or 2-DG-treated R26ReYFP mice at day 9 post MOG-immunization. a, Principal component analysis (PCA) plot of nucleosome-free fragments. b, Accessibility of the Ifng locus, aligned with T-bet binding sites (red box, promoter regions). c, Motif enrichment analysis of ATAC-Seq from the spleen. d, Binding profiles of selected TCF-LEF family transcription factors. e, f, Flow cytometry of T-bet and TCF-1 expression in freshly-isolated YFP+ cells from dLN of mice at day 9 post MOG-immunization (e), or after in vitro stimulation with MOG+IL-12 for 4 days (f). g, Odds ratio vs odds ratio plot of motif enrichment data from RptorIl17aCre vs WT and 2-DG vs PBS samples. h, Flow cytometry of T-bet and TCF-1 expression in YFP+ cells from Il17aCre (R26ReYFP) mice cultured with MOG+IL-12, and vehicle or 2-DG (1 mM). Data are representative of one (a–d, g), four (e, f), or three (h) independent experiments.
To directly assess the involvement of metabolism, we performed ATAC-Seq analysis of TH17 cells isolated from MOG-immunized mice treated with 2-DG (Fig. 3a). Remarkably, 2-DG-treated samples, similar as Raptor-deficient cells, showed reduced chromatin accessibility in Ifng, Tbx21 and Il12rb2 promoters (Fig. 3b, Extended Data Fig. 7d), and enriched occupancy of TCF-LEF factors (Fig. 3g, Extended Data Fig. 8e). Furthermore, 2-DG treatment impaired the generation of TCF-1loT-bethi population (Fig. 3h) and IFNγ expression in TH17 cells in vitro and in vivo (Extended Data Fig. 8f, g). These results support the metabolic dependence of chromatin accessibility and reciprocal T-bet and TCF-1 expression in TH17 cells.
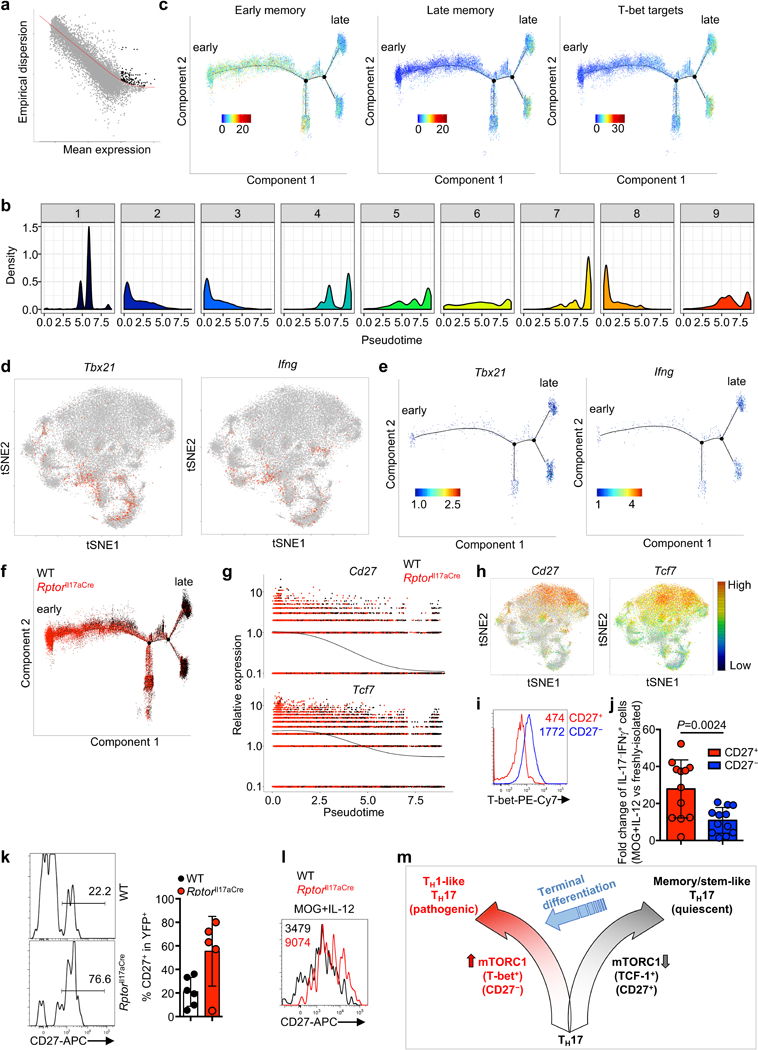
We next employed single cell RNA-sequencing (scRNA-Seq) to unbiasedly dissect cellular heterogeneity. WT and Raptor-deficient TH17 cells had largely distinct distribution patterns (Fig. 4a, Extended Data Fig. 9a−c). Functional enrichment analysis on the differentially expressed genes within each cluster revealed the underlying cellular processes associated with each sub-population (Extended Data Fig. 9d). Clusters mainly comprised of Raptor-deficient cells were enriched with memory-associated gene signatures1–3,13, while WT-dominant clusters were reciprocally enriched with genes downregulated in memory cells (Fig. 4b, Extended Data Fig. 9e). To explore potential differences in temporal activation, we superimposed our scRNA-Seq data with published datasets from CD8+ memory T cells stimulated once versus multiple times18, respectively designated as “early memory” (less maturity) and “late memory” (terminal differentiation) signatures19. Raptor-deficient and WT cells were enriched with “early memory” and “late memory” gene signatures, respectively (Fig. 4c, Extended Data Fig. 9e). Moreover, enrichments for T-bet target genes and glycolysis were mainly observed in WT-dominant clusters (Extended Data Fig. 9e, f), whereas RptorIl17aCre-dominant clusters showed increased expression of memory-associated genes Bcl2, Cd27, and Tcf79–11 (Extended Data Fig. 9g). Therefore, single cell transcriptomics reveals marked heterogeneity of TH17 cells as inferred by the reciprocal expression of stemness-like and terminal differentiation signatures, and highlights mTORC1-dependent shaping of these heterogeneous features.
Figure 4. Single cell transcriptomics of TH17 cells and mTORC1-dependent licensing for TH1 transdifferentiation.

a, Two-dimensional tSNE projection of single cell transcriptomics data from WT (black) and RptorIl17aCre (red) YFP+ cells (n = 3 per genotype; 27,619 total cells). b, tSNE visualization of gene signatures of upregulated and downregulated genes shared between memory CD8+ and TFH cells (Choi et al.). c, tSNE visualization of “early memory” and “late memory” gene signatures (Wirth et al. and Muranski et al.). d, Pseudotime trajectory of single cell transcriptomics data colorized by pseudotime (arbitrary units; blue and red indicate early and late time, respectively). e, Pseudotime trajectory of cellular density: WT (gray), RptorIl17aCre (red). f, g, Cytokine production (f) and T-bet and TCF-1 expression (g) by CD27+ and CD27− YFP+ cells cultured with MOG or MOG+IL-12 for 4 days. Data are representative of one (a–e) or three (f, g) independent experiments.
To reconstruct developmental trajectory, we analyzed our scRNA-Seq data using Monocle 2 for pseudo-temporal ordering of cells (pseudotime)20. Using a group of highly expressed and dispersed genes (Extended Data Fig. 10a), we derived a relative trajectory with pronounced differences in the pseudotime assignment of the 9 clusters (Fig. 4d, Extended Data Fig. 10b). Projection of gene signatures onto the pseudotime trajectory revealed the assignment of “early memory” and “late memory” signatures with early and late pseudotime, respectively, corroborating our analysis (Extended Data Fig. 10c). “T-bet targets” signature (Extended Data Fig. 10c) and Tbx21 and Ifng expression (Extended Data Fig. 10d, e) were restricted to branches of late pseudotime, suggesting late acquisition of TH1 features. Additionally, Raptor-deficient TH17 cells had an increased propensity for early pseudotime assignment (Fig. 4e, Extended Data Fig. 10f), suggesting altered pseudo-temporal ordering. Moreover, Cd27 and Tcf7 were expressed primarily in early pseudotime and associated with RptorIl17aCre-dominant clusters (Extended Data Fig. 10g, h). These analyses suggest a role for mTORC1 in promoting terminally differentiated TH1-like cells from CD27+ TH17 cells.
Although freshly-isolated CD27+ TH17 cells expressed low levels of IFNγ and T-bet (Fig. 1b, Extended Data Fig. 10i), they acquired the ability to express IFNγ and T-bet to a similar extent as CD27– cells after antigen stimulation (Fig. 4f, g), indicating a much greater induction of IFNγ-producing capacity (Extended Data Fig. 10j). To further examine the role of mTORC1 in this process, we isolated CD27+ or CD27− YFP+ cells from WT or RptorIl17aCre mice and transferred them into recipients, followed by MOG immunization. While a substantial number of WT CD27+ cells became CD27−, the majority of Raptor-deficient cells retained their CD27 expression (Extended Data Fig. 10k), indicating arrested differentiation of CD27+ into CD27− cells. Additionally, Raptor-deficient CD27+ cells were less efficient in transitioning into CD27− cells after in vitro MOG and IL-12 stimulation (Extended Data Fig. 10l). Altogether, these functional data further support that mTORC1 drives CD27+ to CD27− cell transition.
Our findings suggest that TH17 responses in chronic autoimmune disease are phenotypically, transcriptionally, and metabolically heterogeneous, encompassing a CD27+TCF-1hi subset with inferred stemness features and low anabolic metabolism and a reciprocal CD27−T-bethi subset (Extended Data Fig. 10m). The CD27+TCF-1hi subset can develop into terminally-differentiated CD27−T-bethi sub-population with robust IFNγ expression, but this transition is arrested upon mTORC1 deletion or metabolic perturbation. These results highlight that metabolic heterogeneity of TH17 cells underlies lineage stability and plasticity, and point to a causative effect of metabolic reprogramming on these late developmental processes. Our results suggest that TCF-1 is sensitive to anabolic metabolism and serves as a putative metabolic gatekeeper to preserve lineage identity and stability of effector T cell lineages. From a therapeutic perspective, in as much as targeting cancer stem cells is an ultimate goal for successful anti-cancer therapy, the identification of stem-like TH17 cells opens new avenues for therapeutic intervention of chronic inflammatory conditions.
METHODS
Mice
Mice were housed and bred at the St. Jude Children’s Research Hospital animal care facilities in specific pathogen-free conditions. C57BL/6, Tcra−/−, CD45.1+, Il17aCre, Rag1−/− and 2D2-transgenic mice were purchased from the Jackson Laboratory. Rptorfl, Mycfl, and Hmgcrfl mice were as described previously21–23. Cre-expressing mice were used as controls, and littermates were used when possible. Mice were backcrossed for at least 10 generations to the C57BL/6 background strain. Female and male mice were used at 6–10 weeks of age. Sample size was selected to maximize the chance of uncovering mean difference which is also statistically significant. Age- and sex-matched mice were assigned randomly to experimental and control groups. The assessment of EAE scores and histopathology examination was performed in a blinded fashion. For the generation of BM chimeras, Tcra−/− mice were sublethally irradiated for a total of 500 Rads before receiving 3 million CD90.2-depleted BM donor cells. Mice remained on antibiotic (Baytril) water for 2–3 weeks, and, after 6 weeks, reconstitution was determined by flow cytometry analysis of blood samples. Mice were used 6–8 weeks after chimera generation for experiments. All experiments with mice were conducted in accordance with the St. Jude Children’s Research Hospital institutional policies, and animal protocols were approved by the Institutional Animal Care and Use Committee of St. Jude Children’s Research Hospital.
EAE induction
Mice were immunized subcutaneously at four injections sites with a total of 200 μl of emulsified incomplete Freund’s adjuvant supplemented with 1 mg Mycobacterium tuberculosis strain H37Ra (Difco) (Complete Freund’s ajuvant; CFA) and 200 μg Myelin oligodendrocyte glycoprotein (AA 35–55) (MOG35–55), and received intraperitoneal injection of 200 ng pertussis toxin (PTX; List Biological Laboratories) at the time of immunization and 48 h later. Mice were observed daily for clinical signs and scored: normal mouse; no overt signs of disease (0), limp tail (1), limp tail + hindlimb weakness (2), total hindlimb paralysis (3), hindlimb paralysis + 75% of body paralysis (forelimb paralysis/weakness) (4), and moribund (5).
FACS, antibodies, and reagents
For analysis of surface markers, cells were stained in PBS (Gibco) containing 2% (wt/vol) BSA (Sigma). Surface proteins were stained for 30 min on ice. CellTrace labeling was performed according to manufacturer’s instructions (Thermo Fisher). Intracellular staining was performed on sorted YFP+ cells with Foxp3/Transcription Factor Staining Buffer Set according to manufacturer’s instructions (eBioscience). Intracellular staining for cytokines was performed with fixation/permeabilization kit (BD Biosciences). Caspase-3 staining was performed using instructions and reagents from the “Active Caspase-3 Apoptosis Kit” (BD Biosciences). 7-AAD (Sigma) was used for dead cell exclusion at 2.5 μg/ml. The following antibodies were used: anti-CD27 (LG.7F9), anti-CD45.2 (104), anti-IFNγ (XMG1.2), anti-KLRG1 (2F1), anti-T-bet (eBio4B10) (all from eBioscience); anti-CD43 (activation-glycoform; 1B11), anti-CD44 (IM7), anti-CD45.1 (A20), anti-CD62L (MEL-14), anti-CD127 (A7R34), anti-CCR6 (29–2L17), anti-CXCR3 (CXCR3–173), anti-IL-17 (TC11–18H10.1), anti-Ly6C (HK1.4), anti-PD-1 (29F.1A12), anti-Sca-1 (D7), anti-TCRβ (H57–597) (all from Biolegend); anti-CD95 (Jo2), anti-Foxp3 (FJK-16s), anti-RORγt (Q31–378), anti-pSTAT3 (pY705), anti-pSTAT4 (pY693) (all from BD Biosciences); and anti-CD4 (RM4–5) (from SONY), anti-p4E-BP1 T37/46 (236B4), anti-pS6 S235/236 (D57.2.2E), and anti-TCF-1 (C63D9) (from Cell Signaling Technology). Flow cytometry data were analyzed using Flowjo 9.7.7 (Tree Star). Cytokines IL-12 (BD Biosciences) and IL-23 (R&D) were resuspended at 5 μg/ml and 20 μg/ml, respectively in 0.5% BSA/DPBS and used at final concentrations as indicated.
T cell culture after immunization
Mice were immunized with MOG35–55 emulsified with CFA as described above, without PTX injection. Spleen or dLN samples were adjusted to 3×10⁶ cells/ml in Click’s media containing 10% FBS and 1% antibiotics and glutamine and cultured in the presence of MOG (25 μg/ml) alone, MOG+IL-12 (5 ng/ml), or MOG+IL-23 (20 ng/ml). In some experiments, CellTrace (Life Technologies) was used according to manufacturer’s instructions to label cells to assess cell division. CD27+ and CD27− cell fractions within YFP+ cells were sorted using a Reflection (i-Cyt) and CD27 antibodies described above. Cells were cultured for three (proliferation) or four (cytokine production) days. To assess cytokine production by FACS, cells were stimulated with phorbol 12-myristate 13-acetate (50 ng/ml, Sigma), ionomycin (0.5 μM, Sigma), and monensin (1:1,000, BD Biosciences) for 4 h at 37°C.
TH17 differentiation from naïve CD4 T cells
Lymphocytes from spleen and dLN were pooled and sorted using a Reflection (i-Cyt). Sorted naïve CD4+ T cells (CD4+CD25−CD62L+CD44−) were activated in vitro for 4–5 days with 2 μg/ml anti-CD3 (2C11; Bio X Cell), 2 μg/ml anti-CD28 (37.51; Bio X Cell), human TGF-β1 (2 ng/ml, R&D) and mouse IL-6 (20 ng/ml, BD Biosciences). Cytokine expression was assessed after PMA/ionomycin stimulation as described above.
ChIP qPCR assay
ChIP was performed as described24. Briefly, cells were cross-linked in 1% formaldehyde for 5 min at room temperature, quenched with glycine, and pellets were lysed in Cell Lysis Buffer (25 mM HEPES, pH 7.8, 1.5 mM MgCl2, 10 mM KCl, 0.3% NP-40, 1 mM DTT) with a protease inhibitor tablet (Roche) for 10 min on ice. Nuclei were pelleted and lysed in Nuclear Lysis Buffer (50 mM HEPES, pH 7.9, 140 mM NaCl, 1 mM EDTA, 1% Triton X-100, 0.1% Na-deoxycholate, 0.2% SDS) with a protease inhibitor tablet for 10 min on ice, prior to sonication into maximum 500 bp pieces using a Diagenode Bioruptor. Sheared chromatin was cleared of debris and incubated with either normal IgG (Cell Signaling Technology; 1:50) or anti-pan acetyl histone H3 (Millipore; 1:50), or anti-TCF1 (Cell Signaling Technology; 1:50), and blocker (Active Motif) rotating overnight at 4°C. Chromatin immunoprecipitation and subsequent DNA purification was performed using the ChIP-IT High Sensitivity Kit (Active Motif) per manufacturer’s instructions. Sybr green qPCR primers used: Ifng promoter F-GAGCCCAAGGAGTCGAAAGGAA, Ifng promoter R-CTAGGTCAGCCGATGGCAGCTA25, Il6ra F-TTCAGTAAGACGGCAGGTGT, Il6ra R-TACGTTTGACTGAGTGGCCT, Lrig1 F-TAGGGCGTGCACTTACTGAA, Lrig1 R-CTGAACTTGCCCTTGACTGG, negative control primer set (Active Motif #71011) and positive control primer set (Active Motif #71017). Data analysis was performed using the ‘Percent Input’ normalization method and displayed as a percentage of WT control. To identify additional target genes aside from known TCF-1 target genes16,17, we computationally identified genes whose genomic regions became more accessible from ATAC-Seq data as a result of Raptor deletion. Using this subset of genes, we further compared microarray data from Raptor-deficient and WT cells and identified Lrig1 as a top candidate.
2-DG treatment in vivo
Mice were treated by intraperitoneal injection with 2-DG (2 g/kg body weight, as described26) dissolved in PBS or PBS vehicle for consecutive days starting at one day prior to immunization with MOG until the day before sacrifice.
In vivo cell transfer
CD27+ or CD27− fractions of YFP+ cells were sorted after enrichment with CD4 beads (Miltenyi) from spleens and lymph nodes of MOG-immunized WT or RptorIl17aCre mice. Sorting was performed on a Reflection (iCyt/Sony) cytometer, and sort-purified cells were transferred via retroorbital injection into Rag1−/− mice. Due to low cell numbers, we used day 1 after transfer as the baseline reading to normalize subsequent analyses at days 14–15, as previously described27, for donor cell abundance in the spleen and lymph nodes. Similar transfer experiments were performed using CD45.1+ hosts, except that 2D2-transgenic mice (expressing MOG antigen-specific T cell receptors28; crossed onto the Il17aCre (R26ReYFP) fate-mapping system) were used as donor mice, and CD4 T cell enrichment was performed at the time of analysis, to facilitate flow cytometric detection of the rare population of donor cells.
Statistical analysis for biological experiments
For biological experiment (non-omics) analyses, P-values were calculated by two-way ANOVA, Student’s t-test (two-sided) for parametric data or Mann-Whitney U test (two-sided) for non-parametric data. Differences between groups were considered statistically significant with a P-value cutoff of 0.05 or less. Data are represented as means ± s.e.m. Graph Pad Prism (v. 6.0) was used to perform these statistical analyses.
Microarray analysis
Mice were immunized with MOG as described above. TCRβ+YFP+ from dLN of WT or RptorIl17aCre (R26ReYFP) mice, or TCRβ+YFP+CD44intCD27+ and TCRβ+YFP+CD44hiCD27− cells from dLN of Il17aCre (R26ReYFP) mice at day 9 post-immunization were analyzed with the Affymetrix Mouse Gene 2.0 ST GeneChip array29, and expression signals were summarized with the robust multi-array average algorithm (Affymetrix Expression Console v1.1) or by fitting a linear model implemented in the R package “limma”30. Lists of differentially expressed genes by 0.5 Log2 fold change or more were analyzed using Ingenuity Pathway Analysis (www.ingenuity.com) to identify underlying Ingenuity canonical pathways and upstream transcription regulators. Gene set enrichment analysis (GSEA) within Hallmark gene sets was performed as described31. For GSEA using manually curated gene signatures from public datasets, refer to ‘analysis for scRNA-Seq data’ below. Upregulated and downregulated genes under each condition were annotated using Hallamrk and KEGG gene sets (version 6.0 downloaded from MsigDB31) and functional enrichment of specific pathways in the gene sets was performed using Fisher’s exact test. Fisher’s exact P-value was corrected for multiple testing using Benjamini-Hochberg (BH) method. Pathways were deemed significantly enriched at FDR < 5% and enrichment score ≥ 10. To determine empirical cumulative distribution, P value is calculated by using Kolmogorov–Smirnov test. Transcriptome data are deposited into NCBI GEO (GSE107521).
ATAC-Seq library preparation
Mice were immunized with MOG as described above. TCRβ+YFP+ cells were sorted from dLN or spleen at day 9 post-immunization, and lysed in 50 μl ATAC-Seq lysis buffer (10 mM Tris-HCl, pH 7.4, 10 mM NaCl, 3 mM MgCl2, 0.1% IGEPAL CA-630) on ice for 10 min. Resulting nuclei were pelleted at 500 g for 10 min at 4°C. Supernatant was carefully removed with a pipette and discarded. The pellet was resuspended in 50 μl transposase reaction mix (25 μl 2× TD buffer, 22.5 μl nuclease-free water, 2.5 μl Transposase) and incubated for 30 min at 37°C. After the reaction, the DNA was cleaned up using the Qiagen MinElute kit. The barcoding reaction was run using the NEBNext HiFi kit based on manufacturer’s instructions and amplified for 5 cycles according to Buenrostro et al.15 using the same primers. Ideal cycle numbers were determined from 5 μl (of 50 μl) from the previous reaction mix using KAPA SYBRFast (Kapa Biosystems) and 20 cycle amplification on a Applied Biosystems 7900HT. Optimal cycles were determined from the linear part of the amplification curve and the remaining 45 μl of PCR reaction were amplified in the same reaction mix using the optimal cycle number.
ATAC-Seq analysis
2× 100 bp paired-end reads were obtained from all samples and trimmed for Nextera adapter by cutadapt (version 1.9, paired-end mode, default parameter with “–m 6 –O 20”) and aligned to mouse genome NCBIM37_um from Sanger (ftp://ftp-mouse.sanger.ac.uk/ref/NCBIM37_um.fa) by BWA32 (version 0.5.9-r26-dev, default parameter), duplicated reads were then marked with Picard (version 1.65 (1160)) and only non-duplicated reads have been kept by samtools (parameter “-q 1 -F 1024” version 0.1.18 (r982:295)). After adjustment of Tn5 shift (reads were offset by +4 bp for the sense strand and −5 bp for the antisense strand), we separated reads into nucleosome-free, mononucleosome, dinucleosome, and trinucleosome as described in Buenrostro et al.15 by fragment size and generated bigwig files by using the center 80 bp of fragments and scaled to 30 M nucleosome-free reads. We observed reasonable nucleosome-free peaks and patterns of mono-, di-, tri-nucleosome on IGV33 (version 2.3.40), and visualized these using heat maps and aggregation plots centered by transcriptional start sites (TSSs) (Extended Data Fig. 6b). All samples had more than 20 M nucleosome-free reads and visual inspection indicated adequate data quality (see Extended Data Fig. 6b), so we performed peak calling for nucleosome-free reads by MACS234 (version 2.1.0.20150603 default parameters with “--extsize 200 –nomodel”, merged by bedtools35 if within 100 bp) for individual samples. To assure the replicability, we first finalized nucleosome-free regions for each tissue/genotype only retaining a called peak if it appeared in more than half of replicates, and then we counted nucleosome-free reads from each replicate and drew correlation plots and distribution (Extended Data Fig. 6c), the Pearson correlation coefficient (all > 0.95) indicated our data were highly reproducible across samples. Then we merged finalized nucleosome-free regions from all tissue/genotype iterations and counted nucleosome-free reads for each sample and clustered them by correlation, indicating the samples separated well by genotype (Extended Data Fig. 6c).
To find the differential accessible regions, we first normalized raw nucleosome-free reads counts using trimmed mean of M-values normalization method and applied Empirical Bayes Statistics test after linear fitting from voom package36 (R 3.23, edgeR 3.12.1, limma 3.26.9). P-value 0.05 or FDR-correct P-value 0.05 was used as cutoff for more accessible regions or less accessible regions in Raptor-deficient samples. For motif analysis, we further selected 1,000 regions as control that their P-value > 0.5 and CPM (Counts Per Million) > first quartile of all CPM and least variable by MAD score. At last, MAST37 from MEME suite38 (version 4.10.2) was used for scanning motif (TRANSFAC database, only included Vertebrata and not 3D structure-based) matches in the nucleosome-free regions and Fisher’s exact tests was used to test whether a motif is significantly correlated with differential accessible regions compared to the total number of regions. For footprinting of identified motifs, bigwig files were first generated by all tags of adjusted reads and normalized by autosomes reads number to 200 M reads (e.g. sample with 100 M autosome reads would be scaled to double the bigwig profile). Then average bigwig files were generated by mean of replicates at each bp for each sample and motif matches within nucleosome free region have been used for footprinting taking the average profile across all motif matches at each bp from −100 bp from motif match centers to +100 bp. Finally, the footprinting profiles were smoothed with 10 bp bins.
To identify the enrichment of TCF_LEF and T-bet binding, nucleosome-free differentially accessible regions were selected at p < 0.05. The peaks were further annotated as more accessible regions in RptorIl17aCre compared to WT (KO_Larger) or less accessible regions in RptorIl17aCre (KO_Smaller). TCF-1 ChIP-Seq peaks were downloaded from GSE52070 and T-bet peaks were downloaded from GSM998272. For each group, differentially accessible peaks were overlapped with both TCF-1 or T-bet peaks to identify regions common between ATAC-Seq peaks and ChIP-Seq peaks using bedtools (version 2.25.0). Finally, FIMO39 from MEME suite (version 4.9.0) was used to scan the overlapping regions with TRANSFAC motifs for LEF/TCF-1 family or T-bet, and Fisher’s exact test was used to test the significance of enrichment of motifs in KO_Larger against KO_Smaller regions described above.
Single cell RNA-sequencing (scRNA-Seq)
Mice were immunized with MOG as described above. TCRβ+YFP+ cells from spleen at day 9 post-immunization were sorted on an iCyt Reflection cell sorter into 15 ml tubes containing complete media, counted, and placed on ice. Some samples were pooled prior to library construction in order to load sufficient cellular materials into the Chromium Controller instrument (10× Genomics)40. The cells were counted and examined for viability using a Luna Dual Florescence Cell Counter (Logos Biosystems). All samples were spun down at 2,000 rpm for 5 min. The supernatant was removed, and cells were re-suspended in 100 μl of 1× PBS (Thermo Fisher Scientific) + 0.04% BSA (Amresco). The cells were then counted and checked for viability using a Luna Dual Florescence Cell Counter (Logos Biosystems). Cell counts ranged from 4×10⁵ to 1.5×10⁶ cells per milliliter and viability was above 98%. Single cell suspensions were loaded onto the Chromium Controller according to their respective cell counts to generate 6000 single cell GEMs (gel beads in emulsion) per sample. Each sample was loaded into a separate channel. Libraries were prepared using the Chromium Single Cell 3’ v2 Library and Gel Bead Kit (10× Genomics). The cDNA content of each sample after cDNA amplification of 12 cycles was quantified and quality checked using a High-Sensitivity DNA chip with a 2100 Bioanalyzer (Agilent Technologies) to determine the number of PCR amplification cycles to yield sufficient library for sequencing. After library quantification and quality check by DNA 1000 chip (Agilent Technologies), samples were diluted to 3.5 nM for loading onto the HiSeq 4000 (Illumina) with a 2 × 75 paired-end kit using the following read length: 26 bp Read1, 8 bp i7 Index, and 98 bp Read2. An average of 400,000,000 reads per sample was obtained (~approximately 80,000 reads per cell).
Analysis for scRNA-Seq data
Alignment, barcode assignment, and UMI counting
The Cell Ranger 1.3 Single-Cell Software Suite (10× Genomics) was implemented to process the raw sequencing data from the Illumina HiSeq run. This pipeline performed de-multiplexing, alignment (mm10), and barcode processing to generate gene-cell matrices used for downstream analysis. Specifically, data of 3 WT and 3 RptorIl17aCre samples were combined into one dataset for consistent filtering, and UMIs mapped to genes encoding ribosomal proteins were removed. Cells with low (potentially dead cells with broken membrane) or high (potentially two or more cells in a single droplet) UMI counts were filtered. A small fraction of outlier cells (430) were further removed due to low transcriptome diversity (fewer genes detected compared to other cells with comparable number of UMIs captured). A total of 27,619 cells (WT: 13,295; RptorIl17aCre: 14,324) were captured with an average of 3,419 mRNA molecules (UMIs, median: 2,757, range: 1,500–9,999). The expression level of each gene is normalized to 10,000 UMIs per cell and log transformed by adding 0.5 to the expression matrix.
Clustering
The sub-population structure of the whole dataset was inferred using Latent Cellular State Analysis (LCA)41, a novel clustering algorithm developed in house for analyzing large-scale scRNA-Seq data (manuscript in preparation). Briefly, LCA first used singular value decomposition (SVD) to derive latent cellular states from the expression matrix for individual cells. Significant cellular states were determined using the Tracy-Widom test on eigenvalues. A modified version of spectral clustering was performed on the significant cellular states of individual cells (cellular states explained by total UMIs ignored) with different number of clusters (2–30). The optimal number of clusters was manually selected from top models determined by the silhouette measure for solutions with different number of clusters.
Data visualization
Underneath cell variations were visualized in a 2D projection by t-distributed stochastic neighbor embedding (tSNE). Expression of individual genes or pathway scores was color-coded (gray: not expressed; from low to high: blue-green-yellow-red) for each cell on tSNE plots.
Generation of gene signatures and statistical analysis for functional enrichment
We used published gene sets that are shared between memory and TFH cells (“Memory TFH overlap UP” and “Memory TFH overlap DOWN”)13, and early and late CD8+ T cell memory gene sets previously used to show memory features of TH17 cells (“Early memory” and “Late memory”)19. We generated a Tbx21 (T-bet)-dependent signature (“T-bet targets”) from previously published gene expression changes in cultured TH1 cells sufficient or deficient for Tbx21 (Log2 fold change ≥ 3; GSE38808)42. Microarray dataset (GSE19825)12 was analyzed using limma package in R to generate “CD25hi effector CD8” and “CD25lo memory-precursor CD8” gene signatures. Specifically, upregulated and downregulated genes in CD25hi vs CD25lo comparison were ranked after filtering at 5% FDR by Log2 fold change, and 196 upregulated genes (Log2 fold change > 1) were annotated as “CD25hi effector CD8” and top 200 downregulated genes (Log2 fold change < −1) were annotated as “CD25lo memory-precursor CD8”. Similarly, microarray dataset (GSE84105)1 was used for generating “CXCR5+ exhausted CD8 (Ahmed)” and “CXCR5− exhausted CD8 (Ahmed)” gene signatures at the same significance level of 5% FDR; total upregulated and downregulated genes were more than 200, so we ranked genes by their Log2 fold change of expression in CXCR5+ vs CXCR5− comparison and used top 200 upregulated genes as “CXCR5+ exhausted CD8 (Ahmed)” and top 200 downregulated genes as “CXCR5− exhausted CD8 (Ahmed)”. Furthermore, RNA-Seq data (GSE76279)2 was processed using DEseq2 R package v 1.16.1 to generate “CXCR5+ exhausted CD8 (Yu)” and “CXCR5− exhausted CD8 (Yu)” using the same strategy as the other signatures above. For scRNA-Seq analysis, genes from these signatures were retained if they were expressed in at least 10% of cells in any cluster. Gene signature activity was calculated as the average value for all retained genes. For functional enrichment of genes highly expressed in a specific cluster, we applied Fisher’s exact test (R 3.3.1) using the specific gene signatures described above, or Hallmark, canonical pathways and GO gene sets (MSigDB31).
Pseudotime analysis using Monocle 2
Pseudotime analysis was performed using Monocle 220 (v. 2.3.6) with cell ordering based on highly dispersed and highly expressed genes (empirical dispersion / dispersion fit ≥ 1.1 and mean expression ≥ 0.01; Extended Data Fig. 7a). Resulting data were visualized using functions available in the Monocle 2 package and ggplot2 (v. 2.2.1).
Extended Data
Extended Data Figure 1. CD27 expression on TH17 cells during autoimmunity and cellular homeostasis of CD27+ and CD27− TH17 subsets.
a, Analysis of publically available single cell transcriptomics data of IL-17-GFP+ cells from draining lymph nodes (dLN) compared to central nervous system (CNS) (Gaublomme et al.). b, Flow cytometry analysis of putative memory surface markers on CD4+TCRβ+YFP+ cells from dLN and spleen of mice at day 9 post MOG-immunization. c, Summary of CD27 expression on CD4+TCRβ+YFP+ cells in dLN (red; n = 5, day 5; n = 3, day 7; n = 7, day 9; n = 8, day 16) overlaid with clinical EAE score (black, n = 5). d, Ki-67 expression in CD27+ and CD27− cell populations. e, Flow cytometry analysis (left) and summary (right) of CD27 expression on transferred CD27+ or CD27− YFP+ cells, at day 14 after transfer into CD45.1+ hosts (n = 14, CD27+; n = 15, CD27−). f, Flow cytometry analysis of BCL-2 expression in CD27+ and CD27− populations. Data are means ± s.e.m and representative of three (b–d, f) or at least five (e) independent experiments. Numbers in plots represent frequencies of cells in gates; numbers within histogram represent mean fluorescence intensities. Mann-Whitney U test (two-sided; non-parametric) was used in e to determine statistical significance.
Extended Data Figure 2. Gene expression profiles associated with CD27+ and CD27− TH17 subsets.
a, Volcano plot of transcriptomics data between CD27+ and CD27− CD4+TCRβ+YFP+ cells. b, GSEA plots comparing CD27+ and CD27− populations using gene sets of antigen-specific CXCR5+ and CXCR5− exhausted CD8+ T cells from chronic infection. Gene expression heat maps normalized by row (z-score) for the top 30 leading-edge genes between microarray samples from CD27+ compared to CD27− CD4+TCRβ+YFP+ cells, using gene sets derived from CXCR5+ and CXCR5− exhausted CD8 T cells (Im et al.). c, Gene expression heat maps normalized by row (z-score) for the top 30 leading-edge genes between CD27+ and CD27− CD4+TCRβ+YFP+ cells, using the “HALLMARK_APOPTOSIS” gene set. d, GSEA plots comparing CD27+ and CD27− populations using “Hallmark” gene sets, showing the enrichment of mTORC1 signaling, Myc targets, and selective metabolic pathways in CD27− TH17 cells. Data are from one experiment (a–d).
Extended Data Figure 3. Cell-intrinsic requirement of Raptor in TH17 cells.
a, Naïve CD4+ T cells were differentiated under TH17-polarizing conditions and analyzed for cytokine expression after PMA/ionomycin stimulation in vitro (left) or for proliferation (CellTrace) and RORγt expression (right). b, Flow cytometry analysis (left) and total number of CD4+ T cells (right) from spinal cord at day 16 post-immunization (n = 10, WT; n = 8, Rptorll17aCre). c, Experimental design for the generation (left) and clinical score (right) of WT and RptorIl17aCre (R26ReYFP) bone marrow (BM) chimeras for restriction of Raptor deficiency specifically to TCRα-expressing IL-17+ T cells (n = 5 per genotype). Specifically, 5:1 ratio of Tcra–/– and Rptorll17aCre (or WT control) BM cells were transferred into sublethally irradiated Tcra –/– recipients, followed by reconstitution. In this system, all T cells in the chimeras were derived from Rptorll17aCre or WT BM cells, whereas the majority of non-T cell compartments were derived from WT cells. d, Experimental design for the generation (left) and clinical score (right) of WT and RptorIl17aCre (R26ReYFP) BM chimeras for equal inflammatory conditions. Specifically, mixed BM chimeras were generated using 1:1 ratio of congenically marked CD45.2+ RptorIl17aCre (or WT control) and CD45.1+ WT BM-derived cells, which mediated CNS inflammation in EAE (n = 3, WT; n = 4, Rptorll17aCre). e–k, Equi-inflammatory chimeric mice generated in (d) were analyzed at day 18 after EAE immunization, for frequencies of CD4+ T cells positive for CD45.2 or YFP (e) (n = 12, WT; n =14, Rptorll17aCre), and YFP+CD4+ T cells expressing IL-17 or IFNγ within the spinal cord (f) (n = 6, WT; n = 7, Rptorll17aCre), expression of Ki-67 (g) (n = 8, WT; n = 10, Rptorll17aCre), T-bet (as fold change in mean fluorescence intensity after normalization to WT cells; h) (n = 10 per genotype), and active caspase-3 in splenic YFP+CD4+ T cells (i) (n = 6 per genotype), and expression of CCR6 (j) (n = 7, WT; n = 6, Rptorll17aCre) and CXCR3 (k) (n = 8, WT; n = 10, Rptorll17aCre) in YFP+ cells from different organs. Data are means ± s.e.m and representative of three (a, c, i–k) or four (b, d–h) independent experiments. Numbers in plots represent frequencies of cells in gates or quadrants. Student’s t-test (two-sided) was used in h, k, or Mann-Whitney U test (two-sided) was used in b, e, f, g to determine statistical significance.
Extended Data Figure 4. Raptor deficiency induces selective phenotypic changes in fate-mapped TH17 cells.
a–g, WT and RptorIl17aCre (R26ReYFP) mice were immunized with MOG, followed by analysis of YFP+ cells from draining lymph nodes (dLN) at day 9 post-immunization. a, Frequency of YFP+ cells (n = 7 per genotype). b, Efficiency of Rptor deletion (left) (n = 7 per genotype) and flow cytometry analysis of phosphorylated S6 (S235/236) and 4E-BP1 (T37/46) (right) in YFP+ cells. c, Flow cytometry of active caspase-3 and 7-AAD staining in YFP+ cells. d, Flow cytometry analysis of CXCR3 and CCR6 expression on YFP+ cells. e, Cytokine production by YFP+ cells from draining lymph nodes (dLN) (n = 7 per genotype). f, Real-time PCR analysis of Tbx21 (n = 8 per genotype), Rorc (n = 6 per genotype), Il12rb2 (n = 7 per genotype), and Il23r (n = 7 per genotype) expression in YFP+ cells. g, Flow cytometry analysis of Foxp3 expression. h, i, Cytokine production (h, i) and proliferation (h) of YFP+ cells from dLN of the indicated mice after 4 days of stimulation with MOG alone (h) or MOG+IL-23 (i) (n = 7 per genotype). j, Sorted YFP+ cells were stimulated with IL-23 or IL-12 for 30 min in vitro and stained for specific phospho-antibodies to STAT3 (left), STAT4 (right), or isotype controls. Data are means ± s.e.m and representative of seven (a), three (b–f, j), two (g), or five (h, i) independent experiments. Numbers in plots represent frequencies of cells in quadrants; numbers within histograms represent mean fluorescence intensities. Student’s t-test (two-sided) was used in b, or Mann-Whitney U test (two-sided) was used in a, e, i to determine statistical significance.
Extended Data Figure 5. Altered gene expression profiles in Raptor-deficient cells and shared functional pathways with CD27+ TH17 cells.
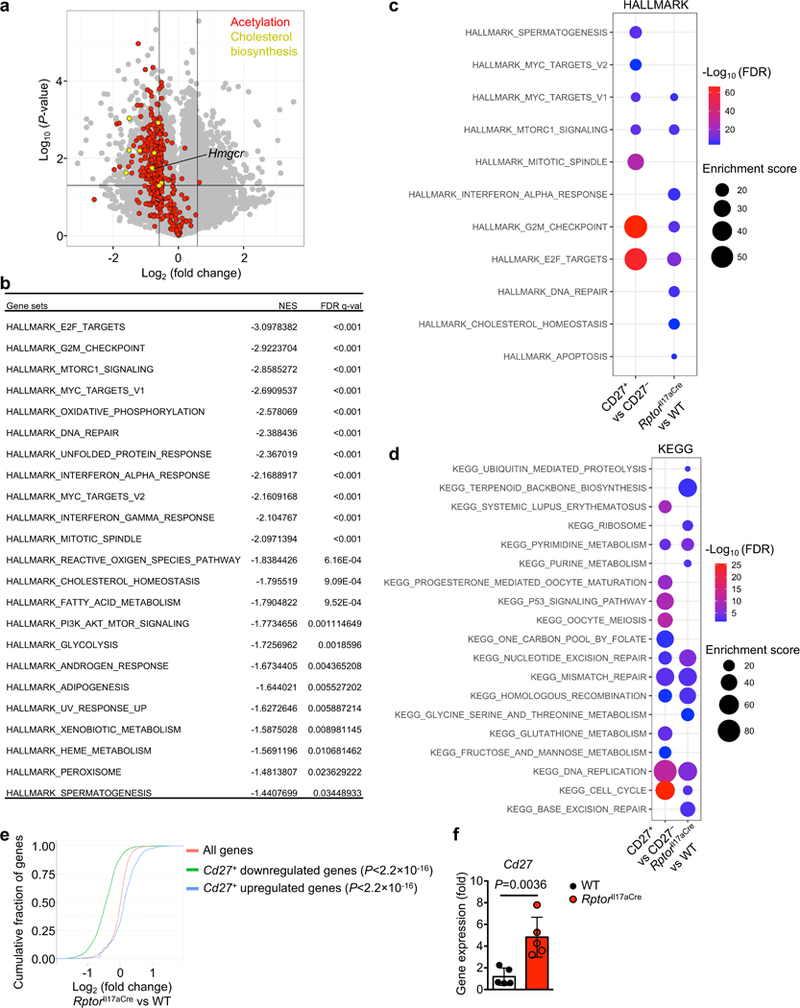
a–d, WT and RptorIl17aCre (R26ReYFP) mice were immunized with MOG, and sorted YFP+ cells from draining lymph nodes (dLN) were analyzed by microarray. a, Expression of individual genes with vertical lines indicating a 1.5 fold cutoff and a horizontal line indicating the 0.05 P-value cutoff, with gene ontology (GO) gene sets for acetylation and cholesterol biosynthesis colorized and Hmgcr indicated. b, GSEA reveals significant Hallmark gene sets downregulated in RptorIl17aCre compared to WT cells. c, d, Comparison of functional enrichment of co-regulated gene sets between RptorIl17aCre and CD27+ YFP+ cells. The downregulated genes in CD27+ compared with CD27− TH17 cells, and RptorIl17aCre compared with WT (R26ReYFP) TH17 cells (FDR < 0.05 and top 200 genes based on fold change) were used for functional enrichment using (c) Hallmark and (d) KEGG pathway gene sets. Legends indicate FDR values and enrichment scores. e, Comparison of microarray analyses of CD27+ vs CD27− and RptorIl17aCre (R26ReYFP) vs WT samples from mice at day 9 post MOG-immunization. Shown is empirical cumulative distribution function for the changes in expression (Log2 values) of all genes expressed in RptorIl17aCre (R26ReYFP) TH17 cells (red line, change relative to that in WT TH17 cells) and for subsets of genes downregulated (green line) or upregulated (blue line) by CD27+ vs CD27− (< 5% FDR) in TH17 cells. P-value is calculated by using Kolmogorov–Smirnov test. f, Real-time PCR analysis of Cd27 expression in WT and RptorIl17aCre YFP+ cells (n = 5 per genotype). Data are means ± s.e.m and from one experiment (a–e), or representative of two independent experiments (f). Student’s t-test (two-sided) was used in f to determine statistical significance.
Extended Data Figure 6. Anabolic metabolism promotes TH17 transdifferentiation into TH1-like IFNγ-producing cells.
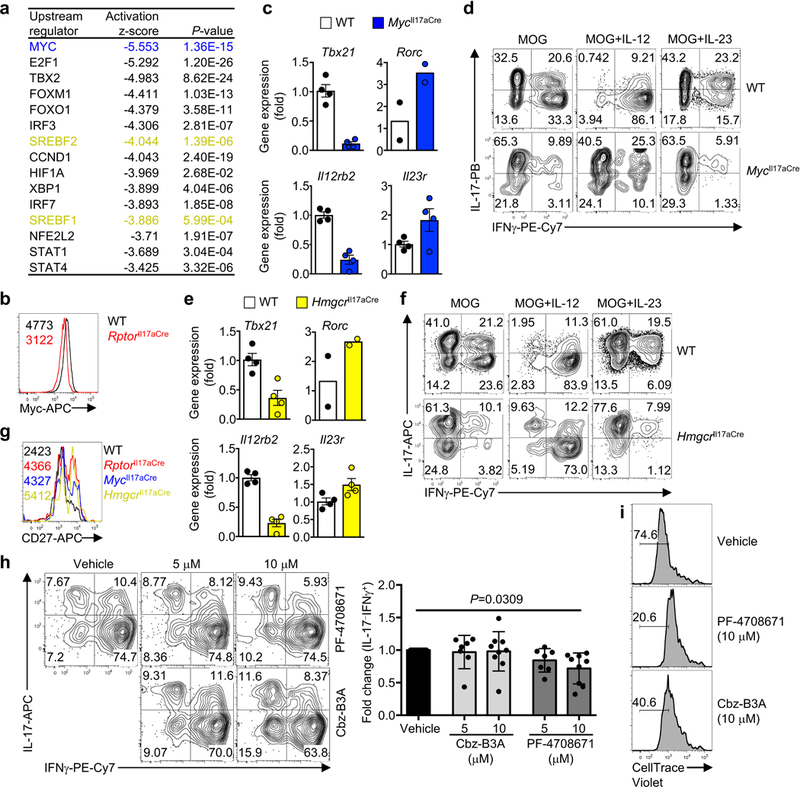
a, Ingenuity Pathway Analysis (IPA) of upstream transcriptional regulators between WT and RptorIl17aCre samples. b, WT and RptorIl17aCre (R26ReYFP) mice were immunized with MOG, and YFP+ cells from draining lymph nodes (dLN) were analyzed by flow cytometry for intracellular expression of Myc. c, d, WT and MycIl17aCre (R26ReYFP) mice were immunized with MOG, and YFP+ cells from dLN were analyzed by real-time PCR at day 9 (c) (n = 4, Tbx21; n = 2, Rorc; n = 4, Il12rb2; n = 4, Il23r), or dLN cells were cultured with MOG, MOG+IL-12, or MOG+IL-23 for 4 days for cytokine expression analysis within YFP+ cells (d). e, f, WT and HmgcrIl17aCre (R26ReYFP) mice were immunized with MOG and YFP+ cells were isolated from dLN and analyzed by real-time PCR (e) (n = 4, Tbx21; n = 2, Rorc; n = 4, Il12rb2; n = 4, Il23r), or dLN cells were cultured with MOG, MOG+IL-12, or MOG+IL-23 for 4 days for cytokine expression analysis within YFP+ cells (f). g, Flow cytometry analysis of CD27 expression on YFP+ cells from WT, RptorIl17aCre, MycIl17aCre and HmgcrIl17aCre mice at day 9 post MOG-immunization. h, i, WT (R26ReYFP) mice were immunized with MOG, and dLN cells were stimulated with MOG and IL-12 in the presence of vehicle, PF-4708671 or Cbz-B3A at indicated concentrations for 4 days for cytokine expression analysis within YFP+ cells (h; right, summary plots) (n = 9, vehicle; n = 7, PF-4708671 (5 μM); n = 9, PF-4708671 (10 μM); n = 7, Cbz-B3A (5 μM); n = 9, Cbz-B3A (10 μM)) and CellTrace dilution (i). Data are means ± s.e.m and from one experiment (a), or representative of four (b–f, h, i) or three (g) independent experiments. Numbers in plots represent frequencies of cells in gates or quadrants; numbers within histograms represent mean fluorescence intensities. Student’s t-test (two-sided; parametric) was used to determine statistical significance in h.
Extended Data Figure 7. Analysis of histone acetylation, and ATAC-Seq overview and specific gene loci.
a, ChIP qRT-PCR of pan-acetyl histone bound to the Ifng promoter of WT or RptorIl17aCre (R26ReYFP) YFP+ cells from draining lymph nodes (dLN) (n = 4 per genotype). b, c, WT and RptorIl17aCre (R26ReYFP) mice were immunized with MOG, and YFP+ cells from dLN and spleen at day 9 post-immunization were analyzed by ATAC-Seq. b, Density plot and heat maps of a representative individual ATAC-Seq sample, demonstrating separation into different fragment lengths implicating nucleosome-free, mono-nucleosome, di-nucleosome, tri-nucleosome patterns, consistent with Buenrostro et al. c, Correlation plot of nucleosome-free fragments. d, Nucleosome-free ATAC-Seq tracks at the Tbx21 and Il12rb2 gene loci, with immediate promoter regions indicated by red boxes. e, Summary of ATAC-Seq motif enrichment data showing Log2 (odds ratio) and Log10 (Fisher P-value) of cells from dLN. f, Tn5 insert sites from ATAC-Seq analysis from dLN were aligned to motifs for transcription factors from the TRANSFAC database, and the binding profiles of selected TCF-LEF family transcription factors are shown. Data are means ± s.e.m and representative of three independent experiments (a), or from one experiment (b–f). Student’s t-test (two-sided; parametric) was used in a to determine statistical significance.
Extended Data Figure 8. ATAC-Seq in-depth analyses, TCF-1 binding activity, and effects of 2-DG on cytokine expression.
a, Analysis of common regions between ATAC-Seq and ChIP-Seq peaks for TCF-LEF family and T-bet transcription factor binding motifs from spleen samples. Number of motif matches and associated Fisher’s exact test P-values and log2 (odds ratio) (positive log2 (odds ratio) values indicate that the chance of occurrence of the motif is higher in RptorIl17aCre compared to WT samples, and negative values indicate that the chance of occurrence is lower in the RptorIl17aCre group). b, Nucleosome-free ATAC-Seq tracks at the Il6ra and Lrig1 gene loci, with TCF-1 binding sites indicated by red boxes, based on the alignment with TCF-1 binding sites from published data (GEO accession numbers shown). c, ChIP assay to measure TCF-1 binding to Il6ra and Lrig1 gene loci (Il6ra, n = 2 per genotype; Lrig1, n = 6 for WT, n = 5 for RptorIl17aCre). d, Cells from dLN of the indicated mice at day 9 post MOG-immunization were cultured for 4 days with MOG and IL-12 and sorted on the YFP+ population prior to intracellular staining. Flow cytometry analysis of T-bet and TCF-1 expression in YFP+ cells from WT and MycIl17aCre (R26ReYFP) mice. e, Tn5 insert sites from ATAC-Seq analysis of YFP+ cells from PBS- or 2-DG-treated mice were aligned to motifs for transcription factors from the TRANSFAC database, and the binding profiles of selected TCF-LEF family transcription factors are shown. f, Cytokine expression in dLN YFP+ cells from MOG-immunized Il17aCre (R26ReYFP) mice after culture with MOG and IL-12 for 4 days in the presence of vehicle (PBS) or 2-DG (1 mM). g, Cytokine expression in splenic YFP+ cells from MOG-immunized Il17aCre (R26ReYFP) mice after treatment with 2-DG (2 g/kg body weight) or PBS. Numbers in plots represent frequencies of cells in gates or quadrants. Data are means ± s.e.m and from one experiment (a, b, e), or representative of three independent experiments (c, d, f, g). Student’s t-test (two-sided) was used to determine statistical significance in c.
Extended Data Figure 9. Single cell transcriptomics analysis.

WT and RptorIl17aCre (R26ReYFP) mice were immunized with MOG, and YFP+ cells were analyzed by single cell transcriptomics analysis at day 9 post-immunization. a, Individual cell cluster membership in two dimensional tSNE projections from scRNA-Seq data. b, tSNE visualization of nine clusters partitioned by unsupervised clustering. c, Frequencies of WT and RptorIl17aCre cells in different clusters (n = 3 per genotype). d, Top three enriched gene sets for each of the clusters using Hallmark, Canonical, and GO gene sets. For example, genes enriched in cluster 1 compared to other clusters were associated with proliferative events. e, Summary of cluster-specific functional enrichment analysis via Fisher’s exact test using signatures of “T-bet targets”, “late memory”, “memory TFH overlap DOWN”, “HALLMARK_GLYCOLYSIS”, “memory TFH overlap UP”, and “early memory” as described in methods. f, tSNE visualization of signature scores of “T-bet targets” and “HALLMARK_GLYCOLYSIS” expressed in individual cells. g, Violin plots of Bcl2, Cd27, and Tcf7 gene expression among the nine clusters. A violin plot combines the box plot and the local density estimation into a single display. The black bars and thin lines within the violin plots indicate the interquartile range (1st quantile – 3rd quantile) and the entire range of the data (up to 1.5 fold of interquartile range from 1st/3rd quantile), respectively, and the white dots in the center indicate the median values. Data are from one experiment (a–g) (n = 3 per genotype).
Extended Data Figure 10. Pseudotime analysis and experimental validation.
a–h, WT and RptorIl17aCre (R26ReYFP) mice were immunized with MOG, and YFP+ cells were analyzed by single cell transcriptomics analysis at day 9 post-immunization. a, Empirical dispersion and mean expression from Monocle 2, indicating genes used for temporal ordering in black; each dot represents one gene. b, Pseudotime densities for each individual cluster. For example, cluster 1 associated with the proliferative signature was in the center of the pseudotime spectrum, while clusters 2, 3 and 8 (early in pseudotime; predominantly Raptor-deficient cells) and clusters 7, and to a lesser extent, 4 and 5 (late in pseudotime; predominantly WT cells) were on the opposite end of the spectrum. c, Projection of “early memory”, “late memory”, and “T-bet targets” signature scores onto pseudotime trajectory; legend indicates relative score per cell. d, tSNE visualization of Tbx21 and Ifng gene expression. e, Tbx21 and Ifng gene expression during pseudotime; cells without gene expression for Tbx21 or Ifng were filtered out in their respective graphs. f, Pseudotime assignment for WT and RptorIl17aCre cells colorized by genotype: WT (black) and RptorIl17aCre (red); each dot represents one cell. g, Cd27 and Tcf7 gene expression across pseudotime, colorized by genotypes: WT (black) and RptorIl17aCre (red). h, tSNE visualization of Cd27 and Tcf7 expression. i, Flow cytometry analysis of T-bet expression in freshly-isolated CD27+ and CD27− cells from dLN of Il17aCre (R26ReYFP) mice at day 9 post MOG-immunization. j, Fold change of the IL-17−IFNγ+ cell percentage in MOG+IL-12-stimulated CD27+ or CD27− YFP+ cells as compared to freshly-isolated cells (n = 12). k, CD27+YFP+ cells from MOG-immunized WT and RptorIl17aCre mice were sorted and transferred into CD45.1+ hosts. The following day, CD45.1+ host mice were immunized with MOG, and four days later, YFP+ cells were analyzed by flow cytometry for surface CD27 expression (k; right, summary plots) (n = 6, WT; n = 5, RptorIl17aCre). l, CD27+YFP+ cells from MOG-immunized WT and RptorIl17aCre mice were stimulated with MOG and IL-12 for four days, followed by analysis of CD27 expression. m, TH17 cells are functionally and metabolically heterogeneous and are comprised of a subset with stemness features but lower anabolic metabolism and a reciprocal subset with higher metabolic activity that supports the transdifferentiation into TH1 cells. These two subsets are further distinguished by selective expression of transcription factors TCF-1 and T-bet, respectively, and discrete levels of CD27 expression. mTORC1 activation drives anabolic metabolism to support metabolic reprogramming favoring transcription mediated by T-bet over TCF-1, and consequently, TH17 transdifferentiation into TH1-like TH17 cells occurs. Memory/stem-like TH17 cells can become reactivated and have the potential to undergo terminal differentiation and acquire TH1-like phenotypes. Data are means ± s.e.m and from one experiment (a–h), or representative of three (i) or five (j–l) independent experiments. Numbers in plots represent frequencies of cells in gates; numbers within histograms represent mean fluorescence intensities. Mann-Whitney U test (two-sided) was used in j to determine statistical significance.
Supplementary Material
Acknowledgements.
The authors acknowledge M. Hendren and A. KC for animal work, Immunology FACS core facility for sorting, and N. Chapman and Y. Wang for editing of the manuscript. Supported by NIH (AI105887, AI101407, AI131703, CA176624 and NS064599 to H.C.; CA021765 to B.X. and Y.F.) and National Multiple Sclerosis Society (to H.C.).
Footnotes
Data availability
Transcriptome data are available via Gene Expression Omnibus under accession number GSE107521.
REFERENCES
- 1.Im SJ et al. Defining CD8+ T cells that provide the proliferative burst after PD-1 therapy. Nature 537, 417–421, doi: 10.1038/nature19330 (2016). [DOI] [PMC free article] [PubMed] [Google Scholar]
- 2.He R et al. Follicular CXCR5- expressing CD8(+) T cells curtail chronic viral infection. Nature 537, 412–428, doi: 10.1038/nature19317 (2016). [DOI] [PubMed] [Google Scholar]
- 3.Leong YA et al. CXCR5(+) follicular cytotoxic T cells control viral infection in B cell follicles. Nat. Immunol. 17, 1187–1196, doi: 10.1038/ni.3543 (2016). [DOI] [PubMed] [Google Scholar]
- 4.Gagliani N et al. Th17 cells transdifferentiate into regulatory T cells during resolution of inflammation. Nature 523, 221–225, doi: 10.1038/nature14452 (2015). [DOI] [PMC free article] [PubMed] [Google Scholar]
- 5.Lee YK et al. Late developmental plasticity in the T helper 17 lineage. Immunity 30, 92–107, doi: 10.1016/j.immuni.2008.11.005 (2009). [DOI] [PMC free article] [PubMed] [Google Scholar]
- 6.Hirota K et al. Fate mapping of IL-17-producing T cells in inflammatory responses. Nat. Immunol. 12, 255–263, doi: 10.1038/ni.1993 (2011). [DOI] [PMC free article] [PubMed] [Google Scholar]
- 7.Hirota K et al. Plasticity of Th17 cells in Peyer’s patches is responsible for the induction of T cell-dependent IgA responses. Nat. Immunol. 14, 372–379, doi: 10.1038/ni.2552 (2013). [DOI] [PMC free article] [PubMed] [Google Scholar]
- 8.Gaublomme JT et al. Single-Cell Genomics Unveils Critical Regulators of Th17 Cell Pathogenicity. Cell 163, 1400–1412, doi: 10.1016/j.cell.2015.11.009 (2015). [DOI] [PMC free article] [PubMed] [Google Scholar]
- 9.Hendriks J et al. CD27 is required for generation and long-term maintenance of T cell immunity. Nat. Immunol. 1, 433–440, doi: 10.1038/80877 (2000). [DOI] [PubMed] [Google Scholar]
- 10.Zhou X et al. Differentiation and persistence of memory CD8(+) T cells depend on T cell factor 1. Immunity 33, 229–240, doi: 10.1016/j.immuni.2010.08.002 (2010). [DOI] [PMC free article] [PubMed] [Google Scholar]
- 11.Grayson JM, Zajac AJ, Altman JD & Ahmed R Cutting edge: increased expression of Bcl-2 in antigen-specific memory CD8+ T cells. J. Immunol. 164, 3950–3954 (2000). [DOI] [PubMed] [Google Scholar]
- 12.Kalia V et al. Prolonged interleukin-2Ralpha expression on virus-specific CD8+ T cells favors terminal-effector differentiation in vivo. Immunity 32, 91–103, doi: 10.1016/j.immuni.2009.11.010 (2010). [DOI] [PubMed] [Google Scholar]
- 13.Choi YS et al. Bcl6 expressing follicular helper CD4 T cells are fate committed early and have the capacity to form memory. J. Immunol. 190, 4014–4026, doi: 10.4049/jimmunol.1202963 (2013). [DOI] [PMC free article] [PubMed] [Google Scholar]
- 14.Buck MD, Sowell RT, Kaech SM & Pearce EL Metabolic Instruction of Immunity. Cell 169, 570–586, doi: 10.1016/j.cell.2017.04.004 (2017). [DOI] [PMC free article] [PubMed] [Google Scholar]
- 15.Buenrostro JD, Giresi PG, Zaba LC, Chang HY & Greenleaf WJ Transposition of native chromatin for fast and sensitive epigenomic profiling of open chromatin, DNA-binding proteins and nucleosome position. Nat. Methods 10, 1213–1218, doi: 10.1038/nmeth.2688 (2013). [DOI] [PMC free article] [PubMed] [Google Scholar]
- 16.Choi YS et al. LEF-1 and TCF-1 orchestrate T(FH) differentiation by regulating differentiation circuits upstream of the transcriptional repressor Bcl6. Nat. Immunol. 16, 980–990, doi: 10.1038/ni.3226 (2015). [DOI] [PMC free article] [PubMed] [Google Scholar]
- 17.Xu L et al. The transcription factor TCF-1 initiates the differentiation of T(FH) cells during acute viral infection. Nat. Immunol. 16, 991–999, doi: 10.1038/ni.3229 (2015). [DOI] [PubMed] [Google Scholar]
- 18.Wirth TC et al. Repetitive antigen stimulation induces stepwise transcriptome diversification but preserves a core signature of memory CD8(+) T cell differentiation. Immunity 33, 128–140, doi: 10.1016/j.immuni.2010.06.014 (2010). [DOI] [PMC free article] [PubMed] [Google Scholar]
- 19.Muranski P et al. Th17 cells are long lived and retain a stem cell-like molecular signature. Immunity 35, 972–985, doi: 10.1016/j.immuni.2011.09.019 (2011). [DOI] [PMC free article] [PubMed] [Google Scholar]
- 20.Qiu X et al. Single-cell mRNA quantification and differential analysis with Census. Nat. Methods 14, 309–315, doi: 10.1038/nmeth.4150 (2017). [DOI] [PMC free article] [PubMed] [Google Scholar]
- 21.Zeng H et al. mTORC1 couples immune signals and metabolic programming to establish T(reg)-cell function. Nature 499, 485–490, doi: 10.1038/nature12297 (2013). [DOI] [PMC free article] [PubMed] [Google Scholar]
- 22.Nagashima S et al. Liver-specific deletion of 3-hydroxy-3-methylglutaryl coenzyme A reductase causes hepatic steatosis and death. Arterioscler Thromb Vasc Biol 32, 1824–1831, doi: 10.1161/ATVBAHA.111.240754 (2012). [DOI] [PubMed] [Google Scholar]
- 23.Zeng H et al. mTORC1 and mTORC2 Kinase Signaling and Glucose Metabolism Drive Follicular Helper T Cell Differentiation. Immunity 45, 540–554, doi: 10.1016/j.immuni.2016.08.017 (2016). [DOI] [PMC free article] [PubMed] [Google Scholar]
- 24.Yang K et al. Homeostatic control of metabolic and functional fitness of Treg cells by LKB1 signalling. Nature 548, 602–606, doi: 10.1038/nature23665 (2017). [DOI] [PMC free article] [PubMed] [Google Scholar]
- 25.Wang X et al. Transcription of Il17 and Il17f is controlled by conserved noncoding sequence 2. Immunity 36, 23–31, doi: 10.1016/j.immuni.2011.10.019 (2012). [DOI] [PMC free article] [PubMed] [Google Scholar]
- 26.Shi LZ et al. HIF1alpha-dependent glycolytic pathway orchestrates a metabolic checkpoint for the differentiation of TH17 and Treg cells. J. Exp. Med. 208, 1367–1376, doi: 10.1084/jem.20110278 (2011). [DOI] [PMC free article] [PubMed] [Google Scholar]
- 27.Pepper M et al. Different routes of bacterial infection induce long-lived TH1 memory cells and short-lived TH17 cells. Nat. Immunol. 11, 83–89, doi: 10.1038/ni.1826 (2010). [DOI] [PMC free article] [PubMed] [Google Scholar]
- 28.Bettelli E et al. Myelin oligodendrocyte glycoprotein-specific T cell receptor transgenic mice develop spontaneous autoimmune optic neuritis. J. Exp. Med. 197, 1073–1081, doi: 10.1084/jem.20021603 (2003). [DOI] [PMC free article] [PubMed] [Google Scholar]
- 29.Du X et al. Hippo/Mst signalling couples metabolic state and immune function of CD8alpha(+) dendritic cells. Nature 558, 141–145, doi: 10.1038/s41586-018-0177-0 (2018). [DOI] [PMC free article] [PubMed] [Google Scholar]
- 30.Ritchie ME et al. limma powers differential expression analyses for RNA-sequencing and microarray studies. Nucleic Acids Res. 43, e47, doi: 10.1093/nar/gkv007 (2015). [DOI] [PMC free article] [PubMed] [Google Scholar]
- 31.Subramanian A et al. Gene set enrichment analysis: a knowledge-based approach for interpreting genome-wide expression profiles. Proc Natl Acad Sci U S A. 102, 15545–15550, doi: 10.1073/pnas.0506580102 (2005). [DOI] [PMC free article] [PubMed] [Google Scholar]
- 32.Li H & Durbin R Fast and accurate short read alignment with Burrows-Wheeler transform. Bioinformatics 25, 1754–1760, doi: 10.1093/bioinformatics/btp324 (2009). [DOI] [PMC free article] [PubMed] [Google Scholar]
- 33.Robinson JT et al. Integrative genomics viewer. Nat. Biotechnol. 29, 24–26, doi: 10.1038/nbt.1754 (2011). [DOI] [PMC free article] [PubMed] [Google Scholar]
- 34.Zhang Y et al. Model-based analysis of ChIP-Seq (MACS). Genome Biol 9, R137, doi: 10.1186/gb-2008-9-9-r137 (2008). [DOI] [PMC free article] [PubMed] [Google Scholar]
- 35.Quinlan AR & Hall IM BEDTools: a flexible suite of utilities for comparing genomic features. Bioinformatics 26, 841–842, doi: 10.1093/bioinformatics/btq033 (2010). [DOI] [PMC free article] [PubMed] [Google Scholar]
- 36.Law CW, Chen Y, Shi W & Smyth GK voom: Precision weights unlock linear model analysis tools for RNA-seq read counts. Genome Biol 15, R29, doi: 10.1186/gb-2014-15-2-r29 (2014). [DOI] [PMC free article] [PubMed] [Google Scholar]
- 37.Bailey TL & Gribskov M Combining evidence using p-values: application to sequence homology searches. Bioinformatics 14, 48–54 (1998). [DOI] [PubMed] [Google Scholar]
- 38.Bailey TL et al. MEME SUITE: tools for motif discovery and searching. Nucleic Acids Res. 37, W202–208, doi: 10.1093/nar/gkp335 (2009). [DOI] [PMC free article] [PubMed] [Google Scholar]
- 39.Cuellar-Partida G et al. Epigenetic priors for identifying active transcription factor binding sites. Bioinformatics 28, 56–62, doi: 10.1093/bioinformatics/btr614 (2012). [DOI] [PMC free article] [PubMed] [Google Scholar]
- 40.Macosko EZ et al. Highly Parallel Genome-wide Expression Profiling of Individual Cells Using Nanoliter Droplets. Cell 161, 1202–1214, doi: 10.1016/j.cell.2015.05.002 (2015). [DOI] [PMC free article] [PubMed] [Google Scholar]
- 41.Yang K et al. Metabolic signaling directs the reciprocal lineage decisions of alphabeta and gammadelta T cells. Sci Immunol. 3, doi: 10.1126/sciimmunol.aas9818 (2018). [DOI] [PMC free article] [PubMed] [Google Scholar]
- 42.Zhu J et al. The transcription factor T-bet is induced by multiple pathways and prevents an endogenous Th2 cell program during Th1 cell responses. Immunity 37, 660–673, doi: 10.1016/j.immuni.2012.09.007 (2012). [DOI] [PMC free article] [PubMed] [Google Scholar]
Associated Data
This section collects any data citations, data availability statements, or supplementary materials included in this article.