

Abstract
Rationale:
Despite multiple trials of interventions to improve end-of-life care of the critically ill, there is a persistent lack of understanding of factors associated with barriers to decision-making at the end of life.
Objective:
To apply the principles of complexity science in examining the extent to which transitions to end-of-life care can be predicted by physician, family, or patient characteristics; outcome expectations; and the evaluation of treatment effectiveness.
Methods:
A descriptive, longitudinal study was conducted in 3 adult intensive care units (ICUs). Two hundred sixty-four family surrogates of patients lacking decisional capacity and the physicians caring for the patients were interviewed every 5 days until ICU discharge or patient death.
Measurements:
Characteristics of patients, physicians, and family members; values and preferences of physicians and family; and evaluation of treatment effectiveness, expectations for patient outcomes, and relative priorities in treatment (comfort vs survival). The primary outcome, focus of care, was categorized as (1) maintaining a survival orientation (no treatment limitations), (2) transitioning to a stronger palliative focus (eg, some treatment limitations), or (3) transitioning to an explicit end-of-life, comfort-oriented care plan.
Main Results:
Physician expectations for survival and future cognitive status were the only variables consistently and significantly related to the focus of care. Neither physician or family evaluations of treatment effectiveness nor what was most important to physicians or family members was influential.
Conclusion:
Lack of influence of family and physician views, in comparison to the consistent effect of survival probabilities, suggests barriers to incorporation of individual values in treatment decisions.
Keywords: end of life, critically ill, complexity science
Introduction
There is strong national and international consensus about the great need to identify approaches to improve the delivery of end-of-life care in the intensive care unit (ICU).1–5 Despite decades of study, there continue to be concerns about prolonged use of ineffective therapies, resulting in suffering of both patients and families, as well as moral distress of clinicians. The situation of the chronically critically ill, with long stays in the ICU and uncertain prognoses, presents particular challenges in identifying the appropriate criteria and time for transitioning to a stronger focus on palliation and end-of-life measures.6,7
There have been several important tests of interventions designed to improve care and decision-making at the end of life.8–14 However, most have focused on component parts of the critical care system such as attitudes of physicians, educational needs of the staff, access to palliative care experts or ethics consultation, or communication structures. Most studies that have aimed to help us understand influences on decision-making have been cross-sectional and retrospective reports or have used hypothetical vignettes to assess preferences and attitudes.
Our purpose of the study was to apply the principles of complexity science in examining how factors that influence decisions about transitions in care actually interact.15 Much of the research in end-of-life decision-making has reflected assumptions that the critical care environment is a mechanistic system with cause and effect dynamics that are stable across time. Yet, critical care clinicians recognize that decision-making around goals of care and aggressiveness of treatment plans are sensitive to multiple inputs, including changes in patient condition, preferences of families that may change over time, and guidance and counseling from clinicians.
Complexity science offers a framework for understanding phenomena (eg, treatment decisions about goals of care) that demonstrate large variations, occurring within systems (eg, the ICU). Traditional theories assume organizations are composed of interacting parts that follow stable rules and exhibit predictable patterns of influence, discoverable through linear analysis. Once one has correctly identified the relevant variables, outcomes can be achieved through consistent application of guidelines and role expectations.16 Complexity theory, in contrast, views organizations as dynamic, living social systems. Although the system is bounded by a common purpose (eg, caring for critically ill patients), the human agents (eg, doctors, nurses, patients, families, etc) are constantly interacting, exchanging information, and adjusting their behavior.17 Adopting the mental map of complexity science requires us to examine the system as an integrated whole in constant flux.
The ICU, viewed from the lens of complexity theory, is a complex adaptive system, dynamic and nonlinear, in which interactive processes (establishing goals of care and reaching decisions about the use of aggressive interventions and levels of treatment limitation) occur. These processes are sensitive to both initial or antecedent conditions (ie, the characteristics of patients, families, and clinicians) and evolving behaviors. Thus, relationships and associations among variables change as new input is received and behavior adapts. Application of a complexity framework is expected to yield a deeper understanding of how families and clinicians reach decisions about the focus or goals of care.
Our primary end point was focus of care at the end of ICU treatment, categorized as no limitations, some limitations, or a full comfort care orientation. Our overall aim was to explore how antecedent characteristics of patients and families and processes reflecting values and assessments of treatment effectiveness exert varying influence over time. Consistent with complexity science, our hypothesis was that a combination of antecedent factors and process elements would be significant predictors of the focus of care and that these relationships would change over time.
Methods
Design
This was a descriptive correlational study. Critical care intensivists and family surrogates of eligible patients were surveyed regarding values, expectations, and evaluation of treatment effectiveness on the third to fifth day of the ICU patient’s stay and every 5 days until ICU discharge or death. At each time point, the focus of care was documented from the medical record. The study was approved by the institutional review board of University Hospitals Case Medical Center.
Participants
This study took place in 3 adult ICUs (medical, surgical, and neuroscience) in University Hospitals Case Medical Center, a 950-bed tertiary academic institution. All ICUs were staffed by intensivists, fellows, residents, and nurse practitioners. Surgeons retained primary responsibility for their patients but relied on the intensivists for managing day-to-day care. The intensivists with primary responsibilities for care of the patients were interviewed for the study.
Family surrogates were eligible for enrollment if they were the identified decision-maker for a patient who lacked capacity for decision-making and who was not expected to be discharged from the ICU within the next 48 hours. In addition, the surrogate had to be over 18 years of age, English-speaking, and available for interviews. Although we were primarily interested in decisions for patients who progressed to states of chronic critical illness, we sought to identify patients who were not following the more typical trajectory of 2-to 3-day stays early in their ICU course in order to examine changes over time from the start of their stay.
Measures
Consistent with complexity theory, 3 categories of variables were measured—antecedent (preexisting) characteristics of patients, family, and all physicians; process elements (expectations, evaluation of treatment); and outcomes (focus of care and what was most important in making decision; see Figure 1 for study model). Patient characteristics included demographic data, admission diagnosis, Acute Physiology and Chronic Health Evaluation III, Charlson comorbidity scores, and length of stay. All tools have been used in ICU populations with excellent psychometric properties.18–21
Figure 1.
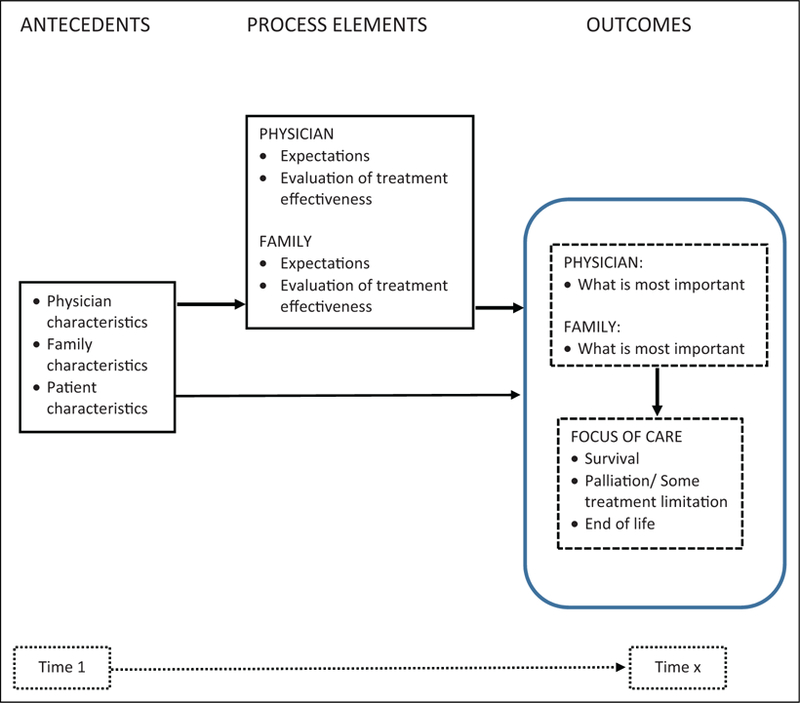
Summarized study model.
In addition to demographics, the personal values of all physicians and family members were measured in a variety of ways. At enrollment, we presented 2 brief hypothetical vignettes to the physician, asking him/her to rank order, if he or she were the decision-maker for a family member in the situation described, the relative importance of survival probability, future functional status, future cognitive ability, the patient’s likely perception of the quality of life, and any previously expressed wishes. The vignettes were pilot tested with ICU physicians prior to the study to establish face validity. Clinical vignettes were not used with family members, but at enrollment, they were asked, ‘‘what guides your treatment decision-making for your loved one,’’ using the same 5 potential factors used in the physician vignettes.
Following enrollment, at each time point, physicians were asked, ‘‘regarding medical decisions for your patient, what is most important to you right now?’’ using a visual analog scale (VAS) anchored at ‘‘comfort/quality of life’’ at one end and ‘‘survival, length of life’’ at the other. Family values regarding what was most important in making decisions were similarly measured using the VAS.
Physician and family outcome expectations were measured by asking each participant to indicate expectations for 6 months in the future for survival (very unlikely, not likely, probable, or very likely), cognitive status (fully impaired, mild or moderate impairment, or intact), ventilator dependence (partial or fully dependent vs completely independent), and functional status (completely dependent in activities of daily living, partially dependent, or completely independent).22 Treatment effectiveness was evaluated by both physicians and family by asking, ‘‘Right now, how well do you think the treatment plan is working?’’ Response options were not at all effective, somewhat effective, mostly effective, or very effective.
The primary outcome, focus of care, was categorized at each time point as 1 of the 3 levels—(1) maintaining a survival orientation (no treatment limitations, proceeding with long-term care interventions such as tracheostomy or hemodialysis), (2) transitioning to a stronger palliative care focus (instituting some explicit treatment limitations, such as a Do Not Attempt Resuscitation order or no increase in vasopressors, and/or initiating a formal palliative care consultation), or (3) transitioning to an explicit end-of-life, comfort-oriented plan (withdrawal of life-sustaining interventions, cessation of all diagnostic tests, and/or hospice referral).
Procedure
Research assistants made rounds every day in the 3 study ICUs and identified eligible patients. Data were collected every 5 days, until ICU discharge or patient death. Physician data were collected within 24 hours of the time of family data collection. Because there was ongoing variation in the physicians who were caring for the patient on the day of data collection, each physician was assigned a unique identification number in order to allow analysis of the influence of the rotation pattern on changes in focus of care over time.
Analysis
In this analysis, we focused on the outcome of primary interest, focus of care, and secondarily, identification of what was important to families and physicians. All analyses were performed using SPSS statistical software (version 22). Model building and testing were performed using structural equation modeling (SEM). The SEM program, AMOS (analysis of moment structures), was used to develop the models and to assess longitudinal data over time—specifically an autoregressive cross-lagged effect model. Autoregressive models refer to the process of regressing a measure at 1 time point on its previous time point value. Autoregressive models were tested and did not fit the data well. As the same measures were not linked together over time, alternative models were developed for time 1, time 2, and time 3 periods separately. The development and testing of different models at different time points are consistent with the theoretical framework of complexity theory. For all analyses, a 2-sided P value < .05 was considered to be statistically significant.
Structural equation models were assessed using goodness-of-fit indices—Tucker-Lewis Index >.90, comparative fit index >.90, and root mean square error of approximation <.08. Any variable in the model with a standardized β associated with P < .05 was considered to be statistically significant and left in the model.
Results
Figure 2 shows screening and sample enrollment. With attrition from transfer and death, 264 participants were included at T1, 152 participants at T2, and 75 participants at T3. Demographic and clinical characteristics for patients, family, and physicians are shown in Table 1. (Additional tables showing the process variables [expectations and rating of what was most important] are provided in Appendix A.)
Figure 2.
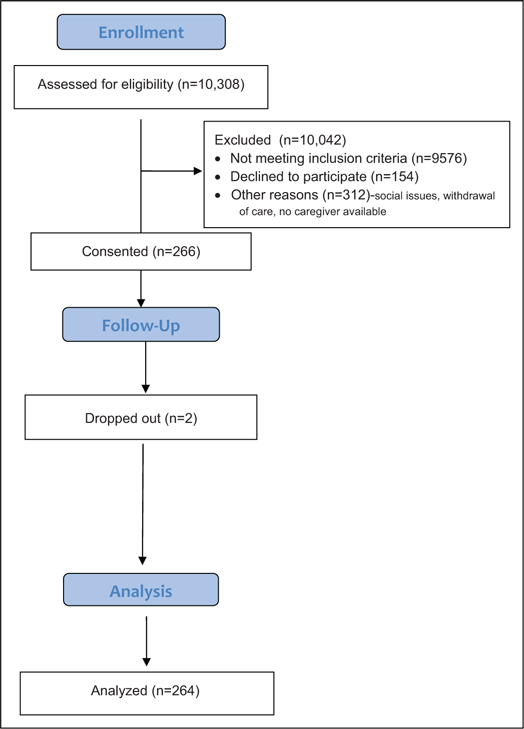
Study enrollment.
Table 1.
Patient, Family, and Physician Characteristics.
| n (%) |
Mean (SD) |
||
|---|---|---|---|
| Patients | |||
| Age, years | 61.2 (15.4) | ||
| ICU LOS, days | 14.0 (8.2) | ||
| Hospital LOS | 22.4 (14.7) | ||
| Charlson comorbidity | 4.1 (2.67) | ||
| APACHE II | 20.97 (8.67) | ||
| Gender: male | 145 (54.9) | ||
| Race: Caucasian | 177 (67.3) | ||
| ICU | |||
| MICU | 92 (34.8) | ||
| SICU | 78 (29.5) | ||
| Neuro | 94 (35.6) | ||
| Primary diagnosis | |||
| Cardiovascular | 40 (15.2) | ||
| Neurologic | 95 (36) | ||
| Respiratory | 54 (20.5) | ||
| Infection/sepsis | 29 (11) | ||
| Gastrointestinal | 23 (8.7) | ||
| Other | 23 (8.7) | ||
| Living will: yes | 89 (33.7) | ||
| DNAR at any time: yes | 36 (13.6) | ||
| Hospital discharge disposition | |||
| Died | 72 (27.3) | ||
| Hospice | 14 (5.3) | ||
| LTAC/Rehab/SNF | 142 (53.8) | ||
| Home | 36 (13.6) | ||
| Status at 3 months | |||
| Died | 117 (52) | ||
| LTAC/Rehab/SNF | 43 (19.2) | ||
| Home | 68 (30.4) | ||
| Lost to follow-up | 36 | ||
|
Family decision-maker | |||
| Age, years | 55.3 (13.3) | ||
| Gender: male | 62 (23.5) | ||
| Relationship | |||
| Spouse | 107 (40.5) | ||
| Child | 83 (31.4) | ||
| Other | 74 (28) | ||
| Religion | |||
| Catholic | 58 (22) | ||
| Protestant | 121 (45.8) | ||
| Jewish | 7 (2.7) | ||
| Other | 39 (14.8) | ||
| No affiliation | 39 (14.8) | ||
|
Physicians (n = 57) | |||
| Age, years | 35.5 (7.9) | ||
| Years in practice | 6.3 (5.9) | ||
| Years in ICU practice | 6.0 (6.9) | ||
| Value rankings: vignette 1a | |||
| Survival | 4.2 (1.3) | ||
| Cognitive ability | 3.1 (1.2) | ||
| Functional status | 3.0 (1.1) | ||
| Previous wish to avoid dependence | 2.3 (1.4) | ||
| Patient’s perception of QOL | 2.3 (1.3) | ||
| Value rankings: vignette 2 | |||
| Survival | 4.1 (1.3) | ||
| Cognitive ability | 3.0 (1.1) | ||
| Functional status | 3.0 (1.2) | ||
| Previous wish to avoid dependence | 2.4 (1.5) | ||
| Patient’s perception of QOL | 2.3 (1.3) | ||
| Gender: male | 41 (71.9) | ||
| Race | |||
| Caucasian | 33 (57.9) | ||
| Asian | 9 (15.8) | ||
| Other | 15 (26.4) | ||
| Religion | |||
| Catholic | 11 (19.3) | ||
| Protestant | 11 (19.3) | ||
| Jewish | 4 (7.0) | ||
| Muslim | 9 (15.8) | ||
| Other | 7 (12.3) | ||
| None | 15 (26.3) | ||
Abbreviations: APACHE II, Acute Physiology and Chronic Health Evaluation II; ICU, intensive care unit; LOS, length of stay; LTAC, long-term acute care; MICU, medical intensive care unit; QOL, quality of life; SD, standard deviation; SICU, surgical intensive care unit; DNAR, do not attempt to resuscitate; SNF, skilled nursing facility.
Physicians were asked to rank order the importance (5 = most important, 1 = least important) of 5 factors if he/she was the decision-maker for his/her relative. Vignette 1 described an 82-year-old grandmother, class II heart failure, intubated in ICU for 10 days with pneumonia. Vignette 2 described 58-year-old brother of the respondent, craniotomy following ruptured intracerebral aneurysm, intubated for 10 days, with dense hemiparesis.
Because there was great variability in which intensivist responded to the questions at each time point, we examined the extent to which inconsistency influenced the model. In order to do this, we identified cases (n = 43) in which there was consistency in the physician caring for the patient between time 1 and time 2 or between time 2 and time 3. No patients had the same ICU physician at all 3 time points. Models were built with these 43 cases and compared to models built with the full sample. There were no significant differences and the analyses reported here used all data.
Physician Antecedents and Process Variables
The next steps focused on examining paths involving physician antecedent and process elements. Given the small numbers of patients still in the ICU at time point 4 (~20 days) and beyond, we confined analyses to the first 3 time points (ICU days: 3–16). There were both a number of inconsistencies and some stable paths. In terms of antecedent characteristics and values, no physician characteristic (eg race, years in practice, etc) was influential on expectations, evaluation of treatment, or focus of care at all 3 time points. Physician race and years in practice were related to process elements but not in a consistent fashion over time.
In terms of the primary end point, the physician’s expectations for survival and cognitive status were the only consistent predictors of the focus at all time points. Survival was the strongest influence at T1 (β = −.32) and T2 (β = −.36) and second strongest at T3 (β = −.31), in the expected direction. That is, estimates of greater likelihood of survival were associated with greater likelihood of maintaining a focus on survival with no treatment limitations. Ratings of what each physician believed was most important in making decisions (quality of life vs length of life) had no significant influence at any time point.
Examining the process variables, the patient’s comorbidity score was the only variable with a significant path to survival expectation at all 3 time points (β = −.18, −.19, −.26 at T1, T2, and T3, respectively), again in the expected direction, with lower comorbidities associated with estimates of more probable survival. In turn, expectation for survival was the only consistent element that influenced the evaluation of treatment effectiveness across time (β = .42, .37, and .60 at T1, T2, and T3, respectively). The greater the predicted likelihood of survival, the more positive the evaluation of effectiveness. In terms of what was most important to the physician in making medical decisions, only expectations for future functional status and the patient’s Charlson score were consistent influences.
Family Variables
The third and final step was to add the family process variables and examine the extent to which these influenced the earlier models. Figures 3 and 4 show the final models for T1 and T2, only paths that were statistically significant remained in the models. Both models met all criteria for good fit. At T3, the data did not produce a good fitting model (χ2 = 79.15; df = 45; P = .001; TLI = .74; CFI = .85; RMSEA = .05). This may have been related to the decreasing sample size at T3.
Figure 3.
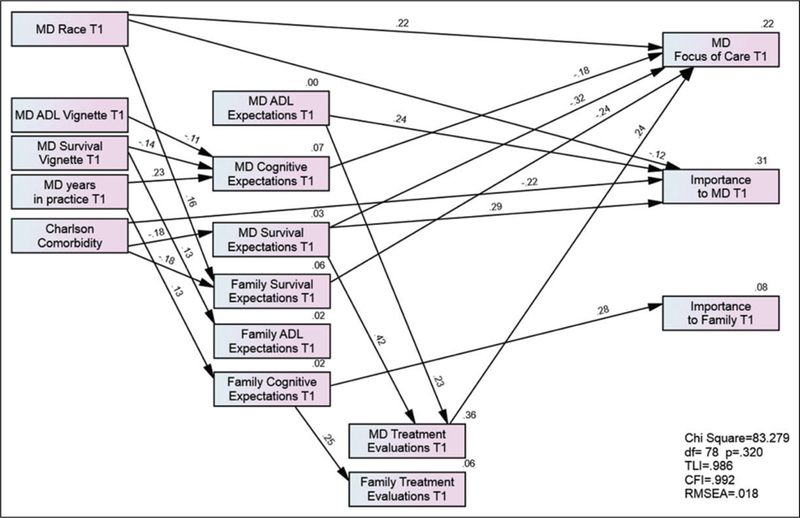
Time 1 model. Arrows represent significant paths (P < .05). Numbers above arrows are β weights; negative numbers indicate inverse relationships. ‘‘Focus of care’’ was scored as 1 = survival, 2 = some limitations, 3 = explicit end-of-life focus. ‘‘Importance’’ was rated with a visual analog scale, 0 = comfort, quality of life and 100 = survival, length of life. All expectations questions were scored with a 4-point scale, with higher numbers reflecting higher probability of a good outcome.
Figure 4.
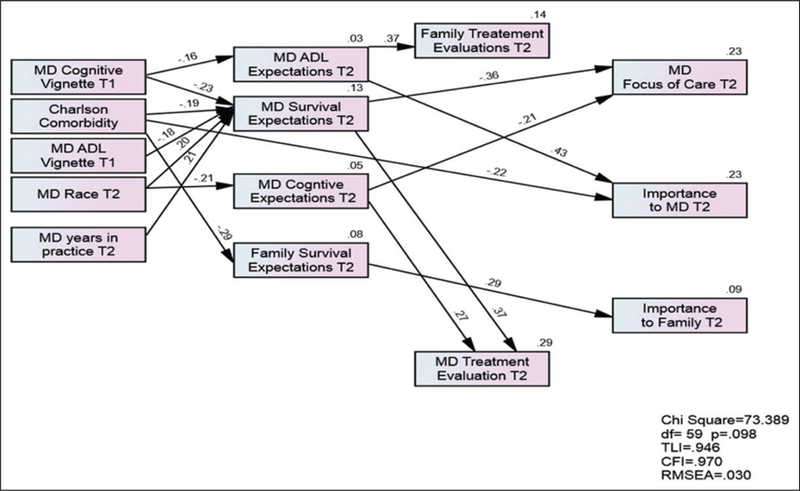
Time 2 model. Arrows represent significant paths (P < .05). Numbers above arrows are β weights; negative numbers indicate inverse relationships. ‘‘Focus of care’’ was scored as 1 = survival, 2 = some limitations, 3 = explicit end-of-life focus. ‘‘Importance’’ was rated with a visual analog scale, 0 = comfort, quality of life and 100 = survival, length of life. All expectations questions were scored with a 4-point scale, with higher numbers reflecting higher probability of a good outcome.
Focus of care at T1 was influenced by several physician variables (race [β = .22], physician expectation for cognitive status [β = −.18], survival expectations of physicians [β = −.32], and physician evaluation of treatment effectiveness [β = −.32]). In the final model at T2, the MD survival expectation remained the strongest predictor (β = .36) of the primary outcome, focus of care. Physician expectations for cognitive recovery were also influential but less so.
The only family variable to remain anywhere in the model at T2 was the family’s expectation for survival, which influenced what was important to the family (β = .25), but not the focus of care. At no time did family variables show a significant relation to MD expectations, what was important to the MD, nor the MDs evaluation of treatment effectiveness.
Discussion
The fundamental assumptions behind this study design were that specific decisions about the aggressiveness or focus of care are determined by an evolving complex interplay of many factors. These include the initial (antecedent) characteristics and values of all physicians caring for the patient, the preferences and values of the family surrogate, and the characteristics of the patient (comorbidities, age). In particular, previous research has suggested patterns of treatment limitation may be related to demographic characteristics of physicians.23–25 These antecedent factors were expected to interact and influence expectations for the patient outcomes, evaluation of treatment effectiveness, and identification of what was most important in the care of the patient. Combined, these antecedent and process factors were hypothesized to explain variation in decisions about aggressiveness of the treatment plan.
Not surprisingly, of all factors, expectation for survival was the most important predictor of the focus of care. The central mission of critical care is to preserve lives, and the expectations for probability of survival are understandably tied to treatment plans that use all available means to meet this goal.26 However, there are a number of questions raised by the lack of influence of other variables.
First, it is concerning that neither the outcome that was most important to physicians nor the outcome identified by the family members as most important were significantly related to focus of care. Possibly, the power of the normative expectation that critical care units must promote survival is so strong that it simply is overwhelmed by any other factors that could direct treatment decision-making. In addition, there may be strong barriers to the decision process itself that interfere with the recognition and evaluation of alternative goals of care.4 The very fast paced environment and constantly changing nurse and physician providers, pressures to ensure the ICU is operating efficiently, and the emotional stresses on family members all could interfere with both conscious appraisals of one’s values, as well as opportunities to discuss and reevaluate goals of care. Nonetheless, the situation of directing care that reflects one primary value (survival) while one personally believes another value (comfort, quality of life) is more important, creates the potential for discomfort and possibly significant moral distress.
The relatively weak influence of family values that we found is similar to the report of Turnbull et al in their Web-based randomized trial of the effect of varying prognoses and value statements on intention to discuss withdrawal of life-sustaining treatments (LSTs).27 There was no difference in willingness to discuss withdrawal between the group informed that the patient would not want to continue LST if there was low probability of return to independence and the group that was told the patient would want LST even if it meant eventual dependency in a nursing home. In our real-world study, we do not know how well informed the physicians were regarding what was important to families, but the similarity of our results to those of Turnbull et al suggests barriers to formally incorporating these values in treatment planning.
In the normal course of critical care, an assessment that a treatment plan is not effective should not immediately trigger changing goals—more likely, it would stimulate exploring other approaches or additional diagnostic testing. In addition, the metric for ‘‘effectiveness’’ likely was quite varied among participants and may have ranged from straightforward physiologic effectiveness to probability of a good quality of life. However, our results do indicate that even the perception well into the ICU stay (ie, day 10) that the plan is not very effective fails to alter the priority of the goal of survival.
Since the landmark SUPPORT study, trials of proactive ethics consultation, systematic inclusion and documentation of goals of care discussions, and improvements in communication and family meetings have not shown any consistent effect on intensity of interventions, length of stay, or resource use.8–14,28 In contrast to these earlier studies, Curtis et al recently reported positive results from the use of ‘‘ICU communication facilitators,’’ demonstrating significantly reduced length of stay and cost of care in a small subsample of patients dying in the ICU.29 If their results can be replicated in larger samples, this may point to a mechanism for helping to assure that decisions about care are consistent with patient values.
Our study had some important limitations. First, responses to value-laden questions about what was important may reflect response bias and the influence of social desirability. Family members also might have been reluctant to reveal an expectation for poor outcomes for fear of giving up hope. Although we were asking what was important to the individual respondent, we do not know whether responses reflected either the physician’s or family member’s own personal values or an internalization of what the respondent thought the patient’s values were. Although normatively it is the patient’s values that should direct decisions, our aim was to measure what the actual decision-makers identified as drivers of decisions, regardless of the source of the value. In addition, we confined our data collection to the intensivists and 1 family member per patient. There was undoubtedly strong influence from other physicians, particularly the patient’s surgeon, various consultants, primary care physicians, or other family members. Differences in these additional inputs may have had varying strengths or types of influence on decisions in the different ICUs but could not be readily measured.
The use of the VAS to indicate relative value of comfort and quality of life has not been used before, but it is similar in concept to the rating scales used by others.30,31 For example, in the CONNECT study of preferences of patients with cancer, the investigators asked patients to indicate, among 5 choices, whether quality of life was all that mattered in terms of outcomes, whether quality and length of life both mattered but quality was more important, whether they were equally important, both mattered but length of life was more important, or whether length of life was all that mattered. Our use of the VAS essentially presented respondents with the same options but in a different format.
We recognize that the data from later time points represented a somewhat skewed subsample. That is, some patients died between time points and some of these deaths were likely associated with explicit changes in goals and focus of care. These transitions would not have been captured if the patient died before the next time point. Because of this, the patients who were still in the ICU at 10 days and beyond were some-what more likely to be those for whom there was consensus to maintain a focus on survival. However, the participants who were censored from earlier time points included both patients who died despite the use of all aggressive interventions and patients whose deaths followed decisions to change the focus to care to a comfort-oriented plan so the later samples continued to include family surrogates with a variety of preferences and values.
The medical record was used to abstract some data, including presence of treatment limitation orders. Because data were obtained prospectively and confirmed by talking with the treatment team, the likelihood of error was reduced. Nevertheless, using explicit treatment limitation orders, rather than interviews of physicians, may have underestimated the presence of intentions to place limitations on aggressive interventions if the patient’s condition deteriorated.
Finally, because this study was conducted in 1 US hospital, generalizability, particularly to other countries, is limited. In addition, because of attrition at the later time points, the analyses were somewhat underpowered for T3 and T4. Thus, it is possible that with a larger sample, some of the antecedent and process variables might have retained some influence on the outcome, though less than the consistent strength of survival expectations.
Despite these limitations, we believe that this study provides important insights into the dynamic process of decision-making in the real world and demonstrates the persistent power of a culture that prioritizes length of life over quality of life. Given the dynamic complexity of the ICU environment, making improvements in the quality of ICU care patients receive at the end of their lives, reducing the potential for moral distress among ICU clinicians, and supporting family members in their decision-making role are likely to require major redesign. Without consistent, formally sanctioned, and imbedded processes to assure that values of patients and families are solicited and incorporated with frequent explicit discussion of likely outcomes, changing the pattern we observed will be difficult.
Acknowledgments
Funding
The author(s) disclosed receipt of the following financial support for the research, authorship, and/or publication of this article: This research was funded by the National Institute of Nursing Research, R01NRO13322.
Appendix A
Table A1.
MD Process Variables.
| MD Process Variables | Time 1, n (%) |
Time 2, n (%) |
Time 3, n (%) |
|---|---|---|---|
| Focus of care | |||
| Maintain cure or survival | 223 (87.5) | 137 (88.4) | 68 (87.2) |
| Specific limitations | 21 (8.2) | 13 (4.9) | 4 (1.5) |
| Survival expectations | |||
| Very unlikely | 26 (10.3) | 17 (11.0) | 7 (9.1) |
| Not likely | 54 (21.3) | 31 (20.0) | 16 (20.8) |
| Probable | 107 (42.3) | 73 (47.1) | 39 (50.6) |
| Very likely | 66 (26.1) | 34 (21.9) | 15 (19.5) |
| ADL expectations | |||
| Completely dependent/bedridden | 71 (28.3) | 43 (28.1) | 18 (23.4) |
| Partially dependent | 127 (50.6) | 83 (54.2) | 46 (59.7) |
| Completely independent | 53 (21.1) | 27 (17.6) | 13 (16.9) |
| Cognitive status expectations | |||
| Completely impaired (PVS/coma) | 24 (9.6) | 15 (9.8) | 9 (11.5) |
| Mild or moderate impairment | 154 (61.6) | 94 (61.4) | 48 (61.5) |
| Completely intact | 72 (28.8) | 44 (28.8) | 21 (26.9) |
| Ventilator expectations | |||
| Partially/fully dependent | 76 (30.2) | 58 (38.2) | 28 (36.8) |
| Completely independent | 176 (69.8) | 94 (61.8) | 48 (63.2) |
| Evaluation of treatment effectiveness | |||
| Not at all effective | 10 (3.9) | 10 (6.5) | 1 (1.3) |
| Somewhat effective | 114 (44.7) | 61 (39.4) | 34 (43.6) |
| Mostly effective | 92 (36.1) | 59 (38.1) | 35 (44.9) |
| Very effective | 39 (15.3) | 25 (16.1) | 8 (10.3) |
Abbreviation: ADL, activities of daily living; PVS, persistent vegetative state.
Table A2.
Family Surrogate Process Variables.
| Family Surrogate Process Variables |
Time 1, n (%) |
Time 2, n (%) |
Time 3, n (%) |
|---|---|---|---|
| Survival expectations | |||
| Very unlikely | 8 (3.1) | 8 (5.8) | 2 (3.3) |
| Not likely | 18 (7.0) | 12 (8.7) | 3 (5.0) |
| Probable | 92 (35.8) | 47 (34.1) | 26 (53.3) |
| Very likely | 139 (54.1) | 71 (51.4) | 29 (48.3) |
| ADL expectations | |||
| Completely dependent/bedridden | 28 (10.9) | 22 (15.6) | 8 (12.9) |
| Partially dependent | 142 (55.3) | 85 (60.3) | 40 (64.5) |
| Cognitive status expectations | |||
| Completely impaired (PVS/coma) | 10 (3.9) | 9 (6.3) | 3 (4.8) |
| Mild or moderate impairment | 116 (45.3) | 78 (54.9) | 32 (51.6) |
| Completely intact | 130 (50.8) | 55 (38.7) | 27 (43.5) |
| Ventilator expectations | |||
| Partially/fully dependent | 14 (5.5) | 14 (10.1) | 5 (8.1) |
| Completely independent | 241 (94.5) | 125 (89.9) | 57 (91.9) |
| Evaluation of treatment effectiveness | |||
| Not at all effective | 6 (2.3) | 3 (2.1) | 3 (4.8) |
| Somewhat effective | 83 (32.0) | 40 (28.2) | 15 (23.8) |
| Mostly effective | 82 (31.7) | 61 (43.0) | 30 (47.6) |
| Very effective | 88 (34.0) | 38 (26.8) | 15 (23.8) |
Abbreviation: ADL, activities of daily living; PVS, persistent vegetative state.
Table A3.
What Was Most Important to Physician and Family (0 = Quality of Life, 100 = Length of Life).
| Time 1: M (SD [range]) | Time 2: M (SD [range]) | Time 3: M (SD [range]) | |
|---|---|---|---|
| MD: To you | 54.53 (27.83 [0–100]) | 55.21 (26.19 [0–100]) | 45.81 (23.59 [0–93]) |
| MD: To your patient’s family | 67.66 (24.52 [0–100]) | 65.53 (24.73 [0–100]) | 60.28 (24.03 [0–100]) |
| Family: To you | 54.75 (37.79 [0–100]) | 56.15 (35.22 [0–100]) | 52.70 (36.72 [0–100]) |
Abbreviations: M, mean; SD, standard deviation.
Footnotes
Declaration of Conflicting Interests
The author(s) declared no potential conflicts of interest with respect to the research, authorship, and/or publication of this article.
References
- 1.Truog RD, Cist AF, Brackett SE, et al. Recommendations for end-of-life care in the intensive care unit: the ethics committee of the society of critical care medicine. Crit Care Med 2001;29(12): 2332–2348. [DOI] [PubMed] [Google Scholar]
- 2.Approaching Death: Improving Care at the End of Life Washington, DC: National Academies Press; 1997. [PubMed] [Google Scholar]
- 3.Levy M, Curtis JR. Improving end-of-life care in the intensive care unit. Crit Care Med 2006;34(11): S301. [DOI] [PubMed] [Google Scholar]
- 4.Visser M, Deliens L, Houttekier D. Physician-related barriers to communication and patient- and family-centred decision-making towards end of life in intensive care: a systematic review. Crit Care 2014;18(6):604. [DOI] [PMC free article] [PubMed] [Google Scholar]
- 5.Myburgh J, Abillama F, Chiumello D, et al. ; Council of the World Federation of Societies of Intensive and Critical Care Medicine. End-of-life care in the intensive care unit: report from the Task Force of World Federation of Societies of Intensive and Critical Care Medicine. J Crit Care 2016;34:125–130. [DOI] [PubMed] [Google Scholar]
- 6.Kahn JM, Le T, Angus DC, et al. The epidemiology of chronic critical illness in the United States. Crit Care Med 2015;43(2): 282–287. [DOI] [PMC free article] [PubMed] [Google Scholar]
- 7.Curtis JR, Rubenfeld GD. Managing Death in the ICU New York, NY: Oxford University Press; 2000. [Google Scholar]
- 8.Campbell ML, Guzman JA. Impact of a proactive approach to improve end-of-life care in a medical ICU. Chest 2003;123(1): 266–271. [DOI] [PubMed] [Google Scholar]
- 9.Schneiderman LJ, Gilmer T, Teetzel HD. Impact of ethics consultations in the intensive care setting: a randomized, controlled trial. Crit Care Med 2000;28(12):3920–3924. [DOI] [PubMed] [Google Scholar]
- 10.Lilly CM, De Meo DL, Sonna LA, et al. An intensive communication intervention for the critically ill. Am J Med 2000;109(6): 469–475. [DOI] [PubMed] [Google Scholar]
- 11.Lilly CM, Sonna LA, Haley KJ, Massaro AF. Intensive communication: four-year follow-up from a clinical practice study. Crit Care Med 2003;31(5 suppl):S394–S399. [DOI] [PubMed] [Google Scholar]
- 12.Daly B, Douglas S, O’Toole E, et al. Effectiveness trial of an intensive communication structure for families of long-stay ICU patients. Chest 2010;138(6):1340–1348. doi: 10.1378/chest.10-0292. [DOI] [PMC free article] [PubMed] [Google Scholar]
- 13.Ahrens T, Yancey V, Kollef M. Improving family communications at the end of life: implications for length of stay in the intensive care unit and resource use. Am J Crit Care 2003; 12(4):317–323. [PubMed] [Google Scholar]
- 14.Curtis JR, Nielsen EL, Treece PD, et al. Effect of a quality-improvement intervention on end-of-life care in the intensive care unit: a randomized trial. Am J Respir Crit Care Med 2011;183(3): 348–355. [DOI] [PMC free article] [PubMed] [Google Scholar]
- 15.Higgins JP. Nonlinear systems in medicine. Yale J Biol Med 2002;75(5–6):247–260. [PMC free article] [PubMed] [Google Scholar]
- 16.Anderson RA, Crabtree BF, Steele DJ, McDaniel RR. Case study research: the view from complexity science. Qual Health Res 2005;15(5):669–685. [DOI] [PMC free article] [PubMed] [Google Scholar]
- 17.Miller WL, McDaniel RR, Crabtree BF, Stange KC. Practice jazz: understanding variation in family practices using complexity science. J Fam Pract 2001;50(10):872–878. [PubMed] [Google Scholar]
- 18.Charlson ME, Pompei P, Ales KL, MacKenzie CR. A new method of classifying prognostic comorbidity in longitudinal studies: development and validation. J Chronic Dis 1987;40(5): 373–383. doi: 10.1016/0021-9681(87)90171-8. PMID: . [DOI] [PubMed] [Google Scholar]
- 19.Vincent J, Moreno R. Clinical review: scoring systems in the critically ill. Crit Care 2010;14(2):207–216. [DOI] [PMC free article] [PubMed] [Google Scholar]
- 20.Rabin R, de Charro F. EQ-5D: a measure of health status from the EuroQol Group. Ann Med 2001;33(5):337–343. [DOI] [PubMed] [Google Scholar]
- 21.Plante TG, Vallaeys CL, Sherman AC, Wallston KA. The development of a brief version of the Santa Clara Strength of Religious Faith Questionnaire. Pastor Psychol 2002;50(5):359–356. [Google Scholar]
- 22.Cox CE, Martinu T, Sathy SJ, et al. Expectations and outcomes of prolonged mechanical ventilation. Crit Care Med 2009;37(11): 2888–2894. [DOI] [PMC free article] [PubMed] [Google Scholar]
- 23.Hinkka H, Kosunen E, Metsanoja R, Lammi UK, Kellokumpu-Lehtinen P. Factors affecting physicians’ decisions to forgo life-sustaining treatments in terminal care. J Med Ethics 2002;28(2): 109–114. [DOI] [PMC free article] [PubMed] [Google Scholar]
- 24.Christakis NA, Asch DA. Physician characteristics associated with decisions to withdraw life support. Am J Public Health 1995;85(3):367–372. [DOI] [PMC free article] [PubMed] [Google Scholar]
- 25.Mebane EW, Oman RF, Kroonen LT, Goldstein MK. The influence of physician race, age, and gender on physician attitudes toward advance care directives and preferences for end-of-life decision-making. J Am Geriatr Soc 1999;47(5):579–591. [DOI] [PubMed] [Google Scholar]
- 26.Cook D, Rocker G. Dying with dignity in the Intensive Care Unit. N Engl J Med 2014;370(26):2506–2514. [DOI] [PubMed] [Google Scholar]
- 27.Turnbull AE, Krall JR, Ruhl AP, et al. A scenario-based, randomized trial of patient values and functional prognosis on intensivist intent to discuss withdrawing life support. Crit Care Med 2014;42(6):1455–1462. [DOI] [PMC free article] [PubMed] [Google Scholar]
- 28.SUPPORT InvestigatorsA controlled trial to improve care for seriously ill hospitalized patients. The study to understand prognoses and preferences for outcomes and risks of treatments (SUPPORT). JAMA 1995;274(20):1591–1598. [PubMed] [Google Scholar]
- 29.Curtis JR, Treece PD, Nielsen EL, et al. Randomized trial of communication facilitators to reduce family distress and intensity of end of life care. Am J Respir Crit Care Med 2016; 193(2):154–162. doi: 10.1164/rccm.201505-0900OC. PMID: . [DOI] [PMC free article] [PubMed] [Google Scholar]
- 30.Weinfurt KP, Castel LD, Li Y, et al. The correlation between patient characteristics and expectations of benefit from Phase I clinical trials. Cancer 2003;98(1):166–175. PMID: . [DOI] [PubMed] [Google Scholar]
- 31.Meropol NJ, Egleston BL, Buzaglo JS, et al. ; the CONNECT Study Research Group. Cancer patient preferences for quality and length of life. Cancer 2008;113(12):3459–3466. doi: 10.1002/cncr.23968. [DOI] [PMC free article] [PubMed] [Google Scholar]