

Abstract
We introduce and validate a new precision oncology framework for the systematic prioritization of drugs targeting mechanistic tumor dependencies in individual patients. Compounds are prioritized on the basis of their ability to invert the concerted activity of master regulator proteins that mechanistically regulate tumor cell state, as assessed from systematic drug perturbation assays. We validated the approach on a cohort of 212 gastroenteropancreatic neuroendocrine tumors (GEP-NETs), a rare malignancy originating in the pancreas and gastrointestinal tract. The analysis identified several master regulator proteins, including key regulators of neuroendocrine lineage progenitor state and immunoevasion, whose role as critical tumor dependencies was experimentally confirmed. Transcriptome analysis of GEP-NET-derived cells, perturbed with a library of 107 compounds, identified the HDAC class I inhibitor entinostat as a potent inhibitor of master regulator activity for 42% of metastatic GEP-NET patients, abrogating tumor growth in vivo. This approach may thus complement current efforts in precision oncology.
Emerging efforts in precision oncology are largely predicated on the identification of ‘actionable’ oncogene mutations, whose pharmacological inhibition elicits oncogene addiction1. Despite initial successes and clinical deployment of this concept, several limitations have emerged2. First, multiple studies3 have shown that most adult malignancies lack actionable mutations or harbor mutations either in non-druggable oncogenes (for example, RAS and MYC family proteins) or in genes of poorly characterized therapeutic value4. Moreover, while mutation-directed therapy often achieves a remarkable initial response, this is almost inevitably followed by relapse and emergence of drug resistance5,6. Finally, analysis of hundreds of cell lines and compounds shows that, with some exceptions—such as for BRAF, ERBB2, EGFR and ALK1 inhibitors—mutations are poor predictors of drug sensitivity7. This is not entirely surprising, as drug sensitivity is a complex (dynamic, multifactorial, polygenic) phenotype. As such, there is urgent need for novel approaches that complement and extend oncogene addiction.
Recent results on the aberrant regulatory logic of cancer-related phenotypes have highlighted the existence of master regulator proteins, whose coordinated activity within tightly regulated modules (tumor checkpoints) is strictly necessary for tumor state initiation and maintenance8. Consistently, as shown in leukemia9, lymphoma10,11, glioblastoma12, prostate13,14, neuroblastoma15 and breast cancer16, genetic or pharmacological inhibition of master regulator proteins leads to tumor-checkpoint collapse and loss of tumor viability. Indeed, master regulators are highly enriched in essential10 and synthetic-lethal11–13,16 proteins, thus representing a novel class of non-oncogene dependencies17,18 and pharmacological targets. Their mechanistic role in tumor cell state maintenance results from their mechanistic transcriptional control of gene expression signatures (GES) representing the tumor cell’s transcriptional identity. Master regulator proteins can be efficiently and systematically elucidated using the MARINa (Master Regulator Inference algorithm)12,19 and VIPER (Virtual Proteomics by Enriched Regulon analysis)20 algorithms—the latter allowing analysis on an individual sample basis, a prerequisite for precision oncology applications. These algorithms were extensively validated11–13,16,21.
Thus, the rationale for this methodology (OncoTreat) is that small-molecule compounds capable of inducing tumor-checkpoint collapse—that is, activity inversion of an entire tumor-specific master regulator repertoire—will abrogate tumor viability by inhibiting multiple essential and synthetic-lethal proteins. Thus, tumor check-points can be used as patient-specific gene-reporter assays for the efficient prioritization of therapeutic options.
To test this idea, we focused on gastroenteropancreatic neuroendocrine tumors (GEP-NETs), a rare and poorly characterized class of human malignancies originating in the pancreas (P-NET)22, small bowel (SI-NET)23 and rectum (RE-NET)24. Once these tumors undergo metastatic progression, prognosis is poor and therapeutic options remain limited25. Using a cohort of 212 fresh-frozen GEP-NET patient samples collected at 18 institutions, we prioritized and validated master regulator proteins representing mechanistic regulators of GEP-NET metastatic progression signatures, across 4 molecularly distinct subtypes. This was accomplished by VIPER analysis of genes that were differentially expressed between each metastatic sample and its lineage-matched primary sample(s)21. This allowed prioritization of 107 compounds based on their ability to invert patient-specific master regulator protein activity, independent of their effect on cell viability in vitro. Validation in tumor xenografts matching the master regulator-activity profile of individual patients confirmed these predictions, suggesting that this approach may complement existing precision oncology strategies.
Results
The goal of this study is to show that compounds capable of inverting the coordinated activity of tumor-checkpoint master regulators can effectively destabilize tumor cell state, leading to loss of tumor viability in vivo. Conceptually, this approach extends oncogene addiction to a broader tumor-checkpoint dependency paradigm. Specifically, we propose that tumors are more dependent on the concerted activity of the master regulator proteins that regulate their transcriptional state stability8 than on the individual oncoproteins that initiate it. To systematically elucidate compounds targeting these tumor-checkpoint dependencies, we introduce and validate a novel methodology called OncoTreat.
Assembling and characterizing a GEP-NET cohort.
To identify master regulator proteins responsible for implementing and maintaining the transcriptional state of GEP-NETs, we assembled a collection of 212 high-quality, fresh-frozen GEP-NET samples, either from surgical resections or biopsies. All samples were reviewed by a board-certified pathologist. A minimum tumor cellularity of 70% was required, ensuring that RNA-sequencing (RNA-Seq) profiles were representative of tumor compartment cells. Only 2.3% of the evaluated tumors were excluded due to low cellularity, thus preventing further exploration of an interesting subset of stroma-rich GEP-NETs (see Methods for additional quality control metrics). Due to the rare nature of these tumors, this required the coordinated efforts of an 18-institution International NET Consortium (iNET; Supplementary Table 1). The resulting collection includes both primary and metastatic samples representing P-NET (83 and 30, respectively), SI-NET (44 and 37, respectively) and RE-NET (3 and 15, respectively) subtypes that had transcriptomes profiled by RNA-Seq (Supplementary Table 2, Methods). Due to the distributed nature of the iNET consortium, clinical sample annotation was sparse, further supporting the unbiased analysis of these samples at the molecular level. Reproducibility of gene expression profiles between similar samples was comparable to the average of 33 tumor cohorts in The Cancer Genome Atlas (Supplementary Fig. 1a).
Assembling a GEP-NET-specific regulatory model.
Master regulator inference depends on the availability of accurate, tumor-specific regulatory models (interactomes), representing both direct transcription factor/co-factor targets as well as the least-indirect targets of signaling proteins20. Both can be systematically identified by analyzing large, tumor-specific gene expression profile data sets using the algorithm for the accurate reconstruction of cellular networks (ARACNe)26,27, as supported by extensive experimental validation studies12,13,19,28. Alternative reverse engineering algorithms, such as CLR or CellNet29,30, producing high-accuracy transcriptional interaction maps may also be used and could be explored in follow-up studies.
Analysis of 212 GEP-NET RNA-Seq profiles yielded an interactome comprising 571,499 transcriptional interactions between 5,631 proteins—including 1,785 transcriptional regulators and 3,846 signaling proteins (Methods)—and 20,136 target genes. Benchmark tests confirmed the GEP-NET interactome optimality to analyze GEP-NET samples and its distinct nature from 25 tumor-specific models previously generated and validated by our laboratory (Supplementary Table 3 and Supplementary Fig. 1b). Moreover, using all GEP-NET samples for interactome generation, rather than subtype-specific samples, maximized prediction quality, as measured by overall regulon enrichment in GEP-NET metastatic progression signatures (Supplementary Fig. 1b). In addition, regulons from the resulting pan-GEP-NET interactome were highly conserved with those of subtype-specific interactomes (at a false discovery rate (FDR) < 0.05)13, including for metastases (99% conservation), primary tumors (98.9%), P-NETs (97.2%) and SI-NETs (94.5%) (Supplementary Fig. 1c,d).
GEP-NET molecular subtypes.
Unsupervised analysis of GEP-NET transcriptional profiles highlighted a strong tissue-of-origin contribution. Specifically, on the basis of principal component analysis, the first five components accounted for 33% of the total sample variance and clustered with primary tumor site, regardless of whether samples were derived from primaries, lymph nodes or metastases (Supplementary Fig. 2a). This observation was further confirmed based on a t-distributed stochastic neighbor embedding (t-SNE) projection of GEP-NET transcriptomes in two dimensions (Supplementary Fig. 2b). Consistently, partitioning around medoids (PAM)-based consensus clustering, followed by cluster reliability analysis (Methods), suggested optimal sample partitioning into four distinct clusters (E1–E4) that mostly co-segregated with primary tumor site (Fig. 1a and Supplementary Fig. 2d). Clusters E1–E3 were highly enriched in SI-NET, P-NET and RE-NET samples, respectively. Only cluster E4 was mixed, including samples from SI-NETs and P-NETs.
Fig. 1 |. GEP-NET molecular subtypes and master regulators for metastatic progression.
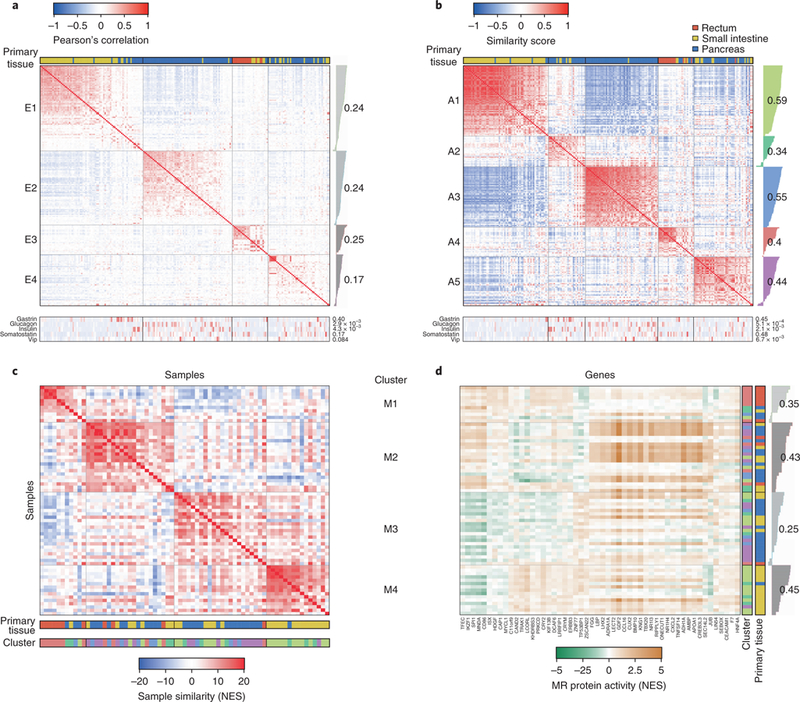
a, Unsupervised cluster analysis of 212 GEP-NET samples based on their gene expression profile. The heatmap shows the Pearson’s correlation coefficient. Samples were partitioned in four clusters and sorted according to their silhouette score (gray bars on the right of the heatmap). Each cluster average silhouette score is indicated by numbers. The tissue of origin is indicated in the top horizontal bar: rectum (red), small intestine (green) and pancreas (blue). The expression level (reads per kilobase of transcript per million mapped reads) for gastrin, glucagon, insulin, somatostatin and vasoactive intestinal polypeptide (VIP) is indicated by the bottom heatmap, as well as their association with the clusters (two-tailed P values estimated by ANOVA are shown on the right of the heatmap). b, Unsupervised cluster analysis based on the VIPER-inferred protein activity for 5,578 regulatory proteins. The heatmap shows the scaled similarity score computed by gene set enrichment analysis, using the aREA algorithm (Methods). c, Heatmap showing conservation of the top 50 most dysregulated proteins in association with liver metastasis between each possible sample pair. Clusters corresponding to panel b are indicated with a color-matching scheme in the second color bar. d, Heatmap showing relative protein activity for the top 20 most dysregulated proteins from each of the four clusters shown in panel c. The color bars on the right indicate the tissue of origin and correspondence to the five clusters depicted in panel b. The single-sample silhouette score and its cluster average are indicated to the right of the plot. MR, master regulator.
VIPER-inferred protein activity represents a more reproducible biomarker than gene expression20: first, protein activity represents a more mechanistic cell state determinant because it reflects causal regulation of tumor signature genes; second, activity of each protein is inferred from expression of tens to hundreds of transcriptional targets, thus averaging out measurement noise and improving reproducibility20; third, bias and technical noise that are inconsistent with the regulatory model are effectively eliminated. We thus used VIPER to transform 212 GEP-NET transcriptional profiles into protein-activity profiles, representing sample-specific activity of 5,578 proteins20. As expected8, protein activity significantly outperformed gene expression-based clustering (P < 10−15, by one-sided paired U-test comparison of single-sample cluster reliability scores, Supplementary Fig. 2d–i).
Unsupervised PAM-based consensus cluster analysis and t-SNE analysis of VIPER-inferred protein activity identified five clusters (A1–A5) representing molecularly distinct GEP-NET subtypes (Fig. 1b and Supplementary Fig. 2c). These included a SI-NET-specific cluster (A1, yellow), a P-NET specific cluster (A3, blue), a RE-NET cluster (A4, red) and two heterogeneous clusters including mainly P-NET and SI-NET samples (A2, green; A5: purple; Fig. 1b and Supplementary Fig. 2c). We used a matched color scheme to represent cluster membership in the t-SNE projection, which showed essentially an equivalent cluster structure identified by both unsupervised analyses (adjusted Rand index = 0.88, P < 10−80 by permutation test, Fig. 1b and Supplementary Fig. 2c). Moreover, on the basis of expression of established markers, P-NETs were better divided across three distinct clusters, consistent with potential cell of origin, including gastrinoma and insulinoma (green), glucagonoma (blue) and non-secretory P-NETs (purple) (Fig. 1). These results confirm strong tissue-lineage-specific (epigenetic) memory, independent of tumor stage.
Elucidating master regulators of metastatic GEP-NET state.
The normal tissue counterpart of GEP-NET malignancies is the subject of significant debate31. In addition, before metastatic progression, these tumors have favorable prognosis25. Thus, rather than seeking master regulators controlling transformation from normal to tumor-related NET-cell state, we focused on master regulators representing mechanistic determinants of progression from primary to metastatic disease, similar to ref. 21. To elucidate these candidate dependencies, we performed VIPER analysis of gene expression signatures representing transitions between primary tumors and hepatic metastases (MET-GES)—representing 69 of the 82 meta-static samples—using the GEP-NET interactome.
To address the potential heterogeneity of tumor progression mechanisms and to support use of this framework in precision oncology, each hepatic metastasis was analyzed on an individual basis (Supplementary Table 2). Ideally, each metastasis would be compared to its patient-matched primary21. However, since patient-matched samples were not available for this rare malignancy, MET-GES signatures were generated by differential expression analysis (z-score based) of each hepatic metastasis in an activity-based cluster (A1–A5) against the average of all primary samples in that cluster (Fig. 1b). Three primary samples were discarded, including a P-NET and two SI-NETs, since they could not be reliably clustered (one-tailed cluster reliability FDR > 0.01). Candidate master regulators were then inferred by VIPER analysis of these signatures, using the GEP-NET interactome. Comparing metastases to cluster-matched primaries effectively discounts lineage determinants, which would otherwise represent confounding factors leading to contamination of metastatic progression master regulators with lineage master regulators.
Inferred master regulators were surprisingly conserved across patients, both inter and intra cluster, suggesting a common metastatic progression mechanism. Indeed, the 25 most statistically significant positive and negative VIPER-inferred master regulators of each sample were highly enriched in proteins that were differentially active in most other metastatic samples, with 1,416 of 2,346 possible metastatic sample pairs showing statistically significant master regulator overlap (FDR < 0.01, by enrichment analysis, Fig. 1c and Supplementary Fig. 3a). Consensus clustering identified four clusters (M1–M4) representing distinct metastatic progression mechanisms (Fig. 1c), as well as several master regulators shared by most metastatic samples, such as the developmental proteins GDF2, CUX2 and BMP10 (Fig. 1d). A comprehensive heatmap representing the most conserved master regulators across all clusters is provided in Supplementary Table 4a–e.
Not surprisingly, since progression signatures were based on cluster-matched metastatic and primary samples, there was minimal association between the five GEP-NET subtype clusters (A1–A5) and the four metastatic progression clusters (M1–M4), with A1 and A4 samples preferentially clustering in M5 (SI-NET enriched) and M1 (RE-NET enriched), respectively. This confirms an effective control of lineage-related confounding factors and suggests that GEP-NETs may share common metastatic progression mechanisms, largely decoupled from primary tumor site and subtype identity.
Validation of master regulators by shRNA silencing.
Effective validation of candidate master regulators requires cell lines or mouse models that most closely recapitulate their VIPER-inferred activity15. We thus considered 921 cell lines comprising the Cancer Cell Line Encyclopedia32, as well as two GEP-NET-derived cell lines (H-STS33 and KRJ-I34), both isolated from SI-NET patients. For each cell line, a putative metastatic progression signature was generated by differential expression with the profile of a primary GEP-NET-derived cell line (P-STS33). Cells were scored on the basis of the consistency of their gene expression profiles with the patient-derived GEP-NET interactome (Supplementary Fig. 4a) and on the enrichment of their differentially active proteins in master regulators of metastatic GEP-NET samples (Fig. 2, Supplementary Fig. 4 and Supplementary Note). H-STS and KRJ-1—the 4th (top 0.43%) and 6th (top 0.65%) best matched models out of 923 available ones, respectively (Supplementary Fig. 4c,d)—were selected, given their GEP-NET origin and propensity to implant in xenograft models.
Fig. 2 |. Conservation of metastasis master regulators in NET cell lines and a xenograft model.
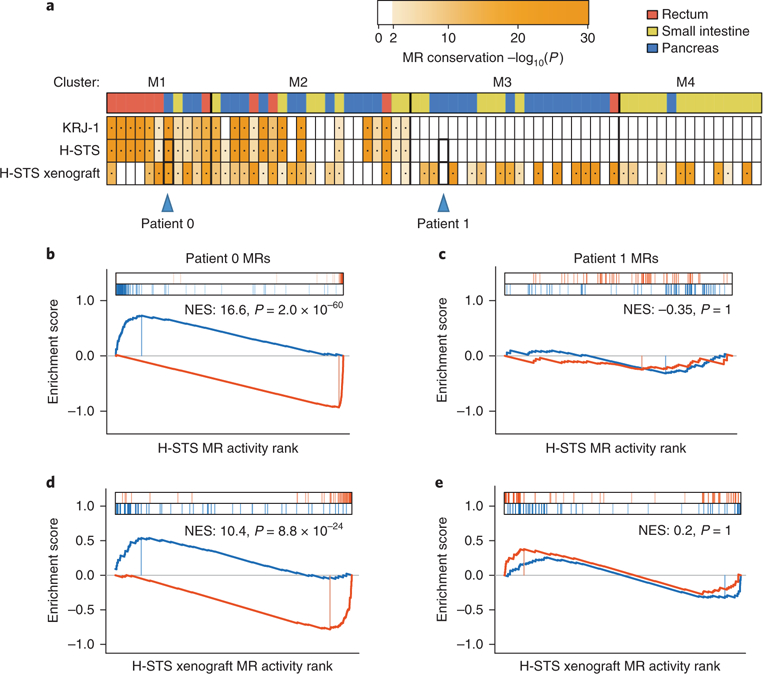
a, Enrichment of the top 100 most dysregulated proteins from each hepatic metastasis on each cell line and the H-STS xenograft model protein activity signatures. The color of the heatmap is proportional to the Bonferroni-corrected P value for the test (one-tailed aREA test). The color bar on top of the plot indicates the tissue of origin for the primary tumor. The blue triangles indicate two P-NET metastases (patient 0, selected because master regulator proteins are strongly enriched in the H-STS and xenograft signatures, and patient 1, selected because master regulator proteins show no significant enrichment on H-STS and xenograft signatures) for which a detailed plot of this analysis is shown in b–e. b–e, Gene set enrichment analysis for the top 50 most positive and the top 50 most negative master regulators of each selected metastasis on the protein activity signature of the H-STS cell line (b,c), and the H-STS xenograft model (d,e). Enrichment score for the top 50 most de-activated (blue) and most activate (red) proteins in the metastasis is shown by the curves, and the projection of these proteins on the H-STS and the xenograft protein activity signatures—which are indicated by the color scale on the bottom of the plot—is indicated by the blue and red vertical lines, respectively. NES and Bonferroni-corrected P value (one-tailed aREA test) are indicated in the plots.
We then proceeded to validate master regulators that were aberrantly active both across metastatic patients and in H-STS cells. We found 55 candidate master regulators showing significant differential activity (P < 10−4 by enrichment analysis, Bonferroni corrected, using the aREA algorithm20, Supplementary Fig. 3c). Of these, the top 34 most significant ones (P < 2.0 × 10⁻⁷, Bonferroni corrected) were prioritized for experimental validation (Supplementary Table 5). Surprisingly, despite a very high tumor purity, several prioritized master regulators were immune cell markers. We thus confirmed their expression in H-STS cells by FACS analysis (Fig. 3 and Supplementary Note), suggesting that they were not identified as part of tumor immune infiltrate.
Fig. 3 |. Cell surface marker master regulators on H-STS cells and effect of entinostat on their expression.
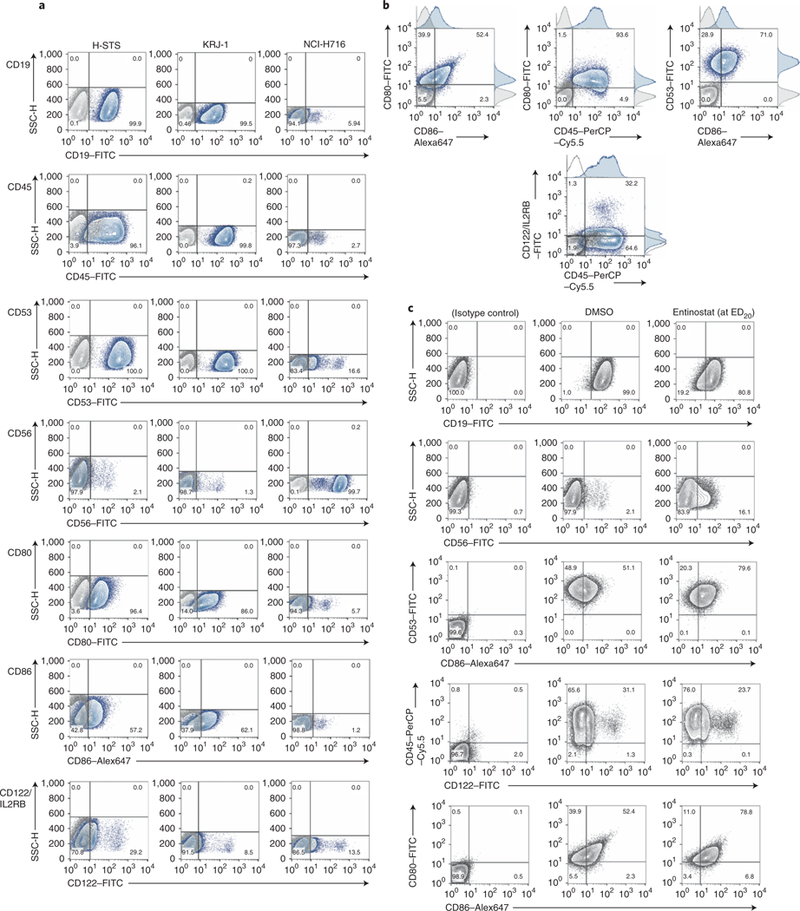
a, Flow cytometry detection of cell surface markers, as indicated in each row, on H-STS, KRJ-I and NCI-H716 cells. The lightly shaded histogram is the staining from the isotype control antibody. CD19 is not a top-predicted master regulator but is predicted to be expressed on H-STS cells, and it was followed as an immune-associated marker. b, Dual staining of cell surface markers in a shown with adjunct histograms. Only the data for H-STS cells are shown as representative. c, Effect of entinostat treatment of H-STS cells on cell surface markers. H-STS cells were treated with a sub-lethal dose of entinostat (~ED20, 7 μM) for 24 h, and flow cytometry staining performed with the indicated antibodies. DMSO-treated cells were used as a control. The background staining (solid gray line) was followed with the appropriate isotype control. For CD56, scatter pseudo-color dot plots of SSC-H versus FL1-H (CD56–FITC) are shown alongside the histogram. The figures represent a representative experiment of three.
To assess whether master regulator proteins identified by our analysis represent critical tumor dependencies, we measured H-STS cell viability following their lentivirus-mediated shRNA silencing. Of 34 master regulators selected for validation, 16 could be reproducibly silenced (≥40%, based on quantitative PCR with reverse transcription (qRT–PCR)), by at least two independent shRNA hairpins (Supplementary Fig. 3d). Of these, 15 (94%) significantly reduced H-STS growth/viability in vitro (≥20%, one-tailed P < 0.01, by analysis of variance (ANOVA); Fig. 4), confirming their role as relevant tumor dependencies. These results were recapitulated in KRJ-I cells but not in the negative control cell line (NCI-H716) (Supplementary Figs. 3e and 6f). These results support the more universal (mutation-independent) nature of patient-specific master regulator dependencies discovered by this approach.
Fig. 4 |. Validation of GEP-NET metastasis master regulators.
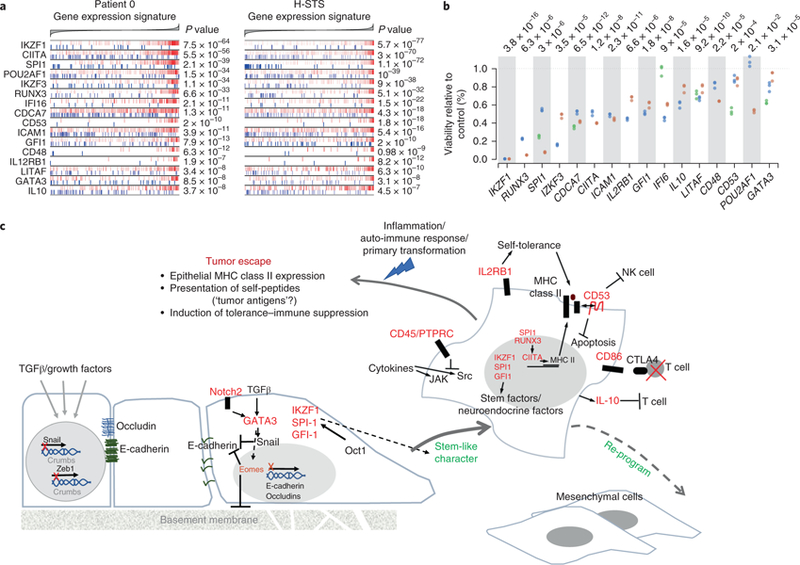
a, Enrichment for the targets of 16 metastasis master regulators, including transcripts that, according to the regulatory model, are induced by the master regulator (indicated by the red vertical lines) and represented (blue vertical lines). The x axis indicates the GES for the patient 0 metastasis (genes were sorted from the most downregulated to the left, to the ones most upregulated, shown to the right) and H-STS cell line GES. Statistical significance is shown as Bonferroni’s corrected P value (two-tailed aREA test). b, Growth inhibition of H-STS cells, shown as a percentage of the control, six days after lentiviral vector-mediated transduction of shRNAs targeting the master regulator genes. Mammalian non-target shRNA was used as a control. The dotplot shows three replicates for each of the assessed hairpins (indicated with different colors). One-tailed P values were estimated by ANOVA. c, Schema for the possible evolution of NET as a part of the process of epithelial–mesenchymal transition. Evidence for this hypothesis is discussed in the main text.
Validated master regulators include early neuroendocrine lineage factors (IKZF1, IKZF3, SPI-1, GFI-1 and POU2F2), EMT drivers (Notch2, EOMES and GATA3) and immunomodulatory factors (CD45 also known as PTPRC, IL2RB1, CD53, CD86, RUNX3, CIITA and IL10). Taken together, the concerted activity of these proteins recapitulates key hallmarks of aggressive neuroendocrine tumors and provides a compelling mechanistic portrait of the programs that are necessary to maintain GEP-NET cell state (Fig. 4c and Supplementary Note).
Inference of master regulator activity inhibitors.
To identify small-molecule compounds that could invert the activity of metastatic GEP-NET master regulators, we profiled a library of 504 compounds. These had been previously analyzed at the Broad Institute (Cambridge, MA, USA) for differential activity against a panel of 242 genomically characterized cancer cell lines and results for a subset of 354 of them had been previously published7. All 504 compounds were re-screened in available GEP-NET, patient-derived cells lines, including H-STS, P-STS and KRJ-I, and in NCI-H716 as a negative control. This led to the selection of 107 compounds—102 of which were commercially available—that were differentially active in GEP-NET-related cells, as measured by the area under the dose–response curve (AUC). Dose–response curves generated by the high-throughput screening facility at Columbia University and by the Broad Institute were compared. Overall, these data presented high reproducibility, with AUC-based Spearman correlation of 0.71. An additional five compounds were identified by literature analysis as direct master regulator inhibitor—including bafetinib, crizotinib, PHA-665752, SU11274 and Y-27632—for a total of 107 compounds (Supplementary Table 6).
To assess the ability of these compounds to induce tumor-checkpoint collapse (that is, global reversion of patient-specific master regulators), we generated gene expression profiles of H-STS cells at 24 h following perturbation with each compound at two sublethal concentrations, the 72 h effective dose 20 (ED20) and one-tenth of that concentration and with control media (DMSO), in duplicate. Profiles were obtained by 30M SE read Illumina TruSeq sequencing of purified RNA from treated cells. This allows testing of the highest non-toxic compound concentration, thus focusing the analysis on compound mechanism of action (MoA) rather than on mechanisms of cell stress/death. We reasoned that, while in vivo endpoint phenotypes (tumor viability) are not effectively recapitulated in two-dimensional culture conditions, compound MoA is reasonably well recapitulated in both contexts and is most frequently assessed in vitro. We thus aimed to identify compounds capable of inverting master regulator signature activity in a closely related in vitro model of the patient-specific tumor, to prioritize compounds with potential in vivo activity.
Drug response signatures were generated by differential expression analysis of H-STS cells treated with each compound versus control media and further analyzed by VIPER to assess compound-mediated changes in protein activity. This prioritized all 5,602 regulatory proteins represented in the GEP-NET interactome, from the most inhibited to the most activated by each treatment, thus allowing identification of compounds capable of inducing highly statistically significant reversal of the master regulator-activity signature in each sample (tumor-checkpoint collapse). For each sample, this was accomplished by assessing the enrichment of its top 50 positive and 50 negative master regulators of metastatic progression in proteins that were inactivated and activated by each compound treatment, respectively.
To ensure optimal fidelity of the analysis, we first focused on 32 samples whose master regulators were significantly recapitulated in H-STS xenografts (one-tailed P < 10−10, Bonferroni corrected, aREA analysis; Fig. 2a). Moreover, only sample-specific master regulator proteins that were recapitulated in the H-STS cell line, based on leading-edge analysis (Fig. 2b), were included in the analysis. Finally, Stouffer’s method was used to integrate the statistical significance of results across different drug concentrations and replicates. Results for all drugs predicted to induce tumor-checkpoint collapse in at least ten patients are shown in Fig. 5a. Complete results for all 69 metastatic GEP-NET samples are also reported (Supplementary Fig. 5), albeit relying on fewer conserved master regulators between the patient sample and the H-STS xenograft model.
Fig. 5 |. Small-molecule compounds inverting the metastatic progression checkpoint activity as inferred by OncoTreat.
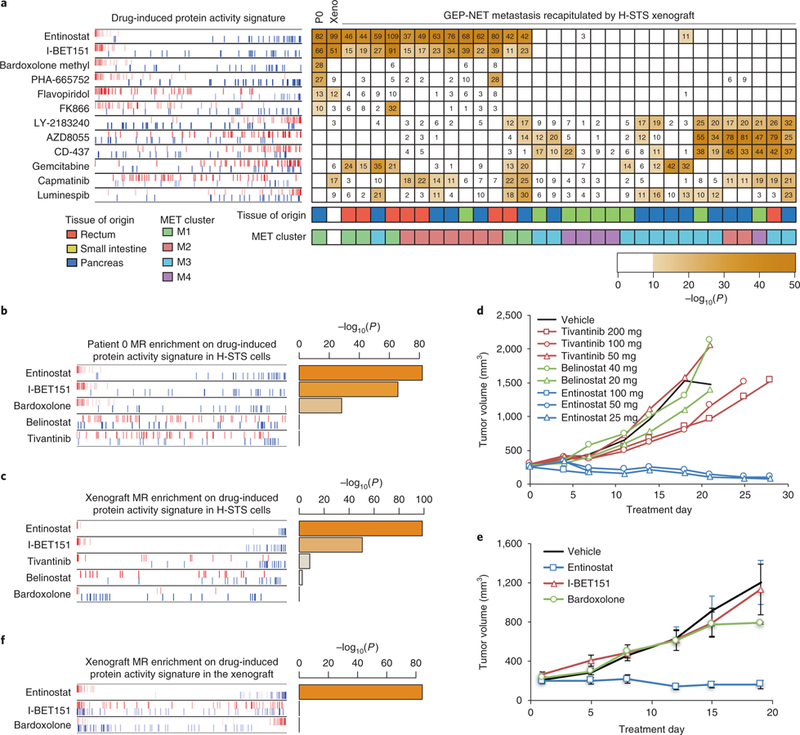
a, A heatmap showing the statistical significance for inversion of the top 100 master regulators of each tumor and H-STS xenograft model (columns) on the protein activity signature elicited by each drug perturbation (rows) on H-STS cells. Only tumors showing significant similarity, at the master regulator level, to the H-STS xenograft model (Fig. 2a) were included. The significance level is shown as –log10P, indicated by numbers (one-tailed aREA test, Bonferroni corrected). Only drugs significantly inverting the master regulators (P < 10−10) for at least ten metastases were included (see Supplementary Fig. 5 for full results). The enrichment plot to the left shows the enrichment of the patient 0 (P0) master regulators recapitulated by xenograft model on each drug perturbation protein activity signature. Master regulators are shown by red and blue vertical lines, indicating activated and inactivated master regulators, respectively. The plot shows their position on each drug (rows)-induced protein activity signature (x axis), such that for each drug, all 5,602 evaluated proteins were rank-sorted from the most inactivated to the most activated in response to drug treatment. b,c, Enrichment of patient 0 metastasis (b) and H-STS xenograft-checkpoint master regulators (c) on protein activity signatures induced by five selected compounds in H-STS cells. d,e, Growth curves for H-STS xenograft treated by vehicle control or each of five compounds. The curves show the tumor volume for individual animals (d) or the mean ± s.e.m. of eight animals (e). f, Enrichment of H-STS xenograft checkpoint on protein activity signatures induced by three selected compounds in H-STS xenograft.
As an example, consider the patient with the most statistically significant master regulator match to H-STS cells (patient 0). Six compounds were predicted to induce tumor-checkpoint collapse (Bonferroni’s adjusted P < 10−10, one-tailed aREA), including the class I (HDAC1/3) inhibitor entinostat, the bromodomain inhibitor I-BET151, the Nrf2-pathway-activator/NF-κB inhibitor bardoxolone methyl, the c-Met inhibitor PHA-665752, the CDK1, 2, 4 and 6 inhibitor flavopiridol and the NMPRTase inhibitor FK866. Among all tested compounds, entinostat and I-BET151 were predicted to induce highly significant tumor-checkpoint collapse in 47% and 44% of metastatic samples (N = 15 and N = 14 of 32, respectively), the most of any tested compound, as well as in the H-STS xenograft (Fig. 5a and Supplementary Fig. 5). They were thus selected for further validation in vivo.
mTOR inhibitors and sunitinib have shown some clinical value in the treatment of GEP-NETs. Consistently, our analysis identified several mTOR/AKT/PI(3)K inhibitors, such as everolimus, AZD8055 and MK2206, among others, as strong tumor-checkpoint inhibitors (P < 10−10, Bonferroni corrected, one-tailed aREA) for about 15% of GEP-NETs and as marginal inhibitors (P < 10−5, Bonferroni corrected) for an additional 10%–15% of the cohort. Similarly, sunitinib was identified as a strong and marginal tumor-checkpoint inhibitor for 8% and 11% of the cohort, respectively (Fig. 5a and Supplementary Fig. 5).
Interestingly, entinostat modulated presentation of the cell surface markers identified as master regulators (Fig. 3c and Supplementary Note).
Drug validation in vivo.
We selected three compounds for validation in an H-STS xenograft model, including: entinostat, the drug with the strongest tumor-checkpoint collapse potential in the largest subset of GEP-NET samples, as well as in the H-STS xenograft (−log10P = 82 and −log10P = 99, respectively); tivantinib, a c-Met and microtubule inhibitor with strong activity reversal in 28% of metastatic samples (N = 9 of 32) and intermediate master regulator-activity reversal in the H-STS xenograft (−log10P = 8); and PDX101/belinostat, a pan-HDAC inhibitor selected as a negative control because of its complete lack of master regulator-activity reversal potential in the H-STS xenograft but with a MoA similar to entinostat (Figs. 5b and 6c).
Fig. 6 |. Schematic diagram for the OncoTreat clinical pipeline.
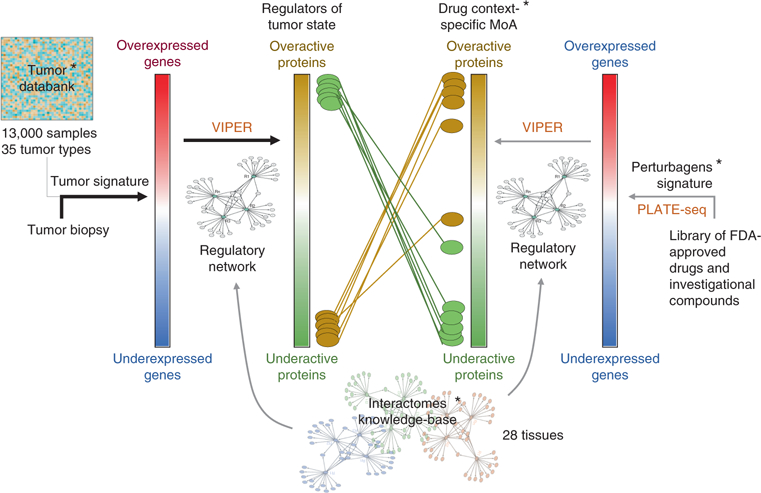
The pipeline consists of a series of pre-computed (*) components, including a reference set of more than 13,000 tumor expression profiles representing 35 different tumor types, a collection of 28 tissue context-specific interactomes and a database of context-specific MoA for >400 Food and Drug Administration (FDA)-approved drugs and investigational compounds in oncology. This database is obtained by perturbing at least two cell lines per tissue type—which, in a quasi-orthogonal fashion, recapitulate the top master regulator proteins for the larger proportion of tissue-matched samples in the tumor databank—with the collection of drugs and compounds. The transcriptome of the perturbed cell lines is profiled at low cost by PLATE-Seq. The process begins with the expression profile of a single patient sample, which is compared against the tumor databank to generate a tumor gene expression signature. This signature is interpreted by VIPER using a context-matched interactome to identify the set of most dysregulated proteins, which constitute the regulators of the tumor cell state—the tumor checkpoint. These proteins are then aligned against the drugs’ and compounds’ MoA database, to prioritize compounds able to invert the activity pattern of the tumor checkpoint.
In vivo testing of drugs in NOD-SCID xenografts established by subcutaneous injection of H-STS cells was first conducted at Champions Oncology. Confirming our predictions, tumors treated with belinostat showed minimal tumor growth inhibition (TGI) (8% TGI at the 20 mg kg−1 dose−1 level). In contrast, entinostat showed high efficacy, with tumor regression (TR) of 68% and TGI of 112% at 25 mg kg−1 dose−1, and TR of 58% and TGI of 110% at 50 mg kg−1 dose−1, respectively. While treatment with entinostat was toxic at the highest dose (100 mg kg−1), the single surviving animal from that group showed TR of 49%. Finally, also consistent with predictions of partial master regulator-activity reversal in the xenograft model (Fig. 5c), mild TGI of 43% (200 mg kg−1 dose−1) and TGI of 28% (100 mg kg−1 dose−1) were observed with tivantinib (Table 1 and Fig. 5d). The results for entinostat were independently confirmed in the mouse hospital facility at Columbia University (Fig. 5e).
Table 1 |.
Tumor volume and agent activity data
| Group | %TGI | RECIST PD/SD/PR/CRa | %TR |
|---|---|---|---|
| Control | 3/0/0/0 | n/a | |
| ARQ197 200 mg | 43% | 3/0/0/0 | n/a |
| ARQ197 100 mg | 28% | 3/0/0/0 | n/a |
| ARQ197 50 mg | −46% | 3/0/0/0 | n/a |
| PDX101 20 mg | 8% | 3/0/0/0 | n/a |
| PDX101 40 mg | −55% | 3/0/0/0 | n/a |
| MS-27–275 25 mg | 112% | 0/0/3/0 | 68 |
| MS-27–275 50 mg | 110% | 0/0/3/0 | 58 |
| MS-27–275 100 mgb | n/a | 0/0/1/0 | 49 |
PD, progressive disease; SD, stable disease; PR partial response; CR, complete response.
Four of five animals died one week into the test, likely as a result of drug toxicity; results are representative of the single surviving animal.
We then tested two additional drugs at the maximum tolerated dose. These included the I-BET151 bromodomain inhibitor also predicted to induce tumor-checkpoint collapse in ~44% of metastatic patients and in the H-STS model, and bardoxolone methyl, an oxidative-stress-activator/NF-κB inhibitor predicted to induce significant tumor-checkpoint collapse in patient 0 (−log10P = 28) but not in the H-STS model. Weak TGI was observed for bardoxolone methyl, only at the last time point (18 d), and no significant difference was observed for I-BET151, when both were compared to vehicle control (Fig. 5e). Lack of response was expected for bardoxolone, because it was not predicted to induce reversal of H-STS xenograft-specific master regulators and thus represented a bona fide negative control for the analysis. However, lack of response for I-BET151 was unexpected, as its predicted inversion of the xenograft’s master regulators was also very strong (−log10P = 51, Fig. 5c).
To assess whether the I-BET151 failure was due to differences in compound MoA in vitro and in vivo, we performed short-term pharmacodynamics measurements by profiling xenograft-derived tumors by RNA-Seq at 3 h after the third drug administration for all three tested drugs (Methods). In agreement with compound perturbations in vitro (Fig. 5c), VIPER-based analysis of these profiles confirmed significant inhibition of HSTS xenograft master regulator-activity by entinostat but not by bardoxolone (Fig. 5f), suggesting that VIPER-inferred compound MoA in vitro was effectively recapitulated in vivo for these compounds. However, the analysis also showed that, contrary to in vitro predictions, I-BET151 did not induce significant master regulator-activity reversal in the xenograft (Fig. 5f).
Thus, while bardoxolone may be an effective drug for some patients (for example, patient 0), its activity could not be effectively tested in the xenograft model due to master regulator differences. In contrast, I-BET151 presented significant difference between its in vitro and in vivo MoA, likely due to compound pharmacokinetics, metabolism, maximum tolerated dose or OncoTreat false-positive results. This suggests that top drugs prioritized by OncoTreat should always be validated in vivo, to assess MoA conservation. This can be done efficiently, since the number of promising drugs emerging from the analysis of a large cohort is relatively small, thus allowing efficient prioritization of drugs for follow-up clinical studies.
Discussion
Master regulator proteins represent a novel class of tumor dependencies and potential therapeutic targets that are highly enriched both in tumor-essential genes10,16 and synthetic-lethal pairs11–13. Their genetic or pharmacological inhibition induces activity reversion of the entire master regulator-protein repertoire, previously described as tumor-checkpoint collapse8. This provides a potential strategy (OncoTreat) for the prioritization of drugs to target tumor checkpoints.
We tested this approach in a rare class of tumors (GEP-NETs) that lack actionable mutations and remain poorly characterized35–37. This choice was deliberate, to show applicability of the proposed methodology even to rare tumors or to tumors with few, if any, actionable mutations, a significant unmet challenge in precision oncology. Following evaluation of 107 drugs, we confirmed therapeutic potential in vivo for entinostat, a drug predicted to induce tumor-checkpoint collapse in 15 of 32 (47%) metastatic GEP-NET samples for which a suitable pre-clinical model was available, as well as 13 of 35 (37%) metastatic GEP-NET samples lacking a suitable pre-clinical model (Supplementary Fig. 5). Almost all of the predicted responders (28/67), accounting for 42% of metastatic GEP-NET patients in the cohort, were from cluster M1 or M2 (Fig. 5a). Additional drugs were identified for patients presenting alternative master regulator dependencies (Supplementary Fig. 5), including inhibitors of the PI(3)K/AKT/mTOR pathway (everolimus, AZD8055, MK2206), some of which have shown some efficacy in clinical trials. Most of these belonged to cluster M3. However, lack of appropriate preclinical models prevented a more extensive validation of inferred drugs. Indeed, validation of two drugs predicted to induce patient-specific master regulator collapse was inconclusive due to differences in either patient- and xenograft-specific master regulator dependencies targeted by the drug or in vitro and in vivo MoA. For further discussion, see the Supplementary Note.
The top six compounds prioritized by the analysis induced significant in vitro activity reversal of almost all patient-related master regulators, as further confirmed in vivo for entinostat. Since it is implausible that these compounds may represent specific inhibitors and agonists of each of these proteins, this confirms that master regulator proteins are organized into tightly autoregulated on/off modules (tumor checkpoints) that can be globally inactivated even by a single compound. Furthermore, induction of the established neuroendocrine marker CD56 by the top prioritized drug (entinostat) supports the hypothesis that tumor checkpoints represent key tumor state determinants and that their collapse may induce differentiation or reprogramming.
Clearly, a number of open challenges remain. For instance, in vitro screening may lead to identification of compounds with different in vivo pharmacodynamics, such as I-BET151, or those that effectively reverse master regulator activity but only in concentrations that are too high to be tolerated. This may be effectively addressed by studying compound pharmacodynamics in vivo, as shown. Finally, the proposed methodology may miss drugs inducing non-master regulator-mediated tumor toxicity. In contrast, the OncoTreat methodology is generalizable and can be applicable to any tumor for which a regulatory model and a perturbational database can be assembled, including in basket studies with drugs prioritized on the basis of their complementary coverage of a rare tumor cohort (Fig. 5a and Supplementary Fig. 5).
The general logic of OncoTreat to be applied in the clinical setting is summarized in Fig. 6. On the basis of the high reproducibility of drugs prioritized by OncoTreat—a direct result of VIPER’s demonstrated reproducibility20—the test has been certified by the NYS CLIA laboratory and is immediately available at the Columbia University Laboratory of Personalized Genomic Medicine (see the URLs section). Furthermore, on the basis of the results of this study, the FDA approved the Investigational New Drug Application for entinostat in GEP-NETs, thus allowing further clinical validation of these results in a recently initiated clinical trial (NCT03211988).
Methods
Methods, including statements of data availability and any associated accession codes and references, are available at https://doi.org/10.1038/s41588–018-0138–4.
Supplementary Material
Acknowledgements
We acknowledge the Falconwood Foundation for its generous support of research on neuroendocrine tumors, and the molecular pathology shared resources of the Herbert Irving Medical Center for tumor banking management/processing and histology support. This work was also supported by the National Cancer Institute (NCI) Cancer Target Discovery and Development Program (U01CA217858), an NCI Outstanding Investigator Award (R35CA197745) for A.C., the NCI Research Centers for Cancer Systems Biology Consortium (1U54CA209997), NIH instrumentation grants (S10OD012351 and S10OD021764), the NIH grant for the Biobank and Translational Research Core Facility at Cedars-Sinai (G20 RR030860), NCI 3P50 CA095103 and SPORE in GI cancer for K.W. and C.S., and support from the Swedish Cancer Foundation for J.R. and U.L.
Footnotes
URLs. Columbia University Laboratory of Personalized Genomic Medicine: https://www.pathology.columbia.edu/departments-divisions/division-personalized-genomic-medicine. The ARACNe algorithm is available from Columbia University Systems Biology Department: http://califano.c2b2.columbia.edu/software/. The VIPER and aREA algorithms are part of the `viper’ R-system’s package available from Bioconductor: https://www.bioconductor.org/packages/release/bioc/html/viper.html. The neuroendocrine context-specific regulatory network model is available from Figshare: https://doi.org/10.6084/m9.figshare.6007232.
Additional information
Supplementary information is available for this paper at https://doi.org/10.1038/s41588–018-0138–4.
Publisher’s note: Springer Nature remains neutral with regard to jurisdictional claims in published maps and institutional affiliations.
Competing interests
M.J.A. is Chief Scientific Officer and equity holder at DarwinHealth, Inc., a company that has licensed some of the algorithms used in this manuscript from Columbia University. A.C. is founder and equity holder of DarwinHealth Inc. Columbia University is also an equity holder in DarwinHealth Inc.
References
- 1.Weinstein IB Addiction to oncogenes–the Achilles heal of cancer. Science 297, 63–64 (2002). [DOI] [PubMed] [Google Scholar]
- 2.Tannock IF & Hickman JA Limits to personalized cancer medicine. N. Engl. J. Med 375, 1289–1294 (2016). [DOI] [PubMed] [Google Scholar]
- 3.Commo F et al. Impact of centralization on aCGH-based genomic profiles for precision medicine in oncology. Ann. Oncol 26, 582–588 (2015). [DOI] [PMC free article] [PubMed] [Google Scholar]
- 4.MacConaill LE et al. Prospective enterprise-level molecular genotyping of a cohort of cancer patients. J. Mol. Diagn 16, 660–672 (2014). [DOI] [PMC free article] [PubMed] [Google Scholar]
- 5.Jang S & Atkins M Which drug, and when, for patients with BRAF-mutant melanoma? Lancet Oncol 14, e60–e69 (2013). [DOI] [PubMed] [Google Scholar]
- 6.Davoli A, Hocevar BA & Brown TL Progression and treatment of HER2-positive breast cancer. Cancer Chemother. Pharmacol 65, 611–623 (2010). [DOI] [PubMed] [Google Scholar]
- 7.Basu A et al. An interactive resource to identify cancer genetic and lineage dependencies targeted by small molecules. Cell 154, 1151–1161 (2013). [DOI] [PMC free article] [PubMed] [Google Scholar]
- 8.Califano A & Alvarez MJ The recurrent architecture of tumour initiation, progression and drug sensitivity. Nat. Rev. Cancer 17, 116–130 (2017). [DOI] [PMC free article] [PubMed] [Google Scholar]
- 9.Piovan E et al. Direct reversal of glucocorticoid resistance by AKT inhibition in acute lymphoblastic leukemia. Cancer Cell 24, 766–776 (2013). [DOI] [PMC free article] [PubMed] [Google Scholar]
- 10.Compagno M et al. Mutations of multiple genes cause deregulation of NF-kappaB in diffuse large B-cell lymphoma. Nature 459, 717–721 (2009). [DOI] [PMC free article] [PubMed] [Google Scholar]
- 11.Bisikirska B et al. Elucidation and pharmacological targeting of novel molecular drivers of follicular lymphoma progression. Cancer Res 76, 664–674 (2016). [DOI] [PMC free article] [PubMed] [Google Scholar]
- 12.Carro MS et al. The transcriptional network for mesenchymal transformation of brain tumours. Nature 463, 318–325 (2010). [DOI] [PMC free article] [PubMed] [Google Scholar]
- 13.Aytes A et al. Cross-species regulatory network analysis identifies a synergistic interaction between FOXM1 and CENPF that drives prostate cancer malignancy. Cancer Cell 25, 638–651 (2014). [DOI] [PMC free article] [PubMed] [Google Scholar]
- 14.Mitrofanova A, Aytes A, Shen C, Abate-Shen C & Califano A A systems biology approach to predict drug response for human prostate cancer based on in vivo preclinical analyses of mouse models. Cell Rep 12, 1–12 (2015). [DOI] [PMC free article] [PubMed] [Google Scholar]
- 15.Rajbhandari P et al. Cross-cohort analysis identifies a TEAD4-MYCN positive-feedback loop as the core regulatory element of high-risk neuroblastoma. Cancer Discov 8, 582–599 (2018). [DOI] [PMC free article] [PubMed] [Google Scholar]
- 16.Rodriguez-Barrueco R et al. Inhibition of the autocrine IL-6-JAK2-STAT3-calprotectin axis as targeted therapy for HR−/HER2+ breast cancers. Genes Dev 29, 1631–1648 (2015). [DOI] [PMC free article] [PubMed] [Google Scholar]
- 17.Luo J, Solimini NL & Elledge SJ Principles of cancer therapy: oncogene and non-oncogene addiction. Cell 136, 823–837 (2009). [DOI] [PMC free article] [PubMed] [Google Scholar]
- 18.Schreiber SL et al. Towards patient-based cancer therapeutics. Nat. Biotechnol 28, 904–906 (2010). [DOI] [PMC free article] [PubMed] [Google Scholar]
- 19.Lefebvre C et al. A human B-cell interactome identifies MYB and FOXM1 as master regulators of proliferation in germinal centers. Mol. Syst. Biol 6, 377 (2010). [DOI] [PMC free article] [PubMed] [Google Scholar]
- 20.Alvarez MJ et al. Functional characterization of somatic mutations in cancer using network-based inference of protein activity. Nat. Genet 48, 838–847 (2016). [DOI] [PMC free article] [PubMed] [Google Scholar]
- 21.Walsh LA et al. An integrated systems biology approach identifies TRIM25 as a key determinant of breast cancer metastasis. Cell Rep 20, 1623–1640 (2017). [DOI] [PMC free article] [PubMed] [Google Scholar]
- 22.Oberg K & Eriksson B Endocrine tumours of the pancreas. Best Pract. Res. Clin. Gastroenterol 19, 753–781 (2005). [DOI] [PubMed] [Google Scholar]
- 23.Francis JM et al. Somatic mutation of CDKN1B in small intestine neuroendocrine tumors. Nat. Genet 45, 1483–1486 (2013). [DOI] [PMC free article] [PubMed] [Google Scholar]
- 24.Konishi T et al. Prognosis and risk factors of metastasis in colorectal carcinoids: results of a nationwide registry over 15 years. Gut 56, 863–868 (2007). [DOI] [PMC free article] [PubMed] [Google Scholar]
- 25.Diez M, Teule A & Salazar R Gastroenteropancreatic neuroendocrine tumors: diagnosis and treatment. Ann. Gastroenterol 26, 29–36 (2013). [PMC free article] [PubMed] [Google Scholar]
- 26.Basso K et al. Reverse engineering of regulatory networks in human B cells. Nat. Genet 37, 382–390 (2005). [DOI] [PubMed] [Google Scholar]
- 27.Margolin AA et al. ARACNE: an algorithm for the reconstruction of gene regulatory networks in a mammalian cellular context. BMC Bioinformatics 7, S7 (2006). [DOI] [PMC free article] [PubMed] [Google Scholar]
- 28.Basso K et al. Integrated biochemical and computational approach identifies BCL6 direct target genes controlling multiple pathways in normal germinal center B cells. Blood 115, 975–984 (2010). [DOI] [PMC free article] [PubMed] [Google Scholar]
- 29.Faith JJ et al. Large-scale mapping and validation of Escherichia coli transcriptional regulation from a compendium of expression profiles. PLoS Biol 5, e8 (2007). [DOI] [PMC free article] [PubMed] [Google Scholar]
- 30.Cahan P et al. CellNet: network biology applied to stem cell engineering. Cell 158, 903–915 (2014). [DOI] [PMC free article] [PubMed] [Google Scholar]
- 31.Rosai J The origin of neuroendocrine tumors and the neural crest saga. Mod. Pathol 24, S53–S57 (2011). [DOI] [PubMed] [Google Scholar]
- 32.Barretina J et al. The Cancer Cell Line Encyclopedia enables predictive modelling of anticancer drug sensitivity. Nature 483, 603–607 (2012). [DOI] [PMC free article] [PubMed] [Google Scholar]
- 33.Pfragner R et al. Establishment and characterization of three novel cell lines -P-STS, L-STS, H-STS -derived from a human metastatic midgut carcinoid. Anticancer Res 29, 1951–1961 (2009). [PubMed] [Google Scholar]
- 34.Pfragner R et al. Establishment of a continuous cell line from a human carcinoid of the small intestine (KRJ-I). Int. J. Oncol 8, 513–520 (1996). [DOI] [PubMed] [Google Scholar]
- 35.Vijayvergia N et al. Molecular profiling of neuroendocrine malignancies to identify prognostic and therapeutic markers: a Fox Chase Cancer Center pilot study. Br. J. Cancer 115, 564–570 (2016). [DOI] [PMC free article] [PubMed] [Google Scholar]
- 36.Oberg K et al. A Delphic consensus assessment: imaging and biomarkers in gastroenteropancreatic neuroendocrine tumor disease management. Endocr. Connect 5, 174–187 (2016). [DOI] [PMC free article] [PubMed] [Google Scholar]
- 37.Jiao Y et al. DAXX/ATRX, MEN1, and mTOR pathway genes are frequently altered in pancreatic neuroendocrine tumors. Science 331, 1199–1203 (2011). [DOI] [PMC free article] [PubMed] [Google Scholar]
Associated Data
This section collects any data citations, data availability statements, or supplementary materials included in this article.