

Abstract
Background:
The clinical impact of increased torsion on patellar instability and patellofemoral pain syndrome (PFPS) has been suggested by several studies.
Hypothesis:
The hypotheses of this study were that (1) torsional malalignment (TM) is characterized by a positive correlation between different malalignment parameters that represent an overall picture of the malalignment syndrome and (2) an increase in overall torsion is the underlying difference between patellar instability and isolated patellofemoral pain.
Study Design:
Cohort study; Level of evidence, 3.
Methods:
Between April 2015 and July 2017, a total of 428 patients were treated for lateral patellar dislocation (LPD), and 333 patients were treated for PFPS. Sixty-two patients (14.5%) with patellar instability (LPD group) and 29 patients (8.7%) with patellofemoral pain (PFPS group) had additional TM and were included in this study. All patients underwent magnetic resonance imaging for torsional alignment and patellar tracking, including femoral antetorsion, tibial torsion, knee rotation, tibial tuberosity–trochlear groove (TT-TG) distance, tibial tuberosity–posterior cruciate ligament (TT-PCL) distance, Dejour classification of trochlear dysplasia, lateral trochlear inclination (LTI) angle, and patellar height.
Results:
The LPD and PFPS groups differed significantly in terms of trochlear dysplasia (P < .001), LTI angle (P < .001), and TT-TG distance (P = .0167) but did not differ in terms of femoral antetorsion (20.02° ± 8.80° vs 20.03° ± 7.91°, respectively; P = .8545), tibial torsion (39.53° ± 9.23° vs 41.24° ± 7.28°, respectively; P = .3616), or knee rotation (10.42° ± 5.16° vs 8.48° ± 7.81°, respectively; P = .0163). Only measures of TT-TG distance and TT-PCL distance and measures of TT-TG distance and knee rotation were positively correlated. Trochlear dysplasia (type B-D) was identified as the only significant predictor of patellar instability.
Conclusion:
TM in patients with either PFPS or LPD does not appear to be characterized by a fixed constellation of different malalignment parameters. Between groups, the parameters differed significantly only in terms of trochlear dysplasia and the TT-TG distance, and trochlear dysplasia (type B-D) (but not torsion) was identified as a predictor of lateral patellar instability.
Keywords: torsional malalignment, patellar instability, patellofemoral pain
The undisturbed course of the patella within the trochlear groove is determined by a complex interplay of several anatomic components. In this regard, trochlear dysplasia, patellar height, tibial tuberosity–trochlear groove (TT-TG) distance, genu valgum, and femoral antetorsion (anteversion) have been identified as crucial parameters.9,15,32 In particular, increased antetorsion of the femur has been investigated in association with patellar instability, and recent studies demonstrated the need for torsional (derotating) osteotomy of the femur.10,16,25,27
Although older studies have described increased tibial torsion as a relevant parameter of patellar dislocation,5,8 Diederichs et al12 reported that tibial torsion was the only rotational parameter for which no significant difference was found between patients with lateral patellar instability and control participants. Controversially, a few recent studies have found that torsional osteotomy of the tibia led to patellofemoral stability and significant pain relief.11,13,33
Torsional (rotational) malalignment of the lower extremities has been associated with both lateral patellar dislocation (LPD) and patellofemoral pain syndrome (PFPS).4,11,14 Clinically, patients present with a marked inward knee rotation (squinting patella) that is apparent in the stance position when the feet are pointing straight ahead (Figure 1a). This condition has been ascribed mainly to increased femoral antetorsion, although it can also be caused by primary external tibial torsion.4,8 If both factors are present, it is also referred to as “miserable malalignment.”20
Figure 1.

(a) Photograph of a young female patient. On the left side, a squinting patella while standing is demonstrated. The right limb, which had a similar deformity, is shown 6 months after derotation osteotomy of the femur and tibia. (b) Assessment of internal hip rotation. In the prone position, the knee is flexed to 90°, and the foot is maximally inclined outward. The angle between the longitudinal tibial shaft axis, A, and a vertical reference line, B, equals internal hip rotation. (c) Assessment of tibial torsion. In the prone position, the knee is flexed to 90°, and the ankle is positioned in neutral dorsiflexion. Line A corresponds to the transcondylar axis, and line B corresponds to the transmalleolar axis. Tibial torsion equals angle AB.
From the data in the literature, a conclusive picture of the incidence and relationship between the different torsional and limb alignment parameters has not been obtained in patients presenting with torsional malalignment (TM). Thus, the aim of this study was 2-fold: (1) to evaluate femoral and tibial torsion and their possible correlation with other parameters of limb (mal)alignment in patients with TM and (2) to test for anatomic differences in patients with TM presenting with either PFPS or LPD. The hypotheses were that (1) TM is characterized by a positive correlation between different malalignment parameters that represent an overall picture of TM and (2) an increase in overall torsion is the underlying difference between patellar instability and isolated patellofemoral pain.
Methods
Study Population
Between April 2015 and July 2017, a total of 428 patients were treated for LPD, and 333 patients were treated for PFPS. Of these patients, 14.5% of the LPD group (62 patients; 10 male/52 female; mean age, 24.55 years) and 8.7% of the PFPS group (29 patients; 3 male/26 female; mean age, 23.69 years) presented with TM on physical examination and underwent additional magnetic resonance imaging (MRI) for torsional alignment. After institutional review board approval, the patients with TM were included in this study and were divided according to those with patellofemoral pain without episodes of LPD (PFPS group) and with episodes of LPD (LPD group).
Physical Examination
Patients classified as having increased femoral and/or tibial torsion had to fulfill at least 1 of the following 4 criteria: (1) appearance of a squinting patella or inwardly pointing knee while standing (Figure 1), (2) difference of more than 30° between internal and external rotation of the passive hip in the prone position, (3) ≥70° of internal hip rotation determined by the method of Staheli et al31 in the prone position (Figure 1b), and (4) increase in tibial torsion in the prone position determined by the method of Stuberg et al34 (Figure 1c).
The physical examination included an evaluation of the long axis of the leg in standing and supine positions; assessments for knee joint effusion, capsular swelling, and tenderness along the medial and lateral retinacular structures and along the quadriceps or patellar tendon; measurement of knee joint range of motion; the patellar glide test; the patellar apprehension test at 30° of knee joint flexion; an evaluation of the J-sign; and assessments of patellofemoral crepitus and the patella locking or snapping during active and passive knee joint movements. Two-legged and 1-legged squats were used to visualize dynamic valgus malalignment (balance, trunk posture, pelvis posture, hip adduction, and knee valgus were assessed), and patients were also screened for foot disorders or deformities that may contribute to functional valgus instability, such as increased rear-foot eversion or pes pronatus valgus.
Magnetic Resonance Imaging
All MRI investigations were performed with a 1.5-T imager (Avanto; Siemens). The patients underwent imaging with a body matrix and PA matrix coil with the knee positioned in full extension and feet in neutral dorsiflexion–plantar flexion. The following sequences were routinely performed and used for this study: half-Fourier acquisition single-shot turbo spin echo sequences (hip joint: 200 × 200–mm field of view [FOV], 1582/112-millisecond repetition time [TR]/echo time [TE], and 150° flip angle; knee joint: 372 × 372–mm FOV, 600/66-millisecond TR/TE, and 146° flip angle; and ankle joint: 380 × 380–mm FOV, 600/66-millisecond TR/TE, and 146° flip angle) with a 5-mm slice thickness and both legs included in the FOV. Eight established parameters of limb alignment and patellar tracking were assessed as previously published.7,9,12,17,21,28–30
Femoral Antetorsion
Femoral antetorsion was defined as the angle formed between the axis of the femoral neck and the tangent drawn along the most posterior aspects of both femoral condyles. The femoral neck axis was assessed according to the technique described by Jarrett et al.21 This technique used an oblique transverse slice displaying the femoral head and the femoral neck in a single image (Figure 2a). The femoral neck axis was defined as a line parallel to the center of the femoral neck (blue plane in Figure 2a and solid line in Figure 2d). Positive values between the femoral neck axis and the posterior condylar axis (solid line in Figure 2e) indicate femoral antetorsion, and negative values indicate femoral retrotorsion. Using this technique, 15° ± 7° of femoral antetorsion can be considered a normative value.
Figure 2.
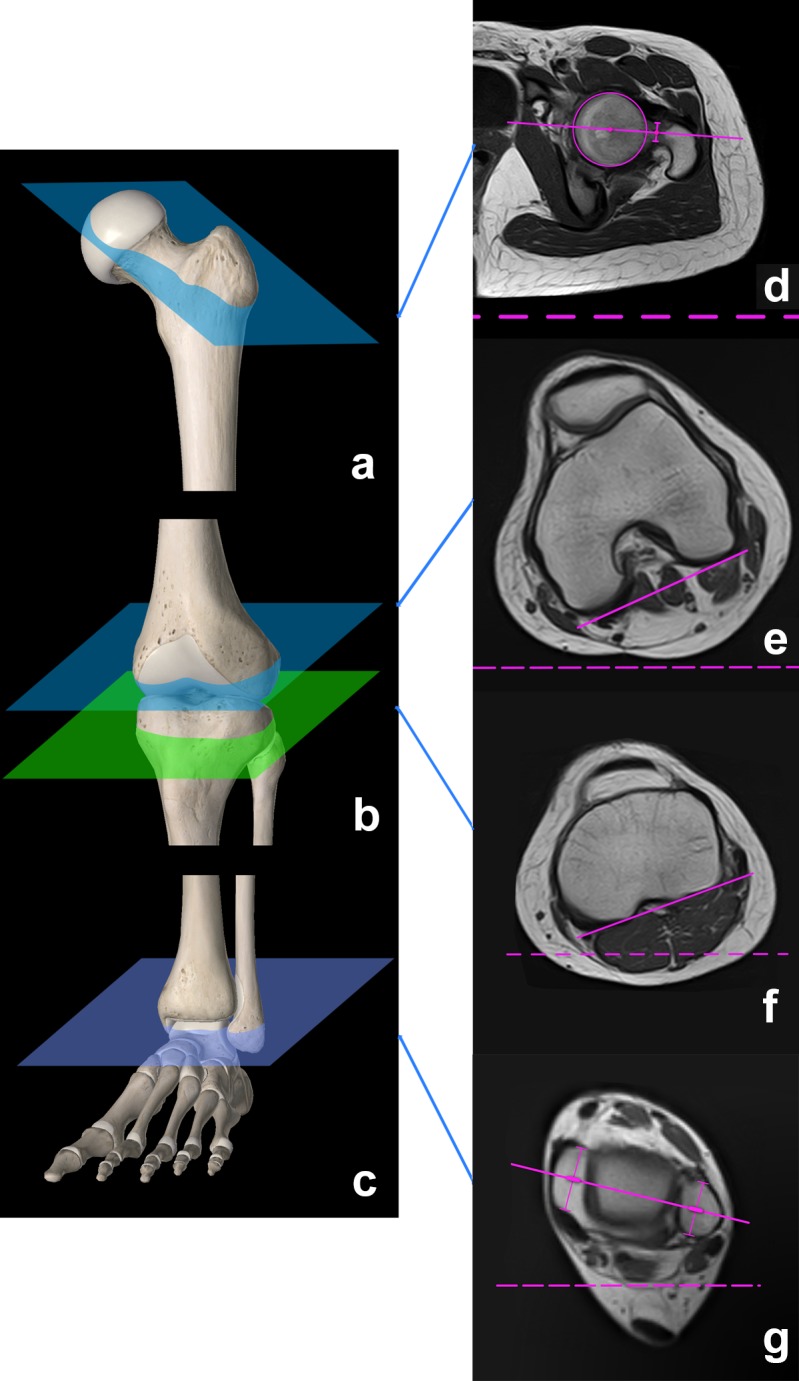
(a-c) Reference planes for magnetic resonance imaging of torsional alignment. Femoral antetorsion was defined on the basis of the angle formed between (d) the axis of the femoral neck and (e) the tangent drawn along the most posterior aspects of both femoral condyles. Tibial torsion was defined on the basis of the angle formed between (f) the tibial head and (g) the distal tibia/ankle joint. Knee rotation was assessed on the basis of the angle formed between the tangent drawn (e) along the most posterior aspect of both femoral condyles and (f) along the posterior aspect of the proximal tibial head.
Tibial Torsion
Tibial torsion was defined as the angle formed between the tibial head and the distal tibia/ankle joint and was also determined according to previously published methods.12 The first line was drawn along the posterior aspect of the proximal tibial head (located between the femorotibial joint and the proximal tibiofibular joint on transverse slices) (green plane in Figure 2b and solid line in Figure 2f), and the second line was drawn distally through the transmalleolar axis (Figure 2c and solid line in Figure 2g). Tibial torsion was measured as the angle between those 2 lines, with positive values indicating external torsion of the distal tibia relative to the proximal tibia. Using this technique, 25° ± 7° of tibial torsion can be considered a normative value.12
Knee Rotation
Knee rotation was assessed on the basis of the angle formed between the tangent drawn along the most posterior aspect of both femoral condyles (posterior condylar axis, Figure 2e) and along the posterior aspect of the proximal tibial head (Figure 2f).12 Positive values between those 2 lines indicate external knee rotation, and negative values indicate internal knee rotation.
TT-TG Distance and Tibial Tuberosity–Posterior Cruciate Ligament Distance
The TT-TG distance was assessed according to the method of Schoettle et al.29 The first transverse craniocaudal image that depicted a complete cartilaginous trochlea was used to determine the deepest point within the trochlear groove. A line was drawn through the deepest point of the trochlear groove, perpendicular to the posterior condyle tangent. A second line was drawn parallel to the trochlear line through the most anterior portion of the tibial tubercle. The distance between the 2 lines represented the TT-TG distance.
The tibial tuberosity–posterior cruciate ligament (TT-PCL) distance was assessed according to Seitlinger et al30 and was measured as the mediolateral distance between the midpoint of the insertion of the patellar tendon and the medial border of the posterior cruciate ligament. The distance was measured perpendicular to the tangent along the posterior aspect of the proximal tibial head.
Trochlear Dysplasia
Trochlear dysplasia was assessed on transverse MRI as described by Fucentese et al.17 The classification system was defined according to Dejour et al9 as follows: type A consisted of a trochlear morphology with a fairly shallow trochlea; type B consisted of a flat trochlea; type C consisted of asymmetrical trochlear facets with a convex lateral facet and a hypoplastic medial facet; and type D consisted of asymmetrical trochlear facets, a hypoplastic medial facet, and a cliff pattern.
Lateral Trochlear Inclination Angle
The lateral trochlear inclination (LTI) angle was formed between the plane of the lateral trochlear facet and a tangential line through the posterior femoral condyles. The mean value of the LTI angle is 17° in knees without trochlear dysplasia. Using a diagnostic threshold of 11°, this measure has shown a sensitivity of 93% and a specificity of 87% for trochlear dysplasia6 and is recommended for use in the assessment of trochlear dysplasia.28
Patellar Height
Patellar height was evaluated on lateral knee joint radiographs in 30° of knee joint flexion according to the Caton-Deschamps index.7 Patella alta was considered at a ratio >1.2.
Statistical Analysis
Data were checked for normality using the Kolmogorov-Smirnov test. Group comparisons were conducted with the Wilcoxon rank-sum, Kruskal-Wallis, or Fisher exact test. The Spearman rank correlation coefficient was used to assess the association between 2 continuous variables. Variables that were significantly different between the LPD and PFPS groups were further analyzed in a multiple logistic regression model. A penalized Firth correction was employed in the model because of quasi-complete data separation. The significance level was set to a 2-sided alpha of 5% for all statistical tests. In cases involving multiple tests, raw P values were adjusted by the Holm-Bonferroni method.
A simulation-based power analysis was conducted for the correlation analysis to evaluate the power to detect significant Spearman correlations between 2 variables using 91 samples. The significance level was set to alpha = 5%/36 to maintain a family-wise error rate of 5% across 36 correlation tests (all pairwise comparisons between 9 variables). In 10,000 iterations, 2 Gaussian variables with a given correlation coefficient were simulated. In these settings, 91 samples were sufficient to uncover a correlation of 0.38, with a power of 80% considered significant. All analyses were performed with R statistics software (version 3.4.0; www.r-project.org).
Results
The LPD and PFPS groups differed significantly in terms of trochlear dysplasia (P < .001), LTI angle (P < .001), and TT-TG distance (P = .0167) (Tables 1 and 2). The LTI angle and TT-TG distance depended on the severity of trochlear dysplasia (P < .001 and P = .0202, respectively) (Table 2). For all other limb alignment parameters and torsional parameters in particular (femoral antetorsion, tibial torsion, and knee rotation), no significant differences were observed between both groups (Table 1).
TABLE 1.
Demographics and Results of Alignment Parametersa
| Variable | LPD Group | PFPS Group | P Value | Adjusted P Valueb |
|---|---|---|---|---|
| Age, y | 24.55 ± 7.86 | 23.69 ± 8.30 | .45 | >.99 |
| Sex, n (%) | .5393 | >.99 | ||
| Male | 10 (16.1) | 3 (10.3) | ||
| Female | 52 (83.9) | 26 (89.7) | ||
| Femoral antetorsion, deg | 20.02 ± 8.80 | 20.03 ± 7.91 | .8545 | >.99 |
| Tibial torsion, deg | 39.53 ± 9.23 | 41.24 ± 7.28 | .3616 | >.99 |
| Overall torsion (femur + tibia), deg | 59.55 ± 14.02 | 61.28 ± 13.10 | .6424 | >.99 |
| Knee rotation, deg | 10.42 ± 5.16 | 8.48 ± 7.81 | .0163 | .1302 |
| TT-PCL distance, mm | 20.47 ± 4.34 | 18.79 ± 3.30 | .023 | .1609 |
| TT-TG distance, mm | 14.48 ± 4.29 | 11.97 ± 3.48 | .0019 | .0167 |
| Trochlear dysplasia, n (%) | <.001 | <.001 | ||
| Type A | 5 (8.1) | 15 (51.7) | ||
| Type B | 12 (19.4) | 4 (13.8) | ||
| Type C | 13 (21.0) | 0 (0.0) | ||
| Type D | 32 (51.6) | 0 (0.0) | ||
| No dysplasia | 0 (0.0) | 10 (34.5) | ||
| LTI angle, deg | 10.51 ± 6.35 | 19.41 ± 4.08 | <.001 | <.001 |
| Caton-Deschamps index | 1.17 ± 0.23 | 1.16 ± 0.22 | .7536 | >.99 |
aData are shown as mean ± SD unless otherwise indicated. Group comparisons were conducted with the Mann-Whitney U and Fisher exact tests. Bolded values indicate statistical significance (P < .05). LPD, lateral patellar dislocation; LTI, lateral trochlear inclination; PFPS, patellofemoral pain syndrome; TT-PCL, tibial tuberosity–posterior cruciate ligament; TT-TG, tibial tuberosity–trochlear groove.
bHolm-Bonferroni–adjusted P values.
TABLE 2.
Alignment Parameters According to Severity of Trochlear Dysplasiaa
| Variable | Trochlear Dysplasia | P Value | Adjusted P Valueb | ||||
|---|---|---|---|---|---|---|---|
| Type A | Type B | Type C | Type D | No Dysplasia | |||
| Age, y | 25.30 ± 10.10 | 24.81 ± 5.67 | 23.08 ± 8.32 | 25.06 ± 8.18 | 20.40 ± 4.33 | .3429 | >.99 |
| Femoral antetorsion, deg | 21.50 ± 7.12 | 18.00 ± 7.85 | 23.62 ± 9.15 | 19.81 ± 8.95 | 16.30 ± 8.74 | .1731 | .8653 |
| Tibial torsion, deg | 40.60 ± 8.32 | 40.81 ± 9.50 | 40.77 ± 10.35 | 38.53 ± 8.21 | 41.90 ± 7.88 | .799 | >.99 |
| Overall torsion (femur + tibia), deg | 62.10 ± 13.04 | 58.81 ± 11.55 | 64.38 ± 16.45 | 58.34 ± 13.84 | 58.20 ± 14.78 | .7214 | >.99 |
| Knee rotation, deg | 8.30 ± 4.34 | 7.69 ± 4.45 | 10.92 ± 4.82 | 11.47 ± 5.23 | 9.40 ± 12.49 | .022 | .1542 |
| TT-PCL distance, mm | 18.70 ± 3.63 | 19.69 ± 3.36 | 19.15 ± 4.86 | 21.44 ± 4.48 | 19.00 ± 2.67 | .0595 | .3572 |
| TT-TG distance, mm | 12.05 ± 3.58 | 13.56 ± 3.92 | 12.38 ± 4.54 | 15.88 ± 3.90 | 11.80 ± 3.82 | .0025 | .0202 |
| LTI angle, deg | 19.35 ± 5.40 | 14.88 ± 3.93 | 11.69 ± 4.17 | 6.95 ± 4.25 | 21.50 ± 4.38 | <.001 | <.001 |
| Caton-Deschamps index | 1.06 ± 0.22 | 1.19 ± 0.26 | 1.27 ± 0.26 | 1.16 ± 0.22 | 1.16 ± 0.11 | .1733 | .8653 |
aData are shown as mean ± SD. Group comparisons were conducted with the Kruskal-Wallis and Fisher exact tests. Bolded values indicate statistical significance (P < .05). LTI, lateral trochlear inclination; TT-PCL, tibial tuberosity–posterior cruciate ligament; TT-TG, tibial tuberosity–trochlear groove.
bHolm-Bonferroni–adjusted P values.
As measures of coronal alignment, the TT-TG and TT-PCL distances showed a positive correlation (P < .001), and positive correlations were also observed for the TT-TG distance and knee rotation (P = .0153). Although femoral antetorsion and tibial torsion were correlated with overall torsion, neither correlated with each other or with any other parameter of limb alignment (Table 3).
TABLE 3.
Correlation Analysis of Alignment Parametersa
| Variable 1 | Variable 2 | Spearman Rhob | P Value | Adjusted P Valuec |
|---|---|---|---|---|
| Tibial torsion | Femoral antetorsion | 0.26 | .0143 | .3995 |
| Overall torsion (femur + tibia) | Femoral antetorsion | 0.78 | <.001 | <.001 |
| TT-PCL distance | Femoral antetorsion | 0.09 | .4044 | >.99 |
| TT-TG distance | Femoral antetorsion | 0.11 | .2981 | >.99 |
| Knee rotation | Femoral antetorsion | 0.20 | .0568 | >.99 |
| Caton-Deschamps index | Femoral antetorsion | 0.03 | .778 | >.99 |
| LTI angle | Femoral antetorsion | 0.01 | .9572 | >.99 |
| Age | Femoral antetorsion | –0.03 | .7556 | >.99 |
| Overall torsion (femur + tibia) | Tibial torsion | 0.79 | <.001 | <.001 |
| TT-PCL distance | Tibial torsion | –0.01 | .9346 | >.99 |
| TT-TG distance | Tibial torsion | –0.12 | .2633 | >.99 |
| Knee rotation | Tibial torsion | –0.29 | .0061 | .1779 |
| Caton-Deschamps index | Tibial torsion | 0.06 | .5936 | >.99 |
| LTI angle | Tibial torsion | 0.23 | .0294 | .7942 |
| Age | Tibial torsion | –0.06 | .5613 | >.99 |
| TT-PCL distance | Overall torsion (femur + tibia) | 0.05 | .6067 | >.99 |
| TT-TG distance | Overall torsion (femur + tibia) | 0.00 | .9832 | >.99 |
| Knee rotation | Overall torsion (femur + tibia) | –0.06 | .5627 | >.99 |
| Caton-Deschamps index | Overall torsion (femur + tibia) | 0.04 | .7167 | >.99 |
| LTI angle | Overall torsion (femur + tibia) | 0.15 | .146 | >.99 |
| Age | Overall torsion (femur + tibia) | –0.05 | .6605 | >.99 |
| TT-TG distance | TT-PCL distance | 0.52 | <.001 | <.001 |
| Knee rotation | TT-PCL distance | 0.23 | .0308 | .8012 |
| Caton-Deschamps index | TT-PCL distance | 0.00 | .9869 | >.99 |
| LTI angle | TT-PCL distance | –0.29 | .0055 | .1638 |
| Age | TT-PCL distance | 0.08 | .4426 | >.99 |
| Knee rotation | TT-TG distance | 0.36 | <.001 | .0153 |
| Caton-Deschamps index | TT-TG distance | –0.02 | .848 | >.99 |
| LTI angle | TT-TG distance | –0.31 | .0024 | .0741 |
| Age | TT-TG distance | 0.11 | .2818 | >.99 |
| Caton-Deschamps index | Knee rotation | –0.10 | .4262 | >.99 |
| Age | Knee rotation | 0.02 | .8242 | >.99 |
| LTI angle | Caton-Deschamps index | –0.03 | .8093 | >.99 |
| Age | Caton-Deschamps index | –0.01 | .9459 | >.99 |
| Age | LTI angle | –0.15 | .1592 | >.99 |
aBolded values indicate statistical significance (P < .05). LTI, lateral trochlear inclination; TT-PCL, tibial tuberosity–posterior cruciate ligament; TT-TG, tibial tuberosity–trochlear groove.
bSpearman rho is a measure of the correlation between 2 numerical variables as well as the corresponding P value.
cHolm-Bonferroni–adjusted P values.
The multiple logistic regression model identified severe trochlear dysplasia (type B-D) as the single predictor of patellar instability (type B: P = .0011; type C and D: P < .001) (Table 4).
TABLE 4.
Logistic Regression Analysisa
| Variable | Estimate | Odds Ratio (95% CI) | P |
|---|---|---|---|
| Intercept | –3.96 | .0886 | |
| LTI angle | 0.01 | 1.01 (0.86-1.17) | .8567 |
| TT-TG distance | 0.06 | 1.06 (0.87-1.30) | .5597 |
| Trochlear dysplasia | |||
| Type A | 2.00 | 7.40 (0.71-1010.56) | .1042 |
| Type B | 3.96 | 52.54 (4.01-7811.44) | .0011 |
| Type C | 6.27 | 529.40 (17.37-190,642.68) | <.001 |
| Type D | 7.03 | 1130.00 (23.86-488,354.15) | <.001 |
aMultiple logistic regression results showing the significantly different variables between the groups. Bolded values indicate statistical significance (P < .05). LTI, lateral trochlear inclination; TT-TG, tibial tuberosity–trochlear groove.
Discussion
The purpose of this study was to test for correlations of limb (mal)alignment parameters and evaluate anatomic differences in patients with TM suffering from either PFPS or LPD. With the given study size, the main findings indicate that (1) TM is not characterized by a fixed constellation of (mal)alignment parameters and (2) trochlear dysplasia (but not increased torsion) predicts lateral patellar instability. Our hypotheses that TM is characterized by a positive correlation between different malalignment parameters and that an increase in overall torsion is the underlying difference between patellar instability and patellofemoral pain were therefore not supported.
Analyses of patellar instability are always complicated by the high degree of individual variability in terms of combinations of and differences in risk factors, which makes it difficult to accurately isolate the roles of these factors in contributing to patellar dislocation.1 A biomechanical study by Kaiser et al23 showed that in the medial patellofemoral ligament (MPFL)–intact state, a 20° increase in femoral antetorsion significantly increased the force shift of the patella toward the lateral side, whereas in MPFL-deficient knees, a 10° increase in femoral antetorsion represented a significant risk factor for patellar instability. Nelitz et al27 also identified the previously ignored high femoral antetorsion as a reason for revision surgery, and Franciozi et al16 showed that increased femoral antetorsion had a negative effect on the outcome after anteromedialization of the tibial tuberosity combined with MPFL reconstruction. In addition, further studies have reported good results after torsional osteotomy of the femur or tibia in patients in whom the symptoms of anterior knee pain or patellar instability were mainly triggered by a torsional deformity.4,5,10,11,13,25,27,33
Currently, a clear consensus has not been reached regarding the torsion threshold to indicate surgical correction. In recent studies, the mean extent of torsional correction ranged from 11° to 25° for the femur and from 11° to 36° for the tibia.39 Therefore, torsional osteotomy might be considered in symptomatic patients with an increase in femoral or tibial torsion of at least 10° above normative values. It is important to note that values strongly depend on the measurement technique used. In particular, femoral antetorsion can be assessed by multiple measurement techniques, with normative values varying from 11° to 22°.22 Thus, for indicating torsional osteotomy, values for femoral torsion always need to be interpreted relative to the measurement technique used.39 However, the findings of this study suggest a reduced importance of torsion for patellofemoral stability in that only trochlear dysplasia could be identified as a parameter associated with patellar dislocation.
The biomechanical impact of the trochlear groove has been confirmed by several cadaveric studies and computational analyses, which identified the sulcus angle as the most impactful parameter of total patellofemoral constraint.15,37 In an attempt to weigh the relative importance, Fitzpatrick et al15 used a computational finite element analysis to study multiple factors contributing to patellar instability, and they found that the relative importance of trochlear shape, patella alta, and TT-TG distance to the overall constraint of the patellofemoral joint reached 36%, 26%, and 26%, respectively, whereas femoral antetorsion contributed only 12%. These findings support the results of our study. In addition, recent clinical observations have shown an increasing correlation between the severity of trochlear dysplasia, the clinical outcome, and the redislocation rate after isolated soft tissue patella-stabilizing procedures.18,19 In particular, the presence of a severely dysplastic trochlea increased the likelihood of postoperative redislocation in patients who underwent MPFL reconstruction alone when compared with patients who underwent trochleoplasty plus individual extensor apparatus balancing.2
Previous studies have also investigated a possible correlation between malalignment parameters and other anatomic factors of patellar instability. Diederichs et al12 found markedly increased femoral antetorsion and knee rotation in patients with atraumatic dislocation when compared with healthy controls, but they found no convincing correlation between torsional parameters and the severity of trochlear dysplasia, patella alta, and TT-TG distance. In contrast, Liebensteiner et al24 reported that the morphology of the trochlea was significantly related to femoral antetorsion in that increased antetorsion was associated with a flatter, more dysplastic trochlea, although this correlation could not be confirmed by the results of the present study. One reason for the discrepancies might be the wide range of normal variation in healthy controls, precluding the demonstration of differences between patients and controls.12 To overcome this potential drawback, only symptomatic patients with increased femoral and tibial torsion were included in this study, and patients were distinguished according to 2 clinical entities, LPD and PFPS, which can be considered a strength of this study. However, a typical constellation of torsional and other malalignment parameters could not be established for this specific patient population.
A positive correlation was found for TT-TG and TT-PCL distances and for TT-TG distance and knee rotation. The TT-PCL distance was introduced as a further development for the assessment of coronal malalignment to overcome the confounding effects of the TT-TG distance measurement technique, such as knee joint positioning, knee flexion angle, joint size, and trochlear dysplasia.3,30,38 The TT-TG distance was significantly different between the LPD and PFPS groups but was not an independent predictor of patellar instability in the multiple logistic regression analysis. This finding and the fact that the TT-PCL distance was not significantly different between groups suggest that any apparent relationship between the TT-TG distance and patellar instability was dependent on the presence of trochlear dysplasia. In addition, Tensho et al35 showed that the TT-TG distance was more strongly affected by knee rotation and was less affected by malpositioning of the tibial tubercle or trochlear groove. Therefore, the correlations found in this study are conclusive and in accordance with previous results.
In our clinical population of patients with either PFPS or LPD, the overall incidence of TM was 11.9% (LPD group: 14.5%; PFPS group: 8.7%). This finding is comparable with previous findings10,11 and indicates that in most cases, factors other than increased torsion are more crucial to the problem of patellar instability and anterior knee pain. However, the clinical impact of increased torsion on both clinical entities has been suggested by several studies.4,5,8,10–14,25,27,33 Thus, this study aimed to provide a more detailed view of the anatomic conditions in patients with TM and indicated that trochlear dysplasia (but not increased torsion) primarily predicts lateral patellar instability. However, the results must be interpreted within the limits of this study. First, the assessment and classification of a dysplastic trochlea remain major challenges. Tscholl et al36 showed that trochlear dysplasia measured on lateral radiographs and MRI demonstrated only fair agreement and that MRI analyses that considered only the cartilaginous trochlea tended to underestimate the severity of dysplasia. Quantitative single-measurement parameters of the femoral trochlea, that is, the sulcus angle, trochlear depth, or trochlear facet asymmetry, seem to be of limited value for the assessment of the complex trochlear anatomy26; however, the LTI angle is rated as the most appropriate measure by an expert panel.28 In this study, the LTI angle continuously decreased as the severity of trochlear dysplasia (type A-D) increased, indicating a sufficient classification according to the Dejour criteria.
A second study limitation is that only those patients with the clinical appearance of increased torsion underwent additional torsional MRI, thus introducing potential selection bias. However, previous studies has shown that torsion can be accurately predicted by a physical examination.31,34 Third, genu valgum could be an important factor for patellar tracking. Long-leg radiographs were obtained in patients with the clinical aspect of varus or valgus malalignment but not as a routine examination in all patients. Therefore, we did not include this parameter in our analysis, and a relevant varus/valgus deviation was noted in less than 10% of patients. Finally, we did not perform a test-retest reliability assessment of investigated parameters, as this has been performed in numerous previous studies.
Conclusion
TM in patients with either PFPS or LPD does not appear to be characterized by a fixed constellation of different malalignment parameters. Between groups, the parameters differed significantly only in terms of trochlear dysplasia and the TT-TG distance, with trochlear dysplasia (type B-D) (but not torsion) identified as a predictor of lateral patellar instability.
Acknowledgment
The authors express their thanks to Andreas Leha, MSc, at the Department of Medical Statistics, University Medical Center Göttingen, University of Göttingen, for statistical support.
Footnotes
The authors declared that there are no conflicts of interest in the authorship and publication of this contribution. AOSSM checks author disclosures against the Open Payments Database (OPD). AOSSM has not conducted an independent investigation on the OPD and disclaims any liability or responsibility relating thereto.
Ethical approval for this study was obtained from the Ethics Committee of Baden-Württemberg (F-2018-004).
References
- 1. Balcarek P, Oberthür S, Hopfensitz S, et al. Which patellae are likely to redislocate? Knee Surg Sports Traumatol Arthrosc. 2014;22:2308–2314. [DOI] [PubMed] [Google Scholar]
- 2. Balcarek P, Rehn S, Howells NR, et al. Results of medial patellofemoral ligament reconstruction compared with trochleoplasty plus individual extensor apparatus balancing in patellar instability caused by severe trochlear dysplasia: a systematic review and meta-analysis. Knee Surg Sports Traumatol Arthrosc. 2016;25:3869–3877. [DOI] [PubMed] [Google Scholar]
- 3. Brady JM, Sullivan JP, Nguyen J, et al. The tibial tubercle-to-trochlear groove distance is reliable in the setting of trochlear dysplasia, and superior to the tibial tubercle-to-posterior cruciate ligament distance when evaluating coronal malalignment in patellofemoral instability. Arthroscopy. 2017;33:2026–2034. [DOI] [PubMed] [Google Scholar]
- 4. Bruce WD, Stevens PM. Surgical correction of miserable malalignment syndrome. J Pediatr Orthop. 2004;24:392–396. [DOI] [PubMed] [Google Scholar]
- 5. Cameron JC, Saha S. External tibial torsion: an underrecognized cause of recurrent patellar dislocation. Clin Orthop Relat Res. 1996;328:177–184. [PubMed] [Google Scholar]
- 6. Carrillon Y, Abidi H, Dejour D, Fantino O, Moyen B, Tran-Minh VA. Patellar instability: assessment on MR images by measuring the lateral trochlear inclination. Initial experience. Radiology. 2000;216:582–585. [DOI] [PubMed] [Google Scholar]
- 7. Caton J, Deschamps G, Chambat P, Lerat JL, Dejour H. Patella infera: a propos of 128 cases. Rev Chir Orthop Reparatrice Appar Mot. 1982;68:317–325. [PubMed] [Google Scholar]
- 8. Cooke TD, Price N, Fisher B, Hedden D. The inwardly pointing knee: an unrecognized problem of external rotational malalignment. Clin Orthop Relat Res. 1990;260:56–60. [PubMed] [Google Scholar]
- 9. Dejour H, Walch G, Nove-Josserand L, Guier C. Factors of patellar instability: an anatomic radiographic study. Knee Surg Sports Traumatol Arthrosc. 1994;2:19–26. [DOI] [PubMed] [Google Scholar]
- 10. Dickschas J, Harrer J, Reuter B, Schwitulla J, Strecker W. Torsional osteotomies of the femur. J Orthop Res. 2015;33:318–324. [DOI] [PubMed] [Google Scholar]
- 11. Dickschas J, Tassika A, Lutter C, Harrer J, Strecker W. Torsional osteotomies of the tibia in patellofemoral dysbalance. Arch Orthop Trauma Surg. 2017;137:179–185. [DOI] [PubMed] [Google Scholar]
- 12. Diederichs G, Köhlitz T, Kornaropoulos E, Heller MO, Vollnberg B, Scheffler S. Magnetic resonance imaging analysis of rotational alignment in patients with patellar dislocations. Am J Sports Med. 2013;41:51–57. [DOI] [PubMed] [Google Scholar]
- 13. Drexler M, Dwyer T, Dolkart O, et al. Tibial rotational osteotomy and distal tuberosity transfer for patella subluxation secondary to excessive external tibial torsion: surgical technique and clinical outcome. Knee Surg Sports Traumatol Arthrosc. 2014;22:2682–2689. [DOI] [PubMed] [Google Scholar]
- 14. Erkocak OF, Altan E, Altintas M, Turkmen F, Aydin BK, Bayar A. Lower extremity rotational deformities and patellofemoral alignment parameters in patients with anterior knee pain. Knee Surg Sports Traumatol Arthrosc. 2016;24:3011–3020. [DOI] [PubMed] [Google Scholar]
- 15. Fitzpatrick CK, Steensen RN, Tumuluri A, Trinh T, Bentley J, Rullkoetter PJ. Computational analysis of factors contributing to patellar dislocation. J Orthop Res. 2016;34:444–453. [DOI] [PubMed] [Google Scholar]
- 16. Franciozi CE, Ambra LF, Albertoni LJ, et al. Increased femoral anteversion influence over surgically treated recurrent patellar instability patients. Arthroscopy. 2017;33:633–640. [DOI] [PubMed] [Google Scholar]
- 17. Fucentese SF, von Roll A, Koch PP, Epari DR, Fuchs B, Schottle PB. The patella morphology in trochlear dysplasia: a comparative MRI study. Knee. 2006;13:145–150. [DOI] [PubMed] [Google Scholar]
- 18. Hiemstra LA, Kerslake S, Lafave MR. Quality-of-life outcomes of patients following patellofemoral stabilization surgery: the influence of trochlear dysplasia. J Knee Surg. 2017;30:887–893. [DOI] [PubMed] [Google Scholar]
- 19. Hiemstra LA, Kerslake S, Loewen M, Lafave M. Effect of trochlear dysplasia on outcomes after isolated soft tissue stabilization for patellar instability. Am J Sports Med. 2016;44:1515–1523. [DOI] [PubMed] [Google Scholar]
- 20. James SL. Chondromalacia of the patella in the adolescent In: Kennedy JC, ed. The Injured Adolescent Knee. Baltimore: Williams and Wilkins; 1979:205–251. [Google Scholar]
- 21. Jarrett DY, Oliveira AM, Zou KH, Snyder BD, Kleinman PK. Axial oblique CT to assess femoral anteversion. AJR Am J Roentgenol. 2010;194:1230–1233. [DOI] [PubMed] [Google Scholar]
- 22. Kaiser P, Attal R, Kammerer M, et al. Significant differences in femoral torsion values depending on the CT measurement technique. Arch Orthop Trauma Surg. 2016;136:1259–1264. [DOI] [PMC free article] [PubMed] [Google Scholar]
- 23. Kaiser P, Schmoelz W, Schoettle P, Zwierzina M, Heinrichs C, Attal R. Increased internal femoral torsion can be regarded as a risk factor for patellar instability: a biomechanical study. Clin Biomech (Bristol, Avon). 2017;47:103–109. [DOI] [PubMed] [Google Scholar]
- 24. Liebensteiner MC, Ressler J, Seitlinger G, Djurdjevic T, El Attal R, Ferlic PW. High femoral anteversion is related to femoral trochlea dysplasia. Arthroscopy. 2016;32:2295–2299. [DOI] [PubMed] [Google Scholar]
- 25. Nelitz M, Dreyhaupt J, Williams SRM, Dornacher D. Combined supracondylar femoral derotation osteotomy and patellofemoral ligament reconstruction for recurrent patellar dislocation and severe femoral anteversion syndrome: surgical technique and clinical outcome. Int Orthop. 2015;39:2355–2362. [DOI] [PubMed] [Google Scholar]
- 26. Nelitz M, Lippacher S, Reichel H, Dornacher D. Evaluation of trochlear dysplasia using MRI: correlation between the classification system of Dejour and objective parameters of trochlear dysplasia. Knee Surg Sports Traumatol Arthrosc. 2014;22:120–127. [DOI] [PubMed] [Google Scholar]
- 27. Nelitz M, Williams RS, Lippacher S, Reichel H, Dornacher D. Analysis of failure and clinical outcome after unsuccessful medial patellofemoral ligament reconstruction in young patients. Int Orthop. 2014;38:2265–2272. [DOI] [PubMed] [Google Scholar]
- 28. Paiva M, Blønd L, Hölmich P, et al. Quality assessment of radiological measurements of trochlear dysplasia: a literature review. Knee Surg Sports Traumatol Arthrosc. 2018;26:746–755. [DOI] [PubMed] [Google Scholar]
- 29. Schoettle PB, Zanetti M, Seifert B, Pfirrmann CW, Fucentese SF, Romero J. The tibial tuberosity-trochlear groove distance: a comparative study between CT and MRI scanning. Knee. 2006;13(1):26–31. [DOI] [PubMed] [Google Scholar]
- 30. Seitlinger G, Scheurecker G, Högler R, Labey L, Innocenti B, Hofmann S. Tibial tubercle-posterior cruciate ligament distance: a new measurement to define the position of the tibial tubercle in patients with patellar dislocation. Am J Sports Med. 2012;40:1119–1125. [DOI] [PubMed] [Google Scholar]
- 31. Staheli LT, Corbett M, Wyss C, King H. Lower-extremity rotational problems in children. J Bone Joint Surg Am. 1985;67:39–47. [PubMed] [Google Scholar]
- 32. Steensen RN, Bentley JC, Trinh TQ, Backes JR, Wiltfong RE. The prevalence and combined prevalences of anatomic factors associated with recurrent patellar dislocation: a magnetic resonance imaging study. Am J Sports Med. 2015;43:921–927. [DOI] [PubMed] [Google Scholar]
- 33. Stevens PM, Gililland JM, Anderson LA, Mickelson JB, Nielson J, Klatt JW. Success of torsional correction surgery after failed surgeries for patellofemoral pain and instability. Strategies Trauma Limb Reconstr. 2014;9(1):5–12. [DOI] [PMC free article] [PubMed] [Google Scholar]
- 34. Stuberg W, Temme J, Kaplan P, Clarke A, Fuchs R. Measurement of tibial torsion and thigh-foot angle using goniometry and computed tomography. Clin Orthop Relat Res. 1991;272:208–212. [PubMed] [Google Scholar]
- 35. Tensho K, Akaoka Y, Shimodaira H, et al. What components comprise the measurement of the tibial tuberosity-trochlear groove distance in a patellar dislocation population? J Bone Joint Surg Am. 2015;97:1441–1448. [DOI] [PMC free article] [PubMed] [Google Scholar]
- 36. Tscholl PM, Wanivenhaus F, Fucentese SF. Conventional radiographs and magnetic resonance imaging for the analysis of trochlear dysplasia: the influence of selected levels on magnetic resonance imaging. Am J Sports Med. 2017;45:1059–1065. [DOI] [PubMed] [Google Scholar]
- 37. Van Haver A, De Roo K, De Beule M, et al. The effect of trochlear dysplasia on patellofemoral biomechanics: a cadaveric study with simulated trochlear deformities. Am J Sports Med. 2015;43:1354–1361. [DOI] [PubMed] [Google Scholar]
- 38. Yao L, Gai N, Boutin RD. Axial scan orientation and the tibial tubercle-trochlear groove distance: error analysis and correction. AJR Am J Roentgenol. 2014;202:1291–1296. [DOI] [PubMed] [Google Scholar]
- 39. Zimmerer A, Sobau C, Balcarek P. Recent developments in evaluation and treatment of lateral patellar instability. J Exp Orthop. 2018;5:3. [DOI] [PMC free article] [PubMed] [Google Scholar]