Short abstract
Background
Digital breast tomosynthesis (DBT) is gaining popularity in breast imaging. There are several different technical approaches for conducting DBT imaging.
Purpose
To determine optimal imaging parameters, test patient friendliness, evaluate the initial diagnostic performance, and describe diagnostic advances possible with the new Continuous Sync-and-Shoot method.
Material and Methods
Thirty-six surgical breast specimens were imaged with digital mammography (DM) and a prototype of a DBT system (Planmed Oy, Helsinki, Finland). We tested the patient friendliness of the sync-and-shoot movement without radiation exposure in eight volunteers. Different imaging parameters were tested with 20 specimens to identify the optimal combination: angular range 30°, 40°, and 60°; pixel binning; Rhodium (Rh) and Silver (Ag) filtrations; and different kV and mAs values. Two breast radiologists evaluated 16 DM and DBT image pairs and rated six different image properties. Imaging modalities were compared with paired t-test.
Results
The Continuous Sync-and-Shoot method produced diagnostically valid images. Five out of eight volunteers felt no/minimal discomfort, three experienced mild discomfort from the tilting movement of the detector, with the motion being barely recognized. The combination of 30°, Ag filtering, and 2 × 2 pixel binning produced the best image quality at an acceptable dose level. DBT was significantly better in all six evaluated properties (P < 0.05). Mean DoseDBT/DoseDM ratio was 1.22 (SD = 0.42).
Conclusion
The evaluated imaging method is feasible for imaging and analysing surgical breast specimens and DBT is significantly better than DM in image evaluation.
Keywords: Breast tomosynthesis, feasibility, diagnostic performance, breast specimen, breast cancer
Introduction
Digital breast tomosynthesis (DBT) was implemented in breast radiology to resolve the issue of overlapping tissue structures (1,2). In digital mammography (DM), only one image is taken for each view, typically the mediolateral oblique (MLO) and cranial-caudal (CC) views. In DBT, several projection images are taken from different angles for each view and then a pseudo three-dimensional (3D) image set is reconstructed from these projection images.
DBT is gaining popularity in breast imaging. An increase in the cancer detection rate has been demonstrated in several large clinical trials when DBT was used either together with, or as a replacement for, DM. There are at least six different DBT units commercially available, but most of the studies have been performed with Selenia Dimensions (Hologic, Bedford, MA, USA): OTST trial (n = 12,621); Storm trial (n = 7292); Rose et al. (n = 9499); Haas et al. (n = 6100); and Friedewald et al. (n = 173663) (3–8). Siemens Mammomat Inspiration (Siemens AG, Erlangen, Germany) was used in the Malmo Breast tomosynthesis screening trial where one-view DBT was compared to DM (n = 7500) (9). Prototype units from other manufacturers have been evaluated in smaller retrospective studies that have compared DBT to DM. A prototype of the General Electric DBT unit (GE Healthcare, Waukesha, WI, USA) was examined by Gennaro et al. (10–12). A prototype of the MicroDose system (Sectra Mamea, Solna, Sweden) (later purchased by Philips) was tested by Wallis et al. (13).
Details of the technical description of DBT have been extensively reviewed by Sechopoulos (14,15). He also reported technical differences in the current commercial systems for generating DBT images. The main technical differences in imaging hardware are X-ray tube target material (molybdenum [Mo], rhodium [Rh], or tungsten [W]), X-ray tube filtration material (silver [Ag], aluminium [Al], Mo, or Rh), X-ray beam quality, grid (used only by GE Healthcare), detector type (amorphous selenium [a-Se], cesium iodine [CsI], or photon counting), pixel size, and pixel binning. The main alternatives in the image acquisition are in the angular range, the number of projection images, X-ray tube motion, detector motion, image reconstruction algorithms, and image post-processing. There are two types of movement patterns of the X-ray tube; one is called “step-and-shoot,” where the tube moves between the projection images and stops during the image exposure. The other one is “continuous” where the tube head moves continuously during the imaging sequence. “Step-and-shoot” is exploited by GE Healthcare and IMS Giotto, Bologna, Italy. Continuous movement has been applied by Hologic, Philips, and Siemens. The types for detector motion are either static or rotating. As the images are a product of these variables, there are differences in image quality and the overall image appearance with these different techniques. This paper introduces a Continuous Sync-and-Shoot method of tube and detector motion.
Due to the major differences in these technical approaches, it is important to validate all novel DBT systems. This study was designed to evaluate the initial image quality of this tomosynthesis prototype unit with surgical breast specimens and to test the patient friendliness of the imaging system. We also wanted to determine whether the Sync-and-Shoot method would be safe and feasible and possess a diagnostic performance equal to or even better than that of DM.
Material and Methods
The institutional ethics review board approved the study. Eight consenting volunteers were mock-up imaged without radiation to test whether patients felt any additional discomfort due to the Sync-and-Shoot movement. Patients scheduled for breast surgery were randomly invited to take part in the study by their operating surgeons. A total of 36 surgical breast specimens were imaged. These participants provided written informed consent.
Imaging systems
DMs were obtained with the Planmed Nuance Excel mammogram system (Planmed Oy, Helsinki, Finland) according to the manufacturer’s recommended optimal manual imaging values with automatic selection of Rh or Ag filtration. The detector was a direct digital device based on a-Se layer that has been developed by Analogic (Analogic, Peabody, MA, USA). The pixel size was 85 μm and the focal spot size was 0.3 mm. The X-ray tube was Varian (Varian Medical Systems, Inc., Palo Alto, CA, USA) M113T tube with the W target. DBTs were obtained with a prototype of the Planmed DBT unit modified from Planmed Nuance Excel DM unit to allow imaging angles up to ± 30°. The system had an identical tube and detector combination and compression system as the DM unit and both 2 × 2 binned and non-binned images were used with Rh and Ag filters. The X-ray target—filter combinations W–Rh, W–Ag—were selected based on an earlier study, which revealed that when using the W-target with α-Se technology, the most optimum filters were Ag (75 μm) and Rh (60 μm) (16).
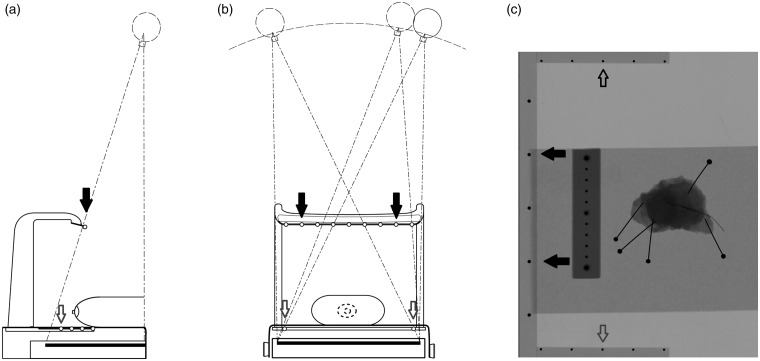
In Continuous Sync-and Shoot imaging, the X-ray tube moves constantly along an arc above the breast being imaged. Fifteen projection images are acquired during the imaging sequence. For each projection image, the detector platform and the tissue being imaged follow the tube motion by tilting in the same direction as the tube, i.e. with a 0.09–0.26 rotation angle depending on mAs values and thus the exposure time. The degree is higher with larger mAs values because the detector platform and the tissue need to follow the tube movement for a longer time. The movement of these three elements (tube, tissue, and detector) is arranged by synchronizing the motion of the detector platform and specimen or compressed breast to the X-ray tube at the time of each projection image acquisition. Between the projection image exposures, the platform returns to its original position so as to be ready for the next projection image acquisition. This synchronized movement of these three elements enables focal spots to be aligned with the detector during projection exposure moments (Fig. 1). No compression is applied during specimen imaging.
Fig. 1.
(Left) During the tomosynthesis imaging sequence, the tube rotates continuously along an arc above the detector. (Middle) At the time of projection, the image exposure movement of the tube, the detector and the object being imaged are synchronized. (Right) Between the projection image exposures, the detector and the object return back to the home position.
DBT image reconstruction
Pseudo 3D image stacks with a 1-mm slice separation were reconstructed with an iterative algorithm. In this DBT unit, the imaging geometry for the reconstruction algorithm is determined in each projection image with fiducial metal markers. The marker consists of metal objects located at two levels above the detector (Fig. 2). These objects are projected to the detector in every projection image from which their locations can be calculated by using a central projection model. In this study, there was no post-processing of the reconstructed images.
Fig. 2.
(a, b) The location of the focal spot is determined by using a fiducial marker. The upper row of markers is mounted on a rack above the platform (black arrows) and the lower row is placed on the sides of the platform (white arrows). (c) Image of a specimen and a reference scale. The black dots on the periphery of the whole image are the metal objects that are projected onto each projection image.
DBT imaging parameters
To find the optimal angular range and sufficient image quality with acceptable dose level, the first 20 specimens were imaged with different imaging parameters. Fifteen projection images were obtained with 30°, 40°, or 60° tomosynthesis angular range. The kV values were in the range of 29–31 kV. The total mAs values were 1–2.5 times the mAs value applied in the DM. The total mAs value was divided evenly to each of the 15 projection images. One radiologist with 20 years of experience in breast radiology and an engineer from the manufacturer evaluated the images together. The determination of the optimal angular range and the combination of kV and mAs were conducted in one consensus reading session.
Patient friendliness
In the evaluation of patient’s opinion of the platform’s tilt movement, a breast imaging simulation without radiation exposure was performed in eight volunteers. Volunteers were requested to report any additional discomfort to the tilt movement while the breast had routine compression. We used a questionnaire with a five-step Likert grading of discomfort: 1 = none; 2 = mild; 3 = intermediate; 4 = substantial; and 5 = extreme discomfort. Any other comments were also documented.
DM versus DBT image quality comparison
In order to validate the image quality of the selected DBT imaging parameters and to compare the DBT performance to DM, we performed a retrospective comparative image analysis with DBT images of breast specimens being compared to the corresponding DM images. Sixteen surgical specimens were imaged with DM and DBT. Fifteen specimens originated from breast cancer surgery and one from a diagnostic surgical biopsy. There were 10 ductal adenocarcinomas, two lobular carcinomas, one ductal adenocarcinoma + ductal carcinoma in situ, one mucinous adenocarcinoma, one apocrine carcinoma, and one fat necrosis. The mean tumor size for invasive cancer was 22.2 mm (standard deviation [SD] = 13.2 mm)
The images were viewed in a Vue PACS review workstation (Carestream Inc., Rochester, NY, USA) with tomosynthesis dedicated monitors Barco MDMG-5221 (Barco Inc., Kortrijk, Belgium). The readers were blinded to the pathology report. A numerical rating of 1–10 was given for six image quality features if applicable: 1 = overall image quality including the sharpness of the image and contrast between adipose and fibroglandular tissue; 2 = visibility and characterization of microcalcifications, including benign calcifications; 3 = visibility and characterization of mass lesions; 4 = visibility and characterization of the margins of mass lesions; 5 = usefulness for evaluation of the resection margin; 6 = confidence in decision-making on whether the lesion would be benign or malignant (17). Two radiologists with four and 20 years of experience in breast radiology reviewed first all the DM images and then all the DBT images. In a subsequent consensus reading session, both radiologists examined the images together, then decided whether the feature was gradable and agreed upon the final rating for each feature. At this session, the radiologists also made the decision of whether the DBT was feasible for imaging breast specimens. We compared the ratings between the DM and DBT with paired t-test for each feature separately. A comparison was made for both independent sessions and for the consensus session. Statistical analysis was done with SPSS Statistics v. 22.0 (IBM, Armonk, NY, USA). A P value < 0.05 was considered statistically significant.
In the comparison of the image sets, we also estimated the mean glandular dose (MGD) for each modality by applying the Dance model (18).
Results
The optimal imaging parameters
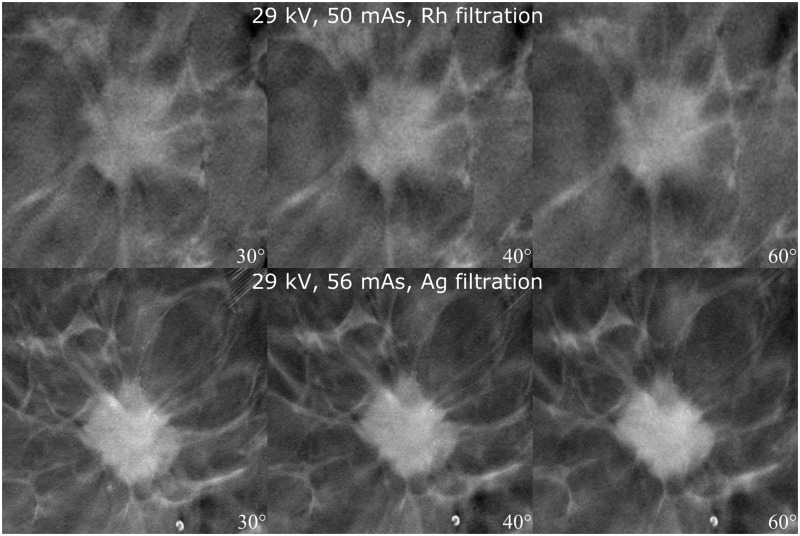
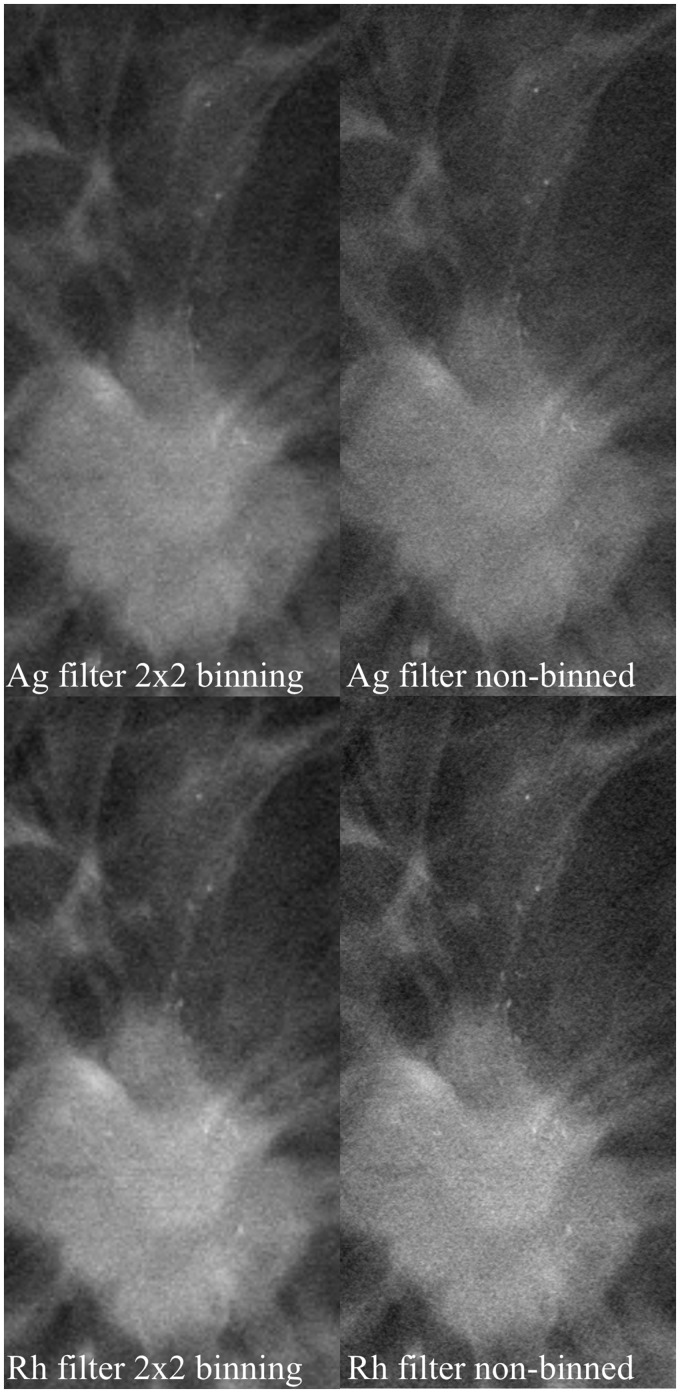
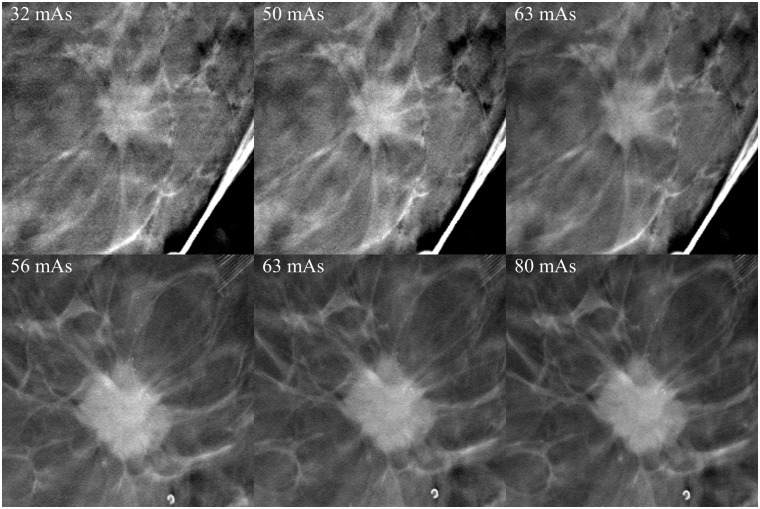
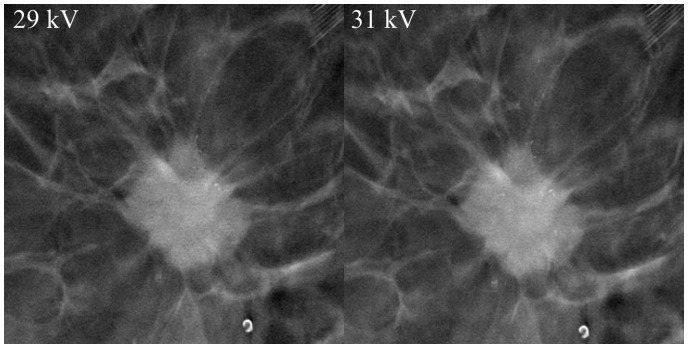
It was evident that the angular range of 30° provided the best spatial resolution and although 40° exhibited the best contrast between fibroglandular and adipose breast tissue, the spatial resolution of the images was not as good. An angular range of 60° resulted in better spatial resolution in the z-dimension, but the tumor details became blurred (Fig. 3). Rh filtering was better at revealing microcalcifications, but Ag filtering provided the best overall image quality. Furthermore, 2 × 2 pixel binning provided better image quality with less noise, although microcalcifications were better visualized with 1 × 1 pixel binning (Fig. 4). A higher tube current (mAs) resulted in a moderately improved image quality, which was mainly apparent via the noise reduction in the image and the better spatial resolution of tumor details (Fig. 5). An increase in kV resulted in a moderately better visualization of microcalcifications (Fig. 6).
Fig. 3.
Effect of different angular range. Imaging parameters and angles are defined in the image. Spicules become blurred and the visibility of microcalcifications decreases when the angular range is increased.
Fig. 4.
Effect of binning and filtration. Microcalcifications associated with the tumor. Filtering and binning are defined in the image. Microcalcifications and image details become blurred when binning is used.
Fig. 5.
Effect of increasing the tube current. Tube currents are defined in the images. Other imaging parameters were 29 kV, Ag filtration, 30°. There is hardly any appreciable increase in the visibility of tumor details. Images on the left with the lowest dose were considered to be diagnostically adequate.
Fig. 6.
Effect increasing kV. Tube voltage is indicated in the image. Other parameters were 63 mAs, Ag filtration, 30°. Microcalcifications visibility and sharpness increased moderately with higher kV.
Patient friendliness
The participants experienced no or only mild additional discomfort associated with tilt movement of the detector. Five volunteers reported no discomfort at all (62.5%) and three reported mild discomfort (37.5%). In documented comments, five stated that they were unaware of the motion and two reported that it was faintly appreciable during MLO imaging. In DM, the mean compression force was 9.75 dekanewton (daN) and in DBT 10.05 daN.
DM versus DBT image quality comparison
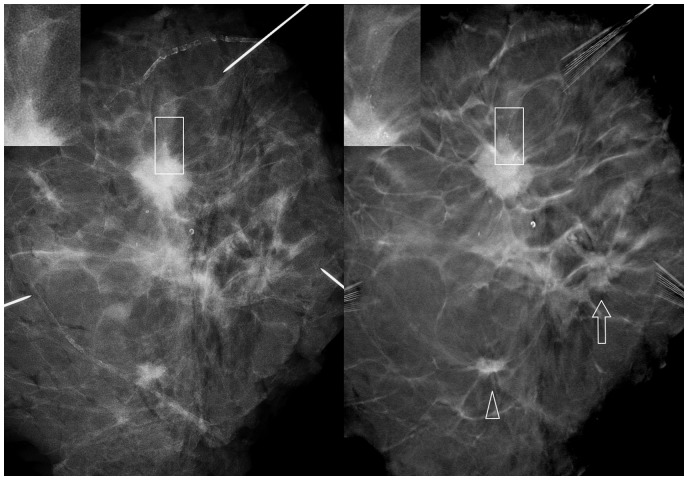
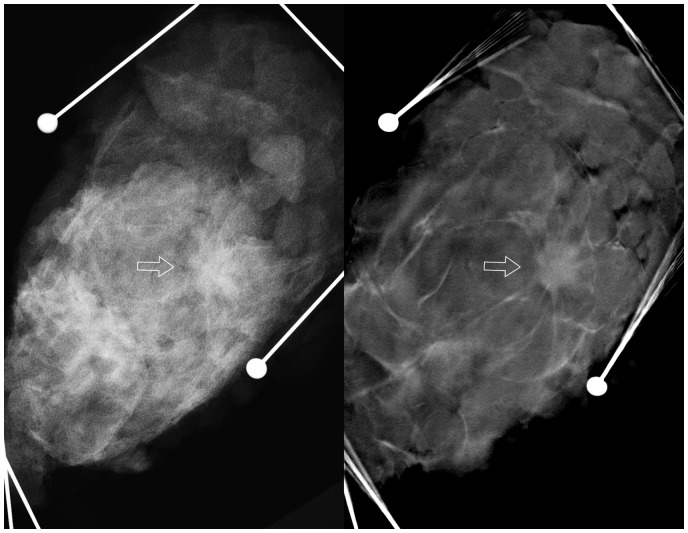
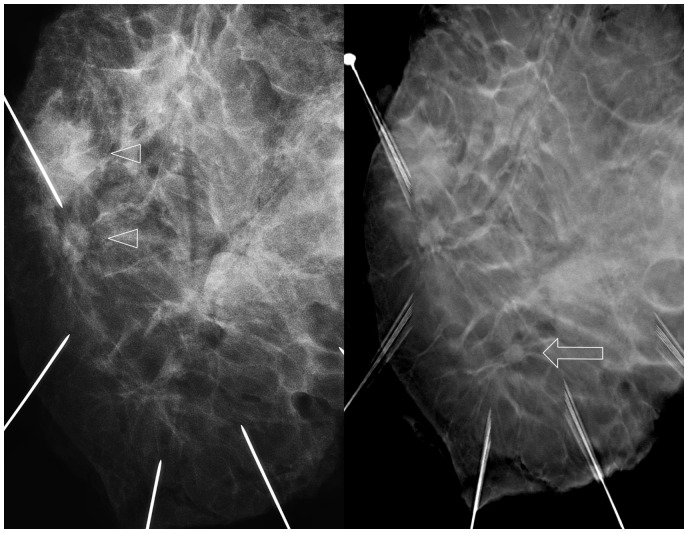
DBT was rated better in all six categories by both radiologists independently and in a consensus session (Table 1). Since the paired t-test takes into account only evaluations given by both readers, there were some minor differences in n values. Differences between DM versus DBT were more pronounced with reader A, especially in mass lesion characterization and margin evaluation (DM 5.5 [SD = 2.12] vs. DBT 8.5 [SD = 0.85], P = 0.003 and DM 4.9 [SD = 2.33] vs. DBT 8.3 [SD = 1.25], P = 0.008, respectively). Reader B did not detect such pronounced differences between the techniques, with the greatest differences observed in the evaluation of the mass lesion margin and the confidence in decision making (DM 5.21 [SD = 1.5] vs. DBT 6.93 [SD = 0.92] P = 0.001 and DM 5.63 [SD = 1.63] vs. DBT 6.94 [SD = 1.18], P = 0.001, respectively). Examples of the differences in image properties are presented along with the sample images (Figs. 7–9). The radiologist confirmed that DBT was feasible for imaging breast specimens in all cases.
Table 1.
Results for individual readers and consensus session; Readers A and B have four and 20 years of experience in breast imaging, respectively.
|
Reader |
Reader A |
Reader B |
Consensus reading |
|||||||||
|---|---|---|---|---|---|---|---|---|---|---|---|---|
| Feature | n | DM (mean (SD)) | DBT (mean (SD)) | P | n | DM (mean (SD)) | DBT (mean (SD)) | P | n | DM (mean (SD)) | DBT (mean (SD)) | P |
| 1. Image quality | 16 | 4.56 (1.41) | 7.19 (1.22) | <0.001 | 16 | 6.13 (1.26) | 7.31 (1.08) | 0.004 | 16 | 5.50 (1.4) | 7.44 (0.96) | <0.001 |
| 2. Microcalcifications | 11 | 4.27 (1.27) | 6 (1.79) | 0.001 | 12 | 6.25 (0.97) | 7 (1.35) | 0.043 | 12 | 5.33 (0.99) | 6.58 (1.44) | 0.001 |
| 3. Mass lesions | 10 | 5.5 (2.12) | 8.5 (0.85) | 0.003 | 16 | 5.69 (2.09) | 6.88 (1.5) | 0.006 | 12 | 5.92 (1.88) | 7.92 (0.90) | 0.001 |
| 4. Mass lesions margins | 10 | 4.9 (2.33) | 8.3 (1.25) | 0.008 | 14 | 5.21 (1.76) | 6.93 (0.92) | 0.001 | 12 | 5.08 (1.88) | 7.75 (0.62) | <0.001 |
| 5. Resection marginal evaluation | 13 | 5.15 (2.30) | 8.23 (1.01) | 0.001 | 14 | 5.36 (1.50) | 6.36 (1.01) | 0.01 | 13 | 5.31 (1.75) | 7.23 (0.83) | 0.001 |
| 6. Confidence | 16 | 4.81 (2.00) | 7.69 (1.89) | <0.001 | 16 | 5.63 (1.63) | 6.94 (1.18) | 0.001 | 16 | 5.19 (1.72) | 7.5 (1.317) | <0.001 |
Fig. 7.
Mastectomy specimen. Left DM image and right DBT. Lesion visibility and characterization were improved with DBT. Small microcalcifications associated with the largest lesion were not visible with DM (rectangles). A small lesion was more conspicuous in DBT (arrowhead). A third lesion was not clearly recognized with DM but was detected with DBT (arrow).
Fig. 8.
Lumpectomy specimen. A solitary lesion (arrow) was hardly visible with DM (left) but was evident with DBT (right).
Fig. 9.
Mastectomy specimen. Two lesions were found with DM (arrowheads). A third lesion was detected with DBT (arrow).
Radiation dose
MGD (n = 16) for DM was in the range of 0.43–1.34 mGy (mean = 0.91 mGy, SD = 0.25) and for DBT 0.77–1.54 mGy (mean = 1.05 mGy, SD = 0.22). DoseDBT/DoseDM ratio was 0.77–2.5 (mean = 1.22, SD = 0.42) (Table 2). In one case, the ratio was 2.5 because DBT was acquired with double mAs values compared to the DM images.
Table 2.
Specimen thicknesses and imaging parameters for quality compared images.
|
DM |
DBT |
Dose DBT/DM | ||||||||
|---|---|---|---|---|---|---|---|---|---|---|
| Thickness | kV | mAs | Filter | MGD | ki | kV | mAs | MGD | ki | |
| 15 | 28 | 32 | Rh | 0.70 | 0.85 | 29 | 45 | 1.03 | 1.74 | 1.48 |
| 20 | 29 | 40 | Rh | 0.88 | 1.23 | 29 | 45 | 0.96 | 1.77 | 1.08 |
| 23 | 28 | 40 | Ag | 0.73 | 1.42 | 29 | 40 | 0.81 | 1.56 | 1.12 |
| 25 | 29 | 56 | Rh | 1.14 | 1.76 | 31 | 63 | 1.54 | 3.03 | 1.35 |
| 26 | 29 | 40 | Rh | 0.80 | 1.26 | 29 | 40 | 0.78 | 1.6 | 0.97 |
| 27 | 31 | 56 | Ag | 1.34 | 2.66 | 31 | 60 | 1.42 | 2.9 | 1.06 |
| 30 | 29 | 56 | Rh | 1.04 | 1.79 | 29 | 50 | 0.91 | 2.03 | 0.88 |
| 32 | 29 | 54 | Ag | 0.96 | 2.27 | 29 | 56 | 0.98 | 2.24 | 1.02 |
| 35 | 29 | 63 | Rh | 1.08 | 2.04 | 31 | 60 | 1.27 | 2.99 | 1.17 |
| 39 | 29 | 63 | Rh | 1.03 | 2.07 | 29 | 63 | 1.04 | 3.18 | 1.01 |
| 41 | 31 | 63 | Rh | 1.20 | 2.44 | 29 | 63 | 1.02 | 2.66 | 0.85 |
| 42 | 29 | 32 | Rh | 0.50 | 1.06 | 31 | 63 | 1.26 | 3.26 | 2.50 |
| 46 | 27 | 35 | Rh | 0.43 | 0.94 | 29 | 50 | 0.77 | 2.14 | 1.81 |
| 56 | 29 | 63 | Rh | 0.88 | 2.20 | 29 | 63 | 0.89 | 2.8 | 1.01 |
| 66 | 31 | 63 | Ag | 1.07 | 3.35 | 31 | 63 | 1.05 | 3.41 | 0.98 |
| 71 | 29 | 63 | Ag | 0.83 | 2.90 | 31 | 63 | 1.02 | 3.55 | 1.23 |
| Mean | 0.91 | Mean | 1.05 | Mean | 1.22 | |||||
| STD | 0.25 | STD | 0.22 | STD | 0.42 | |||||
In all studies, the target was tungsten and in DBT only Ag filtration was used. MGD and incident air kerma (ki) were estimated by applying the Dance model.
Discussion
This is the first report detailing the technical feasibility of using the Continuous Sync-and-Shoot method for tomosynthesis. There are two unique technical features in this prototype DBT system that potentially improve the image quality: (i) the sync-and-shoot motion; and (ii) improvements in imaging geometry by adoption of a fiducial marker. In the Continuous Sync-and Shoot imaging method, the X-ray tube, breast or specimen, and detector remain aligned and thus are stationary to each other at the time of each projection image exposure. This means that one has a stationary focal spot and potentially creates less blurring in comparison to those systems where the focal spot is moving (19). There is the potential of internal tissue movement due to the externally applied tilt maneuver, but its effect on image quality was not tested as the system works only in the Sync-and-Shoot mode. The continuous tube head movement produces potentially less tube head vibration than the step-and-shoot method where the head stops for each projection image exposure. Acquisition geometry was determined by imaging the fiducial markers on each projection image. In this way, the information of the acquisition geometry is embedded within the image itself and minimizes potential inaccuracies in angle measurements by mechanical sensors on the image reconstruction. All of the equipment vendors have devised somewhat different technical solutions for DBT image acquisition and image reconstruction. Due to the variabilities in technical approaches, it is rather probable that there will be differences in image properties. Hence, it is important to validate hardware, especially when evaluating new emerging products. A phantom comparison study with different manufacturers’ equipment could clarify some of these potential differences.
Together with image quality, patient comfort and usability are important factors when evaluating novel imaging equipment. There was some concern that the tilting of the detector would cause patient discomfort, but the volunteers did not report any kind of unpleasant experience to the tilt movement and therefore also in this respect, the results were encouraging.
DBT imaging consists of multiple parameters that have an effect on the image quality and dose. If one applies a larger angular range, then there is better z-resolution but to maintain image sharpness, more projection images are needed and that usually translates into both longer examination times and higher patient dose. In reality, the number of projection images is a compromise between the dose, diagnostic image quality, acquisition time, and reconstruction accuracy. Here, we were able to determine functional imaging parameters (Angular range, kV, and mAs) with this prototype system at an acceptable dose level.
It is not well known how pixel binning influences the visibility of microcalcifications. For example, 2 × 2 binning means that information from four adjacent detector pixels is averaged together. This achieves a faster detector reading time, smaller file size, and faster image reconstruction, but at the cost of losing some of the image information. In at least two of our cases, there was a notable difference in microcalcification visibility when comparing 2 × 2 pixel binned and non-binned images, i.e. the appearance of small calcifications tended to fade after binning; this is understandable as the attenuation of small foci is averaged by binning. There are a few reports that have compared the detection and characterization of microcalcifications in DBT and DM, but the results are somewhat conflicting (20–22). The reason for the differences in the results of previous studies might be explained by the different equipment, especially by the different binning and image reconstruction techniques.
The weaknesses of the study are its small sample size, only two readers, and that the true clinical breast imaging performance was not tested. However, it is possible to conclude that this prototype is feasible for imaging breast specimens. DBT was significantly better in all six quantified categories. Our observation of better performance in the visibility and characterization of mass lesions is concordant with other publications (11,23,24).
In conclusion, the Continuous Sync-and-Shoot DBT method produced a sufficiently good image quality to permit an evaluation of breast specimens. Tilt movements of the detector caused, at worst, only minor discomfort. The best overall image quality was obtained with 30° of angular range and 15 projection images combined with a W-Ag target filter. The application of 2 × 2 binning caused a fading effect for some of the small microcalcifications. Image quality, tumor, and micro-calcification characterization were all significantly better with DBT than DM. These results are encouraging and warrant further evaluation of this novel DBT system in imaging actual clinical breast specimens.
Acknowledgments
The authors thank Marianne Haapea for statistical analyses.
Declaration of conflicting interests
The authors declare the following potential conflicts of interest with respect to the research, authorship, and/or publication of this article: MV and JE are employees of the Planmeca Oy and Planmed Oy; MJ is medical advisor for Planmed Oy. The other authors report no conflicts of interest.
Funding
This research received no specific grant from any funding agency in the public, commercial, or not-for-profit sectors
References
- 1.Niklason LT, Christian BT, Niklason LE, et al. Digital tomosynthesis in breast imaging. Radiology 1997; 205:399–406. [DOI] [PubMed] [Google Scholar]
- 2.Grant DG. Tomosynthesis: a three-dimensional radiographic imaging technique. IEEE Trans Med Imaging 1972; 19:20–28. [DOI] [PubMed] [Google Scholar]
- 3.Skaane P, Bandos AI, Gullien R, et al. Prospective trial comparing full-field digital mammography (FFDM) versus combined FFDM and tomosynthesis in a population-based screening programme using independent double reading with arbitration. Eur Radiol 2013; 23:2061–2071. [DOI] [PMC free article] [PubMed] [Google Scholar]
- 4.Skaane P, Bandos AI, Gullien R, et al. Comparison of digital mammography alone and digital mammography plus tomosynthesis in a population-based screening program. Radiology 2013; 267:47–56. [DOI] [PubMed] [Google Scholar]
- 5.Ciatto S, Houssami N, Bernardi D, et al. Integration of 3D digital mammography with tomosynthesis for population breast-cancer screening (STORM): A prospective comparison study. Lancet Oncol 2013; 14:583–589. [DOI] [PubMed] [Google Scholar]
- 6.Rose SL, Tidwell AL, Bujnoch LJ, et al. Implementation of breast tomosynthesis in a routine screening practice: An observational study. Am J Roentgenol 2013; 200:1401–1408. [DOI] [PubMed] [Google Scholar]
- 7.Haas BM, Kalra V, Geisel J, et al. Comparison of tomosynthesis plus digital mammography and digital mammography alone for breast cancer screening. Radiology 2013; 269:694–700. [DOI] [PubMed] [Google Scholar]
- 8.Friedewald SM, Rafferty EA, Rose SL, et al. Breast cancer screening using tomosynthesis in combination with digital mammography. JAMA 2014; 311:2499. [DOI] [PubMed] [Google Scholar]
- 9.Lång K, Andersson I, Rosso A, et al. Performance of one-view breast tomosynthesis as a stand-alone breast cancer screening modality: results from the Malmö Breast Tomosynthesis Screening Trial, a population-based study. Eur Radiol 2016; 26:184–190. [DOI] [PMC free article] [PubMed] [Google Scholar]
- 10.Gennaro G, Toledano A, Di Maggio C, et al. Digital breast tomosynthesis versus digital mammography: A clinical performance study. Eur Radiol 2010; 20:1545–1553. [DOI] [PubMed] [Google Scholar]
- 11.Gennaro G, Hendrick RE, Toledano A, et al. Combination of one-view digital breast tomosynthesis with one-view digital mammography versus standard two-view digital mammography: Per lesion analysis. Eur Radiol 2013; 23:2087–2094. [DOI] [PubMed] [Google Scholar]
- 12.Gennaro G, Hendrick RE, Ruppel P, et al. Performance comparison of single-view digital breast tomosynthesis plus single-view digital mammography with two-view digital mammography. Eur Radiol 2013; 23:664–672. [DOI] [PubMed] [Google Scholar]
- 13.Wallis MG, Moa E, Zanca F, et al. Two-View and Single-View Tomosynthesis versus full-field digital mammography: high-resolution X-ray imaging observer study. Radiology 2012; 262:788–796. [DOI] [PubMed] [Google Scholar]
- 14.Sechopoulos I. A review of breast tomosynthesis. Part I. The image acquisition process. Med Phys 2013; 40:14301. [DOI] [PMC free article] [PubMed] [Google Scholar]
- 15.Sechopoulos I. A review of breast tomosynthesis. Part II. Image reconstruction, processing and analysis, and advanced applications. Med Phys 2013; 40:14302. [DOI] [PMC free article] [PubMed] [Google Scholar]
- 16.Varjonen M, Strömmer P. Optimizing the target-filter combination in digital mammography in the sense of image quality and average glandular dose. Lect Notes Comput Sci (including Subser Lect Notes Artif Intell Lect Notes Bioinformatics) 2008;5116 LNCS:570–576. [Google Scholar]
- 17.Li Y, Poulos A, McLean D, et al. A review of methods of clinical image quality evaluation in mammography. Eur J Radiol 2010; 74:e122–e131. [DOI] [PubMed] [Google Scholar]
- 18.Dance DR, Skinner CL, Young KC, et al. Additional factors for the estimation of mean glandular breast dose using the UK mammography dosimetry protocol. Phys Med Biol 2000; 45:3225–3240. [DOI] [PubMed] [Google Scholar]
- 19.Zhou J, Zhao B, Zhao W. A computer simulation platform for the optimization of a breast tomosynthesis system. Med Phys 2007; 34:1098–1109. [DOI] [PubMed] [Google Scholar]
- 20.Spangler ML, Zuley ML, Sumkin JH, et al. Detection and classification of calcifications on digital breast tomosynthesis and 2D digital mammography: A comparison. Am J Roentgenol 2011; 196:320–324. [DOI] [PubMed] [Google Scholar]
- 21.Tagliafico A, Mariscotti G, Durando M, et al. Characterisation of microcalcification clusters on 2D digital mammography (FFDM) and digital breast tomosynthesis (DBT): does DBT underestimate microcalcification clusters? Results of a multicentre study. Eur Radiol 2014; 25:9–14. [DOI] [PubMed] [Google Scholar]
- 22.Kopans D, Gavenonis S, Halpern E, et al. Calcifications in the breast and digital breast tomosynthesis. Breast J 2011; 17:638–644. [DOI] [PubMed] [Google Scholar]
- 23.Förnvik D, Zackrisson S, Ljungberg O, et al. Breast tomosynthesis: Accuracy of tumor measurement compared with digital mammography and ultrasonography. Acta Radiol 2010; 51:240–247. [DOI] [PubMed] [Google Scholar]
- 24.Andersson I, Ikeda DM, Zackrisson S, et al. Breast tomosynthesis and digital mammography: A comparison of breast cancer visibility and BIRADS classification in a population of cancers with subtle mammographic findings. Eur Radiol 2008; 18:2817–2825. [DOI] [PubMed] [Google Scholar]


