Abstract
Purpose
The International Neuroblastoma Risk Group (INRG) Staging System (INRGSS) was developed through international consensus to provide a presurgical staging system that uses clinical and imaging data at diagnosis. A revised Children's Oncology Group (COG) neuroblastoma (NB) risk classification system is needed to incorporate the INRGSS and within the context of modern therapy. Herein, we provide statistical support for the clinical validity of a revised COG risk classification system.
Patients and Methods
Nine factors were tested for potential statistical and clinical significance in 4,569 patients diagnosed with NB who were enrolled in the COG biology/banking study ANBL00B1 (2006-2016). Recursive partitioning was performed to create a survival-tree regression (STR) analysis of event-free survival (EFS), generating a split by selecting the strongest prognostic factor among those that were statistically significant. The least absolute shrinkage and selection operator (LASSO) was applied to obtain the most parsimonious model for EFS. COG patients were risk classified using STR, LASSO, and per the 2009 INRG classification (generated using an STR analysis of INRG data). Results were descriptively compared among the three classification approaches.
Results
The 3-year EFS and overall survival (± SE) were 72.9% ± 0.9% and 84.5% ± 0.7%, respectively (N = 4,569). In each approach, the most statistically and clinically significant factors were diagnostic category (eg, NB, ganglioneuroblastoma), INRGSS, MYCN status, International Neuroblastoma Pathology Classification, ploidy, and 1p/11q status. The results of the STR analysis were more concordant with those of the INRG classification system than with LASSO, although both methods showed moderate agreement with the INRG system.
Conclusion
These analyses provide a framework to develop a new COG risk classification incorporating the INRGSS. There is statistical evidence to support the clinical validity of each of the three classifications: STR, LASSO, and INRG.
INTRODUCTION
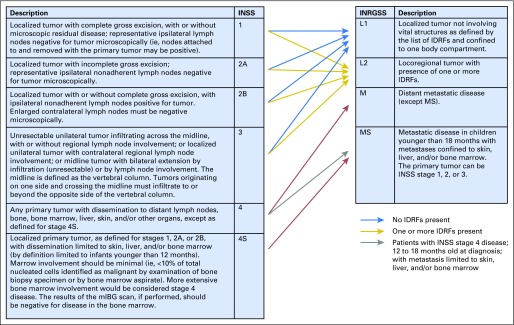
Neuroblastoma is a cancer of the sympathetic nervous system; it most commonly occurs in the adrenal glands and nerve tissue extending from the neck to the pelvis. It is the most common extracranial solid tumor in childhood, with > 650 cases diagnosed yearly in North America.1,2 Risk stratification, incorporating clinical and biologic factors, has been used for over two decades to predict prognosis and assign patients to appropriate therapeutic intensity. The International Neuroblastoma Risk Group Staging System (INRGSS)3 was developed to define extent of disease at diagnosis, before treatment, including surgical resection. In contrast, the International Neuroblastoma Staging System (INSS)4,5 is a postsurgical classification of extent of disease. INSS stages 1 and 2 refer to complete or partially resected locoregional tumors, stage 3 denotes large locoregional tumors crossing the midline, and stage 4 denotes tumors with distant metastases (Fig 1). Stage 4S describes tumors in patients < 12 months of age with stage 1 primary tumors and metastatic disease limited to skin, liver, and < 10% of bone marrow without cortical bone involvement. In the INRGSS, L1 and L2 are locoregional tumors in the absence or presence of image-defined risk factors (IDRF),6 respectively. Widely disseminated disease is classified as stage M. Stage MS describes L1 or L2 tumors associated with metastatic disease limited to skin, liver, and < 10% of bone marrow without cortical bone involvement in patients < 18 months old.
Fig 1.
Relationship between the INSS and the INRGSS. IDRF, image-defined risk factor; INRGSS, International Neuroblastoma Risk Group Staging System; INSS, International Neuroblastoma Staging System; mIBG, metaiodobenzylguanidine.
The goal of the INRG task force was to harmonize risk classifications across international groups. To create the INRG risk groups, 23 prognostic factors were tested in an EFS survival-tree regression (STR) analysis (N = 8,800 patients diagnosed worldwide, 1990 through 2002), resulting in a classification using INSS, age, diagnostic category, grade of differentiation, MYCN status, 11q aberration, and ploidy.7 Treatments have evolved significantly since the period 1990 through 2002, resulting in improved survival, especially for patients with high-risk neuroblastoma (NB).8,9 Since 2006, the Children's Oncology Group (COG) has collected INRGSS data to study its prognostic strength and impact on risk classification.
The goal of this paper is to provide the statistical modeling framework to support a revised COG risk classification system within the context of modern therapy and with INSS replaced by INRGSS. We have chosen to explore and descriptively compare two different statistical approaches: STR and least absolute shrinkage and selection operator (LASSO). We are not attempting to quantify the superiority of any one approach; rather, we provide statistical evidence of the clinical validity of each approach.
STR, or recursive partitioning, provides a graphical way of representing the prognostic structure of data by successively splitting the covariate space into relatively homogeneous groups of observations, or nodes, and maximizes between-node separation in terms of the outcome measure. The classification and regression tree algorithm originally described by Breiman et al10 was extended to accommodate censored survival data, including methods on the basis of the two-sample log-rank test11,12 and the Cox proportional hazards (PH) model.13,14 Tree-structured methods have the advantage of being simply explained and understood, identifying groups of patients with distinct survival outcomes, and allowing easy classification of new patients.
The second method, LASSO, is a linear regression method for both variable selection and improving prediction accuracy. Introduced by Tibshirani,15 and later extended to the Cox PH model,16 the LASSO achieves covariate selection and regularization by minimizing the sum of squared errors subject to a constraint (via a tuning parameter) on the sum of the absolute values of the coefficients. This removes the weakest covariates, leaving the most parsimonious model. LASSO identifies the most important variables associated with outcome that minimize the prediction error.
Herein, we report survival data for COG subsets of patients with NB diagnosed between 2006 and 2016 using the INRGSS. Our STR analysis identified patient subgroups with poor outcome in otherwise well-performing cohorts and subgroups with more favorable outcomes among patients with poor survival. The fitted LASSO model predicted patient survival outcomes based on the most prognostic patient characteristics. These methods provide the basis for developing a revised COG classification system, within the context of modern therapy, incorporating the INRGSS.
PATIENTS AND METHODS
Patients newly diagnosed with NB, ganglioneuroblastoma (GNB), or ganglioneuroma (GN; Schwannian stroma-dominant), maturing subtype (GN were not eligible) with tumor sample submission and without prior chemotherapy were eligible for ANBL00B1, the COG neuroblastoma biology and banking study. Eligibility criteria were enrollment in ANBL00B1 (between August 18, 2006, and June 30, 2016), with known diagnostic category, IDRF status,6 and INSS. Institutional review board approval was obtained at participating sites. Written informed consent was obtained before enrollment in ANBL00B1.
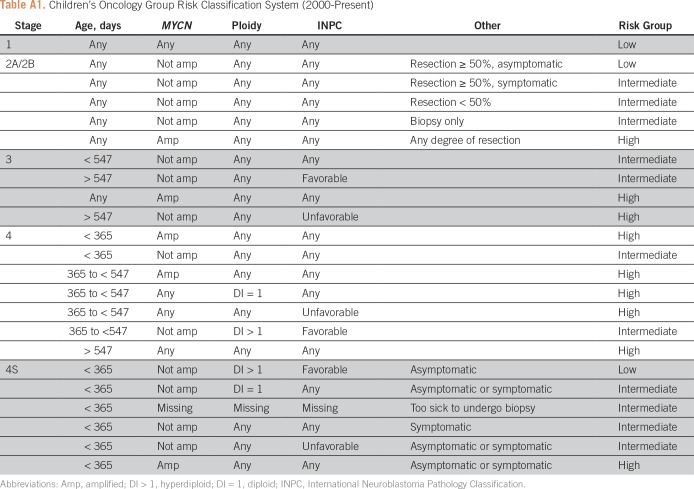
The risk factors tested in this analysis have repeatedly proven to be prognostic, and most are used in the current COG risk stratification (Appendix Table A1). The starting variables for the STR and LASSO models were age at diagnosis (< 18 months v ≥ 18 months),17-19 INRGSS (L1 v L2 v M v MS v M/MS Indeterminate [Ind]), MYCN status (nonamplified v amplified),20 ploidy (hyperdiploid v diploid),21 diagnostic category (ganglioneuroblastoma, intermixed [GNBI] v NB and GNB/nodular),22 grade of differentiation (differentiating v totally undifferentiated/poorly differentiated), mitosis-karyorrhexis index (MKI; low/intermediate v high), International Neuroblastoma Pathology Classification (INPC; favorable v unfavorable),23,24 and 1p and/or 11q segmental chromosome deletion (no loss v loss of either).25 All biomarker assays were performed at diagnosis by the COG reference laboratory and pathology was centrally reviewed.
INSS and IDRF status were used to determine INRGSS (Fig 1). The presence or absence of distant metastases was determined on the basis of INSS. INSS used a 12-month age cut point for 4S, but INRGSS adopted an 18-month cut point for MS. In our cohort, metastatic-site information for patients 12 to 18 months old with INSS stage 4 disease at diagnosis was not collected; such patients have been denoted INRGSS M/MS Ind because the MS versus M distinction was indeterminant.
The 1p/11q variable was defined as follows: loss of heterozygosity in either 1p or 11q was “loss of either”; no loss of heterozygosity in both 1p and 11q was “no loss.” The diagnostic category GNBI comprised GNBI (Schwannian stroma-rich) and GN, maturing subtype tumors; the NB and GNB/nodular group included NB (Schwannian stroma-poor); peripheral neuroblastic tumors; and GNB, nodular (composite).
The primary end point was time to event, calculated from diagnosis until first occurrence of relapse, progression, secondary malignancy, or death, whichever occurred first; patients without an event were censored on the date of last contact. Time to death was a secondary end point; patients alive were censored on the date of last contact. Values quoted for EFS and OS are at 3 years ± SE,26,27 and curves were compared using a log-rank test. Analyses, including the manual STR procedure (PROC PHREG), were performed using SAS, version 9.4 (SAS Institute, Cary, NC). Survival curve generation and LASSO modeling were performed in R (R Project for Statistical Computing, https://www.r-project.org/).
STR Analysis
Recursive partitioning was performed to create a “survival tree.” Starting with the overall patient cohort, univariate Cox PH models of EFS identified statistically significant (P ≤ .05) factors, and the one with the largest hazard ratio (HR) was selected manually to create two subgroups. If the factor had more than two levels (eg, INRGSS), all levels were first compared individually and grouped together if not significantly different from each other, until only significantly different groupings remained. Within each subgroup, the remaining factors were tested and the partitioning process repeated manually until the sample size was too small or no statistically significant factors remained.7 The PH assumption was tested in the terminal splits by testing a covariate by survival-time interaction term in the Cox model.28 The HR is the increased risk of an event compared with the reference level. (Hereafter, in the article text, * denotes the reference category for the HR.)
The data were randomly split into two evenly sized groups, stratified by INRGSS stage, and the STR was performed in each dataset as internal validation. If the STR methodology yielded similar results in each dataset, the two datasets were to be recombined for the definitive analysis.
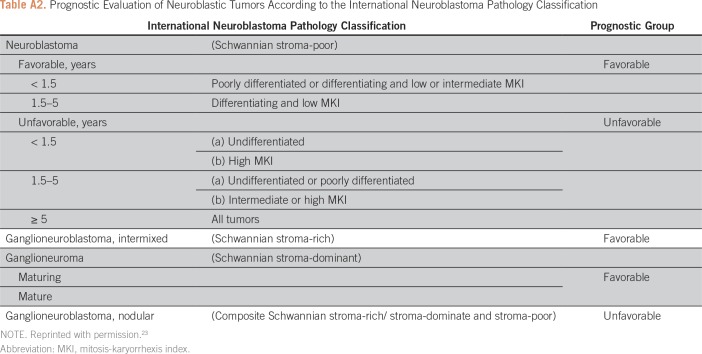
Age together with diagnostic category, grade, and MKI are used to define INPC as favorable or unfavorable; as a result, these factors are statistically confounded with INPC (Appendix Table A2). Therefore, if INPC was identified as the most strongly prognostic factor, age, diagnostic category, grade, or MKI were not tested thereafter. In addition to the objective statistical criteria used to create splits, subgroups historically treated with different levels of treatment intensity, yet currently had similar outcome, were maintained as separate subgroups using a “clinical split” of the factor historically used to direct the varying levels of treatment intensity (eg, MYCN, described later in this article). The clinical split will override the factor chosen by the STR (based on largest statistically significant HR) to create a split.
LASSO
LASSO requires complete data for each factor included in the model; therefore, to permit inclusion of patients with unknown factors, a series of binary dummy variables, one for each factor, was created for the missing category (yes = 1; no = 0). For each factor, the initial LASSO model included the dummy variable for missing data and a term for the known nonreference level of the factor, leaving the other category as reference. This approach prevented potential selection bias that could occur if only patients with complete data were included in the model.18,29,30
Factors with more than two categories required more than one binary variable in the LASSO model. To ensure that all covariates encoding a given factor were either included or excluded from the model as a group, the “group” LASSO was applied.31 The group LASSO was fit using the cv.grpsurv function in the R package grpreg (https://CRAN.R-project.org/package=grpreg32). Cross-validation (10-fold) was used to select the tuning parameter value that minimized the mean cross-validated error while providing some factor reduction. The tuning parameter controls the strength of the penalty; as it increases, more coefficients are shrunk to zero and fewer variables are maintained in the final model. When the tuning parameter is zero, we have ordinary least squares regression. The relative risk (RR), or increased risk of event in comparison with the reference category, was reported for the selected factors in the final model for EFS. For comparability with STR and INRG, interactions were not tested in the LASSO model.
In addition, within each prognostic variable, an assessment to determine whether EFS was missing completely at random was performed. Kaplan-Meier EFS curves26 were generated for the reference, known nonreference, and missing groups. If survival was missing completely at random, then the missing group is expected to be a mixture of patients with and without the attribute and the Kaplan-Meier curve for the missing group should fall between the reference and known nonreference groups.30
Methodology Comparison
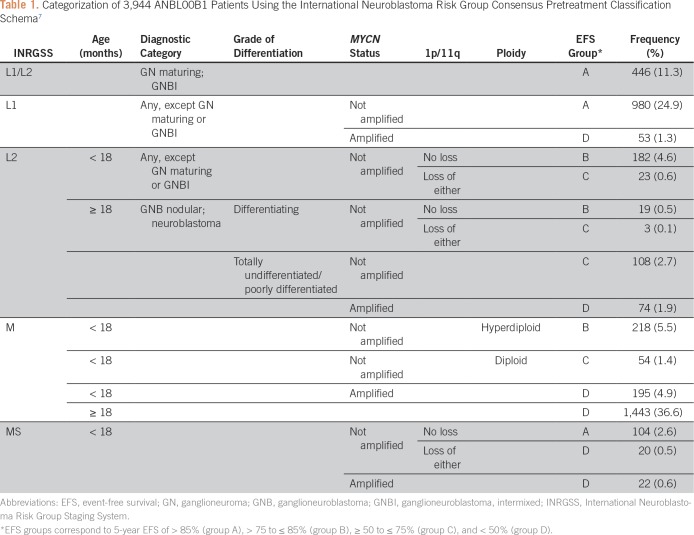
The INRG pretreatment classification system7 was used as a descriptive comparator (Table 1). To avoid confusion with the revised COG risk classification system still in development, EFS risk groups were assigned generic labels (ie, groups A, B, C, and D; Table 1). These correspond to 3-year EFS values of > 90% for group A, > 80 to ≤ 90% for group B, ≥ 55 to ≤ 80% for group C, and < 55% for group D, which are similar to the EFS cut offs used in the INRG system (5-year EFS of > 85%, > 75 to ≤ 85%, ≥ 50 to ≤ 75%, and < 50%, respectively).
Table 1.
Categorization of 3,944 ANBL00B1 Patients Using the International Neuroblastoma Risk Group Consensus Pretreatment Classification Schema7
STR and LASSO analyses were compared with the INRG classification system, with differences noted. The 3-year EFS for each terminal node of the STR and LASSO was classified into EFS groups A through D. Each approach (ie, STR, LASSO) was compared with the INRG classification system by summing the number of concordant patients and dividing by the total number of patients categorized by the two systems compared. The level of agreement between the INRG classification system, STR, and LASSO methods was assessed using weighted κ.33,34
RESULTS
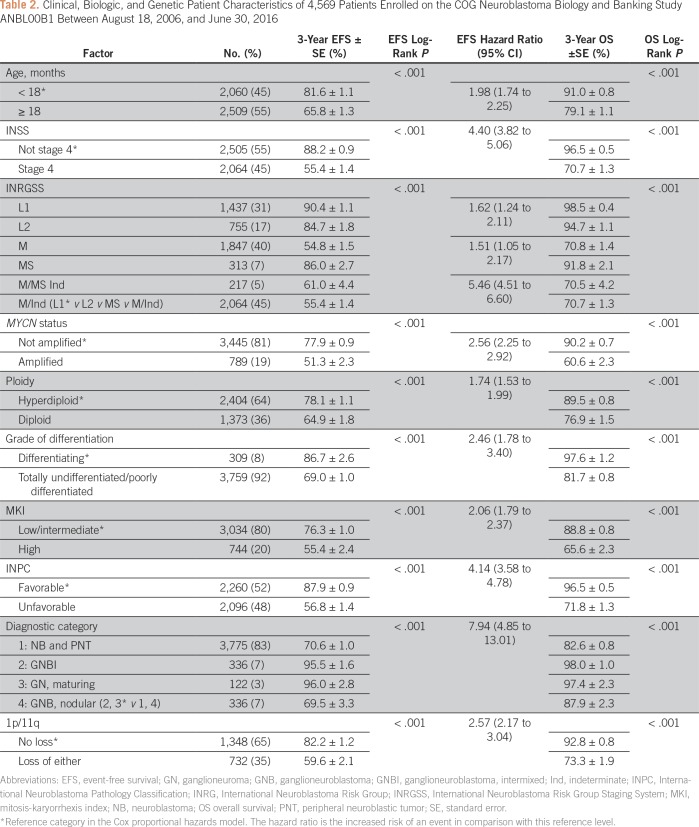
The analytic cohort of 4,569 eligible patients was used in the STR and the LASSO analyses (Table 2). The overall 3-year EFS and OS were 72.9% ± 0.9% and 84.5% ± 0.7%, respectively, with median follow-up time of 3.1 years in 3,487 patients alive without event. The degree of missing data varied from none (ie, age, stage, diagnostic category) to moderate (range, 5% to 17% for INPC, MYCN status, grade, MKI, and ploidy), to high (54.5%) for 1p/11q.
Table 2.
Clinical, Biologic, and Genetic Patient Characteristics of 4,569 Patients Enrolled on the COG Neuroblastoma Biology and Banking Study ANBL00B1 Between August 18, 2006, and June 30, 2016
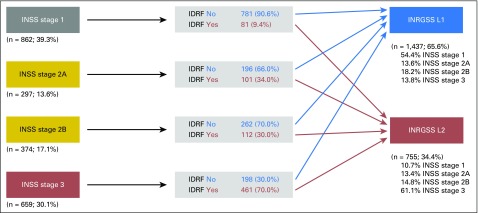
We examined how INSS mapped to INRGSS for patients with locoregional disease (Fig 2). As would be predicted, the proportion of patients with at least one IDRF present was higher in patients with more advanced INSS.
Fig 2.
Distribution of patients by INSS stage 1 through 3 and IDRF status into INRGSS L1 and L2 (n = 2,192 patients with INRGSS L1 or L2 tumors). IDRF, image-defined risk factor; INRGSS, International Neuroblastoma Risk Group Staging System; INSS, International Neuroblastoma Staging System.
STR Analysis
The PH assumption was upheld for all subgroup comparisons. Similar results were obtained in each of the internal validation datasets (validation set 1 concordance: 1,298/1,841 = 70.5%, weighted κ = 0.8700; validation set 2 concordance: 1,314/1,876 = 70.0%, weighted κ = 0.8242). Hence, the datasets were combined, and the following results were obtained.
Overall, the most strongly prognostic factor was diagnostic category (HR, 7.943; P < .001), resulting in the first branch in the tree (Fig 3). Although INRGSS M/MS Ind patients (n = 228) had a statistically significantly different outcome from INRGSS L1, L2, and MS, INRGSS M/MS Ind* patients had similar outcome to INRGSS M (HR, 1.194; P = .1442; Table 2). Thus, INRGSS M and M/MS Ind (hereafter denoted INRGSS M/Ind) were grouped together in subsequent analyses. Within GNBI (n = 458; EFS, 95.7% ± 1.3%; OS, 97.9% ± 0.9%), INRGSS subgroups M versus L1/L2 were prognostic. L1 and L2* patients had similar EFS (HR, 2.278; P = .4350) and were grouped together (n = 448; EFS, 97.3% ± 1.1%; OS, 98.9% ± 0.7%); however, there were only 10 INRGSS M and no MS patients in this cohort. There was no evidence to support further splits in the GNBI subset.
Fig 3.
EFS survival-tree regression of 4,569 patients enrolled on the Children’s Oncology Group NB biology and banking study ANBL00B1 between August 18, 2006, and June 30, 2016. Quoted values are 3-year EFS and OS rates. Diff, differentiated; EFS, event-free survival; GNB, ganglioneuroblastoma; GNBI, ganglioneuroblastoma, intermixed; Ind, indeterminate; INRG, International Neuroblastoma Risk Group; MKI, mitosis-karyorrhexis index; NB, neuroblastoma; OS, overall survival; Undiff, undifferentiated.
In the NB and GNB/nodular group (n = 4,111; EFS, 70.5% ± 0.9%; OS, 83.1% ± 0.8%), MYCN status was selected as a clinical split because of its historical role in determining treatment intensity.7,20,35 On the basis of inferior outcomes for patients with MYCN amplification, the current COG risk classification (Appendix Table A1) categorized most patients with MYCN amplification as high risk (ie, most intensive therapy). The outcome of the MYCN-amplified group has improved, lessening the apparent and underestimating the true, prognostic strength of MYCN status. Thus, treatment and MYCN status are confounded, which we addressed by creating a clinical split. In the MYCN-amplified group (n = 781; EFS, 50.7% ± 2.3%; OS, 60.1% ± 2.3%), the next split was by INRGSS MS* and M/Ind (HR, 1.083; P = .8222) versus L1* and L2 (HR, 1.627; P = .3243). INRGSS L1 and L2 patients had similar EFS (n = 125; EFS, 81.5% ± 4.6%; OS, 87.9% ± 3.9%) and were grouped together. INRGSS MS and M/Ind patients also had similar EFS (n = 656; EFS: 45.1% ± 2.5%; OS, 55.1% ± 2.5%). No additional statistical or clinical splits were indicated.
In the MYCN-nonamplified subgroup of the NB and GNB/nodular (n = 3,036; EFS, 75.7% ± 1.0%; OS, 89.3% ± 0.7%), patients with stage L1* and MS disease had similar EFS (HR, 1.034; P = .8769), but a clinical split was applied because these patients received differing intensities of therapy and are considered biologically different (localized v metastatic). In the INRG L1 group (n = 980; EFS, 88.5% ± 1.4%; OS, 98.4% ± 0.5%), the most strongly prognostic factor was grade (HR, 2.957; P = .0032). There was no statistical evidence for splits in the differentiating* subgroup (n = 184; EFS, 94.8% ± 2.2%; OS, 100%), but the totally undifferentiated/poorly differentiated subgroup (n = 783; EFS, 86.8% ± 1.6%; OS, 97.9% ± 0.7%) could be split by MKI (HR, 2.288; P = .0500), whereby patients with high MKI (n = 25) had significantly lower EFS (70.1% ± 14.5%) than low/intermediate MKI*.
In the INRG L2 patients with MYCN-nonamplified NB and GNB/nodular tumors (n = 556; EFS, 83.2% ± 2.1%; OS, 96.1% ± 1.1%), ploidy was the most strongly prognostic factor (HR, 2.425; P = .0014). The hyperdiploid* subgroup (n = 439; EFS, 84.8% ± 2.2%; OS, 98.0% ± 0.9%) was a terminal node, lacking statistical evidence for an additional split. In the diploid group, INPC was strongly prognostic (HR, 4.343; P = .0210), but age, grade, and MKI were not statistically significant. Patients with unfavorable INPC had significantly worse outcome (n = 28; EFS, 57.6% ± 11.3%; OS, 76.2% ± 9.6%) than those with favorable histology* (n = 25, EFS, 86.4% ± 11.3%, OS, 100%).
INRG MS patients in the MYCN-nonamplified subgroup of the NB and GNB/nodular (n = 264; EFS, 88.1% ± 2.6%; OS, 94.0% ± 1.9%) were split by 1p/11q (HR, 3.550; P = .0264), resulting in terminal nodes of patients with 1p/11q loss of either with worse outcome (n = 20; EFS, 75.0% ± 11.3%; OS, 87.7% ± 8.9%) than those with 1p/11q no loss* (n = 104, EFS, 92.3% ± 2.9%; OS, 96.1% ± 2.1%). Of note, all patients in the 1p/11q loss of either group had totally undifferentiated/poorly differentiated grade, low/intermediate MKI, and favorable histology.
In the INRG M/Ind subgroup of patients with MYCN-nonamplified, NB and GNB/nodular tumors (n = 1,236; EFS, 60.3% ± 1.8%; OS, 78.5% ± 1.5%), INPC was the most strongly prognostic factor (HR, 3.320; P < .0001). Note that age was also highly significant (HR, 3.294; reference group: age < 18 months; P < .0001). Unfavorable histology was a terminal node (n = 827; EFS, 50.7% ± 2.2%; OS, 72.7% ± 2.0%). The favorable histology* group (n = 362; EFS, 81.8% ± 2.7%; OS, 91.6% ± 1.9%) could be further split by 1p/11q (HR=2.176, P = 0.0199). The node comprised of patients with 1p/11q loss of either was terminal (n = 66; EFS: 73.6% ± 6.3%; OS: 85.7% ± 4.9%), while the group with 1p/11q no loss* (n = 149; EFS: 87.0% ± 3.1%; OS: 94.4% ± 2.1%) could be further split by ploidy (HR, 3.709; P = .0089). The hyperdiploid* (n = 127; EFS, 90.5% ± 2.9%; OS, 96.7% ± 1.8%) and diploid (n = 19; EFS, 66.7% ± 12.2%; OS, 83.3% ± 9.4%) subgroups were terminal nodes.
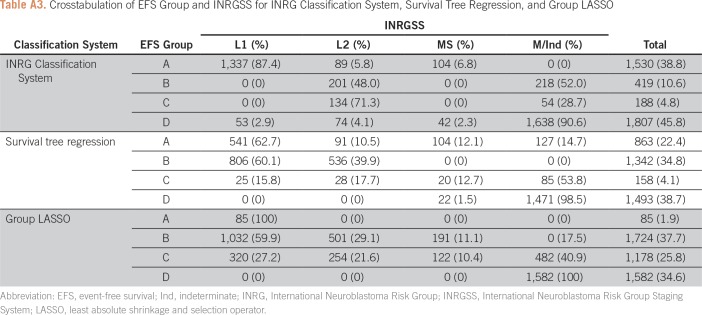
Applying the survival tree classification (Fig 3), a total of 3,856 patients (78.9%) could be classified: 863 (22.4%) in group A, 1,342 (34.8%) in group B, 158 (4.1%) in group C, and 1,493 (38.7%) in group D (Appendix Table A3). Reasons patients could not be assigned a group (n = 713) were as follows: NB and GNB/nodular patients missing MYCN status (n = 294; 41.2%); and NB and GNB/nodular patients with MYCN-nonamplified tumors and INRG MS (n = 140; 19.6%) or INRG M/Ind with favorable histology (n = 147; 20.6%) missing 1p/11q.
LASSO
On the basis of visual inspection of the Kaplan-Meier EFS curves, the assumption of missing completely at random appeared to be upheld for all prognostic variables.
Starting from the nine factors listed in Patients and Methods, the group LASSO reduced model included six variables with nonzero coefficients: MYCN status, ploidy, INPC, diagnostic category, 1p/11q, and INRGSS. The group LASSO model produced a tuning parameter value of 0.0106 and a mean cross-validated error of 8,353.222, which is smaller than the trivial model (ie, model with no predictors), which had a mean cross-validated error of 8,679.631. The corresponding RRs (reference group) for the nonmissing categories were as follows: MYCN status (nonamplified), 1.2196; ploidy (hyperdiploid), 1.1158; INPC (favorable), 1.9249; diagnostic category (GNBI), 1.5139; and 1p/11q (no loss), 1.0313. For INRGSS, M/Ind was the reference group, and RRs were as follows: L1, 0.3957; L2, 0.5007; and MS, 0.5278. In the group LASSO model, a patient with an MYCN-nonamplified, hyperdiploid, favorable histology, GNBI, 1p/11q no loss, and INRG L1 tumor had an expected 3-year EFS of 90.3%. Patients with INRG L1 tumors had predicted 3-year EFS ranging from 65.9% to 90.5%, depending on MYCN status, ploidy, INPC, diagnostic category, and 1p/11q. Similarly, the predicted 3-year EFS ranges of patients with INRG L2, MS, and M/Ind were 59.0% to 88.2%, 57.4% to 82.3%, and 34.9% to 76.8%, respectively.
Classification of patients according to the group LASSO fitted model was as follows: 85 (1.9%) in group A, 1,724 (37.7%) in group B, 1,178 (25.8%) in group C, and 1,582 (34.6%) in group D (Appendix Table A3).
Methodology Comparison
Applying the INRG classification system (Table 1), 3,944 (86.3%) patients could be classified: 1,530 (38.8%) in group A, 419 (10.6%) in group B, 188 (4.8%) in group C, and 1,807 (45.8%) in group D (Appendix Table A3). Among patients who could not be assigned a group (n = 625), reasons were as follows: missing MYCN status (n = 131; 21.0%), INRG L2 (n = 220; 35.2%), or MS (n = 140; 22.4%) patients with MYCN-nonamplified tumors missing 1p/11q; or INRG M/MS Ind patients with MYCN-nonamplified tumors (n = 98 [15.7%]; could not be classified due to different assignment depending on whether INRGSS M or MS).
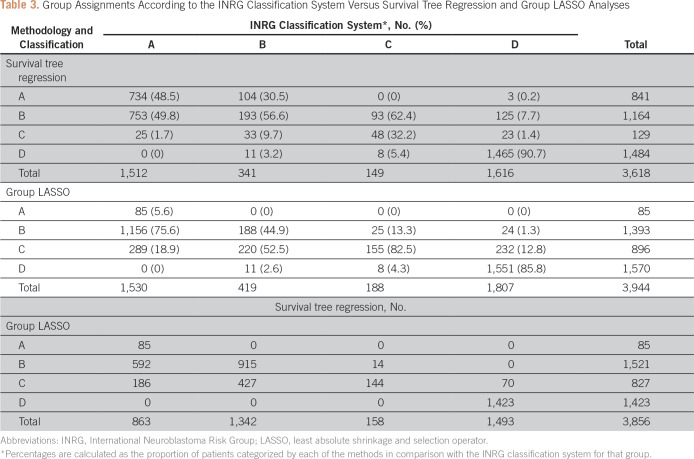
STR analysis had a concordance of 67.4% (2,440/3,618), categorizing 734 as belonging in group A, using STR, out of 1,512 patients categorized as group A by the INRG classification system; 193 of 341 as belonging in group B; 48 of 149 as belonging in group C; and 1,465 of 1,616 belonging in group D (Table 3). The largest discrepancy was 753 patients in group A, according to the INRG classification, belonging in group B according to STR. The group LASSO model had a concordance of 50.2% (1,979 of 3,944), categorizing 85 patients as belonging in group A, using group LASSO, out of 1,530 patients categorized as group A by the INRG classification system; 188 of 419 categorized as group B; 155 of 188 categorized as group C; and 1,551 of 1,807 categorized as group D (Table 3). The largest discrepancy was 1,156 patients categorized as group A, according to the INRG classification system, who were group B according to group LASSO.
Table 3.
Group Assignments According to the INRG Classification System Versus Survival Tree Regression and Group LASSO Analyses
The concordance between the INRG classification system and STR and group LASSO analyses, as measured by weighted κ, was 0.8673 (n = 3,618 patients classified by both systems) and 0.7480 (n = 3,944), respectively. Head-to-head comparison of STR and group LASSO methodologies on the basis of 3,856 patients yielded a weighted κ of 0.8025, indicating moderate agreement.
DISCUSSION
To facilitate comparison of COG risk-based clinical trials using surgical-pathologic INSS staging with those conducted by cooperative groups around the world using INRGSS, the COG risk classification must be revised to incorporate the pretreatment imaging-based INRGSS. We used two statistical methods (ie, STR, LASSO) to analyze > 4,500 patients with NB treated with modern-era therapy to support a revision to the COG risk classification system incorporating INRGSS. Importantly, we were able to confirm our STR results through an internal validation.
STR was more concordant (67.4%) with the INRG classification than group LASSO (50.2%), perhaps because the INRG classification was created using the same recursive-partitioning approach as STR. The classification of patients in group D matched that of INRG in > 90% of cases. A moderate proportion of patients in groups A and B matched between the STR and INRG approaches. The LASSO approach matched INRG in its classification of patients in group C more often than STR. However, LASSO and INRG were often discordant in categorizing patients with fairly good outcome (ie, groups A and B) . Most discordant patients were categorized into an immediately adjacent group, which suggests that changes in therapy adopted between the original INRG cohort and our current cohort may have influenced outcomes. LASSO used the same six factors to predict outcome for all patients, whereas STR took different factors into consideration for subgroups of patients with differing characteristics and survival. In addition, the EFS groups A through D in this analysis seem comparable to the INRG classification system, though the use of thresholds 5% higher than INRG (to account for 3- v 5-year EFS rates, respectively) may account for some of the discordance of INRG versus STR.
Age was not identified as one of the selected prognostic factors in either STR or LASSO analyses. We hypothesize this was due to the confounding of age and INPC, whereby INPC includes age in defining histology categories. Not surprisingly, INPC has greater prognostic strength than age alone because it is a composite factor of MKI, grade of differentiation, diagnostic category, and age. The same issue of confounding with INPC may have prevented model inclusion of MKI or grade. Models using the prognostic factors MKI, grade, diagnostic category, and age, instead of INPC alone, can provide greater granularity in risk stratification than INPC alone.36
A limitation of this analysis is the lack of formal statistical adjustment for the effect of treatment. An attempt was made to adjust for the effect of treatment using MYCN status as a surrogate, because of to its impact in the determination of treatment intensity in the current COG risk classification system. Another limitation is that more than half of patients were missing 1p/11q data. Reasons for lack of data include only requiring bone marrow submission and not tissue biopsy specimen in particular subgroups, and testing for 1p and 11q was not performed during the full period of this study. Nevertheless, 1p/11q was retained in the analyses because of its strong prognostic ability in certain subsets (Table 2).
In conclusion, the classifications on the basis of STR and LASSO analyses, using INRGSS and within the context of modern therapy, identified different patient subgroups than those that would be generated by application of the current COG risk stratification, which was created using INSS stage and data before 2002. These results will inform the development of a new COG risk classification system. In a heterogeneous disease like NB, rich in strongly prognostic factors, there are innumerable appropriate ways to stratify patients into risk groups that are clinically distinct and statistically significantly different in terms of outcome. As anticipated, the three different methods studied herein produced three somewhat different classifications; however, the degree to which they are similar is important from a clinical validity standpoint. Each method identified the same six factors as statistically and clinically significant, and each method can be operationalized to risk stratify patients. The STR approach, which has been used historically,7 provides greater clinical utility and has a higher degree of agreement with INRG than LASSO. However, there is statistical evidence to support the clinical validity of each of the three classifications: STR, LASSO, and INRG.
Appendix
Table A1.
Children’s Oncology Group Risk Classification System (2000-Present)
Table A2.
Prognostic Evaluation of Neuroblastic Tumors According to the International Neuroblastoma Pathology Classification
Table A3.
Crosstabulation of EFS Group and INRGSS for INRG Classification System, Survival Tree Regression, and Group LASSO
Footnotes
Supported by National Institutes of Health, National Cancer Institute (Grant No. U10 CA180899 to Children’s Oncology Group Statistics and Data Center), National Clinical Trials Network Operations Center (Grant U10 CA180886), and St Baldrick's Foundation.
AUTHOR CONTRIBUTIONS
Conception and design: All authors
Collection and assembly of data: Arlene Naranjo
Data analysis and interpretation: All authors
Manuscript writing: All authors
Final approval of manuscript: All authors
Accountable for all aspects of the work: All authors
AUTHORS' DISCLOSURES OF POTENTIAL CONFLICTS OF INTEREST
The following represents disclosure information provided by authors of this manuscript. All relationships are considered compensated. Relationships are self-held unless noted. I = Immediate Family Member, Inst = My Institution. Relationships may not relate to the subject matter of this manuscript. For more information about ASCO's conflict of interest policy, please refer to www.asco.org/rwc or ascopubs.org/jco/site/ifc.
Arlene Naranjo
No relationship to disclose
Meredith S. Irwin
No relationship to disclose
Michael D. Hogarty
No relationship to disclose
Susan L. Cohn
Stock and Other Ownership Interests: United Therapeutics, United Therapeutics (I), Varian Medical Systems (I), Vermillion, Resmed (I), Merck, Merck (I), Stryker, Stryker (I), Amgen, Amgen (I), Pfizer, Pfizer (I), Abbvie, Jazz Pharmaceuticals, Eli Lilly, Sanofi, Varex Imaging, Vermillion
Research Funding: United Therapeutics (Inst), Merck (Inst)
Julie R. Park
Honoraria: Bristol-Myers Squibb
Travel, Accommodations, Expenses: Roche
Wendy B. London
No relationship to disclose
REFERENCES
- 1.Howlader N, Noone AM, Krapcho M, et al., editors. SEER Cancer Statistics Review, 1975-2009 (Vintage 2009 Populations) Bethesda, MD: National Cancer Institute; 2012. http://seer.cancer. gov/csr/1975_2009_pops09/ [Google Scholar]
- 2.Gurney JG, Ross JA, Wall DA, et al. Infant cancer in the U.S.: Histology-specific incidence and trends, 1973 to 1992. J Pediatr Hematol Oncol. 1997;19:428–432. doi: 10.1097/00043426-199709000-00004. [DOI] [PubMed] [Google Scholar]
- 3.Monclair T, Brodeur GM, Ambros PF, et al. The International Neuroblastoma Risk Group (INRG) staging system: An INRG Task Force report. J Clin Oncol. 2009;27:298–303. doi: 10.1200/JCO.2008.16.6876. [DOI] [PMC free article] [PubMed] [Google Scholar]
- 4.Brodeur GM, Seeger RC, Barrett A, et al. International criteria for diagnosis, staging, and response to treatment in patients with neuroblastoma. J Clin Oncol. 1988;6:1874–1881. doi: 10.1200/JCO.1988.6.12.1874. [DOI] [PubMed] [Google Scholar]
- 5.Brodeur GM, Pritchard J, Berthold F, et al. Revisions of the international criteria for neuroblastoma diagnosis, staging, and response to treatment. J Clin Oncol. 1993;11:1466–1477. doi: 10.1200/JCO.1993.11.8.1466. [DOI] [PubMed] [Google Scholar]
- 6.Cecchetto G, Mosseri V, De Bernardi B, et al. Surgical risk factors in primary surgery for localized neuroblastoma: The LNESG1 Study of the European International Society of Pediatric Oncology Neuroblastoma Group. J Clin Oncol. 2005;23:8483–8489. doi: 10.1200/JCO.2005.02.4661. [DOI] [PubMed] [Google Scholar]
- 7.Cohn SL, Pearson ADJ, London WB, et al. The International Neuroblastoma Risk Group (INRG) classification system: An INRG Task Force report. J Clin Oncol. 2009;27:289–297. doi: 10.1200/JCO.2008.16.6785. [DOI] [PMC free article] [PubMed] [Google Scholar]
- 8.Pinto NR, Applebaum MA, Volchenboum SL, et al. Advances in risk classification and treatment strategies for neuroblastoma. J Clin Oncol. 2015;33:3008–3017. doi: 10.1200/JCO.2014.59.4648. [DOI] [PMC free article] [PubMed] [Google Scholar]
- 9.Irwin MS, Park JR. Neuroblastoma: Paradigm for precision medicine. Pediatr Clin North Am. 2015;62:225–256. doi: 10.1016/j.pcl.2014.09.015. [DOI] [PubMed] [Google Scholar]
- 10.Breiman L, Friedman JH, Olshen RA, et al. Classification and Regression Trees. Belmont, CA: Wadsworth; 1984. [Google Scholar]
- 11.Segal M. Regression trees for censored data. Biometrics. 1988;44:35–48. [Google Scholar]
- 12.Leblanc M, Crowley J. Survival trees by goodness of split. J Am Stat Assoc. 1993;88:457–467. [Google Scholar]
- 13.Ciampi A, Negassa A, Lou Z. Tree-structured prediction for censored survival data and the Cox model. J Clin Epidemiol. 1995;48:675–689. doi: 10.1016/0895-4356(94)00164-l. [DOI] [PubMed] [Google Scholar]
- 14.LeBlanc M, Crowley J. Relative risk trees for censored survival data. Biometrics. 1992;48:411–425. [PubMed] [Google Scholar]
- 15.Tibshirani R. Regression shrinkage and selection via the lasso. J R Stat Soc B. 1996;58:267–288. [Google Scholar]
- 16.Tibshirani R. The lasso method for variable selection in the Cox model. Stat Med. 1997;16:385–395. doi: 10.1002/(sici)1097-0258(19970228)16:4<385::aid-sim380>3.0.co;2-3. [DOI] [PubMed] [Google Scholar]
- 17.London WB, Castleberry RP, Matthay KK, et al. Evidence for an age cutoff greater than 365 days for neuroblastoma risk group stratification in the Children’s Oncology Group. J Clin Oncol. 2005;23:6459–6465. doi: 10.1200/JCO.2005.05.571. [DOI] [PubMed] [Google Scholar]
- 18.Moroz V, Machin D, Faldum A, et al. Changes over three decades in outcome and the prognostic influence of age-at-diagnosis in young patients with neuroblastoma: A report from the International Neuroblastoma Risk Group Project. Eur J Cancer. 2011;47:561–571. doi: 10.1016/j.ejca.2010.10.022. [DOI] [PubMed] [Google Scholar]
- 19.Mossé YP, Deyell RJ, Berthold F, et al. Neuroblastoma in older children, adolescents and young adults: A report from the International Neuroblastoma Risk Group project. Pediatr Blood Cancer. 2014;61:627–635. doi: 10.1002/pbc.24777. [DOI] [PubMed] [Google Scholar]
- 20.Seeger RC, Brodeur GM, Sather H, et al. Association of multiple copies of the N-myc oncogene with rapid progression of neuroblastomas. N Engl J Med. 1985;313:1111–1116. doi: 10.1056/NEJM198510313131802. [DOI] [PubMed] [Google Scholar]
- 21.Look AT, Hayes FA, Shuster JJ, et al. Clinical relevance of tumor cell ploidy and N-myc gene amplification in childhood neuroblastoma: A Pediatric Oncology Group study. J Clin Oncol. 1991;9:581–591. doi: 10.1200/JCO.1991.9.4.581. [DOI] [PubMed] [Google Scholar]
- 22.Shimada H, Chatten J, Newton WA, Jr, et al. Histopathologic prognostic factors in neuroblastic tumors: Definition of subtypes of ganglioneuroblastoma and an age-linked classification of neuroblastomas. J Natl Cancer Inst. 1984;73:405–416. doi: 10.1093/jnci/73.2.405. [DOI] [PubMed] [Google Scholar]
- 23.Shimada H, Ambros IM, Dehner LP, et al. The International Neuroblastoma Pathology Classification (the Shimada system) Cancer. 1999;86:364–372. [PubMed] [Google Scholar]
- 24.Peuchmaur M, d’Amore ES, Joshi VV, et al. Revision of the International Neuroblastoma Pathology Classification: Confirmation of favorable and unfavorable prognostic subsets in ganglioneuroblastoma, nodular. Cancer. 2003;98:2274–2281. doi: 10.1002/cncr.11773. [DOI] [PubMed] [Google Scholar]
- 25.Attiyeh EF, London WB, Mossé YP, et al. Chromosome 1p and 11q deletions and outcome in neuroblastoma. N Engl J Med. 2005;353:2243–2253. doi: 10.1056/NEJMoa052399. [DOI] [PubMed] [Google Scholar]
- 26.Kaplan E, Meier P. Nonparametric estimation from incomplete observations. J Am Stat Assoc. 1958;53:457–481. [Google Scholar]
- 27.Peto R, Pike MC, Armitage P, et al. Design and analysis of randomized clinical trials requiring prolonged observation of each patient. II. Analysis and examples. Br J Cancer. 1977;35:1–39. doi: 10.1038/bjc.1977.1. [DOI] [PMC free article] [PubMed] [Google Scholar]
- 28.Allison PD. Survival Analysis Using the SAS® System: A Practical Guide. Cary, NC: SAS Institute; 1995. p. 157. [Google Scholar]
- 29.Machin D, Cheung YB, Parmar MKB. Survival Analysis: A Practical Approach. Chichester, UK: John Wiley & Sons; 2006. [Google Scholar]
- 30.Thompson D, Vo KT, London WB, et al. Identification of patient subgroups with markedly disparate rates of MYCN amplification in neuroblastoma: A report from the International Neuroblastoma Risk Group project. Cancer. 2016;122:935–945. doi: 10.1002/cncr.29848. [DOI] [PMC free article] [PubMed] [Google Scholar]
- 31.Yuan M, Lin Y. Model selection and estimation in regression with grouped variables. J R Stat Soc Series B Stat Methodol. 2006;68:49–67. [Google Scholar]
- 32.Simon N, Friedman J, Hastie T, et al. Regularization paths for Cox’s proportional hazards model via coordinate descent. J Stat Softw. 2011;39:1–13. doi: 10.18637/jss.v039.i05. [DOI] [PMC free article] [PubMed] [Google Scholar]
- 33.Cohen J. A coefficient of agreement for nominal scales. Educ Psychol Meas. 1960;20:37–46. [Google Scholar]
- 34.Fleiss JL, Cohen J. The equivalence of weighted kappa and the intraclass correlation coefficient as measures of reliability. Educ Psychol Meas. 1973;33:613–619. [Google Scholar]
- 35.Brodeur GM, Seeger RC, Schwab M, et al. Amplification of N-myc in untreated human neuroblastomas correlates with advanced disease stage. Science. 1984;224:1121–1124. doi: 10.1126/science.6719137. [DOI] [PubMed] [Google Scholar]
- 36.London WB, Shimada H, d'Amore E, et al. Age, tumor grade, and mitosis-karyorrhexis index (MKI) are independently predictive of outcome in neuroblastoma (NB) J Clin Oncol. 2007;25(suppl 18):9558–9558. [Google Scholar]


