Abstract
Ductal carcinoma in situ (DCIS) is an early stage noninvasive breast cancer that originates in the epithelial lining of the milk ducts, but it can evolve into comedo DCIS and ultimately, into the most common type of breast cancer, invasive ductal carcinoma. Understanding the progression and how to effectively intervene in it presents a major scientific challenge. The extracellular matrix (ECM) surrounding a duct contains several types of cells and several types of growth factors that are known to individually affect tumor growth, but at present the complex bio-chemical and mechanical interactions of these stromal cells and growth factors with tumor cells is poorly understood. Here we develop a mathematical model that incorporates the cross-talk between stromal and tumor cells, which can predict how perturbations of the local biochemical and mechanical state influence tumor evolution. We focus on the EGF and TGF-β signaling pathways and show how up-or down-regulation of components in these pathways affects cell growth and proliferation. We then study a hybrid model for the interaction of cells with the tumor microenvironment (TME), in which epithelial cells (ECs) are modeled individually while the ECM is treated as a continuum, and show how these interactions affect the early development of tumors. Finally, we incorporate breakdown of the epithelium into the model and predict the early stages of tumor invasion into the stroma. Our results shed light on the interactions between growth factors, mechanical properties of the ECM, and feedback signaling loops between stromal and tumor cells, and suggest how epigenetic changes in transformed cells affect tumor progression.
Keywords: Microenvironment invasion
1. Introduction
Breast ducts are flexible tubes comprised of a layer of ECs, a layer of myoepithelial cells, and a layer of basement membrane, surrounded by the ECM (Fig. 1(A)). The ECM surrounding a duct contains fibroblasts, myofibroblasts, and macrophages that can secrete growth factors and cytokines, thereby establishing autocrine and paracrine signaling pathways that lead to modulation of the biochemical composition of the TME. In addition, fibroblasts can secrete ECM and thereby modulate the mechanical environment of a duct. It is now well established that the TME can have a significant effect on tumor growth and metastasis and can be significantly altered near a tumor by tumor-secreted factors (Beacham and Cukierman 2005; Samoszuk et al. 2005; Kim et al. 2011). Fibroblasts and macrophages are particularly important because it has been shown in both in vitro and in vivo studies that they can accelerate the development of tumors (van den Hooff 1988; Beacham and Cukierman 2005). Two important growth factors involved in maintaining homeostasis in a duct are EGF and TGF-β, and here we incorporate these into a model of epithelial cells in order to understand how perturbations in the associated signal transduction pathways influence tumor growth.
Fig. 1.
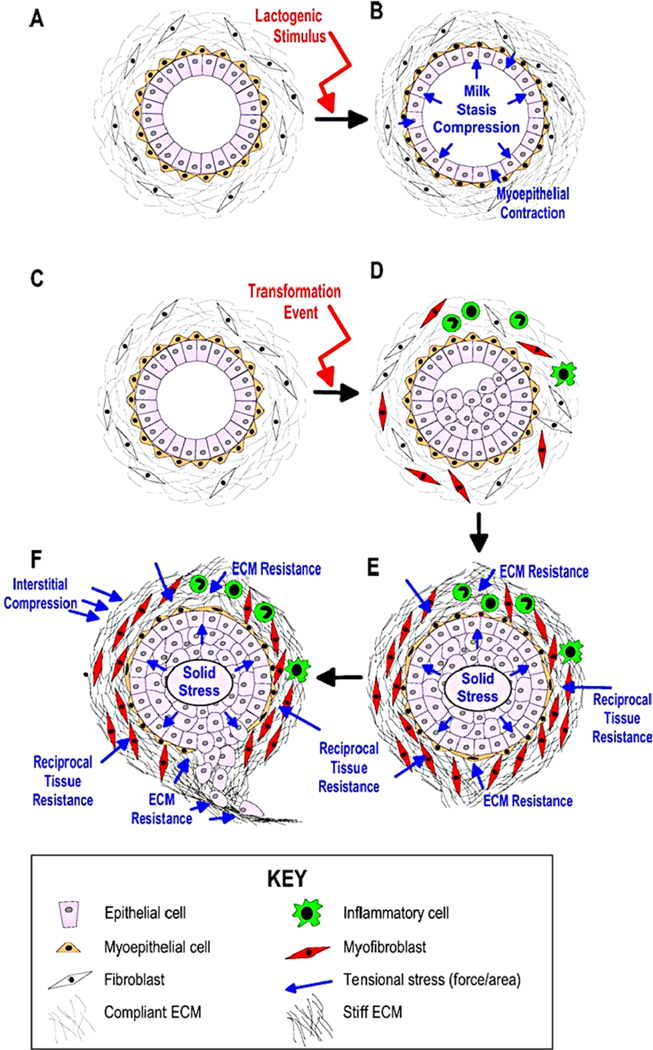
A schematic of the steps in the transition from normal ducts to an invasive tumor in breast cancer. (From Paszek and Weaver 2004, with permission)
Members of the TGF-β super-family of growth factors, which includes BMPs, activins, and TGF-βs, regulate many cellular processes, both during normal mammary gland development and during development of ductal tumors (Shi and Massagué 2003; Massagué 2008). The active form of TGF-β is a dimer that binds to a heterodimeric receptor comprised of Type I and Type II receptors, which when occupied phosphorylates and activates members of the Smad family. Phosphorylated Smad (pSmad) then binds with co-Smads and perhaps other factors, and the complex acts as a transcription factor that controls expression of various genes. One effect is down-regulation of the transcription factor c-Myc, which leads to arrest in the G1 phase of the cell cycle and control of cell proliferation. Changes in TGF-β signaling are generally not the result of mutations, but rather arise from subtle changes in the balances between the TGF-β pathways and other growth factor pathways, primarily the EGF pathway, that alter the balance between the growth-inhibiting effect of TGF-β and the growth-promoting effects of other factors. These changes can occur via interference with transcriptional co-repressors or coactivators involved in the Smad pathway, which leads to epigenetic regulation of critical steps in the progression to cancer (Hinshelwood et al. 2007).
Under normal conditions, fibroblasts in the TME divide infrequently and only secrete the amount of EGF and other factors needed to maintain homeostasis. In the homeostatic state rates of TGF-β and EGF production are balanced, and growth and proliferation are controlled, but when the number of transformed ECs (TECs) is large enough, proliferation and secretion of TGF-β increases (Massague 1998, 2008). The increased secretion of TGF-β into the stroma stimulates differentiation of fibroblasts into myofibroblasts and up-regulates their secretion of EGF. This increase in EGF can induce up-regulation of EGF receptors such as Her2/Neu on ECs, and this in turn enhances signaling via the EGF pathway (Cheng and Weiner 2003). This increase in EGF signaling disrupts the balance between the EGF and the TGF-β-pathways that govern proliferation (see Fig. 2) and stimulates further proliferation, thereby creating a positive feedback loop that enhances proliferation.
Fig. 2.
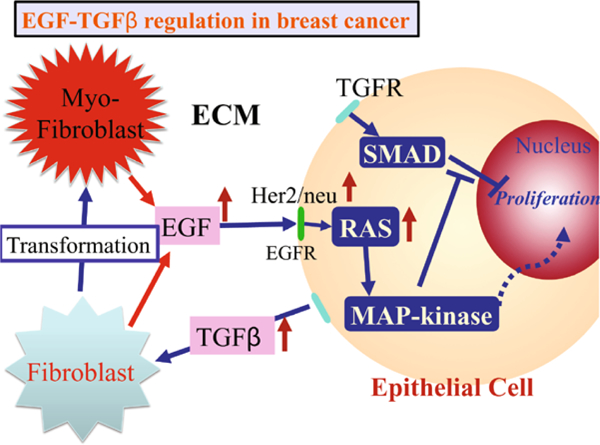
The interaction of the EGF and TGF-β pathways in the control of proliferation in breast cancer. In normal ECs, these pathways are balanced so as to control growth, but in TECs increased secretion of TGF-β induces fibroblasts and myofibroblasts to secrete more EGF. This disrupts the proliferation-inhibition mechanism by partially blocking the TGF-β-Smad pathway and triggers proliferation
Thus, TGF-β can have a biphasic effect on tumor growth: In early development of DCIS, it inhibits proliferation and outgrowth of tumors, but in later stages it can promote tumor progression by up-regulation of EGF production in stromal fibroblasts, thereby offsetting the tumor suppressor effects of TGF-β. Other effects of TGF-β include down-regulation of adhesion molecules such as E-cadherin, which induces the epithelial to mesenchymal transition, which is the first step in metastasis.
In early stages of DCIS, the basement membrane remains intact and confines the tumor to the interior of the duct, and at this stage the surrounding ECM plays a restraining role by providing a mechanical “backstop” to prevent expansion of the tumor. In a later stage, called comedo DCIS, the tumor cells completely occlude the duct and in this stage cells exhibit a different expression pattern of tenascin, an extracellular matrix glycoprotein that also appears around healing wounds. There is also an increase in stromal cellularity, due to an increase in the number of fibroblasts, lymphocytes, and small blood vessels. These “tumor-associated-fibroblasts” (TAFs) play a role in a perceived “greater infiltrative potential” for comedo DCIS when compared to noncomedo DCIS, both by secretion of paracrine factors detected by tumor cells, and by alterations to the ECM. Myofibroblasts, which are characterized as activated fibroblasts with the phenotypic characteristics of smooth muscle differentiation, are abundant in the stroma of malignant breast tissue, but rarely seen in normal breast tissue (Sappino et al. 1988). Active proliferation of myofibroblasts and in turn, increased collagen deposition near tumor regions, are characteristics of many solid tumors (Tlsty 2001). Whereas in in situ carcinoma, myofibroblasts predominantly reside in the immediate periphery of the developing carcinoma, after the transition to invasive breast cancer myofibroblasts migrate to the invading front (Tlsty 2001; Hanamura et al. 1997). These differences in both the abundance and location of myofibroblasts probably stem from signals sent by epithelial cells in which oncogenic changes have occurred.
The initial expression of proteases in breast cancer may be associated with the transition from DCIS to invasive ductal carcinoma. Expression studies of MMP in human DCIS tissue have shown that several classes of MMPs are expressed in periductal fibroblasts and myofibroblasts, indicating an intense stromal involvement during early invasion (Almholt et al. 2007). (See Fig. 3.) However, it is not well understood how degradation of the basal membrane and tumor invasion are coordinated, especially in the midst of chemical signals between stromal cells and tumor cells.
Fig. 3.
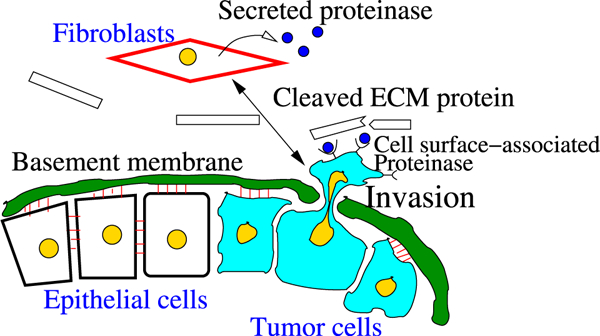
Illustration of tumor invasion in vivo (after Geho et al. 2005; Kim and Friedman 2010). In response to chemical signals, possibly from tumor cells, recruited fibroblasts secrete proteinases (MMPs), which diffuse through the ECM and bind to the receptors of tumor cells. Then, a “stimulated” tumor cell secretes secondary proteinases, which degrade ECM proteins. In order for a cell to invade the stroma, the tumor cell has to sever all adhesion junctions to neighboring cells and the basal membrane as a first step, and secrete proteinases to pass through the thick layers of the duct. The building blocks of this thick shield consist of layers of epithelial cells, myoepithelial cells, and basal membrane. The basal membrane consists of various proteins, fiber bundles (collagens), and ECM components
In the following sections, we analyze the model of the EGF and TGF-β pathways first introduced in Kim et al. (2011), hereafter referred to as I. In the third section, we study a 2D hybrid model describing the interactions amongst TECs, fibroblasts, and myofibroblasts via EGF and TGF-β. In this hybrid description, a cell-based model is used to describe the dynamics of TECs in the duct and ECs on the interface between stroma and the duct, as well as for the dynamics of the sinks and sources that arise from the fibroblasts and myofibroblasts in the stromal tissue. The surrounding stroma is modeled as a viscoelastic continuum and transport of various chemical species is described by diffusion through the tissue. In the fourth section, we extend the model to incorporate equations that describe the evolution of tissue proteases and show how degradation of the surrounding stromal tissue allows a tumor to expand into the void created. We begin with the model for the EGF and TGF-β pathways in a single cell, so as to first understand how the balance between these pathways is controlled within a cell and how it is altered by changes to components in the pathway.
2. The Intracellular Dynamics of the EGF and TGF-β Signaling Pathways
The signaling model for the EGF and TGF-β pathways is greatly simplified so as to facilitate analysis, yet retains the essential characteristics of the pathways, as shown in Fig. 4. We first focus on the intracellular steps, the model for which is based on the following three major assumptions: (i) TGF-β-bound receptors phosphorylate Smads (Abdollah et al. 1997; Liu et al. 1997; Souchelnytskyi et al. 1997), (ii) EGF-occupied receptors activate a molecule that binds to either phosphorylated or unphosphorylated Smads (such as RAS (Kretzschmar et al. 1999; Kretzschmar et al. 1997), MAP kinase (Kretzschmar et al. 1999; Davis 1993), ERK kinase (Kretzschmar et al. 1999; Davis 1993; Marshall 1995; Santos et al. 2007), Mekl kinase (Kretzschmar et al. 1999; Alessi et al. 1995), and (iii) the proliferation rate is a monotone decreasing function of the concentration of phophorylated Smad (Kretzschmar et al. 1999; Zi et al. 2011).
Fig. 4.
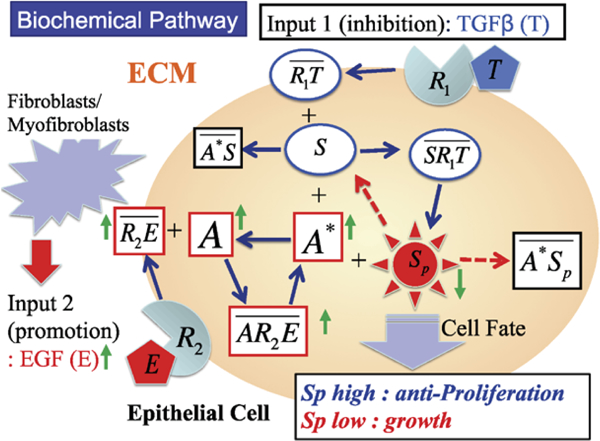
A schematic of the components in the EGF and TGF-β pathways
The symbols for the species involved and their definitions are given in Table 1. The reactions involved in the model are as follows. In these reactions and in the following equations, both EGF and TGF-β are held fixed; their variation in space and time appears in the hybrid model.
Table 1.
The definitions and symbols of the primary variables in the EGF and TGF-β signaling pathways
| Notation | Description | Abbreviation |
|---|---|---|
| E | EGF | |
| T | TGF-β | |
| R1 | TGF-β receptor | TGF-βR |
| R2 | EGF receptor | EGFR |
| S | Unphophorylated Smad | Smad |
| Sp | Phosphorylated Smad | pSmad |
| A | Inactive form of the EGF-activated molecule | iEGFAM |
| A* | Active form of the EGF-activated molecule | aEGFAM |
Ligand binding:
| (1) |
Smad reactions and activator reactions
| (2) |
| (3) |
| (4) |
In the above, kinetic steps overlines denote complexes. While it appears that the EGF and TGF-β pathways only interact at the steps in (3), they are in fact coupled through the conservation conditions given later. By invoking mass-action kinetics for all steps in the foregoing reactions, one can derive the following evolution equations for the variables , , , , ,, , , , .
Evolution Equations
| (5) |
| (6) |
| (7) |
| (8) |
| (9) |
| (10) |
| (11) |
| (12) |
| (13) |
| (14) |
In addition, there are four conservation relations:
At fixed EGF and TGF-β there are twelve variables, of which eight are independent, but we have chosen to use two of the conservation relations to eliminate the equations for R1 and R2 in the evolution equations above. Of course, the equations for S and A could also be eliminated. The rate constants and other parameters that appear in these equations are given in Table 2.
Table 2.
Parameters for the model of the intracellular dynamics. Some parameters were estimated to fit the experimental data in Kretzschmar et al. (1999)
| ParameterDescription | Value | References | |
|---|---|---|---|
| Association (TGF-β) | 4.44 nM−1 min−1, | (Schmierer et al. 2008; Chung et al. 2009) |
|
| Dissociation (TGF-β) | 2.4 × 10⁻¹ min−1 | (Schmierer et al. 2008; Chung et al. 2009) |
|
| Association (EGF) | 9.7 × 10⁻² nM−1 min−1 | (Hendriks et al. 2005) | |
| Dissociation (EGF) | 1.2 × 10⁻¹ min−1 | (Hendriks et al. 2005) | |
| Association (Smad) | 2.4 × 10⁻² nM−1 min−1 | (Chung et al. 2009) | |
| Dissociation (Smad) | 3.96 × 10⁻¹ min−1 | (Chung et al. 2009) | |
| Phosphorylation (Smad) | 2.4 × 10⁻¹ min−1 | (Chung et al. 2009) | |
| Association (iEGFAM) | 1.2 × 10⁻¹ nM−1 min−1 | Estimated | |
| Dissociation (iEGFAM) | 2.8 × 10⁻¹ min−1 | Estimated | |
| Activation (aEGFAM) | 8.15 × 10⁻³ min−1 | Estimated | |
| Association (aEGFAM:Smad) | 3.0 × 101 nM−1 min−1 | (Chung et al. 2009) | |
| Dissociation (aEGFAM:pSmad) | 9.6 × 10⁻¹ min−1 | (Chung et al. 2009) | |
| k A | Inactivation (aEGFAM) | 1.7 × 10⁻¹ min−1 | Estimated |
| k S | Dephosphorylation (Smad) | 3.96 × 10⁻¹−3.96 × 101 min−1
(1.3d-2) |
(Chung et al. 2009) |
| R 10 | Total number of TGF-β receptors | 104/cell (1.0d1 nM) | (Hendriks et al. 2005) |
| R 20 | Total number of EGF receptors | 104/cell (1.0d1 nM) | (Hendriks et al. 2005) |
| S 0 | Total amount of Smad | 40 nM | Estimated |
| A 0 | Total amount of EGFAM | 40 nM | Estimated |
It is easy to see that the nonnegative cone of the twelve-dimensional composition space is invariant under the positive semiflow defined by (5)—( 14) and all solutions that begin in that cone remain bounded for t ≥ 0.
At steady state
From the conservation equations, one finds that
and if E ≠ 0,
At fixed E and T, the left-hand side is a function of A alone and the right-hand side is a function of S alone, and one can solve for A explicitly as a function of S to obtain
A similar equation for S as a function of A can be obtained from the last conservation condition. Now one finds that
The quantity in square brackets is a function G1(E,S,T), and thus one obtains the quadratic equation
for A, and Descartes’ rule of signs implies that this always has one positive real root and one negative real root, whatever the sign of the coefficient of the linear term.
When both E and T are zero, i.e., there are no inputs, S = S0 and A = A0, i.e., there is no activation of any species. In the absence of E one finds that A = A0 and A* = 0, and that S satisfies a quadratic equation obtained by setting the numerator in F1 equal to zero. This quadratic has a single positive real root, as expected. A similar argument can be used to show that when T = 0, S* = 0, S = S0, and that there is single positive root for A. For some parameter values, multiple steady states are possible, but not for those used here. Furthermore, we have not proven that there are no periodic solutions or more complicated dynamics, but have not found any numerical evidence for either.
2.1. Computational Results for the Local Dynamics
Figure 5 shows the time course of the ten internal variables retained in (5)—(14) for four combinations of high and low inputs of TGF-β and EGF. These correspond to levels used experimentally in Kretzschmar et al. (1999). When TGF-β levels are low (T = 1 pM), the pSmad levels are low for either high (E = 1 nM) or low (E = 0.01 nM) levels of EGF, because is small (A), and thus little pSmad is produced (H), as observed in Kretzschmar et al. (1999). They found that in the absence of TGF-β, both wild type (EpH4) and tumorogenic cell type (EpRas) exhibited low levels of Smad2/Smad3 accumulation in the nucleus, which corresponds to low levels of pSmad in our model. On the other hand, one sees that low levels of EGF and high levels of TGF-β lead to high (A), which increases the pSmad level (Sp) through the TGF-β pathway (H). This stems from the fact that low EGF levels lead to low levels (B), which produces low levels of A* (G), and this in turn reduces the sequestration of pSmad by A*. The weakening of this inhibitory function of the EGF pathway leads to persistent high levels of the antiproliferative molecule, pSmad. When EGF input levels are high (E = 1 nM), its inhibitory action on the TGF-β pathway is strengthened via an increase in A*, even in the presence of high TGF-β signaling (T = 400 pM), which leads to low pSmad levels.
Fig. 5.
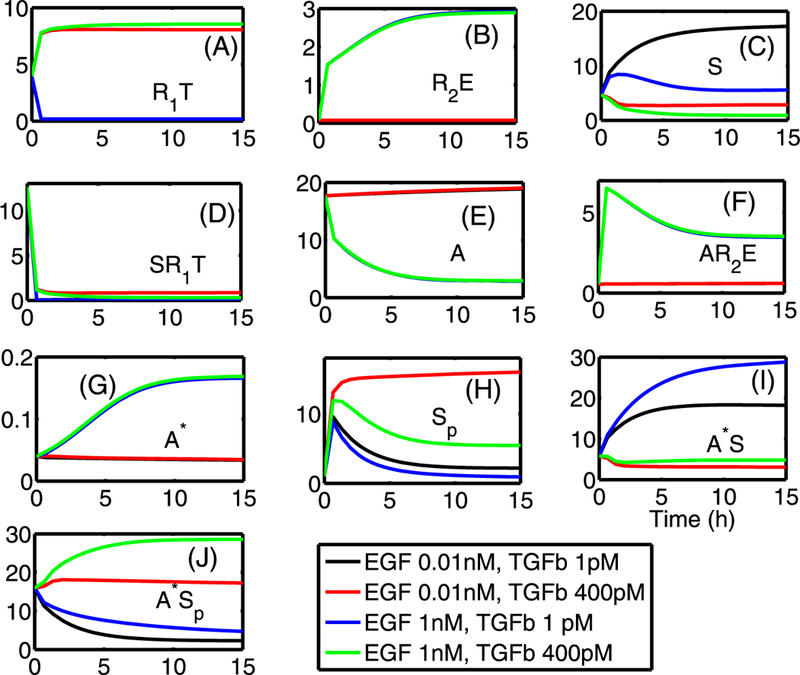
Local dynamics of all internal variables, indicated in each panel, for high and low values of TGF-β (1, 400 pM) and EGF (0.01, 1 nM). The pSmad level (Sp) is high for the low EGF level (0.01 nM) and high TGF-β level (400 pM), while the pSmad levels are suppressed for high levels of EGF (E = 1 nM) or when both inputs are low (E = 0.01 nM, T = 1 pM). Initial conditions: y1(0) = 3.956, y2(0) = 0.0752, y3(0) = 4.6759, y4(0) = 12.5923, y5(0) = 17.675, y6(0) = 0.5532, yj(0) = 0.0396, y8 (0) = 1.0, y9(0) = 5.7833, y10(0) = 15.9485. In all panels, the x-axis indicates the time in hours as in (I) and the y-axis indicates the concentration of species in nM units
Figures 6(A, B) show experimental and numerical results for EGF and TGF-β control over TEC growth. Kretzschmar et al. (1999) found that the Ras pathway inhibits the TGF-β-controlled antiproliferation effect, as shown in Fig. 6(A). Receptor-activated Smad2 or Smad3 translocates to the nucleus and forms a transcriptional complex on the activin/TGF-β response element (ARE). Strong (up to 14-fold) activation of an ARE reporter construct (A3-Luc) by TGF-β was observed in nontu-morigenic EpH4 cells (squares in Fig. 6(A)), but only weak activation (2-fold) of A3-Luc by TGF-β was found in the v-Ha-Ras-transformed derivative, EpRas cells (triangles in Fig. 6(A)), suggesting impaired Smad signaling. We did not model the detailed steps in the process, but rather, we assumed that pSmad represents a measure of activity similar to that of the ARE reporter construct (A3-Luc). Our model for the intracellular dynamics predicts that the EGF-Ras pathway can block the TGF-β- Smad pathway and lead to a reduced pSmad concentration and increased proliferation (Fig. 6(B)). To compare the results, we assume that the EGF level is low under normal conditions, and that a high EGF level represents hyperactive Ras-mutant cells (EpRas). Simulation results show that pSmad levels are increased as TGF-β levels are increased for fixed values of EGF input levels (E = 0.01, 0.1, 1, 10 nM) and the levels of pSmad are decreased as input levels of EGF are increased.
Fig. 6.
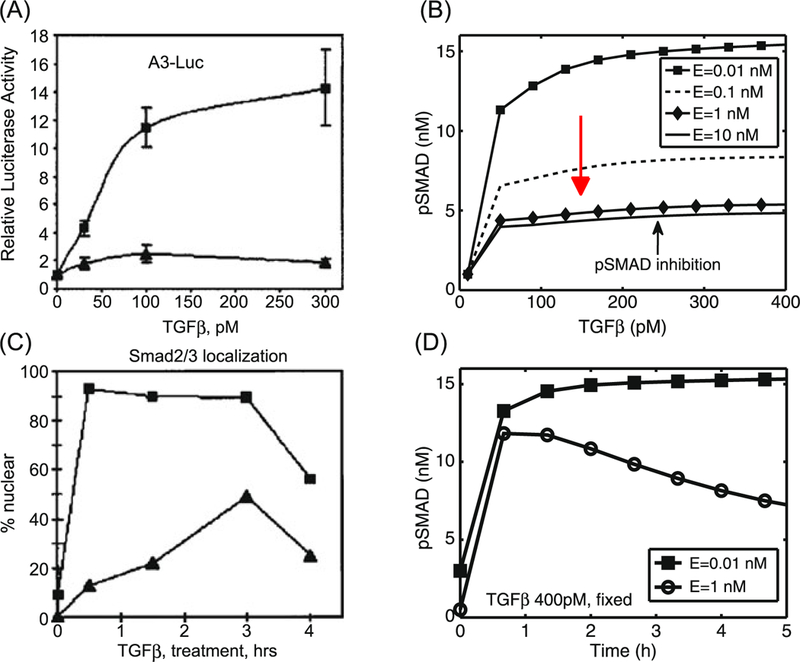
(A) Activation of the A3-Luciferase reporter construct at the indicated concentration of TGF-β analyzed in EpH4 (squares) and EpRas, a Ras-transformed derivative (triangles), of mammary epithelial cells. (Modifed from Kretzschmar et al. 1999 with permission.) (B) Model predictions: inhibition of pSmad level when ECs are exposed to a higher concentration of EGF. For comparison of the model predictions with normal (EpH4) and mutant (EpRas) cell responses in (A), we assume that increased signaling due to increased EGF is equivalent to the Ras-mutant response. For fixed values of EGF levels, pSmad levels are increased when TGF-β levels are increased. The pSmad level is inhibited as EGF levels are increased (red arrow). (C) Smad2/3 localization levels of EpH4 (squares) and EpRas (triangles) cells were measured with fixed amounts of TGF-β treatments. (Modified from Kretzschmar et al. 1999 with permission.) (D) Model predictions: the time course of pSmad levels for low (E = 0.01 nM) andhigh (E = 1 nM) EGFlevels while TGF-β levels were fixed (T = 400 pM). Initial conditions for the low EGF (E = 0.01 nM) y1 (0) = 3.956, y2(0) = 0.0752, y3(0) = 4.6759, y4(0) = 12.5923, y5(0) = 17.6754, y6(0) = 0.5532, y7(0) = 0.0396, y8(0) = 1.0, y9(0) = 5.7833, y10(0) = 15.9485. Initial conditions for the high EGF (E = 1 nM) y1 (0) = 3.956, y2(0) = 0.0752, y3 (0) = 4.6759, y4 (0) = 13.0923, y5 (0) = 17.6754, y6(0) = 0.5532, y7 (0) = 0.0396, y8(0) = 0.5, y9(0) = 5.7833, y10(0) = 15.9485
Kretzschmar et al. (1999) determined the immunofluorescence pattern of endogenous proteins in EpH4 and EpRas using anti-Smad2/Smad3 antibodies. In the absence of TGF-β, both cell lines showed anti-Smad2/Smad3 staining throughout the cell. When TGF-β was added, more than 95 % of the wild type (EpH4 cells) showed a rapid accumulation of the Smad2/Smad3 immunostaining in the nucleus, which lasted for at least 3 h, while the mutant (EpRas) showed a limited accumulation of Smad2/Smad3 in response to TGF-β treatment (cf. Fig. 6(C)). The simulations show a rapid increase in pSmad levels within less than 1 h, and persistent high levels of pSmad in response to a high (400 pM) fixed TGF-β level and low level of EGF (E = 0.01 nM). This corresponds to EpH4 (squares) in Fig. 6(C). For the case of the high EGF level (E = 1 nM), the pSmad level is low compared to the wild type. This low level of pSmad would correspond to partial accumulation of Smad2/Smad3 in the nucleus of mutant (EpRas cells) with up-regulated EGF levels. The discrepancy in the time course of pSmad response to high EGF levels in experiments (triangles in Fig. 6(C)) and simulations (circles in Fig. 6(D)) arises from a difference in reported quantities, i.e., pSmad activities are measured in the nucleus in experiments and total pSmad levels (= pSmads in cytoplasm + pSmads in nucleus) in the mathematical model. Therefore, total pSmad levels should be measured in experiments for further validation of the model in the future. Alternatively, one could develop a more detailed mathematical model that takes into account reactions in both the cytoplasm and the nucleus.
These authors also examined the pattern of Smad2/Smad3 nuclear accumulation in five human colon carcinoma cell lines and found that nuclear accumulation of Smad2/Smad3 in response to an intermediate (10 pM) TGF-β concentration was poor or absent in these tumorogenic cell lines (with oncogenic K-Ras mutations), but extensive in wild-type cells. Our simulations also show similar results for this intermediate TGF-β level (10 pM), i.e., up-regulation of pSmad for cells with low EGF levels (wt) and downregulation of pSmad for high EGF levels (mutant) (data not shown).
In Fig. 7, we show results of tests on the effect of increasing EGF levels. An increase in the EGF level leads to increased sequestration of Smads, and thus down-regulates the pSmad levels for the fixed values of TGF-β (T = 10, 20,400 pM). This downregulation diminishes as the TGF-β level is increased (green arrow in (A)), but this inhibitory effect of EGF on pSmad still persists when TGF-β levels are simultaneously increased with increasing EGF levels (cf. Fig. 7(B)).
Fig. 7.
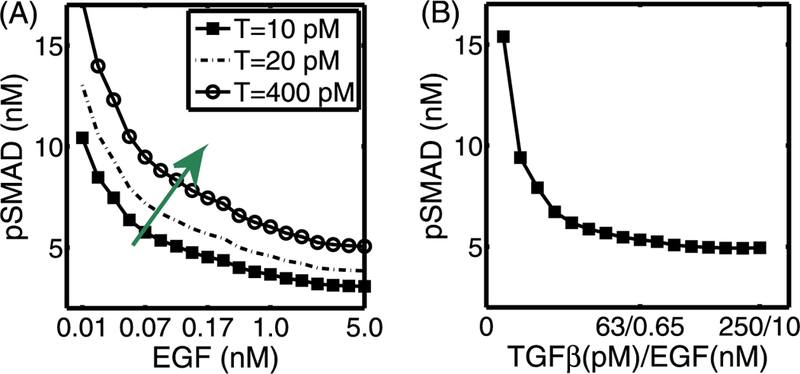
(A) The steady-state pSmad levels in response to an increase in EGF levels for various fixed values of TGF-β. For the fixed values of TGF-β (T = 10, 20, 400 pM), an increase in the EGF level induces a decrease in the pSmad level. (B) The steady-state pSmad levels in response to a simultaneous increase in both EGF and TGF-β levels. The high pSmad levels present at low values of both growth factors are decreased as both TGF-β and EGF levels are increased simultaneously
Figure 8 shows the summary of pSmad patterns for various combinations of EGF and TGF-β levels. As we showed in the previous figures, pSmad levels are increased (decreased) as TGF-β (EGF) levels are increased. In our modeling framework of the early development of breast cancer, pSmad levels begin in the left-lower corner of the plane (low EGF, low TGF-β) and travel roughly along the skew-diagonal trajectory (from southwest to northeast), changing high Smad levels to low levels to initiate the TEC transformation. Level sets show the general pattern in Fig. 8(B).
Fig. 8.
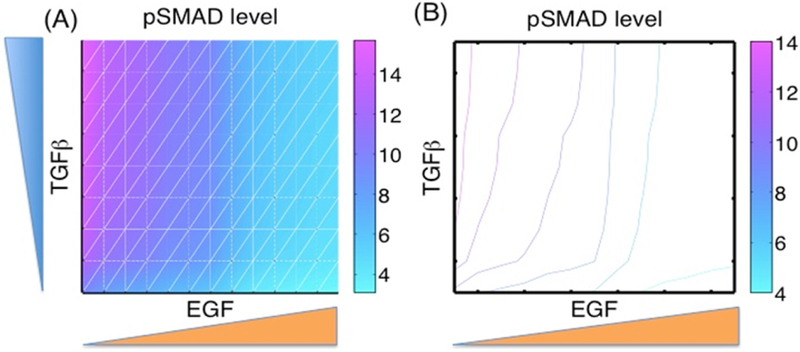
Patterns of pSmad in EGF and TGF-β plane, with initial conditions as before. y1(0) = 3.956, y2(0) = 0.0752 y3(0) = 4.6759, y4(0) = 12.5923, y5(0) = 17.6754, y6(0) = 0.5532, y7(0) = 0.0396, y8 (0) = 1.0, y9(0) = 5.7833, y10(0) = 15.9485
In Fig. 9, we show the periodic fluctuation of pSmad levels in response to a cycle of high and low levels of TGF-β (A) and EGF (B). One sees in Fig. 9(A) that pSmad levels increase rapidly after a step increase to a high level (T = 400 pM) of TGF-β, but relax slowly following a step down to T = 1 pM. Similarly, pSmad levels can be reduced after a step up of EGF (E = 4 nM) is introduced, but they then creep up to an antiproliferative state in response to the low EGF levels (E = 0.01 nM) that follow. These fluctuating responses indicate that the transition between proliferative and antiproliferative states will be possible when either EGF or TGF-β input levels are given in a periodic fashion. In recent studies, Zi et al. (2011) investigated the dynamics of pSmads in response to fluctuating TGF-β levels both experimentally and using a mathematical model. The model described the complex and detailed chemical reactions in pSmads and their associated molecules in both the cytoplasm and the nucleus in response to various TGF-β inputs. P-Smad2 levels showed a periodic response for periodic injections of TGF-β with short and relatively long duration. Even though this study focused on the TGF-β pathway, the alternating levels of pSmad levels predicted by our model and shown in Fig. 9(A) are consistent with these experimental and simulation results in Zi et al. (2011), especially the rapid increase and slow decrease in total pSmad levels. This gives some support to the appropriateness of the parameters used in the simulations, but a more detailed sensitivity analysis is done in the following section.
Fig. 9.
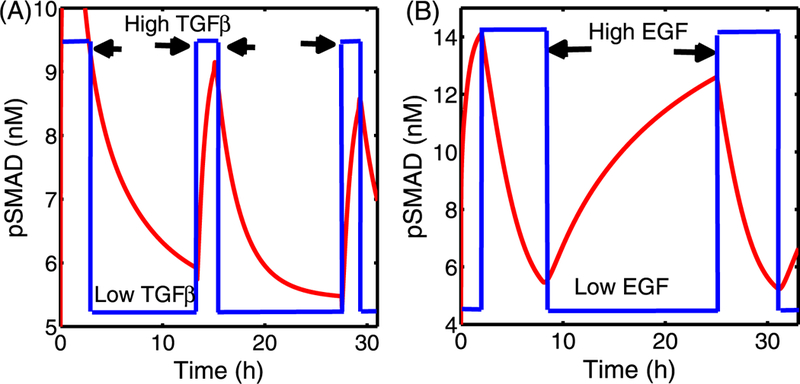
(A) pSmad levels in response to fluctuating TGF-β levels with a fixed EGF level (E = 0.08 nM). High (T = 400 pM; arrows) and low (T = 1 pM) levels of TGF-β were imposed in a periodic fashion. The pSmad level rises quickly immediately after a step increase of TGF-β, and decays slowly to the low state in response to small input of TGF-β. (B) pSmad levels in response to fluctuating EGF levels with the fixed TGF-β level (T = 100 pM). High (E = 4 nM; arrows) and low (0.01 nM) levels of EGF were imposed in a periodic fashion. The high level of pSmad decreases rapidly to a low level in response to a high EGF level, but the pSmad level slowly creeps up to a high level in response to low EGF. Initial conditions are as in Fig. 8
2.2. Sensitivity Analysis
Since there is no experimental data available for the parameters we sought to determine how sensitive the state variables are to these parameters by doing a sensitivity analysis on the model. We have chosen a range for each of these parameters and divided each range into 6,000 intervals of uniform length. The base values of the parameters are as in Tables 3. For each of the parameters, a partial rank correlation coefficient (PRCC) value is calculated. PRCC values range between −1 and 1 with the sign determining whether an increase in the parameter value will decrease (–) or increase (+) the concentrations of the designated regulating chemicals at a given time. Table 3 summarizes the results of the sensitivity analysis in terms of the all variables at t = 150. Figure 10 illustrates sensitivity analysis of all variables for the chosen ten parameters at the final time (t = 150). We show the sensitivity of SMAD-related variables and other variables from the EGF pathway in response to these parameters in Figs. 10(A) and (B), respectively. One can see that pSmad level Sp is sensitive to the parameters among others. In particular, pSmad levels have a strong positive correlation with the dissociation rate from the complexes and a strong negative correlation with the association rate to the complex (Fig. 10(A)). One can also see that pSmad levels are also positively correlated with the inactivation rate kA while it is negatively correlated with the association rate in Fig. 10(B).
Table 3.
Model parameters used in sensitivity analysis and PRCC values of at t = 30 min (upper section; 30 m), t = 90 min (middle section; 90 m), 150 min (lower section; 150 m), respectively, for ten perturbed parameters . A range (minimum/maximum) of the ten perturbed parameters and their baseline are given in the bottom section. Sample size N=1,000
| Parameter PRCC\ | kA | kS | ||||||||||
|---|---|---|---|---|---|---|---|---|---|---|---|---|
| −0.1729* | −0.00528 | 0.80154* | 0.18144* | −0.07253 | 0.20407* | 0.49173* | −0.52758* | −0.10278* | −0.78239* | |||
| 0.020579 | 0.0075646 | 0.070054 | −0.3597* | 0.10876* | 0.7807* | 0.50005* | −0.53512* | −0.75044* | −0.018978 | |||
| −0.7744* | 0.46533* | −0.57433* | −0.1796* | −0.00057 | −0.2048* | −0.4793* | 0.47342* | 0.059092 | 0.76147* | |||
| 0.1729* | 0.0052741 | −0.80161* | −0.1813* | 0.072449 | −0.2041* | −0.4916* | 0.52752* | 0.1028* | 0.78229* | |||
| 0.010719 | 0.074714 | −0.12513* | −0.7772* | 0.50612* | −0.5741* | −0.5193* | 0.54164* | 0.76714* | 0.048074 | |||
| −0.02002 | −0.00911 | −0.068492 | 0.36309* | −0.1111* | −0.7817* | −0.4991* | 0.53405* | 0.74957* | 0.017652 | |||
| 0.049644 | 0.018687 | −0.15672* | 0.46955* | −0.1596* | 0.43147* | −0.7669* | 0.79434* | −0.4717* | 0.086851* | |||
| 0.18276* | −0.04124 | 0.35992* | −0.2870* | 0.16638* | −0.2802* | −0.7289* | 0.74531* | 0.30209* | −0.29729* | |||
| −0.7434* | 0.39779* | −0.56803* | 0.0011736 | −0.0973* | 0.011283 | 0.21576* | −0.3417* | −0.153* | 0.72428* | |||
| 0.31831* | −0.1142* | 0.37458* | 0.25515* | −0.0983* | 0.28612* | 0.76113* | −0.74089* | −0.26011* | −0.29607* | |||
| −0.0957* | 0.052003 | 0.7943* | 0.18035* | −0.0941* | 0.20344* | 0.51163* | −0.57419* | −0.23377* | −0.79328* | |||
| −0.05902 | 0.042032 | 0.079963 | −0.3192* | 0.19229* | 0.79541* | 0.50179* | −0.53937* | −0.78541* | −0.08746* | |||
| −0.7627* | 0.4346* | −0.5273* | −0.1342* | 0.080555 | −0.1812* | −0.4520* | 0.49314* | 0.16709* | 0.7501* | |||
| 0.09569* | −0.05200 | −0.7943* | −0.1804* | 0.094102* | −0.2034* | −0.5116* | 0.57419* | 0.23377* | 0.79328* | |||
| −0.0069902 | 0.029441 | −0.09863* | −0.7554* | 0.39215* | −0.5036* | −0.4751* | 0.53833* | 0.76449* | 0.084909* | |||
| 0.059063 | −0.04208 | −0.08003 | 0.31921* | −0.1922* | −0.7954* | −0.5018* | 0.53933* | 0.7854* | 0.087487* | |||
| 0.027078 | −0.02814 | −0.14102* | 0.44431* | −0.2073* | 0.41138* | −0.7209* | 0.73891* | −0.44816* | 0.09981* | |||
| 0.20613* | −0.00947 | 0.37094* | −0.3394* | 0.059121 | −0.2929* | −0.7040* | 0.71634* | 0.2946* | −0.20519* | |||
| −0.7693* | 0.4413* | −0.58403* | 0.10413* | 0.022208 | 0.057461 | 0.30526* | −0.19818* | −0.072403 | 0.7614* | |||
| 0.3298* | −0.1265* | 0.32721* | 0.29859* | −0.0845* | 0.30172* | 0.69989* | −0.68639* | −0.28617* | −0.29768* | |||
| −0.06058 | 0.021079 | 0.79409* | 0.13303* | −0.05288 | 0.15692* | 0.51481* | −0.51032* | −0.14253* | −0.79723* | |||
| −0.02573 | 0.015231 | 0.057667 | −0.3466* | 0.10537* | 0.77833* | 0.54221* | −0.49867* | −0.77457* | 0.027698 | |||
| −0.7438* | 0.45465* | −0.51868* | −0.1145* | 0.013037 | −0.1188* | −0.4586* | 0.40796* | 0.14928* | 0.72297* | |||
| 0.060584 | −0.02108 | −0.79409* | −0.1330* | 0.052881 | −0.1569* | −0.5148* | 0.51032* | 0.14253* | 0.79723* | |||
| −0.01623 | 0.047227 | −0.048689 | −0.7288* | 0.44912* | −0.5045* | −0.4846* | 0.48827* | 0.75175* | 0.047312 | |||
| 0.025733 | −0.01523 | −0.057667 | 0.34661* | −0.1054* | −0.7783* | −0.5422* | 0.49867* | 0.77457* | −0.027698 | |||
| 0.052049 | 0.0035282 | −0.11257* | 0.46297* | −0.2136* | 0.4128* | −0.7262* | 0.72664* | 0.28179* | −0.21633* | |||
| 0.15379* | −0.05348 | 0.40187* | −0.3081* | 0.097629* | −0.3228* | −0.7126* | 0.72664* | 0.28179* | −0.21633* | |||
| −0.7525* | 0.44568* | −0.58667* | 0.12295* | −0.1063* | 0.15357* | 0.20675* | −0.28872* | −0.09134* | 0.74252* | |||
| 0.32878* | −0.1312* | 0.32024* | 0.26107* | −0.07922 | 0.3040* | 0.69907* | −0.68866* | −0.3021* | −0.24846* | |||
| Minimum | 1.0 × 10⁻² | 1.0 × 10⁻⁴ | 1.0 × 10⁻⁴ | 1.0 × 10⁻⁵ | 1.0 × 10⁻⁴ | 1.0 × 10⁻⁴ | 1.0 × 10⁻⁴ | 1.0 × 10⁻⁴ | 1.0 × 10⁻⁵ | 1.0 × 10⁻⁵ | ||
| Baseline | 2.4 × 10⁻¹ | 3.96 × 10⁻¹ | 2.4 × 10⁻¹ | 1.2 × 10⁻² | 2.8 × 10⁻¹ | 1.0 × 10⁻¹ | 1.0 × 10⁻¹ | 9.6 × 10⁻¹ | 1.78 × 10⁻² | 1.3 × 10⁻² | ||
| Maximum | 1.0 × 101 | 1.0 × 101 | 1.0 × 101 | 1.0 × 100 | 1.0 × 101 | 1.0 × 101 | 1.0 × 101 | 1.0 × 101 | 1.0 × 100 | 1.0 × 100 | ||
Significant (p-value < 0.01)
bold was marked for its abs(PRCC)< 0.4
Fig. 10.
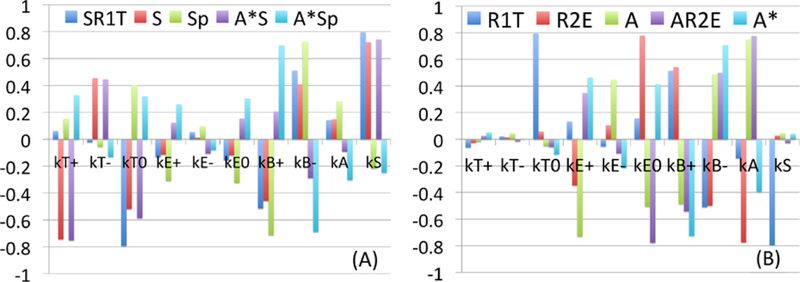
Sensitivity Analysis: General Latin Hypercube Sampling (LHS) scheme and Partial Rank Correlation Coefficient (PRCC) performed on the model. The reference outputs are the variables at the final time (t = 150). The y-value in subplots (A-B) indicates PRCC values of a first subset and the second subset for model parameters respectively. The analysis was carried out using the method of Marino et al. (2008) with sample size 1,000, and Matlab files available from http://malthus.micro.med.umich.edu/lab/usadata/
3. The Mathematical Model for Tumor Growth in a Duct
In addition to the biochemical feedback loops between stromal cells and ECs that are mediated via growth factors (cf. Fig. 2), mechanical properties of the stromal tissue may play a large role in the growth of ductal breast tumors. It is known that healthy breast ducts and the surrounding stromal tissue are sensitive to changes in compressive and tensile stresses to facilitate lactation, and it has been shown for other tumor types that the surrounding medium affects growth of tumor spheroids (Helmlinger et al. 1997; Cheng et al. 2009). Transformed mammary epithelial cells may also respond to stresses by increasing FGF and VEGF signaling to promote their proliferation and by increasing production of MMPs to promote invasion (Paszek and Weaver 2004).
The movements involved in growth, division, and deformation of the tissue are small and slow, and thus one can assume that the mechanical forces are balanced, i.e., there is no net force on cells or tissues. Furthermore, there will be little mechanical feedback on ECs and TECs from the surrounding tissue if the duct is not occluded, but after occlusion the surrounding tissue exerts a resistive force on the TECs that has been called the “reciprocal tissue resistance force” (Paszek and Weaver 2004). This force can have numerous effects, including an increase in the stiffness of the surrounding tissue (Krouskop et al. 1998) and reorganization of the ECM (Paszek and Weaver 2004). Under normal conditions the biochemical and mechanical factors in the ECs and stroma are balanced and proliferation is controlled, but perturbations in this homeostatic state may initiate malignant transformation (Paszek and Weaver 2004). For instance, it is known that a higher density of collagen in the ECM can promote cancer cell proliferation and invasiveness (Provenzano et al. 2009).
3.1. Properties of the Cell-Based Component of the Model
The original formulation of the hybrid model developed in Kim et al. (2007) described cells in the proliferating rim of a tumor spheroid using an individual-based model that took into account growth in response to nutrients and the effects of stress on that growth. Only actively dividing cells were treated individually, and when cells stopped dividing and left the proliferating zone due to a decrease in nutrients, the individual-based description used for their dynamics was replaced with a continuum description. However, ECs and TECs are far fewer in a cross-section of a duct than the cells in a tumor spheroid, and therefore we always use an individual-based model to describe them, as in I. Fibroblasts and myofibroblasts are also involved, but we do not treat their mechanical properties in detail—we simply treat them as point sources or sinks of growth factors in the ECM (cf. Fig. 11).
Fig. 11.
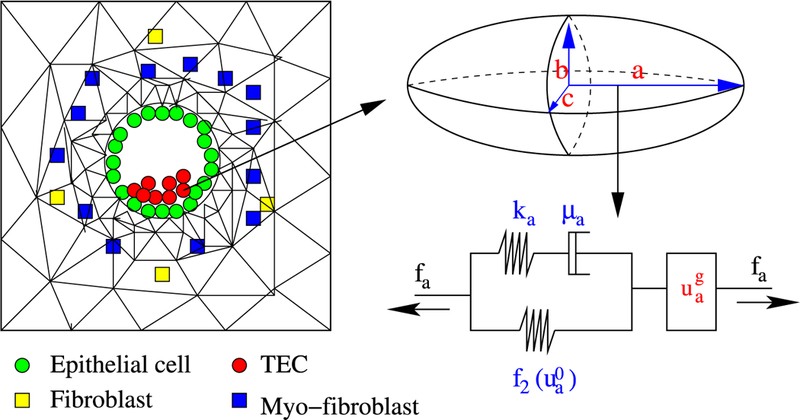
(Left) The model domain: fibroblasts, myofibroblasts, and TECs interact via EGF and TGF-β. (Right) Changes in the length of the a-axis of a cell (the ellipsoid) under a given stress (fa; arrow) consist of the passive change in the first component, and the change due to the growth (from Kim et al. 2011, with permission)
The temporal evolution of ECs and TECs is determined by growth and division, the effect of stress on growth, and the mechanical response of cells to forces on them (Kim et al. 2007). Both ECs and TECs are treated as oriented ellipsoids whose mechanical response is described by a Maxwell element in parallel with a nonlinear spring, while growth is described by an element in series with the passive response (cf. Fig. 11).
ECs play a major role in maintaining the structural integrity of a duct and only proliferate when necessary to maintain the integrity of the duct. Growth is affected by nutrients, stress levels, and other factors, and in the absence of nutrient or stress limitations, TECs grow to twice their intrinsic volume V0 and divide into two daughter cells. We assume herein that there is an adequate supply of nutrients, and thus there is no limitation on growth due to insufficient nutrients.
However, growth is affected by mechanical stress, and cells grow and divide so as to orient cell division in the direction of the minimum local force on the cell. In addition, growth stops when the tensile or compressive force is too large along an axis (cf. Fig. 12). Growth may also depend on other factors such as phosphorylated Smad (Sp), and here we assume that the level of Sp affects growth independently of stress. We thus use a multiplicative form of the growth rate function for the ith axis given by where the dependence of the growth rate on the stress σ acting on the cell is as shown in Fig. 12. The growth rate dependence on Smad (Sp) is given by the function where H is the Heaviside step function, and thus growth is turned off if either the stress or Sp is too large. The solution of the force balance equations, which involve adhesion forces, internal pressure, and other forces for each cell, determine the time-dependent dynamics of each cell. Both the mechanical and the growth elements are isotropic, and since the effect of stress is isotropic, cells relax to a spherical shape in the absence of external forces. The complete set of equations for the evolution of the shape of cells is given in Sect. 5.1, where active forces for invasion are included.
Fig. 12.
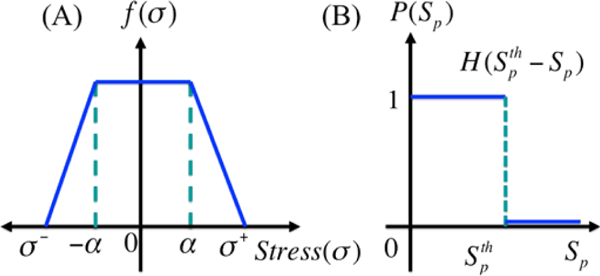
The growth rate function
3.2. The Model Equations for Continuum Constituents
The stromal region that borders the duct in Fig. 11 is treated as a continuum, and both the mechanical force balance and the reaction-diffusion equations governing the spatiotemporal evolution of the growth factors are partial differential equations. The former is derived and discussed in detail in Kim et al. (2007), where the rationale for the choice of constitutive equations and boundary conditions is given. At the boundary between the stroma and the duct, the interior and exterior forces are balanced, the former computed from the cell-based model and the latter from the continuum equations. As stated earlier, we do not incorporate transitions of cells from an individual-based to a continuum description here. We also first restrict attention to a two-dimensional spatial domain that corresponds to a cross-section of a duct.
The evolution of the concentration of EGF in the stromal tissue is affected by production by fibroblasts and myofibroblasts, first-order decay, and diffusion, whereas the concentration of TGF-β changes in response to production by TECs, first-order decay, and diffusion. Myofibroblasts in the stromal tissue can be in either an inactive state or an active state, and the transition between them occurs at a threshold level of TGF-β. The transition function for activation is where thT is a threshold, and activation occurs when an inactivated cell detects a TGF-β level above this threshold. Details of the underlying process are given later.
Both fibroblasts and myofibroblasts secrete EGF at a constant rate—higher for the latter than for the former, and in general both are randomly distributed initially and are mobile. However we assume here that (i) there is a fixed total number of fibroblasts and myofibroblasts at fixed locations in the computational domain, which includes the duct and a neighborhood of the duct, (ii) initially all myofibroblasts are inactive, and (iii) EC and TEC cells in the duct produce TGF-β, and move as a result of growth and division (in the case of TECs). This leads to the following equations for the concentration of EGF, and the concentration of TGF-β.
| (15) |
The diffusion coefficients DE and DT are space-dependent, and are the locations of TECs, fibroblasts, and myofibroblasts at time t, respectively. Nt, Nf, and Nm denote the number of ECs plus TECs, fibroblasts, and myofibroblasts, respectively, is the volume of the extracellular space, are the volumes of a fibroblast, myofibroblast, and an epithelial cell, respectively. are constant, but the volume of TECs is variable because they grow and divide. We have assumed that ECs and TECs secrete TGF-β at the same rate, and thus the only difference between ECs and TECs is that the latter grow and divide when the stress is sufficiently low and the pSmad level is below the threshold .
The force balance equations are solved using the finite element method based on the triangular mesh shown in Fig. 11. The reaction-diffusion equations (15) are solved on a regular grid using the alternating-direction implicit (ADI) method and the nonlinear solver nksol for algebraic systems. The spatial grid size used is on a square domain of 1 mm side length, and adaptive time stepping controlled by the number of iterations is used. When the growth factors have been computed at a fixed time, the level of pSmad at the ECs is checked to determine whether the cells on the duct wall are to be transformed to TECs, and the level of TGF-β at a myofibroblast site determines if it is to be activated. Since the stromal cells reside off-lattice, interpolation of the EGF and TGF-β concentrations to and from grid points to a cell is done as described in Dallon and Othmer (1997). The additional parameters used in the computations are given in Table 4.
Table 4.
Parameters used in the computations
| Parameter | Description | Value | References |
|---|---|---|---|
| Diffusion coefficients (cm2 s−l) | |||
| EGF in the surrounding tissue | 5.18 × 10⁻⁷ | (Thorne et al. 2004) | |
| EGF in the duct | l.66×l0−6 | (Thorne et al. 2004) | |
| EGF in the tumor | 1.0 × 10⁻⁷ | This work | |
| TGF-β in surrounding tissue | 1.8 × 10⁻⁷ | (Brown 1999; Koka et al. 1995; Woodcock et al. 1993) | |
| TGF-β in the duct | 3.6 × 10⁻⁷ | This work | |
| TGF-β in the tumor | 1.0 × 10⁻⁷ | This work | |
| Production rates | |||
| Production rate of EGF from fibroblasts | 1 × l0−6-5 × 10⁻⁴ pg/(cell h) | (Danielsen and Rofstad 1998) | |
| 1 × 10⁻⁶ | This work | ||
| Production rate of EGF from myofibroblasts | 2.09 × 10⁻⁶ pg/(cell h) | This work | |
| Production rate of TGF-p from TECs | 3.86×l0−5 pg/(cells h) | (Wakefield et al. 1987), this work | |
| Decay rates | |||
| dE | EGF | 3.6 × 10⁻³ h−1 | (Kudlowetal. 1986), this work |
| dT | TGF-ß | = dE | This work |
| Threshold values | |||
| thT | Threshold TGF-p value for activation of myofibroblasts | 0.7567 nM | (Kunz-Schughart et al. 2003), this work |
| Threshold pSmad value for activation of TECs | 5.8 nM | This work | |
| Cell properties | |||
| Nf | # of fibroblasts | 3 | This work |
| Nm | # of myofibroblasts | l3 | This work |
| Volume of a fibroblast | 905 μm3 | This work | |
| Volume of a myofibroblast | 905 μm3 | This work | |
| Volume of an EC or a TEC | Variable ((524–1047) μm3) | This work | |
4. Computational Results for Preinvasion Tumor Growth
Four major types of histological patterns of ductal carcinomas that are observed experimentally, and shown in Fig. 13, are called Micropapillary (B, E) (Chivukula et al. 2009; Burrai et al. 2010), Apocrine (C) (Wells and El-Ayat 2007), Cribriform (D) (Burrai et al. 2010), and Solid (F) (Burrai et al. 2010), respectively. In order to understand the origin of these different forms, we first study tumor growth in a duct in the absence of paracrine signaling to determine the stand-alone growth patterns of TECs. We then introduce signaling between ECs, TECs, and stromal cells to understand how these interactions can regulate both the conversion of ECs into TECs and the growth of TECs. Following that, we study the effect of stiffening of the ECM when that affects the diffusion of growth factors. The simulations are all done in a two-dimensional cross section, first in a transverse slice to study occlusion of a crosssection (cf. Figs. 14-19) and then in a longitudinal direction (cf. Fig. 20). 3D hybrid simulations planned for the future will reveal more realistic patterns of intraductal microarchitectures.
Fig. 13.
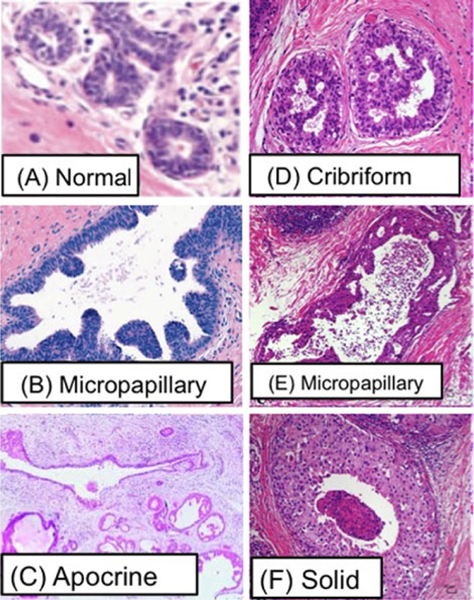
Reported patterns of DCIS. (A) Normal (Wells and El-Ayat 2007), (B) Micropapillary (Chivukula et al. 2009), (C) Apocrine (Wells and El-Ayat 2007), (D) Cribriform (Burrai et al. 2010), (E) Micropapillary (Burrai et al. 2010), (F) Solid (Burrai et al. 2010)
Fig. 14.
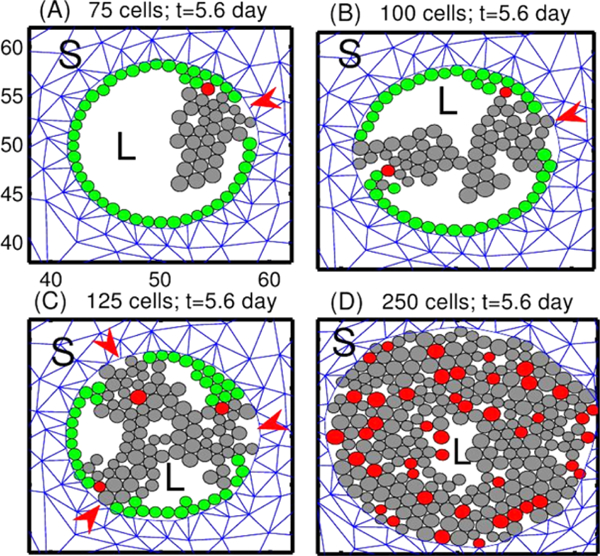
Tumor growth patterns under fixed levels of growth factors. TECs begin to grow from one, two, three or all peripheral ECs, in (A), (B), (C), and (D), resp. Red arrowheads in (A–C) indicate the initial location of TECs. Green circles are non-proliferating ECs, and red circles are the initial TECs that generate the lineage of proliferating TECs (gray circles). L = lumen in the duct structure. S = stromal tissue. The scales of x-axis and y-axis in subplots (B-D) are same as those in the subplot (A)
Fig. 19.
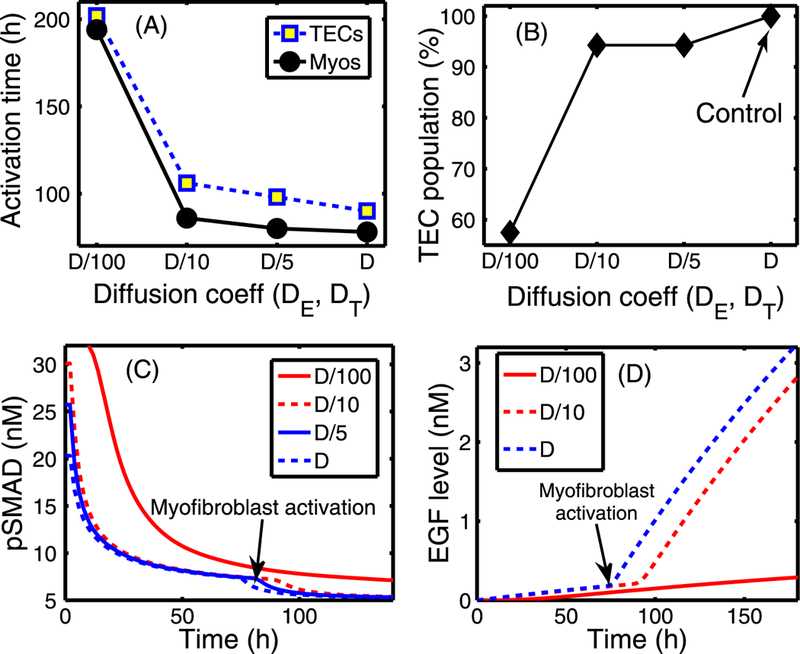
The effect of changing the diffusion coefficients of EGF (DE) and TGF-β (DT). (A) Activation time of TECs and myofibroblasts as a function of diffusion coefficients (De, DT) of regulating molecules (EGF and TGF-β). The diffusion coefficients of both EGF and TGF-β were reduced by 5-, 10-, and 100-fold compared to the control case. There are delays in activation of TECs and myofibroblasts when the diffusion coefficients are reduced. (B) The TEC population at day 10 compared to the control (arrow). (C) The time course of pSmad concentration at one EC near (0.4, 0.5) for the four cases of decreased diffusion coefficients considered. Myofibroblasts are activated (arrow) around 194, 86, 80, 78 h, respectively, when TGF-β reaches the threshold, and the pSmad level decreases slowly for smaller values of the diffusion coefficients, leading to a delay of the TEC activation time. For instance TEC is activated around 106 h in the case of 10-fold reduction relative to 90 h in the control case. (D) Initially slow increase of EGF concentration at (0.42, 0.5) near breast duct membrane begins to accelerate (arrow) when myofibroblasts are activated at t = 78, 80, 86 h for relatively smaller reductions of the diffusion coefficients (D, D/5 ,D/10), respectively. However, myofibroblasts are activated at a much later time (194 h) for the significantly stiffened tissue (very small diffusion, D/100)
Fig. 20.
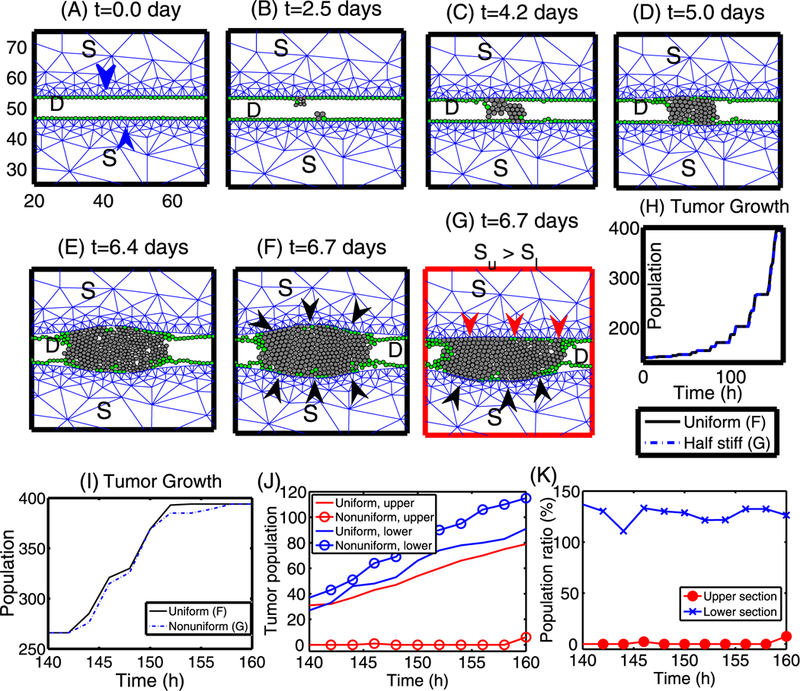
Growth patterns and the effect of stiffer stromal tissue on tumor growth in the longitudinal direction. (A–F) The time course of tumor growth that originates from two cells (one TEC in the upper stroma and another one in the lower stroma; marked in blue arrowheads). Green circles represent ECs, and TECs are represented by gray circles. TECs initially grow in the radial direction until they feel reciprocal resistance (black arrowheads in (F)) from the upper and lower stroma. Then these cells reorganize to grow in the longitudinal direction. (G) The upper stromal tissue has a larger stiffness (Su) than the lower stromal tissue (Sl), and proliferating TECs feel a larger mechanical resistance from the upper stroma (red arrowheads) compared to the reciprocal stromal resistance from the lower stroma (black arrowheads). In general, TECs grow in the longitudinal direction but generate a bulb shape in the less stiff (lower) stromal direction. (H) The time course of the tumor population for the cases of uniform stiffness (solid black line; (F)) and different stiffness (dotted blue line; (G)). (I) Closer look of population evolution from (H). Overall growth patterns in both cases look similar to each other. Frames in panels (B–G) are same as in (A). D = breast duct, S = stromal tissue. (J) Tumor population in upper and lower bulge areas, respectively (y value of center of cells > 54 and < 46, respectively). (K) population ratio (= (population in nonuniform case)/(population in uniform case) in percentage (%)) of tumor population in upper and lower sections in (J), respectively
4.1. Growth in the Absence of Paracrine Signaling
As a first step, we simply specify the location of TECs and follow their evolution. In Fig. 14, we show the different growth patterns generated by different sites of initiation of TECs along the periphery of the duct. TECs (gray circles) begin to grow from one, two, three, and all cells on the periphery of the duct in Figs. 14(A), (B), (C), (D), respectively. Even though the patterns in the four cases (Fig. 14) appear different at intermediate stages of development, all tumors eventually merge to a solid pattern and continue to grow outward against the resistance of the stroma. Our simulations show that the cribriform pattern in Fig. 14(C) at the relatively early stage (days 5–7) later turns into the solid pattern (after day 10) (data not shown; similar to Fig. 14(D)). Thus, the distinct patterns may simply be transient patterns enroute to complete occlusion of the duct, after which the stresses from the surrounding stroma play a large part in the further growth of the tumor. We also found different patterns when we change certain mechanical or biochemical properties, such as the adhesion strength between cells or between cells and the basal membrane, but again, occlusion was the end result (data not shown).
Despite their long-time similarity, the evolving patterns in the duct are significantly different from one another, depending on the number and locations (red arrowheads in (A–C)) of the initiating TECs. When two or three TECs initiate the growth, most of those TECs grow centripetally and eventually form a “bridge” between two growing tumor masses. Most of the ECs (green circles) remain adherent to the basal membrane on the periphery of the duct in (A–C), while future generations of TECs are displaced toward the center of the duct. After bridging, they continue to proliferate until the lumen is filled with TECs (similar to panel (D)). When only a few TECs are initiated the stress within a lineage is small, except at the site of initiation, and the effect of stress on growth is small. The stress is larger at initiation sites and proliferating TECs there are subject to the reciprocal resistance force from stromal tissue in their neighborhood, which slows their growth. In Fig. 14(D), all ECs are transformed to TECs initially, and all cells are competing for space. Therefore, there is a larger effect of growth on all cells, except for those at the leading edge. For the parameters used here, growth of the mass is mainly driven by cells at the leading edge and by cells at the basement membrane. This leads to an increase in the radius of the duct and a larger population of TECs at occlusion in (D), compared with (A–C), due to the larger number of TECs initially.
The trajectories of four TECs in the initial population in Fig. 14(D) are shown in Fig. 15(A), selected as shown in Fig. 15(B). While all activated TECs were initially at the periphery of the duct, some of them are displaced toward the center of the duct as growth proceeds, as can be seen in Fig. 14(D). Of the four cell tracks shown, one remains close to the periphery of the duct, but the other three cells are displaced toward the center of the duct.
Fig. 15.
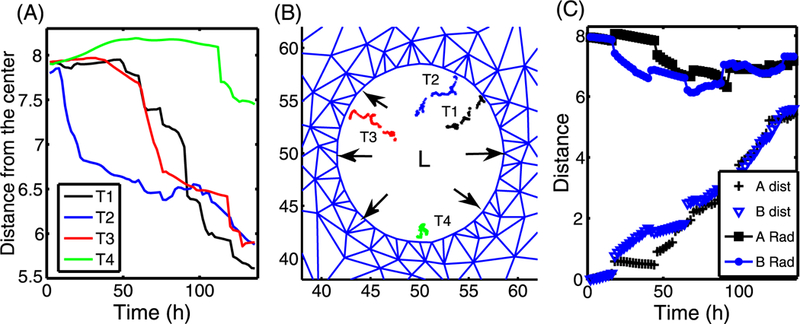
(A) The time course of the distance between the present position on the trajectories in (B) and the center (50, 50) of the lumen (L). (B) The four trajectories (T 1, T 2, T 3, T 4) of four TECs (red cells in Fig. 14(D)) were marked in black, blue, red, and green dots, respectively. Black arrows indicate the forces acting on the wall due to expansion of the growing tumor. (C) The time courses of the distance from the center (A Rad; B Rad) of red cells in the upper right corner in Fig. 14(A–B), and the total distance traveled between the current position and the initial position
Since all ECs along the periphery of the duct became TECs, local deformation (black arrows in Fig. 15(B)) occurs along the entire periphery of the duct due to stress from the growing tumor. In this case, leading cells do not feel mechanical pressure from neighboring cells and grow faster. However, TECs near the interface between the stroma and the duct will “feel” pressure from vigorously growing cells in the neighborhood and the reciprocal pressure from tissue resistance, and thus are in a relatively harsh microenvironment. A comparison of the radial and total distance traveled by two cells (red cells in Figs. 14(A–B)) is shown in Fig. 15(C).
4.2. Growth in the Presence of Paracrine Signaling
Next, we study the effect of paracrine signaling on the growth of a tumor. In Fig. 16, we show the evolution of tumor growth when there are no activated TECs initially, but some develop as a result of signaling between ECs and stromal cells. Initially, there are only three actively-signaling fibroblasts placed symmetrically in the computational domain (blue squares in Figs. 16(A–C)), and these serve as fixed sources of EGF in the simulation. We assume that some non-signaling fibroblasts become activated to myofibroblasts (red squares in Figs. 16(B–C)) when the level of TGF-β secreted by tumor cells exceeds a threshold (thT). This is an idealization of the more general scenario in which some fibroblasts remain as fibroblasts and others transform into myofibroblasts in the presence of the appropriate signal. In general, the activation process is initiated by an increase in the level of TGF-β signaling by ECs, which in turn triggers fibroblasts to proliferate more rapidly, followed by differentiation of some fibroblasts into myofibroblasts. Here, we simply assume that a silent fibroblast differentiates when the TGF-β level exceeds a threshold (thT = 0.757 nM) in the stromal tissue. In general, myofibroblasts can move toward the reactive periphery and thereby strengthen signaling, but for simplicity we fix the cells in space.
Fig. 16.
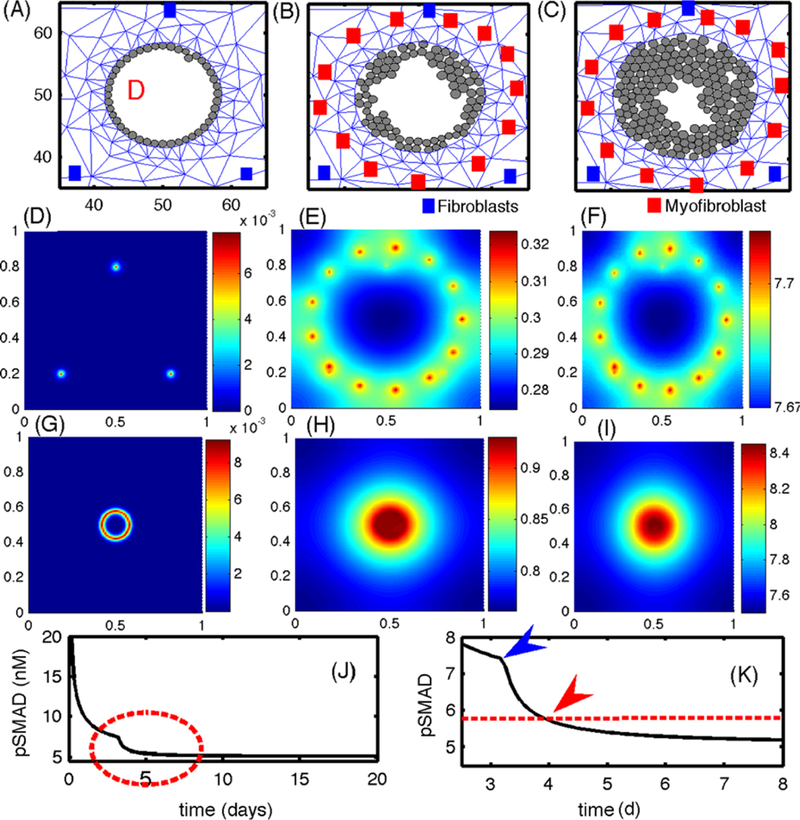
(A–C) The growth pattern of TECs in the presence of paracrine signaling. The upper panels show the evolution of TECs (gray circles) and the stromal mesh at 92 h (A), 240 h (B), 420 h (C). Initially, ECs produce more TGF-β, which stimulates EGF production in the fibroblasts, and this in turn leads to activated TECs that begin to grow when pSmad values drop below the threshold (~90 h). The locations of fibroblasts and myofibroblasts are indicated by blue and red squares, respectively. Myofibroblasts are activated when the TGF-β level exceeds thT = 0.7567 nM (~76 h). (D-I) The concentrations (in nM) of EGF (D-F) and TGF-β (G-I), on the dimensionless domain [0, 1]2 at time t = 4 h (D, G), 82 h (E, H), 480 h (F, I). (J) The temporal evolution of the pSmad concentration at one TEC site. (K) An enlarged portion of (J) corresponding to the red dotted circle in (J). The pSmad level drops significantly when myofibroblasts are activated in the neighborhood (blue arrowhead). A transition from an EC to a TEC (red arrowhead) occurs when the pSmad level drops below the threshold ( red dotted line)
The increased level of EGF due to production by myofibroblasts, which become activated at about 76 h, leads to the activation of ECs into TECs when the pSmad level at the EC site drops below the threshold at about 90 h, and these new TECs grow inward in the duct. This positive feedback between the fibroblasts/myofibroblasts and TECs continues, and the expanding tumor exerts force on the breast duct wall, which generates a reactive force from the viscoelastic stroma. Despite the fact that we do not consider longitudinal growth in this simulation, our model shows the importance of the TEC-stroma interaction in the initiation and early enhancement of TEC growth inside the duct. Figures 16(D–F) and (G–I) show the concentrations of EGF and TGF-β at t = 4 h, 82 h, and 480 h, respectively. Initial conditions for EGF and TGF-β were 0.3 nM, and 300 pM, respectively. The early high level of EGF at three cells (Fig. 16(D); t = 4 h) later evolves into many localized peaks at the sites of fibroblasts/myofibroblasts at t = 82 h and 480 h (Figs. 16(E) and (F)). This occurs in response to elevated values of TGF-β at these locations that has diffused outward from TGF-β-secreting ECs and TECs. The EGF released in the stroma diffuses toward the duct and activates ECs. In the early stages of the simulations, when ECs are not yet activated, TGF-β is localized at the duct periphery (Fig. 16(G)) and diffuses into the surrounding stroma. Later the highest levels of TGF-β are concentrated in the duct interior following transformation of ECs to TECs (after t = 96 h) and increased TGF-β secretion within the duct (Fig. 16(I)). Figure 16(J) shows the time course of the pSmad level for one cell, with a blowup of the time interval surrounding the transition time shown in Fig. 16(K). The pSmad level for this cell decreases quickly due to the emergence of myofibroblasts (blue arrowhead in (K)), which have a higher EGF production rate around t = 76 h, and reaches the threshold value (red arrowhead in (K)) for transformation of that EC into a TEC around t = 90 h. Similar profiles of pSmad levels are observed for all TECs. Thus, the presence of myofibroblasts plays an important role in activating ECs to TECs, since fibroblasts alone are not enough to achieve this (data not shown). Even though we made the reasonable assumption that pSmad acts as a switch for proliferation, it is not clear whether this reflects reality, since other factors such as competition for nutrients or variable thresholds for activation may play a role. It may be that only a few activated ECs are necessary to produce a full-fledged tumor.
4.3. The Effect of Changing Diffusion Coefficients
The diffusion of the growth factors in the stromal tissue plays a vital role in closing the paracrine feedback loop. Slow diffusion would reduce the level of signaling molecules and reduce the number of activated myofibroblasts, thereby reducing the strength of the feedback between these cells and TECs and the rate of activation of ECs. Figure 17 shows the effect of EGF diffusion on TEC activation and tumor growth when a signaling fibroblast is placed at x = 50 on the upper boundary. In all three cases, waves of activated TECs (red circles) move toward the lower section of the wall on either side (left and right half wall) until all ECs are activated. The boundaries between ECs and activated TECs were marked in black arrowheads in Fig. 17(B). However, the speeds of these TEC activations are different for three cases. Figure 17(E) shows the number of activated TECs as a function of time for three cases. In the case of the slower diffusion of EGF (DE/100), ECs get activated at a slower rate (DE/100; red dotted) relative to the control case (DE; black solid), leading to slower growth (see Fig. 17(I)). Figures 17(M-N) illustrate different activation times for those three cases at a cell in the northern (marked “N” in (A)) and western (marked “W” in (A)) sectors of the duct, respectively. One can see that it takes longer for the pSmad level to drop below the threshold value to convert an EC to a TEC when the diffusion coefficient of EGF is smaller (DE/100). However, those ECs (N, W) are activated rather quickly for faster drop of the pSmad level due to the fast diffusion of EGF in the case of the control case (DE). In the case of slower diffusion of EGF (DE/100) in (J–L), ECs on the wall get activated over a larger span of the period (~38 h) due to slower diffusion of EGF, and activated TECs in the upper section of the wall begin to grow earlier than TECs in the lower section of the wall. This leads to a directional bias (black arrows in (K)) of growth. Eventually, the size of the cell aggregate in the upper section of the duct is larger than in the lower section of the duct in (L). In this case, growing cell aggregates in the upper section of the wall generate active mechanical interactions among cells and between a TEC and stromal tissue, and some of TECs loose adhesion to the basal membrane and are pushed toward the lumen (blue arrowheads in (K)). These cells then have more free space to grow without any stress and become a source of faster growth in the upper section of the duct. Figure 17(O) shows the time evolution of population ratios (north:south) for the three cases. In the case of slower delivery of EGF (DE/100), the cell population in the north side of the duct is much larger than the population in the south until all population start to fill up the duct and the ratio becomes 1. In terms of therapy, this implies that slowing down the diffusion of EGF would lead to slower activation of ECs and slower growth of the tumor mass. Furthermore, if the fibroblasts are highly localized rather than being widely distributed, it will lead to localization of the tumor mass close to the location of the EGF sources.
Fig. 17.
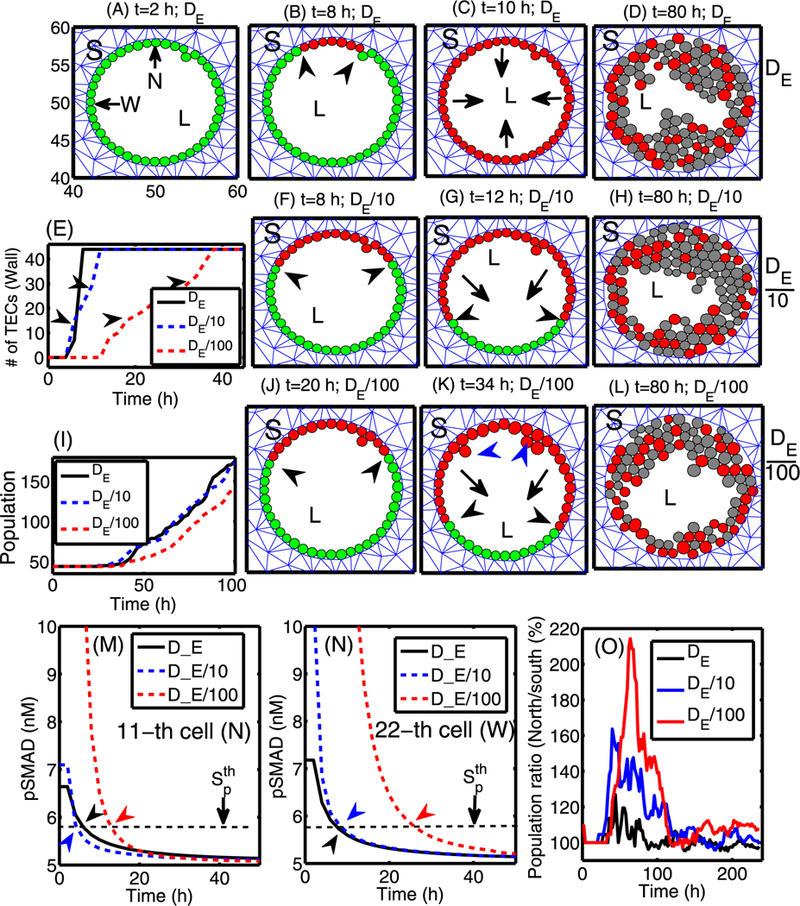
The effect of varying the diffusion coefficient of EGF when a signaling fibroblast is located at the midline of the upper boundary. (A–D) Profiles of TECs within the duct for the base diffusion coefficient (DE) of EGF at time t = 2, 8, 10, 80 h. Here all ECs on the wall are activated within 10 h, and TECs grow inward without a directional bias. (F–L) Profiles of TECs within the duct for 10- (in (F–H)) and 100-fold (in (J–L)) smaller diffusion coefficients of EGF (DE/ 10, DE/100) at time t = 8, 12, 80 h and t = 20, 34, 80 h, respectively. Lower diffusion coefficients lead to larger cell aggregates in the upper section of the duct where ECs are activated earlier. (E) The number of “activated” TECs on the periphery as a function of time showing that the slower diffusion of EGF leads to slower activation of TECs. (I) The time course of the tumor population for the three cases. Tumors with lower EGF diffusion coefficient (DE/100) grow more slowly due to slow activation of TECs. (M–N) The time course of pSmad levels for three cases at the north (11th cell; marked in ‘N’ in (A)) and west (22nd cell; marked in ‘ W’ in (A)) locations, respectively. (O) The ratio of the cell populations in the north (PN) and south (PS) section of the duct for those three cases in percentage (%): Pn * 100/Ps. S = stroma, L = Lumen
Figures 18(A–C) show the time course of the EGF concentration for slow diffusion (DE/100). The profiles of EGF concentration for the other two cases (DE,DE/10) are similar to this case, but with different peak values at the location of fibroblast/myofibroblast aggregates in the center-north region. In contrast to the localized EGF concentrations at the fibroblast source locations in (A–C), accumulation of TGF-β at the center of the domain (0.5, 0.5) is shown Figs. 18(D–F). The TGF-β diffuses radially toward the stroma from the center. The pSmad levels for all cells on the periphery of the duct in response to these rising EGF and TGF-β levels are shown in Figs. 18(I–K). The distribution of the pSmad level is symmetric around the EC cell closest to the EGF source. This cell detects a higher concentration, its pSmad level is low, and in general, the pSmad levels increase, the farther the cell is from the source of EGF. At t = 20 h, the pSmad levels for some cells drop below the threshold value so that the corresponding cells are activated and become TECs. The pSmad levels of some other cells in the south are still above the threshold, maintaining their EC status without transformation to a TEC. At t = 34 h, additional cells along the periphery of the ring (duct) have been activated (Fig. 18(K)) to become TECs as the pSmad levels decrease due to increasing EGF levels (C). Figure 18(G) shows the EGF levels at the location of a cell in the north section of the duct (marked in ‘N’ in the previous (A)) for the three different diffusion coefficients (De, De/10, De/100). As the diffusion coefficient of EGF is decreased, the EGF levels at the cell site are decreased, leading to a delay of activation of the EC into a TEC. Figure 18(H) also shows the lower levels of EGF, followed by a delay of the activation, for smaller diffusion coefficients at the location of a cell in the middle section of the duct (marked in ‘W’ in the previous (A)). To determine the EGF level at the cell site, the EGF level at the closest computation grid point was taken for both (G) and (H). All the peak values of EGF occur at the same spatial location on the simulation grid for different diffusion coefficients. These results imply that TEC activation in the duct may be delayed by decreasing transport speeds of EGF via diffusion.
Fig. 18.
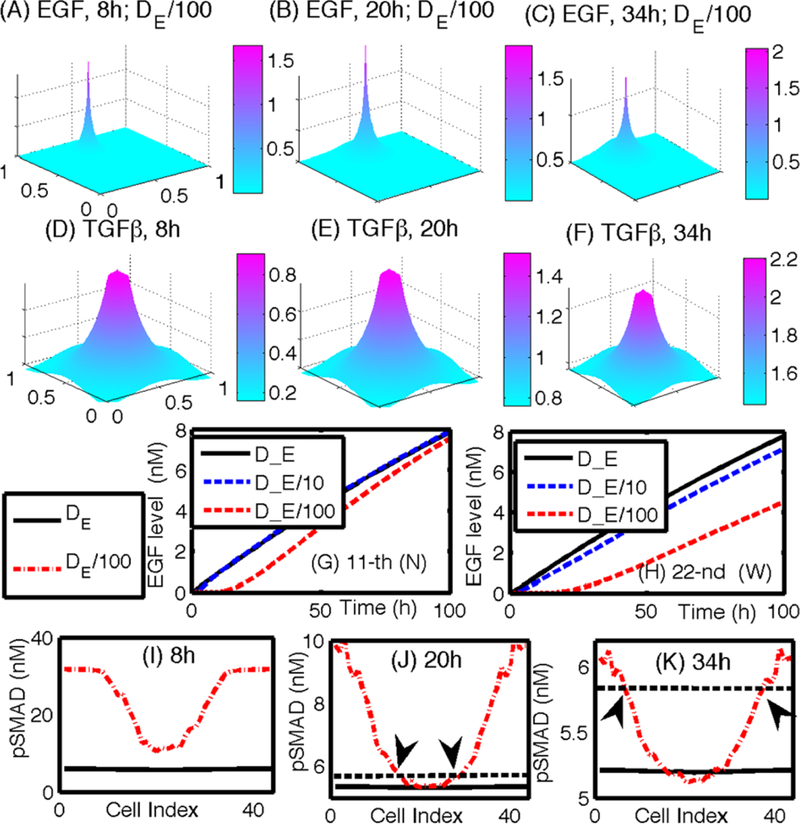
(A–C) Profiles of EGF concentrations at t = 8,20,34 h for the slow diffusion case (De/100). The peak point in panels (A–C) indicate the location of fibroblasts/myofibroblasts. (D–F) Profiles of TGF-β concentrations at t = 8, 20, 34 h. (G–H) A time course of the EGF level at the 11th (G) and 22nd (H) cell site (N) for various diffusion coefficients of EGF (DE, DE/10, DE/100). (I–K) pSmad levels at t = 8, 20, 34 h for three cases at the north (11th cell; marked in ‘N’ in (A)) and west (22nd cell; marked in ‘ W’ in (A)) locations, respectively. Black arrows in (J) and (K) indicate the cells at the interface between ECs and activated TECs in Figs. 17(J) and (K), respectively
4.4. The Effect of the Stiffness of the Stromal Tissue
Another factor that can affect tumor growth is the stiffness of the stromal tissue, not only in regard to its effect on the diffusion coefficients, but also in regard to its effect on the reciprocal tissue resistance. In Fig. 19, we show results of tests in which the diffusion coefficients of both EGF and TGF-β are decreased, by factors of 5, 10, and 100 from the control case, which simulates the effect that a different composition of the stroma, especially from stiffened tissue, may have in affecting the tumor microenvironment. The TEC population at the final simulation time (t = 10 days) is reduced by 43 %, 6 %, and 6 % for a 100-,10-, and 5-fold rate decrease, respectively, when compared to the control (see Fig. 19(B)). This reduction is due to delays in activation of both TECs and myofibroblasts due to the slower transport of EGF and TGF-β. This is seen in Fig. 19(D), which shows that slower transport of these molecules results in a slower increase in EGF level, and this in turn leads to a slower decrease in the pSmad level at the TEC site. To illustrate this point,we chose an epithelial cell near (0.42, 0.5) and displayed the time evolution of pSmad in this cell in Fig. 19(C), and the EGF level at this location (see Fig. 19(D)). One also sees a much higher pSmad level in Fig. 19(C) and a much slower increase of EGF in Fig. 19(D) for very slow diffusion (D/100; 100-fold reduction).
In Figs. 20(A-F), we show the time course of tumor growth in the longitudinal direction. At the beginning of the simulation, two cells from the upper and lower section of the stroma begin to grow inward (toward the center of the duct (D)) due to the availability of space and mechanical resistance from the surrounding stroma. Once those clones fill up the duct, those cells with free space at either end (west and east) of the cell aggregates still can grow in the longitudinal direction without feeling any “resistance,” which leads to faster growth of those cells. However, the growth of those TECs at the center of the aggregate and ones near the interface between cells and stroma is affected by the stress, and as in the case of tumor growth in the radial direction, TECs in the neighborhood of the initial TEC are trapped between stroma and neighboring TECs and have to overcome the reciprocal resistance force from the stroma and the neighboring cells for further growth. Therefore, those “trapped” cells grow at a slower rate. It should be noted that ECs lose strong adhesion to the basal membrane as time evolves, and many of them are pushed away toward the both ends of the tumor aggregate because of mechanical perturbations in the course of expansion of tumor cells. However, this may depend on the strength of EC adhesion to the basal membrane relative to mechanical stress acting on them. As observed earlier, a variety of stromal components can contribute to the stiffening of stromal tissue, including reorganization of collagen fibrils by myofibroblasts (Paszek and Weaver 2004) and local stiffening after TEC transformation (Krouskop et al. 1998). Furthermore, an increase of the reactive force due to the growth of TECs may then lead to tumor invasion in later stages (Paszek and Weaver 2004). In Fig. 20(G), we show the effect of stress on TEC growth in a longitudinal cross-section of a duct. Two activated TECs grow in the longitudinal direction in the face of resistance from stromal tissue above (stiffer) and below (more compliant). Due to the stiffer stromal tissue above the growth is confined to the longitudinal direction, whereas when the stroma is more compliant the growing tumor forms a bulge. In any case, the TECs grow inward first to fill up the duct, as in the case of growth patterns in the radial direction in Fig. 14. Once the space is filled near the origin of TECs, TECs begin to feel a reciprocal tissue resistance force from the surrounding stromal tissue and tend to grow in the longitudinal direction, i.e., in the direction of less stress. This is qualitatively consistent with experimental results described earlier on anisotropic growth (Helmlinger et al. 1997; Cheng et al. 2009). Figure 20(H) shows the time course of the tumor population for both cases in (F) and (G) above. Examination of the growth curves in Fig. 20(I) suggests that the growth patterns in both cases are very similar, except for some minor differences over the short interval t = 152–158 h. While more TECs localized in the upper stroma in (F), growth of TECs in (G) toward the upper stroma is restricted due to stiffer tissue, and instead they spread toward the empty duct space in the longitudinal direction.
Figure 20(J) shows the time course of tumor populations in the upper (y value of cell location >54) and lower (y value of cell location <46) bulge sections near the stroma-duct interface for the case of uniform and nonuniform stiffness in (F) and (G) above. While the tumor populations in the upper and lower sections are similar when stromal tissue with uniform stiffness is present, the tumor population in the upper section (red circle) is reduced compared with the population in the lower section (blue circle) when the stiffer stromal tissue is present in the upper section. The relative ratios of tumor population in the nonuniform case to the uniform case are shown in Fig. 20(K) in the upper (red circle) and lower (blue x) sections, respectively. A heavy suppression (~0 %) of bulging in the upper section is shown (red circle) for stiffer tissue but this instead pushes more cells (~140 %) back down to the lower section (blue x) where soft tissue will allow more bulging.
5. Breakdown of the Basement Membrane and Invasion
In an intact epithelial layer, cell-cell interactions modulated by cadherins are essential for maintaining the integrity of the layer. The first stage of single-cell invasion from the duct into the surrounding stroma involves loss of connections with neighboring cells and reorganization of the cytoskeleton, as well as changes in other attributes that characterize migratory cells. The sum of the genetic and epigenetic changes involved characterizes the epithelial-mesenchymal transition (EMT), but certainly not all cells in a migrating mass have to undergo this transition. Cells invade the stroma either as individuals or as small groups of cells, and may secrete enzymes that degrade the ECM to facilitate passage of cells. Migration to nearby blood vessels may involve chemotaxis to attractants released by nearby stromal cells in response to stimuli from the tumor. It is known that in breast cancer, macrophages are recruited to the tumor by expression of tumor-derived chemotactic signals, where they stimulate tumor cell migration and invasion by secretion of chemotactic signals such as EGF. However, such details are left for future extensions of the model.
In this section, we develop a mathematical model for the early stage of tumor invasion into the stroma. The major addition to the models used in previous sections is the addition of an active motive force for certain cells, reaction-diffusion equations that govern chemical exchange of proteinases (MMPs) between tumor cells in the duct and fibroblasts/myofibroblasts in stromal tissue, and evolution of the ECM. The cell mechanics of tumor cells within the duct and viscoelastic continuum describes the movement of the tumor cells in response to signals from stromal cells. The goal of the invasion model is to determine the key regulating mechanism behind this critical event of cell invasion through the tight building blocks, i.e., layers of epithelial cells, myoepithelial cells, and basal membrane. We test our model to determine if this invasion contributes to a typical switching behavior of certain molecules, for example, through a threshold of proteinase levels localized near invasive cells and basal membrane.
5.1. The Cell-Based Model
We extend the cell-based model used in previous sections in order to describe the active cell movement involved in invasion of the stroma. Previously, we only incorporated passive interactions between cells, but we now include active force generation by activated TECs to describe invasion. In the original formulation of the cell-based model (Palsson and Othmer 2000; Dallon and Othmer 2004), the active force exerted by a cell in the interior of an aggregate is exerted on the neighboring cell whose center is closest to the line in the direction of desired motion. Here, we develop a simplified description, in which we assume that only the cells at the leading edge of the invasive front can generate the active force for migration, and cells behind the front passively follow a tunnel created by the leading cells, which they can enlarge by secreting proteolytic enzymes. Cells at the leading edge do not depend on neighboring cells for active migration—they transmit the active force directly to the substrate. The model can easily be extended to incorporate active forces generated by all cells, but under normal conditions the cells in the interior of an aggregate do no useful work toward moving the aggregate if they cannot connect to the surrounding medium (Dallon and Othmer 2004). Thus, in the current model a combination of active movement by the leading-edge cells and passive growth produces the collective motion. A schematic of the invasion process in early stages is shown in Fig. 21. Movement of fully-detached aggregates through the stroma, which may occur later, will be studied elsewhere.
Fig. 21.
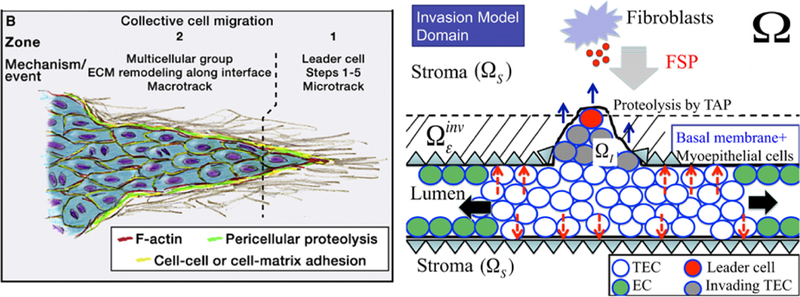
(Left) A schematic of collective cell migration in a tissue (from Friedl and Alexander 2011 with permission). (Right) A schematic of the invasion model used in the computations. In response to diffusing FSP, a TEC becomes activated (large red circle) and begins to form a microtrack for the invading front by proteolysis of the stromal tissue The follower cells (gray circles) create the macrotrack by proteolyt-ically degrading the ECM. Those two cell types show collective migration (blue arrows) in the invasion region and have to penetrate the initial barrier (basal membrane + layer of myoepithelial cells; ) and invade the stromal tissue (). TECs inside the duct preferentially grow in the longitudinal direction due to low resistive forces (black arrows). Mechanical forces acting on the intact wall are marked as red dashed arrows. Myoepithelial cells are not modeled specifically but rather are included in the continuum region
In view of these assumptions, the force balance on leading edge cells involves the reaction to the active force adhesion forces between cells the drag due to the fluid acting on the cell, internal forces (Rj, i), and the passive reactive force due to cell-cell and cell-stroma deformation Since movement is slow we neglect acceleration and, therefore, Newton’s law for the ith cell at the leading edge reduces to
| (16) |
Here, is the velocity of cell i, μcell (resp., μs, μf) is the frictional coefficient between the cells (resp., between the substrate and the cells, and the fluid viscosity), and In addition, are the areas of contact regions between cell i and cell j, cell i and the interstitial fluid or matrix, and cell i and the substrate at time t, respectively, is the total area of an undeformed cell, and denotes cells that are within a defined neighborhood of cell i. Numerical integration of Eq. (16) yields the trajectory of cell i. For further details concerning the definition and representation of the forces, see Dallon and Othmer (2004) and Kim et al. (2007).
In collective migration of tumor cells that penetrate the basal membrane, the leading-edge cells create a proteolytic microtrack of locally-degraded ECM (Zone 1 in Fig. 21(left)) (Friedl and Alexander 2011). This microtrack is then widened by following cells, both through mechanical force and proteolysis, leading to a larger macrotrack (Zone 2 in Fig. 21 (left)) (Ilina et al. 2011; Wolf et al. 2007; Friedl and Alexander 2011). This ECM degradation through active proteolysis creates a new boundary between the continuum region and cell-invasion region. We assume that a TEC is activated for invasion (i.e., undergoes the EMT) when the level of the fibroblast-secreted protease (FSP) in the stromal tissue exceeds a threshold. We also assume that cells at the leading edge initially degrade a section of the basal membrane by secreting tumor-associated protease (TAP), and that the initial movement is in the direction normal to the membrane so long as they remain within the strip defined by the basal membrane. We describe this strip mathematically as
| (17) |
where ε is a small quantity of the order of a few cell diameters, and is the stromal tissue (cf. Fig. 21 (right)). When an actively migrating cell leaves this strip, it can respond to many signals, including chemotactic attractants, haptotactic signals, or any signals from interactions with other stromal cells such as macrophages. We do not incorporate angiogenesis or other interactions with inflammatory cells, and therefore cell movement is guided by the chemical signals from fibroblasts. A cell at the leading-edge has to encounter enough free space in order to move forward, and this is done by secreting TAP and degrading the ECM. Here we assume that a cell can only migrate when the ECM density (p) is less than a threshold but this assumption can easily be modified. Further investigation of the complex crosstalk between a tumor cell and other stromal cells is certainly required.
In light of these assumptions, the active force generated by an activated TEC at the leading edge is given by
| (18) |
where are the FSP level and ECM density, respectively, at the cell site is the chemotactic parameter, F0 is the basal magnitude of the active force, and is a unit outward normal vector to the basal membrane. Furthermore, is the number of cells in a neighborhood of cell i shown in Fig. 22.
Fig. 22.
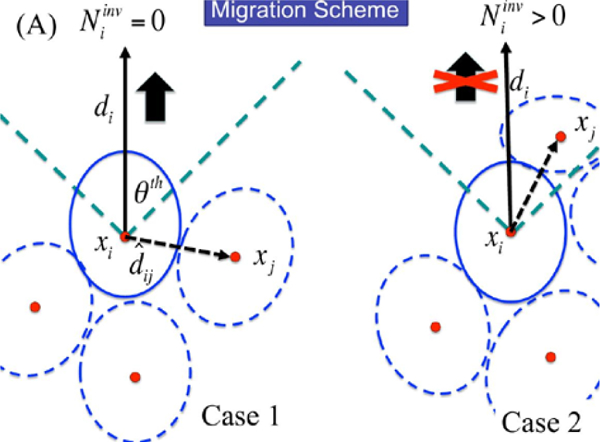
(A) A schematic of active force generation of cell i. An invasive cell i is able to generate the traction force in the migration direction (black arrow; di) when enough space is available (case 1; ). Where there are other neighboring cells ( ) in the migration direction, the active force is turned off (case 2)
| (19) |
Here, is the sensing radius, is a vector in the direction of migration (either or in (18)), is a threshold value of the angle between and for cell migration. The requirement that in (18) means that cells behind the leading edge follow passively, due to growth and adhesive forces from those at the leading edge. Since all TECs still detect growth signals, we turn off growth in the leading edge cells. Whether this is a component of the EMT is not known, since some cancer cells may divide while they are migrating. However, it is well-documented that this dichotomous behavior is common, and that only a small fraction of invasive cells both proliferate and migrate. It is also not clear whether all cells involved in collective cell migration are competent to migrate individually.
In our model, the adhesion forces between all cells, both at the leading-edge and in the following mass, are prescribed so that the invading mass moves forward as a unit. When the adhesion strength between leading-edge cells and followers is weakened, the leading cells can migrate individually (data not shown), as is typically observed in glioma cell invasion in vitro (Kim et al. 2009; Stein et al. 2007). How this is controlled in different cell types is not understood.
In summary, the invasive process depends on (i) proteolysis via secretion of TAP by invasive “tag-along” cells when these cells receive a super-threshold FSP signal, (ii) occupation of the degraded ECM space by the proliferating tag-alongs, (iii) sufficiently strong adhesion between all cells to ensure coherence of the invading mass, and (iv) mechanical balance between this growing mass and the reactive forces of the stromal continuum at the interface between continuum and the invading cell mass.
5.2. Reaction–Diffusion
The governing equations for the concentrations of ECM (ρ), tumor cell associated proteinase (Pt), and fibroblast-secreted protease (Ps) in the stroma are as follows (Kim and Friedman 2010).
| (20) |
| (21) |
| (22) |
Here, is stromal tissue, are the sites of “activated” TECs and stromal cells (fibroblasts/myofibroblasts), respectively. are the cell volume and reference ECM volume, respectively, and other parameters are positive constants. We prescribe Neumann boundary conditions for Pt,Ps:
| (23) |
where v is the outward normal, and initial conditions:
| (24) |
Equations (20)–(24) are solved as described earlier in Sect. 3.2, using parameters given in Table 5. The entire algorithm is as follows.
Table 5.
Additional parameters in the invasion model
| Description | Value | References | ||
|---|---|---|---|---|
| Diffusion coefficients | ||||
| Tumor-associated proteinase (tissue) | 1.67 × 10⁻¹² cm2/s | TW | ||
| Tumor-associated proteinase (duct) | 3.67 × 10⁻¹² cm2/s | TW | ||
| Fibroblast-secreted proteinase (tissue) | 1.02 × 10⁻⁷ cm2/s | (Saffarian et al. 2004; Sherratt and Murray 1990; Kim etal. 2009), TW | ||
| Fibroblast-secreted proteinase (duct) | 1.08 × 10⁻⁸ cm2/s | (Saffarian et al. 2004; Sherratt and Murray 1990), TW | ||
| Degradation/Decay rates | ||||
| λ1 | ECM degradation rate by TAP | 1.0 × 103cm 3g−1 s−1 | TW | |
| λ2 | ECM remodeling | 1.67 × 10⁻⁵ s−1 | (Kim et al. 2009), TW | |
| ρK | Carrying capacity of ECM | = ρ* | TW | |
| λ3 | Production rate of tumor cell-associated proteinase | 2.32 × 10 −11 g cm−3 s−1 | (Mercapide et al. 2003 ; Kim et al. 2009), TW | |
| λ4 | Decay rate of tumor cell associated proteinase | 1.67 × 10 −5 s–1 | (Kim et al. 2009), TW | |
| λ5 | Fibroblast-secreted proteinase production rate | 3.15 × 10⁻⁹ gcm−3 s−1 | TW | |
| λ6 | Decay rate of fibroblast-secreted proteinase | 1.67 × 10⁻⁵ s−1 | (Kim et al. 2009), TW | |
| Reference values | ||||
| ρ* | ECM | 1.0 × 10⁻³ g/cm3 | (Kaufman et al. 2005) | |
| Tumor-associated proteinase | 1.0 × 10⁻⁷ g/cm3 | (Annabi et al. 2005) | ||
| Fibroblast-secreted proteinase (FSP) | 1.0 × 10⁻⁷ g/cm3 | TW | ||
| Threshold for activation of TECs by FSP | 2.0 × 10⁻⁸ g/cm3 | TW | ||
The Computational Algorithm
Step 0. Initialization.
Step 0.1. Fix a uniform grid for Ω and initialize concentrations of ECM (ρ) in stromal area tumor-associated proteinase (Pt), and fibroblast-secreted proteinase (Ps) at each lattice point.
Step 0.2. Set the locations of the basal membrane and fibroblasts outside the duct and tumor cells inside the duct.
Step 1. Locate all cells and basal membrane nodes that are within a given distance from cell i. Use the level of fibroblast-secreted proteinase in order to determine invasive cells and target the basal membrane to be degraded.
Step 2. Determine the direction of motion for a cell when its invasion is activated. The migration direction is perpendicular to the tangent vector at the front node of invasive cells, i.e., cells cross the basal membrane by degradation.
Step 3. Deformation and translation of cells. Update the location of tumor cells from both growth and invasion.
Step 3.1. Find all the forces Ftotal that act on the cell from each of the neighbor cells found in Step 1. Active forces are generated by invasive cells that have been activated by fibroblast-secreted proteinase ( Ps ) at the site.
Step 3.2. Determine whether tumor secreted proteinase levels (Pt ) reach the threshold value to degrade the basal membrane. When this happens, the degradation of the basal membrane occurs. This is done by removal of the appropriate triangles from the mesh of the continuum region.
Step 4. Use this force as a boundary condition for the continuum region. Update the triangular mesh in the stromal tissue.
Step 5. Solve the reaction-diffusion equations (20)–(24) on a regular grid, using the ADI method, lagging the consumption term. Update the concentrations of proteinases (Pt,Ps) and the ECM (ρ).
Step 6. Go to Step 1.
5.3. Computational Results
Figure 23 shows the time course of tumor invasion in a longitudinal cross section. Fibroblasts (red ellipses) secrete FSP at the top of the computational domain. This diffuses throughout the stroma, and its level accumulates at the cell sites on the periphery and inside the duct. An EC or a TEC is activated and begins to secrete TAP when the FSP level exceeds a threshold This invasive cell acquires free space for invasion due to degradation of basal membrane/myoepithelium/ECM by this secreted TAP. Once the gate is open, neighboring cells become invasive cells and begin to follow the leader cell by secreting more TAP, which widens the invasive region. Local changes in the stress due to the degradation process also accelerate cell invasion and growth in the neighboring area. While growth of other cells in the duct, except the cells at either end of the open duct, is constrained by the surrounding stromal tissue and neighboring cells, the cells in the invasion area are free to invade and grow.
Fig. 23.
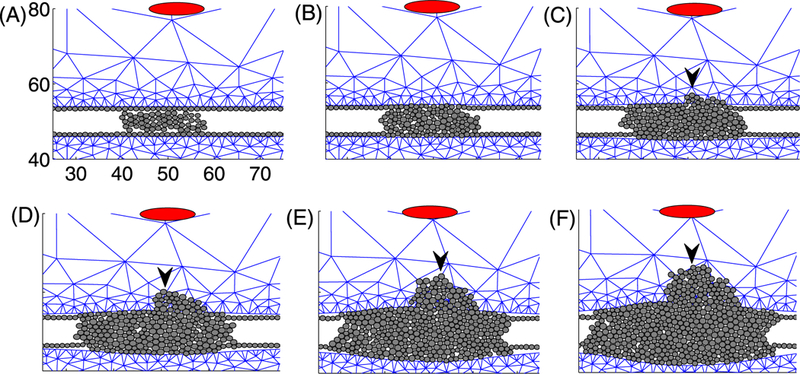
Tumor invasion in response to signals from fibroblasts in stromal tissue: t = 1 h (A), 45 h (B), 90 h (C), 135 h (D), 180 h (E), 210 h (F). Fibroblasts, which secrete the invasion signal, are marked by the red ellipse on the top of the domain in each panel. The black arrowhead denotes the Invasion front in panels (C–F)
Figure 24 shows several spatial profiles of ECM (ρ), TAP (Pt), and FSP (Ps) at t = 0, 135, 210 h. The source of FSP is located near (0.5, 0.8), and FSP diffuses throughout the stromal tissue, leading to activation of invasion for TECs on the periphery of the duct (Figs. 24(G-I)). TAP secreted by invading tumor cells is localized in the invaded region, and the size of the localized area of TAPs increases as the number of invasive cells increases (Figs. 24(E, F)). The ECM degradation by secreted TAPs allows more free space for cell invasion, particularly at the moving front. This cycle of “invasive cells-FAP secretion-ECM degradation-more space” produces collective movement of tumor cells through the stromal tissue.
Fig. 24.
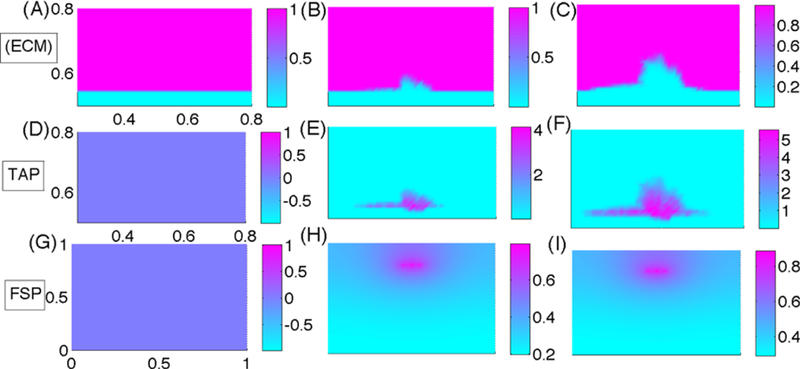
Profiles of ECM, TAP, FSP at t = 1 h (A, D, G), 135 h (B, E, H), 210 h (C, F, I). The spatial scales of the x-axis and y-axis in each row are the same as in the first panel in the row
Figure 25(A) shows the activation time of invasion for various FSP secretion rates (λ5). There are delays in activation of ECs for invasion into the stroma when the FSP secretion rate is reduced. Therefore, a drug that blocks FSP secretion from fibroblasts may be a way to inhibit the tumor invasion. Figures 25(B–D) show time evolution of the ECM degradation area, TAP activity, and average FSP levels in the region where invasion of the stroma occurs. By reducing the FSP secretion, TAP activity and ECM degradation are decreased, leading to either the slowing of invasion or its complete blockage.
Fig. 25.
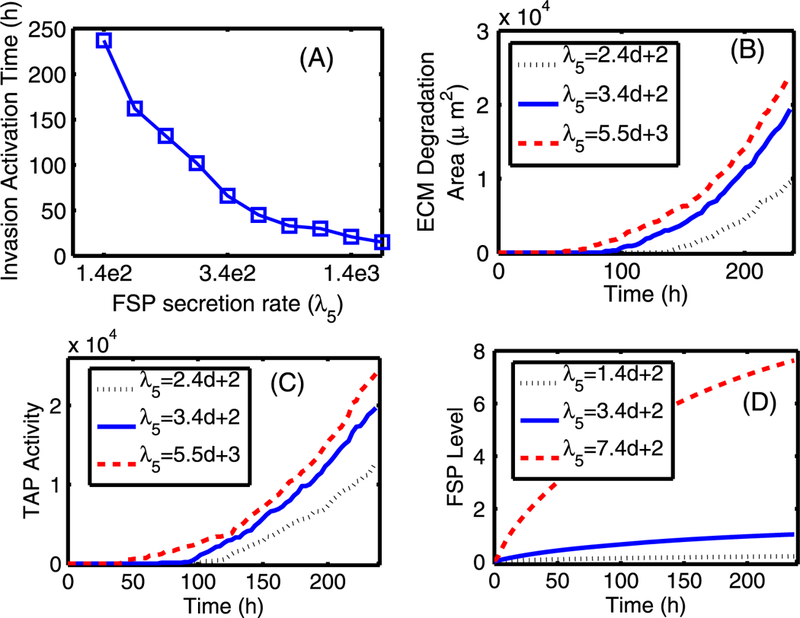
The effect of the FSP secretion rate λ5. (A) The activation time of tumor invasion in response to various FSP secretion rates. (B) The area of ECM degradation, estimated by calculating the area of the region where the ECM level is below a threshold . (C) TAP activity, which in turn was estimated by the area of the region where the TAP level is above a threshold . (D) The average FSP level in the invasion region [48, 52] × [56, 58] as a function of time for different secretion rates
In Fig. 26, we show the predicted results of changing the FSP diffusion coefficient, which may be influenced by tissue composition governed by constituents of the ECM. One sees that as the tissue stiffness increases, activation of the invasion process is delayed (Fig. 26(A)) due to delay of signal delivery (FSP level in Fig. 26(D)). This induces low or delayed proteolytic activity and ECM degradation.
Fig. 26.
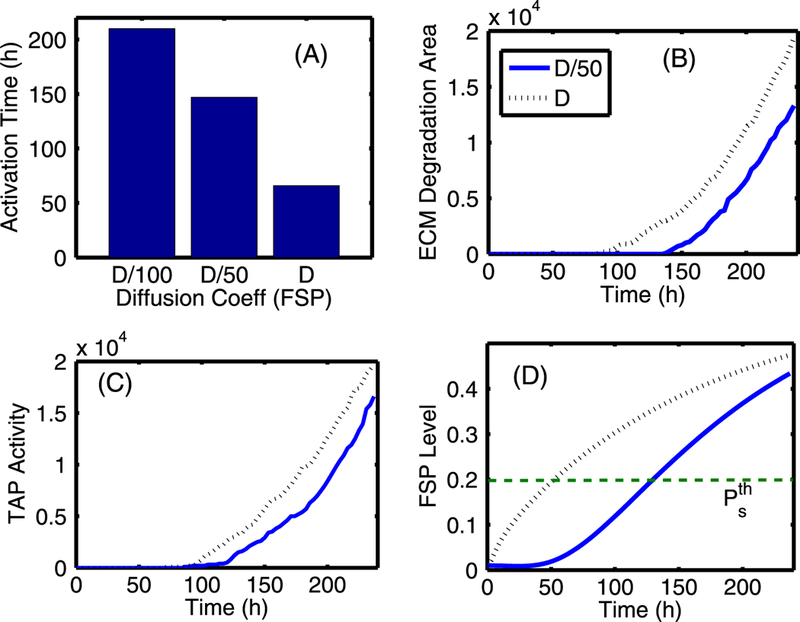
The effect of FSP diffusion. (A) The activation time of tumor invasion for three values of FSP diffusion coefficient (Ds). (B) The ECM degradation area: the area was estimated by calculating the area of the region where the ECM level is below a threshold . (C) TAP activity: the activity was estimated by the area of region where the TAP level is above the threshold (. (D) The FSP level: the average value of FSP levels was estimated in the localized invasion region [48,52] × [56,58]
6. Discussion
It is known that the interaction between a tumor and its microenvironment plays a large role in tumor development, and a better understanding of this relationship may lead to important new therapeutic approaches for controlling the growth and metastasis of cancer (Kim et al. 2011). Several aspects of this interaction have been studied here, and a general theme that emerges is that there are multiple points for intervention in the process beyond simply targeting tumor cells for eradication. For example, Fig. 27 shows the effect of blocking TGF-β production using therapeutic drugs in order to avoid or delay the recruitment of fibroblasts by ECs. When TGF-β secretion rates are reduced to 46, 60, and 80 %, compared to the control case (100 %), the activation of myofibroblasts (black arrowheads in Fig. 27(A)) is delayed. This leads to a delay in the elevation of the concentration of EGF (Fig. 27(B)), which is followed by a delay in TEC activation (green arrowheads in Fig. 27(A)), and leads to a smaller TEC population (data not shown).
Fig. 27.
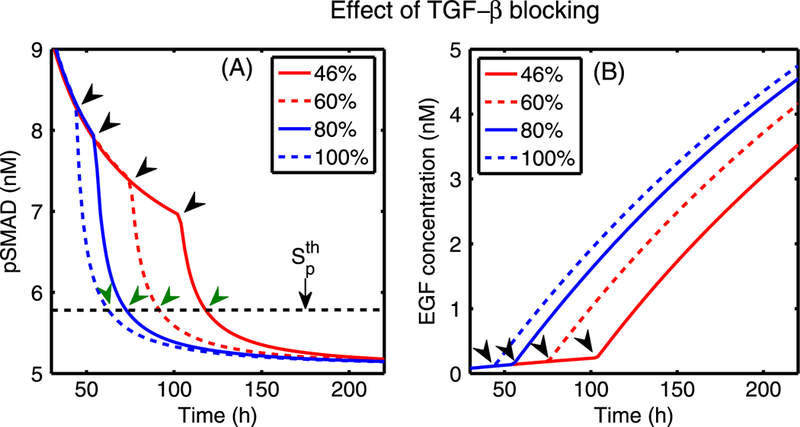
Simulated therapy—the effect of blocking TGF-β secretion from ECs. (A) The time evolution of pSmad concentration at one epithelial cell near (0.4, 0.5) for four cases of decreased TGF-p secretion rate (kTn): 46, 60 and 80 %, compared to the normal rate (100 %). Myofibroblasts are activated around 48, 58, 77, 105 h (black arrowheads) when TGF-β reaches the threshold, while the pSmad level decreases slowly for a smaller degree of the TGF-β blocking, leading to a delay of the TEC activation time (green arrowheads). (B) The initially slow increase of EGF levels at (0.42, 0.5) near a breast duct membrane begins to accelerate when myofibroblasts are activated (arrowheads) at the corresponding times for all four cases
Another potential therapeutic technique, applicable not only to breast cancer, but to gliomas and others as well, stems from the role of chemotaxis in metastasis. If a tumor has been located by some imaging method, microinjection of a large bolus of chemoattractant could serve to recruit migrating cells to the primary tumor site, thereby localizing them and increasing the efficacy of surgical removal or other treatments. This may be especially useful for gliomas, where cancer cells appear to spread outward in all directions. Conceptually, the underlying idea is analogous to what occurs under natural conditions in the cellular slime mold Dictyostelium dis- coideum, where one or more pacemaker cells release cAMP periodically, and this leads to outward traveling waves of cAMP that attract a large field of dispersed cells to the pacemaker (Dallon and Othmer 1997). Of course, whether or not there are advantages to steady versus time-dependent injection of an attractant into a tumor remains to be determined.
In addition to predicting the outcome of specific interventions such as the foregoing, the model developed here also provides a general framework for understanding mechanical aspects of cell migration through the basal membrane, as well as the role of various proteinases secreted by fibroblasts and tumor cells. For example, our numerical results suggest (cf. Fig. 25) that tumor invasion could be reduced by introducing an inhibitor that blocks secretion of proteinase by stromal cells (fibroblasts/myofibroblasts). Targeting FAP by developing more effective drugs based on proven anti-FAP compounds such as Sibrotuzumab (Kloft et al. 2004) and PT-100 (Adams et al. 2004) is one possible strategy. Of course, other pathways are also potential targets, such as those involved in attachment of cells to the ECM (Chen et al. 2008), but it has also been shown that when integrins are reduced cells may adopt other modes of movement, such as swimming by shape changes (Renkawitz et al. 2009; Renkawitz and Sixt 2010).
The results of the present work can serve as a starting point for more comprehensive modeling and experimentation. Some extensions and problems that can be addressed in the future are as follows.
There are many components of the model developed herein that warrant further study. For example, the signal transduction networks are highly simplified and the balances between the two major pathways should be studied further. Similarly, the balance between biochemical and mechanical control of tumor growth has only been touched upon. Major extensions of the model to include some of the factors described in the following items are also warranted.
Incorporation of other important molecules exhibiting proteolytic activity, such as plasminogen, urokinase-type plasminogen activator (uPA) and TIMP (Basbaum and Werb 1996; Mantzaris et al. 2004).
Incorporation of the movement of fibroblasts and myofibroblasts toward the tumor, and the recruitment of inflammatory cells to a tumor. The movement of fibroblasts and myofibroblasts is a particularly important extension, since their movement could further strengthen the feedback loop. As a first step, one could simply move them in response to signals, but a more complete description would entail modeling the mechanics of their movement in the ECM. It is also known that some tumor cells secrete factors such as autotaxin that stimulate motility of other cell types such as endothelial cells, and thereby stimulate angiogenesis (Geho et al. 2005).
Further investigation of the role of tumor-stroma interactions in altering the mechanical properties of the basal membrane. For example, if stromal cell secretions produce substantial stiffening of the membrane, invasion may be blocked.
A very important direction involves an extension of the model to allow a more complete investigation of both collective and individual cell migration through the ECM. Particular questions include how migration direction or strong/weak activities of proteolysis can be affected by the detailed structure of key structural components, such as collagen fibers, of the ECM. While there are models of polymer networks such as collagen (Stein et al. 2011), and macroscopic models of cells moving through the ECM (Hillen 2006; Hillen et al. 2010; Preziosi and Vitale 2011), much remains to be done. The approach in Stein et al. (2011) and Preziosi and Vitale (2011), as well as the current hybrid approach, may be useful in understanding the detailed mechanical interaction between a cell and fiber structure in order to better understand how migration can be controlled. A detailed discussion of the therapeutic implications of cell invasion appears in Alexander and Friedl (2012).
While it may not be possible to prevent the initial transformation of ECs to TECs, much can be done thereafter, and our general conclusion is that because the properties of the microenvironment are so important, future work should focus on targeting stromal cells in order to manipulate the host-tumor interaction in a way that prevents tumor invasion. Several drugs targeting tumor associated fibroblasts (TAFs) or tumor associated macrophages (TAMs) have been developed (Chen et al. 2008), but further modeling and computational analysis is needed to provide a basis for understanding optimal targets for preventing invasion.
Acknowledgements
Y.J.K. was supported by a Faculty research grant from the University of Michigan- Dearborn and the faculty research fund of Konkuk University in 2012. H.G.O. was supported in part by NSF grant DMS-0517884, and NIH grant GM-29123.
Contributor Information
Yangjin Kim, Department of Mathematics, Konkuk University, Seoul, 143-701, Republic of Korea.
Hans G. Othmer, School of Mathematics and Digital Technology Center, University of Minnesota, Minneapolis, MN 55455, USA, othmer@math.umn.edu
References
- Abdollah S, Macias-Silva M, Tsukazaki T, Hayashi H, Attisano L, & Wrana JL (1997). TbetaRI phosphorylation of smad2 on ser465 and ser467 is required for smad2-smad4 complex formation and signaling. J. Biol. Chem, 272(44), 27678–27685. [DOI] [PubMed] [Google Scholar]
- Adams S, Miller GT, Jesson MI, Watanabe T, Jones B, & Wallner BP (2004). PT-100, a small molecule dipeptidyl peptidase inhibitor, has potent antitumor effects and augments antibody-mediated cytotoxicity via a novel immune mechanism. Cancer Res, 64(15), 5471–5480. [DOI] [PubMed] [Google Scholar]
- Alessi DR, Cuenda A, Cohen P, Dudley DT, & Saltiel AR (1995). PD 098059 is a specific inhibitor of the activation of mitogen-activated protein kinase in vitro and in vivo. J. Biol. Chem, 270(46), 27489–27494. [DOI] [PubMed] [Google Scholar]
- Alexander S, & Friedl P (2012). Cancer invasion and resistance: interconnected processes of disease progression and therapy failure. Trends Mol. Med, 18(1), 13–26. [DOI] [PubMed] [Google Scholar]
- Almholt K, Green K, Juncker-Jensen A, Nielsen B, Lund L, & Romer J (2007). Extracellular proteolysis in transgenic mouse models of breast cancer. J. Mammary Gland Biol. Neoplasia, 12(1), 83–97. [DOI] [PMC free article] [PubMed] [Google Scholar]
- Annabi B, Bouzeghrane M, Currie JC, Hawkins R, Dulude H, Daigneault L, Ruiz M, Wisniewski J, Garde S, Rabbani SA, Panchal C, Wu JJ, & Beliveau R (2005). A PSP94-derived peptide PCK3145 inhibits MMP-9 secretion and triggers CD44 cell surface shedding: implication in tumor metastasis. Clin. Exp. Metastasis, 22(5), 429–439. [DOI] [PubMed] [Google Scholar]
- Basbaum CB, & Werb Z (1996). Focalized proteolysis: a spatial and temporal regulation of extracellular matrix degradation at the cell surface. Curr. Opin. Cell Biol, 8, 731–738. [DOI] [PubMed] [Google Scholar]
- Beacham DA, & Cukierman E (2005). Stromagenesis: the changing face of fibroblastic microenvironments during tumor progression In Seminars in cancer biology. (Vol. 15, pp. 329–341). Amsterdam: Elsevier. [DOI] [PubMed] [Google Scholar]
- Brown DR (1999). Dependence of neurones on astrocytes in a coculture system renders neurones sensitive to transforming growth factor beta1-induced glutamate toxicity. J. Neurochem, 72(3), 943–953. [DOI] [PubMed] [Google Scholar]
- Burrai GP, Mohammed SI, Miller MA, Marras V, Pirino S, Addis MF, Uzzau S, & Antuofermo E (2010). Spontaneous feline mammary intraepithelial lesions as a model for human estrogen receptor- and progesterone receptor-negative breast lesions. BMC Cancer, 10, 156. [DOI] [PMC free article] [PubMed] [Google Scholar]
- Chen ST, Pan TL, Juan HF, Chen TY, Lin YS, & Huang CM (2008). Breast tumor microenvironment: proteomics highlights the treatments targeting secretome. J. Proteome Res, 7, 1379–1387. [DOI] [PMC free article] [PubMed] [Google Scholar]
- Cheng JD, & Weiner LM (2003). Tumors and their microenvironments: tilling the soil commentary re: Scott AM et al. , A phase I dose-escalation study of sibrotuzumab in patients with advanced or metastatic fibroblast activation protein-positive cancer. Clin. Cancer Res, 9(5), 1590–1595. [PubMed] [Google Scholar]
- Cheng G, Tse J, Jain RK, & Minn LL (2009). Micro-environmental mechanical stress controls tumor spheroid size and morphology by suppressing proliferation and inducing aopotosis in cancer cells. PLoS ONE, 4, e4632. [DOI] [PMC free article] [PubMed] [Google Scholar]
- Chivukula M, Bhargava R, Tseng G, & Dabbs DJ (2009). Clinicopathologic implications of flat epithelial atypia in core needle biopsy specimens of the breast. Am. J. Clin. Pathol, 131, 802–808. [DOI] [PubMed] [Google Scholar]
- Chung SW, Miles FL, Sikes RA, Cooper CR, Farach-Carson MC, & Ogunnaike BA (2009). Quantitative modeling and analysis of the transforming growth factor beta signaling pathway. Bio- phys. J, 96(5), 1733–1750. [DOI] [PMC free article] [PubMed] [Google Scholar]
- Dallon JC, & Othmer HG (1997). A discrete cell model with adaptive signalling for aggregation of Dictyostelium discoideum. Philos. Trans. R. Soc. Lond. B, 352, 391–417. [DOI] [PMC free article] [PubMed] [Google Scholar]
- Dallon JC, & Othmer HG (2004). How cellular movement determines the collective force generated by the Dictyostelium discoideum slug. J. Theor. Biol, 231, 203–222. [DOI] [PMC free article] [PubMed] [Google Scholar]
- Danielsen T, & Rofstad EK (1998). VEGF, bFGF and EGF in the angiogenesis of human melanoma xenografts. Int. J. Cancer, 76(6), 836–841. [DOI] [PubMed] [Google Scholar]
- Davis RJ (1993). The mitogen-activated protein kinase signal transduction pathway. J. Biol. Chem, 268(20), 14553–14556. [PubMed] [Google Scholar]
- Friedl P, & Alexander S (2011). Cancer invasion and the microenvironment: plasticity and reciprocity. Cell, 147(5) 992–1009. [DOI] [PubMed] [Google Scholar]
- Geho DH, Bandle RW, Clair T, & Liotta LA (2005). Physiological mechanisms of tumor-cell invasion and migration. Physiology (Bethesda), 20, 194–200. [DOI] [PubMed] [Google Scholar]
- Hanamura N, Yoshida T, Matsumoto E, Kawarada Y, & Sakakura T (1997). Expression of fibronectin and tenascin-c mrna by myofibroblasts, vascular cells and epithelial cells in human colon adenomas and carcinomas. Int. J. Cancer, 73(1), 10–15. [DOI] [PubMed] [Google Scholar]
- Helmlinger G, Netti PA, Lichtenbeld HC, Melder RJ, & Jain RK (1997). Solid stress inhibits the growth of multicellular tumor spheroids. Nat. Biotechnol, 15(8), 778–783. [DOI] [PubMed] [Google Scholar]
- Hendriks BS, Orr G, Wells A, Wiley HS, & Lauffenburger DA (2005). Parsing ERK activation reveals quantitatively equivalent contributions from epidermal growth factor receptor and HER2 in human mammary epithelial cells. J. Biol. Chem, 280(7), 6157–6169. [DOI] [PubMed] [Google Scholar]
- Hillen T (2006). M5 mesoscopic and macroscopic models for mesenchymal motion. J. Math. Biol, 53, 585–616. [DOI] [PubMed] [Google Scholar]
- Hillen T, Hinow P, & Wang ZA (2010). Mathematical analysis of a kinetic model for cell movement in network tissues. Discrete Contin. Dyn. Syst., Ser. B, 14(3), 1055–1080. [Google Scholar]
- Hinshelwood RA, Huschtscha LI, Melki J, Stirzaker C, Abdipranoto A, Vissel B, Ravasi T, Wells CA, Hume DA, Reddel RR, & Clark SJ (2007). Concordant epigenetic silencing of transforming growth factor-signaling pathway genes occurs early in breast carcinogenesis. Cancer Res, 67(24), 11517. [DOI] [PubMed] [Google Scholar]
- Ilina O, Bakker GJ, Vasaturo A, Hofman RM, & Friedl P (2011). Two-photon laser-generated microtracks in 3D collagen lattices: principles of MMP-dependent and -independent collective cancer cell invasion. Phys Biol, 8(1), 015010. [DOI] [PubMed] [Google Scholar]
- Kaufman LJ, Brangwynne CP, Kasza KE, Filippidi E, Gordon VD, Deisboeck TS, & Weitz DA (2005). Glioma expansion in collagen I matrices: analyzing collagen concentration-dependent growth and motility patterns. Biophys. J. BioFAST, 89, 635–650. [DOI] [PMC free article] [PubMed] [Google Scholar]
- Kim Y, & Friedman A (2010). Interaction of tumor with its microenvironment: a mathematical model. Bull. Math. Biol, 72(5), 1029–1068. [DOI] [PubMed] [Google Scholar]
- Kim Y, Stolarska M, & Othmer HG (2007). A hybrid model for tumor spheroid growth in vitro I: theoretical development and early results. Math. Models Methods Appl. Sci, 17, 1773–1798. [Google Scholar]
- Kim Y, Lawler S, Nowicki M, Chiocca E, & Friedman A (2009). A mathematical model of brain tumor: pattern formation of glioma cells outside the tumor spheroid core. J. Theor. Biol, 260, 359–371. [DOI] [PubMed] [Google Scholar]
- Kim Y, Stolarska MA, & Othmer HG (2011). The role of the microenvironment in tumor growth and invasion. Prog. Biophys. Mol. Biol, 106, 353–379. [DOI] [PMC free article] [PubMed] [Google Scholar]
- Kloft C, Graefe E, Tanswell P, Scott A, Hofheinz R, Amelsberg A, & Karlsson M (2004). Population pharmacokinetics of sibrotuzumab, a novel therapeutic monoclonal antibody, in cancer patients. Invest. New Drugs, 22(1), 39–52. [DOI] [PubMed] [Google Scholar]
- Koka S, Vance JB, & Maze GI (1995). Bone growth factors: potential for use as an osseointegration enhancement technique (OET). J. West. Soc. Periodontol., Periodontal Abstr, 43(3), 97–104. [PubMed] [Google Scholar]
- Kretzschmar M, Doody J, & Massague J (1997). Opposing BMP and EGF signalling pathways converge on the TGFb family mediator smad1. Nature, 389(6651), 618–622. [DOI] [PubMed] [Google Scholar]
- Kretzschmar M, Doody J, Timokhina I, & Massague J (1999). A mechanism of repression of TGF-beta/ smad signaling by oncogenic ras. Genes Dev, 13(7), 804–816. [DOI] [PMC free article] [PubMed] [Google Scholar]
- Krouskop TA, Wheeler TM, Kallel F, Garra BS, & Hall T (1998). Elastic moduli of breast and prostate tissues under compression. Ultrason. Imag, 20(4), 260–274. [DOI] [PubMed] [Google Scholar]
- Kudlow JE, Cheung CY, & Bjorge JD (1986). Epidermal growth factor stimulates the synthesis of its own receptor in a human breast cancer cell line. J. Biol. Chem, 261(9), 4134–4138. [PubMed] [Google Scholar]
- Kunz-Schughart LA, Wenninger S, Neumeier T, Seidl P, & Knuechel R (2003). Three-dimensional tissue structure affects sensitivity of fibroblasts to TGF-beta 1. Am. J. Physiol., Cell Physiol, 284(1), C209–C219. [DOI] [PubMed] [Google Scholar]
- Liu X, Sun Y, Constantinescu SN, Karam E, Weinberg RA, & Lodish HF (1997). Transforming growth factor beta-induced phosphorylation of smad3 is required for growth inhibition and transcriptional induction in epithelial cells. Proc. Natl. Acad. Sci. USA, 94(20), 10669–10674. [DOI] [PMC free article] [PubMed] [Google Scholar]
- Mantzaris N, Webb S, & Othmer HG (2004). Mathematical modeling of tumor-induced angiogenesis. J.Math. Biol, 49, 111–187. [DOI] [PubMed] [Google Scholar]
- Marino S, Hogue IB, Ray CJ, & Kirschner DE (2008). A methodology for performing global uncertainty and sensitivity analysis in systems biology. J. Theor. Biol, 254(1), 178–196. [DOI] [PMC free article] [PubMed] [Google Scholar]
- Marshall CJ (1995). Specificity of receptor tyrosine kinase signaling: transient versus sustained extracellular signal-regulated kinase activation. Cell, 80(2), 179–185. [DOI] [PubMed] [Google Scholar]
- Massagué J (1998). TGF-beta signal transduction. Annu. Rev. Biochem, 67(1), 753. [DOI] [PubMed] [Google Scholar]
- Massagué J (2008). TGF [beta] in cancer. Cell, 134(2), 215–230. [DOI] [PMC free article] [PubMed] [Google Scholar]
- Mercapide J, Cicco R, Castresana JS, & Klein-Szanto AJ (2003). Stromelysin-1/matrix metalloproteinase-3 (MMP-3) expression accounts for invasive properties of human astrocytoma cell lines. Int. J. Cancer, 106(5), 676–682. [DOI] [PubMed] [Google Scholar]
- Palsson E, & Othmer HG (2000). A model for individual and collective cell movement in dictyostelium discoideum. Proc. Natl. Acad. Sci, 97, 11448–11453. [DOI] [PMC free article] [PubMed] [Google Scholar]
- Paszek MJ, & Weaver VM (2004). The tension mounts: mechanics meets morphogenesis and malignancy. J. Mammary Gland Biol. Neoplasia, 9(4), 325–342. Review. [DOI] [PubMed] [Google Scholar]
- Preziosi L, & Vitale G (2011). A multiphase model of tumour and tissue growth including cell adhesion and plastic re-organisation. Math. Models Methods Appl. Sci, 21, 1901–1932. [Google Scholar]
- Provenzano P, Inman D, Eliceiri K, & Keely P (2009). Matrix density-induced mechanoregulation of breast cell phenotype, signaling and gene expression through a FAK-ERK linkage. Oncogene, 28, 4326–4343. [DOI] [PMC free article] [PubMed] [Google Scholar]
- Renkawitz J, & Sixt M (2010). Mechanisms of force generation and force transmission during interstitial leukocyte migration. EMBO Rep, 11(10), 744–750. [DOI] [PMC free article] [PubMed] [Google Scholar]
- Renkawitz J, Schumann K, Weber M, Lämmermann T, Pflicke H, Piel M, Polleux J, Spatz JP, & Sixt M (2009). Adaptive force transmission in amoeboid cell migration. Nat. Cell Biol, 11(12), 1438–1443. [DOI] [PubMed] [Google Scholar]
- Saffarian S, Collier IE, Marmer BL, Elson EL, & Goldberg G (2004). Interstitial collagenase is a Brownian ratchet driven by proteolysis of collagen. Science, 306(5693), 108–111. [DOI] [PubMed] [Google Scholar]
- Samoszuk M, Tan J, & Chorn G (2005). Clonogenic growth of human breast cancer cells co-cultured in direct contact with serum-activated fibroblasts. Breast Cancer Res, 7, R274–R283. [DOI] [PMC free article] [PubMed] [Google Scholar]
- Santos SDM, Verveer PJ, & Bastiaens PIH (2007). Growth factor-induced MAPK network topology shapes Erk response determining PC-12 cell fate. Nat. Cell Biol, 9(3), 324–330. [DOI] [PubMed] [Google Scholar]
- Sappino AP, Skalli O, Jackson B, Schurch W, & Gabbiani G (1988). Smooth-muscle differentiation in stromal cells of malignant and non-malignant breast tissues. Int. J. Cancer, 41(5), 707–712. [DOI] [PubMed] [Google Scholar]
- Schmierer B, Tournier AL, Bates PA, & Hill CS (2008). Mathematical modeling identifies smad nucleocytoplasmic shuttling as a dynamic signal-interpreting system. Proc. Natl. Acad. Sci. USA, 105(18), 6608–6613. [DOI] [PMC free article] [PubMed] [Google Scholar]
- Sherratt JA, & Murray JD (1990). Models of epidermal wound healing. Proc. R. Soc. Lond. B, 241, 29–36. [DOI] [PubMed] [Google Scholar]
- Shi Y, & Massagué J (2003). Mechanisms of TGF-β signaling from cell membrane to the nucleus. Cell, 113(6), 685–700. [DOI] [PubMed] [Google Scholar]
- Souchelnytskyi S, Tamaki K, Engstrom U, Wernstedt C, ten Dijke P, & Heldin CH (1997). Phosphorylation of ser465 and ser467 in the C terminus of smad2 mediates interaction with smad4 and is required for transforming growth factor-beta signaling. J. Biol. Chem, 272(44), 28107–28115. [DOI] [PubMed] [Google Scholar]
- Stein AM, Demuth T, Mobley D, Berens M, & Sander LM (2007). A mathematical model of glioblastoma tumor spheroid invasion in a three-dimensional in vitro experiment. Biophys. J, 92(1), 356–365. [DOI] [PMC free article] [PubMed] [Google Scholar]
- Stein AM, Vader DA, Weitz DA, & Sander LM (2011). The micromechanics of threedimensional collagen-I gels. Complexity, 16(4), 22–28. [Google Scholar]
- Thorne RG, Hrabetova S, & Nicholson C (2004). Diffusion of epidermal growth factor in rat brain extracellular space measured by integrative optical imaging. J. Neurophysiol, 92(6), 3471–3481. [DOI] [PubMed] [Google Scholar]
- Tlsty TD (2001). Stromal cells can contribute oncogenic signals. Semin. Cancer Biol, 11(2), 97–104. [DOI] [PubMed] [Google Scholar]
- van den Hooff A. (1988). Stromal involvement in malignant growth. Adv. Cancer Res, 50, 159–196. [DOI] [PubMed] [Google Scholar]
- Wakefield LM, Smith DM, Masui T, Harris CC, & Sporn MB (1987). Distribution and modulation of the cellular receptor for transforming growth factor-beta. J. Cell Biol, 105(2), 965–975. [DOI] [PMC free article] [PubMed] [Google Scholar]
- Wells CA, & El-Ayat GA (2007). Non-operative breast pathology: apocrine lesions. J. Clin. Pathol, 60, 1313–1320. [DOI] [PMC free article] [PubMed] [Google Scholar]
- Wolf K, Wu YI, Liu Y, Geiger J, Tam E, Overall C, Stack MS, & Friedl P (2007). Multi-step pericellular proteolysis controls the transition from individual to collective cancer cell invasion. Nat. Cell Biol, 9(8), 893–904. [DOI] [PubMed] [Google Scholar]
- Woodcock EA, Land SL, & Andrews RK (1993). A low affinity, low molecular weight endothelin- A receptor present in neonatal rat heart. Clin. Exp. Pharmacol. Physiol, 20(5), 331–334. [DOI] [PubMed] [Google Scholar]
- Zi Z, Feng Z, Chapnick DA, Dahl M, Deng D, Klipp E, Moustakas A, & Liu X (2011). Quantitative analysis of transient and sustained transforming growth factor-beta signaling dynamics. Mol. Syst. Biol, 7(492), 1–12. [DOI] [PMC free article] [PubMed] [Google Scholar]


