

Abstract
The neutral amino acid transporter solute carrier family 1 member 5 (SLC1A5 or ASCT2) is overexpressed in many cancers. To identify its roles in tumors, we employed 143B osteosarcoma cells and HCC1806 triple-negative breast cancer cells with or without ASCT2 deletion. ASCT2ko 143B cells grew well in standard culture media, but ASCT2 was required for optimal growth at <0.5 mm glutamine, with tumor spheroid growth and monolayer migration of 143B ASCT2ko cells being strongly impaired at lower glutamine concentrations. However, the ASCT2 deletion did not affect matrix-dependent invasion. ASCT2ko 143B xenografts in nude mice exhibited a slower onset of growth and a higher number of small tumors than ASCT2wt 143B xenografts, but did not differ in average tumor size 25 days after xenotransplantation. ASCT2 deficiency was compensated by increased levels of sodium neutral amino acid transporter 1 (SNAT1 or SLC38A1) and SNAT2 (SLC38A2) in ASCT2ko 143B cells, mediated by a GCN2 EIF2α kinase (GCN2)-dependent pathway, but this compensation was not observed in ASCT2ko HCC1806 cells. Combined SNAT1 silencing and GCN2 inhibition significantly inhibited growth of ASCT2ko HCC1806 cells, but not of ASCT2ko 143B cells. Similarly, pharmacological inhibition of l-type amino acid transporter 1 (LAT1) and GCN2 significantly inhibited growth of ASCT2ko HCC1806 cells, but not of ASCT2ko 143B cells. We conclude that cancer cells with reduced transporter plasticity are more vulnerable to disruption of amino acid homeostasis than cells with a full capacity to up-regulate redundant transporters by an integrated stress response.
Keywords: amino acid transport, stress response, glutamine, homeostasis, signal transduction, amino acid harmonizer, ASCT1, GCN2, SNAT1, SNAT2, cancer, starvation response
Introduction
Rapid growth of cancer cells requires the maintenance of a homeostatic pool of cytosolic amino acids for protein synthesis and metabolic demands (1). Protein synthesis is an essential function underlying cancer cell growth; it uses all 20 proteinogenic amino acids and limits the overall growth of a tumor (2). Membrane transporters are essential for the cellular uptake of amino acids and for amino acid signaling, and therefore provide potential targets to block tumor growth. However, the presence of more than 50 amino acid transporters in the human genome suggests redundancy and makes target selection difficult. Microarray data pointed to elevated expression of ASCT2 (SLC1A5)2 and LAT1 (SLC7A5) in many cancers (3), and this has been confirmed in many studies and cell lines (for reviews, see Refs. 4–6). To explain the abundance of ASCT2 and LAT1 in cancer cells, Nicklin et al. (7) proposed a model in which glutamine enters cells through ASCT2 and is subsequently used as an exchange substrate for importing leucine, among other essential amino acids, via LAT1 to maintain mTORC1 in an activated state. However, silencing or deletion of ASCT2 has generated mixed results. Reduced growth and compromised tumor development was reported by Wang et al. (8) in PC-3 prostate cancer cells. van Geldermalsen et al. (9) reported reduction of cell growth in HCC1806 basal-like breast cancer cells, but not in MCF-7 luminal cancer cells. ASCT2 knockdown also significantly reduced the sizes of HCC1806 xenografts. Hassanein et al. (10) reported growth inhibition of A549 and H520 lung cancer cells by ASCT2 inhibitor γ-glutamyl-p-nitroanilide (GPNA) (11), but siRNA-induced silencing of ASCT2 reduced growth and viability only slightly. In 143B osteosarcoma cells, CRISPR/Cas9-mediated deletion of ASCT2 did not compromise mTORC1 signaling and cell growth, but activated GCN2/ATF4 signaling, which in turn up-regulated the redundant transporters SNAT1 (SLC38A1) and SNAT2 (SLC38A2) (12). Antisense RNA–induced silencing of ASCT2 was initially reported to cause apoptosis in hepatocellular carcinoma cell lines (13), but subsequent deletion of ASCT2 by CRISPR/Cas9 in this cell type failed to reduce cell growth (14). When ASCT2 was deleted in A549 and LS174T cells, in vitro cell growth was reduced only in A549 cells, but xenografts from both cell lines grew more slowly (15). Hassanein et al. (16) reported highly variable tumor sizes in A549 xenografts, with very large tumors occurring only in cells containing ASCT2.
Some of the reported variability is caused by the use of GPNA or benzylserine to examine involvement of ASCT2 in cancer cell growth (e.g. Refs. 8, 10, 17, and 18). These amino acid analogues block a variety of glutamine transporters, such as ASCT2, SNAT1, SNAT2 (12), and LAT1 (19). Consequently, GPNA and benzylserine inhibit cell growth more strongly than selective ASCT2 silencing. A recently reported novel ASCT2 inhibitor, which reduced in vivo tumor growth (20, 21), blocks SNAT2 and LAT1 more efficiently than ASCT2 (22), also excluding its use to study the role of ASCT2. Monoclonal antibodies have been used as alternative tools to reduce ASCT2 activity. Some reduction in growth was reported using monoclonal antibodies against extracellular loops of ASCT2 in WiDr colorectal cancer cells (23). In head and neck squamous cell carcinoma, ASCT2 formed a complex with EGFR and was cointernalized when EGFR endocytosis was induced using the mAb cetuximab (24). This was proposed to render cells more vulnerable to oxidative stress.
These examples demonstrate that ASCT2 inhibition and silencing reduce cell growth and tumor growth to differing degrees in different models. Thus, despite high expression of ASCT2 in almost all cancer cell lines and cancer types and its known role as an amino acid exchanger, it is unclear why some cancer cells tolerate ASCT2 silencing whereas other cell lines do not.
Results
We have previously demonstrated that 143B osteosarcoma cells do not require ASCT2 for fast cell growth and mTORC1 signaling (12). Most culture media contain high nonphysiological nutrient levels and may disguise the roles transporters play in vivo, where nutrient concentrations can be below those in plasma, for instance in poorly vascularized tumors (26). Glutamine, in particular, is added to media at concentrations of 1–4 mm (Table 1). To test the possibility that ASCT2 could be important at low glutamine concentration, we grew WT (ASCT2wt) and ASCT2-knockout (ASCT2ko) 143B cells in Dulbecco's modified Eagle's medium/Ham's nutrient mixture F12 (DMEM/F12) supplemented with different concentrations of glutamine. As demonstrated previously (12), ASCT2wt and ASCT2ko 143B cells are fully glutamine-dependent, but in the presence of ASCT2, cells grew rapidly already at 0.03 mm glutamine, whereas ASCT2ko cells required 2 mm for optimal growth (Fig. 1A). DMEM/F12 has supraphysiological concentrations of most amino acids, whereas basal medium Eagle (BME) has amino acid concentrations closer to physiological levels (Table 1). In BME supplemented with nonessential amino acids, ASCT2wt and ASCT2ko cells grew at similar rates when glutamine was provided at 3–5 mm (Fig. 1B), but ASCT2ko cells grew much more slowly at <0.3 mm. Very high levels of glutamine even slowed the growth rate of ASCT2-expressing 143B cells, suggesting competition between glutamine and other amino acids that are important for tumor growth. In agreement with this notion, supplementing the high-glutamine BME with threonine or methionine restored the growth rate of 143B cells to levels exceeding growth in BME supplemented with 0.5 mm glutamine (Fig. 1C).
Table 1.
Amino acid composition (mm) of media used in this study
Glutamine was added to the media at the concentration in the text and figure legends.
| Amino acid | DMEM/F12 (Sigma, D6421) | BME (Thermo, 21010) | Physiological concentrationsa |
|---|---|---|---|
| Arg | 0.702 | 0.099 | 0.032–0.11 |
| Cys | 0.1 | 0.05 | 0.003–0.095 |
| His | 0.15 | 0.051 | 0.039–0.123 |
| Ile | 0.416 | 0.198 | 0.036–0.107 |
| Leu | 0.45 | 0.198 | 0.068–0.183 |
| Lys | 0.5 | 0.199 | 0.103–0.255 |
| Met | 0.234 | 0.05 | 0.004–0.044 |
| Phe | 0.214 | 0.1 | 0.035–0.08 |
| Thr | 0.445 | 0.2 | 0.085–0.231 |
| Trp | 0.044 | 0.0196 | 0.029–0.077 |
| Tyr | 0.23 | 0.099 | 0.031–0.09 |
| Val | 0.452 | 0.2 | 0.136–0.309 |
| Asp | 0.05 | 0.005b | <0.007 |
| Gly | 0.25 | 0.35b | 0.126–0.49 |
| Pro | 0.15 | 0.25b | 0.097–0.368 |
| Ser | 0.25 | 0.1b | 0.063–0.187 |
| Ala | 0.05 | 0.5b | 0.2–0.579 |
| Asn | 0.057 | 0.1b | 0.037–0.092 |
| Glu | 0.05 | 0.1b | 0.013–0.113 |
| Gln | Variable | Variable | 0.371–0.957 |
a Physiological plasma concentration in fasting adults (Mayo Clinic, quantitative amino acid analysis).
b Amino acids were added to the media at the indicated final concentration.
Figure 1.
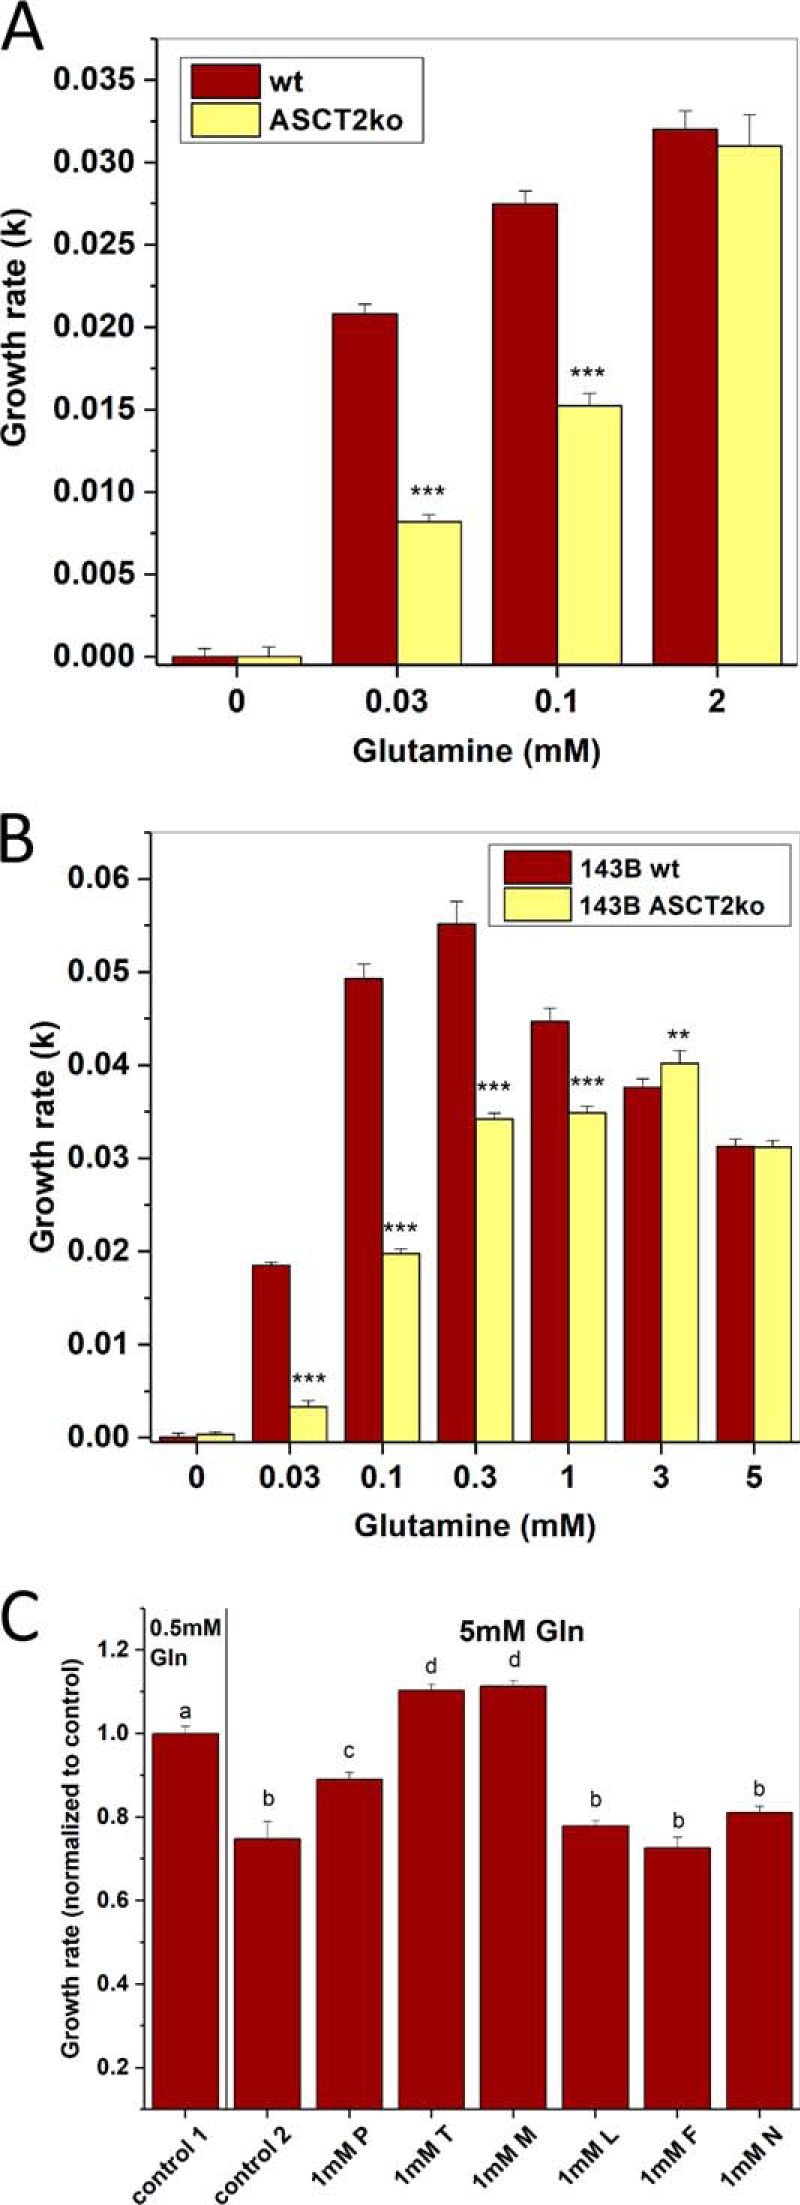
Effect of ASCT2 on glutamine dependence of growth. A, growth rates of 143B osteosarcoma cells (ASCT2wt or ASCT2ko) were determined at different glutamine concentrations in DMEM/F12 supplemented with 10% dialyzed FBS using an IncuCyte FLR instrument (n = 10). Wells were seeded from three different starting cultures. B, growth rates of 143B cells (ASCT2wt and ASCT2ko) were determined at different glutamine concentrations in BME, 10% dialyzed FBS using an IncuCyte instrument (n = 10). C, growth rates of 143B ASCT2wt cells were determined in BME, 10% dialyzed FBS supplemented with 0.5 mm glutamine (control 1) or 5 mm glutamine (control 2). Growth rates were normalized to control 1. The suppression of growth by 5 mm glutamine was nullified by supplementation with 1 mm threonine (T) or 1 mm methionine (M), but not by leucine (L), phenylalanine (F), or asparagine (N). Proline (P) caused a partial rescue (n = 8; letters a, b, c, and d indicate groups of values that are significantly different from each other at p = 0.001). In other panels, *** indicates p values <0.001, and ** indicates p < 0.01 for comparison between ASCT2wt and ASCT2ko. Error bars represent S.D.
The results suggest that ASCT2 is required for optimal growth at low glutamine concentrations, which may occur in poorly vascularized tumors and at a distance from blood vessels. To investigate this possibility further, we determined the diameter of tumor spheres derived from ASCT2wt and ASCT2ko cells (Fig. 2). Similar to the results in monolayer cultures, spheroid formation by ASCT2ko cells at low concentration (Fig. 2A; 0.05 mm) was essentially abolished; WT 143B cells, by contrast, grew normally. At physiological glutamine concentration (Fig. 2B; 0.5 mm), ASCT2ko spheroids were slightly smaller and more translucent. Only at high glutamine concentrations (Fig. 2C; 2 mm) were spheroids of equivalent size formed by ASCT2wt and ASCT2ko cells. At 2 mm glutamine (Fig. 2C), spheres were smaller than at 0.5 mm (Fig. 2B), again suggesting competition between glutamine and other essential amino acids.
Figure 2.

Effect of ASCT2 on growth of tumor spheres. Tumor spheres of 143B cells (ASCT2wt and ASCT2ko) were grown in DMEM/F12 medium supplemented with 10% dialyzed FBS and glutamine at 0.05 (A), 0.5 (B), and 2 mm (C), and sphere diameter was measured. The range of the raw data are reported as box plots showing upper and lower limits (×), 5th and 95th percentiles (whisker), 25th and 75th percentiles (box), and median. Representative images of the tumor spheres are shown below the box plots. Scale bars represent 1 mm.
Cell migration is important for tumor generation and metastasis. Using monolayer scratch-wound assays as a model, we analyzed migration of ASCT2wt and ASCT2ko 143B cells. To distinguish migration from growth, only 0.3% fetal bovine serum (FBS) was added, preventing excessive cell growth. ASCT2wt and ASCT2ko 143B cells did not migrate in glutamine-free media (Fig. 3A). ASCT2wt 143B cells readily moved into the scratched cell-free area, occupying the gap within 24 h at glutamine concentrations >0.03 mm (Fig. 3A). ASCT2ko 143B cells, by contrast, struggled to occupy the scratched area even at 2 mm and failed to migrate at <0.1 mm glutamine. To analyze whether ASCT2 deletion affected signal transduction pathways involved in cell migration, we investigated focal adhesion kinase and ROCK signaling. Expression of focal adhesion kinase (FAK) was similar in ASCT2ko and ASCT2wt 143B cells (Fig. 3B). Myosin light chain (MLC), a target of ROCK signaling, was clearly phosphorylated in ASCT2wt cells at 2 mm glutamine, whereas very little phosphorylation was observed in ASCT2ko cells. At 0.03 mm glutamine, both cell lines showed similar protein expression levels and low levels of myosin light-chain phosphorylation (Fig. 3B).
Figure 3.

Effects of ASCT2 on cell migration. A, cell migration of 143B cells (ASCT2wt and ASCT2ko) was examined using a monolayer scratch-wound assay. Closure of the scratched areas was monitored over 24 h. Approximate cell boundaries are outlined in blue for clarity. Representative results of n = 8 experiments are shown. B, analysis of signal transduction pathways involved in cell migration. Focal adhesion kinase expression and phosphorylation of MLC (P-MLC) were detected by Western blotting in triplicate.
We have previously shown that lack of ASCT2 causes an amino acid stress response in 143B cells as evidenced by phosphorylation of eIF2α (12). Many amino acid transporters contain an amino acid response element (AARE) in their promoters (27). Thus, lack of ASCT2 may be compensated by up-regulation of alternative transporters, such as ASCT1. Consistent with this notion, we found that ASCT1 mRNA (not shown) and protein were increased in ASCT2ko 143B cells (Fig. 4A). Inspection of the regulatory elements of ASCT1 showed a consensus AARE upstream of the transcriptional start site (Fig. 4C). Because the anti-ASCT1 antibody detected two bands, we used RNAi to identify the ASCT1-specific band (Fig. 4A). Using two different siRNA constructs (I and II), we identified the upper band as ASCT1. The experiment also revealed that ASCT1 protein induced by lack of ASCT2 was less affected by siRNA-induced silencing in ASCT2ko 143B cells than in ASCT2wt cells. RNAi constructs with scrambled sequence did not reduce ASCT1 protein expression. In addition to ASCT1-mediated alanine transport, N-methylaminoisobutyric acid (MeAIB)-sensitive alanine transport was also increased in ASCT2ko 143B cells (Fig. 4B; showing the MeAIB-sensitive fraction of alanine uptake). Inhibition by this amino acid analogue is a well-known indicator of up-regulation of amino acid transporter SNAT1 or SNAT2 (28).
Figure 4.

Compensation of ASCT2 ablation. A, ASCT1 surface protein expression was analyzed by Western blotting in 143B cells (ASCT2wt and ASCT2ko). To identify the ASCT1-specific band (asterisk), RNAi using a scrambled control RNA (SC) and two ASCT1-specific constructs (I and II) was used. Na+/K+-ATPase was used as the protein-loading control. B, induction of alanine uptake mediated by system A (SNAT1/2) in ASCT2ko cells was analyzed by measuring alanine uptake in the presence or absence of 10 mm MeAIB. The net MeAIB-sensitive uptake +/− S.D. is shown (p = 0.0001, n = 8). C, promoter fragment and exon 1 of ASCT1. The AARE and the start codon (ATG) are highlighted in red. D and E, xenografts of ASCT2wt and ASCT2ko 143B cells were established in nude mice, and growth was monitored for 28 days. Tumor weights were measured upon euthanasia (D). Tumor volumes were measured by calipers every 2–3 days. Raw data are shown for tumor weights; mean ± S.E. is reported for tumor volume (E).
Overall, our results demonstrate a substantial plasticity and redundancy in transporter expression to compensate for lack of ASCT2 in 143B cells, particularly through up-regulation of ASCT1 and SNAT1 or SNAT2. ASCT2 has an essential role, however, at low amino acid concentrations and for cell migration. When grown in amino acid–rich media the transporter appears to be dispensable in 143B cells.
We confirmed this notion using xenograft experiments. In nude mice, ASCT2wt and ASCT2ko 143B cells were able to establish tumors of similar sizes (Fig. 4, D and E). However, there was a larger proportion of small tumors generated by ASCT2ko 143B cells (Fig. 4D; ASCT2wt, one small tumor; ASCT2ko, six small tumors), and the growth was initially significantly slower for ASCT2ko tumors (Fig. 4E). This suggests that ASCT2 serves an important role in the initial phase of tumor growth, but for those tumors that can pass a certain growth threshold, lack of ASCT2 apparently does not limit the overall size of 143B xenograft tumors.
To further investigate the role of ASCT2 in the establishment of tumors, we analyzed matrix-dependent cell invasion in vitro. Consistent with the xenograft findings, only small differences were observed between ASCT2wt and ASCT2ko 143B cells (Fig. 5). Notably, invasion area was slightly larger in the case of ASCT2ko 143B cells without reaching significance (Fig. 5, A and B). Because lack of ASCT2 increased the MeAIB-sensitive alanine transport, we asked whether up-regulation of SNAT1 or SNAT2 could be related to enhanced matrix-dependent invasion by 143B cells. We found that inhibition of SNAT1 and SNAT2 by MeAIB reduced invasion, particularly in ASCT2wt 143B cells (Fig. 5C).
Figure 5.

Matrix-dependent 3D spheroid growth and invasion. Tumor spheres were established by seeding 143B ASCT2wt and ASCTko cells into low-adhesion 96-well plates. Subsequently, extracellular matrix was added, and outgrowth of cells was compared with that in wells without added matrix over time. Invasion area +/− S.D. was measured in the presence of 100 μm (A; n = 4) or 2 mm (B; n = 4) glutamine. Quantitative analyses, statistical analyses, and representative images are shown (A and B) Scale bar equals 0.5 mm. At physiological glutamine concentration (0.5 mm), invasion was similar between 143B ASCT2wt and ASCTko cells (C, scale bar equals 1 mm), but addition of the system A inhibitor MeAIB reduced the invasion area, particularly in WT cells (n = 3–4, p = 0.01). Representative images and quantitative analyses (Matrix dependent invasion growth area +/− S.D.) are shown.
Transporter plasticity and compensation, at least in part, requires activation of the GCN2/ATF4 pathway (1, 27). To increase the signal of this pathway, we starved 143B cells by overnight incubation in amino acid–free media. SNAT2, for instance, was undetectable on the surface of cells grown in amino acid–replete media, but was highly up-regulated upon amino acid starvation (Fig. 6A, compare AA+ lanes with AA− lanes). SNAT1 was also strongly up-regulated, but its expression was already detectable in cells grown in amino acid–replete media (Fig. 6A). Pharmacological inhibition of GCN2 using a triazolopyrimidine-based inhibitor, TAP20 ((1R,3R)-3-[3-(2-methyl-quinolin-6-yl)-3H-[1,2,3]triazolo[4,5-d]pyrimidin-5-ylamino]-cyclopentanecarboxylic acid amide) (Fig. 6B) (29), showed that the induction of SNAT2 surface expression in 143B cells almost entirely depended on GCN2 (Fig. 6A). Up-regulation of SNAT1 partially depended on GCN2 (Fig. 6A). As observed in most cancer cells, ASCT2 and LAT1 expression was high in amino acid–replete media and not substantially regulated by amino acid starvation (Fig. 6A). RNA-mediated silencing of GCN2 also reduced SNAT2 induction, but not as efficiently as by TAP20 treatment (Fig. 6C).
Figure 6.

Transporter plasticity in 143B cells. WT 143B cells were maintained in amino acid–rich DMEM/F12 supplemented with 10% FBS (+AA) or in Hanks' buffered salts solution (−AA) (supplemented with 5 mm glucose and 1% dialyzed FBS) over 12 h. A, selected groups of cells were treated with GCN2 inhibitor TAP20 (3 μm) during the incubation. At the end of the incubation period, surface expression of glutamine transporters SNAT2, SNAT1, ASCT2, and LAT1 was examined by immunoblotting. Na+/K+-ATPase was used as the protein-loading control. B, for comparison, GCN2 was silenced using a specific RNAi construct (GCN2si; +) or a scrambled control RNA (−). Reprobing of the same blot allowed using the same Na+/K+-ATPase as the protein-loading control. Blots are representatives of three independent experiments.
Our results suggest that SNAT1, ASCT2, and LAT1 are baseload transporters in cancer cells, whereas SNAT2 and ASCT1 act as rescue transporters when amino acids are depleted. We wondered whether adaptation to amino acid depletion may determine the vulnerability to ASCT2 inhibition. As we reported previously, growth of 143B cells in amino acid–rich media was unaffected by ASCT2 deletion (12), whereas growth of HCC1806 triple-negative breast cancer cells was strongly impaired after ASCT2 silencing (9). To study these differences in more detail, we used genome editing of ASCT2 in HCC1806 cells to abrogate ASCT2 protein expression (Fig. 7A). Viable clones were obtained and could be maintained in amino acid–rich media. Deletion of ASCT2 had no effect on amino acid–dependent signaling, such as phosphorylation of 4EBP1 (mTORC1), ribosomal protein S6 (mTORC1), and eIF2α (GCN2). However, expression of amino acid stress-response transcription factor ATF4 was increased in HCC1806 ASCT2ko cells (Fig. 7A). Characterization of l-[14C]glutamine transport in HCC1806 cells showed a substantial transport activity attributable to system A (SNAT1 or SNAT2) as indicated by the fraction of glutamine uptake that was sensitive to inhibition by MeAIB (Fig. 7B). Genomic deletion of ASCT2 in HCC1806 cells (Fig. 7B, yellow bars) reduced glutamine uptake by 55%, whereas the absolute activity of glutamine uptake that was sensitive to inhibition by MeAIB remained approximately the same. The remaining glutamine uptake was sensitive to inhibition by threonine, leucine, and the amino acid analogue 2-aminobicyclo-(2,2,1)-heptane-2-carboxylic acid (BCH), suggesting that transport was mediated by LAT1. Using the preferred system A substrate l-[14C]alanine, we confirmed that system A activity did not increase upon ASCT2 deletion in HCC1806 cells, whereas 143B cells, which are largely unaffected by ASCT2 deletion, showed a significant increase in system A activity (Fig. 7C). To compare amino acid transporter plasticity between the two cell lines, we used amino acid depletion experiments in WT cells. Rapid up-regulation of SNAT2 was observed after 6 h in 143B cells (Fig. 7D, AA−). HCC1806 cells, which are more sensitive to ASCT2 silencing (9), showed a much slower onset of SNAT2 surface expression, possibly explaining their higher vulnerability (Fig. 7D). Transport experiments confirmed induction of MeAIB-sensitive alanine transport (system A) in 143B ASCT2wt cells after 6 and 12 h (Fig. 7E). HCC1806 cells showed higher levels of system A activity in replete media than 143B cells, but the induction upon amino acid depletion was much more moderate (Fig. 7E).
Figure 7.

Characterization of ASCT2 ablation in HCC1806 cells. A, immunoblotting was used to analyze protein levels of ASCT2, actin, 4EBP1, phospho-4EBP1 (p-4EBP1), ribosomal protein S6, phospho-S6 (p-S6), eIF2α (eif2), phospho-eIF2α (p-eif), and ATF4 in WT or ASCT2ko HCC1806 cells. A line was included to separate the genotypes; the ATF4 blot was spliced together from a single blot in which a marker lane separated the genotypes. B, l-[14C]glutamine uptake was measured in ASCT2wt or ASCT2ko HCC1806 cells in the absence or presence of 10 mm amino acid or amino acid analogues to estimate the contribution of ASCT2, SNAT1/2, or LAT1 to glutamine uptake (n = 5–6). C, induction of alanine uptake mediated by system A (SNAT1/2) in ASCT2ko cells was analyzed by measuring alanine uptake in the presence or absence of 10 mm MeAIB. The net MeAIB-sensitive uptake is shown; data from Fig. 4A are repeated for comparison (n = 6–9). D, induction of SNAT2 surface expression was analyzed in HCC1806 or 143B cells 6 or 12 h after cells were transferred to media without amino acids. SNAT2-specific bands in both cell lines are labeled. Na+/K+-ATPase was used as the protein-loading control (n = 3). E, induction of system A (SNAT1/2) after amino acid depletion was analyzed by measuring alanine uptake in the presence or absence of 10 mm MeAIB. The net MeAIB-sensitive uptake is shown in HCC1806 (n = 6) and 143B cells (n = 6). Significance levels are indicated. Error bars in all panels represent S.D.
Our results suggest that cancer cells may be more vulnerable to combined inhibition of ASCT2 and GCN2 or the combined inhibition of redundant transporters. We predicted that HCC1806 cells, because of their impaired transporter plasticity, should be more sensitive to combined inhibition.
ASCT2 deletion in HCC1806 cells increased the time to reach confluence in amino acid–rich media (Fig. 8, compare A and B), confirming previous data using shRNA-mediated ASCT2 knockdown (9). However, a far more drastic effect was observed when ASCT2ko was combined with GCN2 inhibition by TAP20 (brown circles). Moreover, silencing of SNAT1 in HCC1806 ASCT2ko cells treated with TAP20 completely abolished cell growth in amino acid–rich media (Fig. 8B). As an alternative means to disrupt amino acid homeostasis, we combined inhibition of GCN2 (TAP20) and LAT1 (JPH203). Intriguingly, 143B ASCT2wt cells were refractory to inhibitors TAP20 (GCN2) and JPH203 (LAT1) and even to their combination (Fig. 8C). However, the combination reduced cell growth in the ASCT2ko background (Fig. 8D). HCC1806wt cells were also unaffected by TAP20, JPH203, and their combination (Fig. 8E), but combined inhibition completely stopped growth in HCC1806 ASCT2ko cells (Fig. 8F).
Figure 8.

Disruption of amino acid homeostasis in cancer cells. Growth of HCC1806 breast cancer cells (ASCT2wt (A and E) or ASCT2ko (B and F)) or 143B osteosarcoma cells (ASCT2wt (C) or ASCT2ko (D)) was measured in the presence of inhibitors such as TAP20 (target, GCN2; 3 μm) or JPH203 (target, LAT1; 3 μm) to disturb amino acid homeostasis. In the absence of specific inhibitors, SNAT1 was silenced by sequence-specific RNAi, whereas scrambled RNAi oligonucleotides were used as controls. The same inhibitors were used in ASCT2wt and ASCT2ko cells (n = 15). Error bars represent S.D.
Discussion
We recently proposed a model for amino acid homeostasis in cancer cells that involves transporters that play different physiological roles (1, 12) (Fig. 9). Amino acid loaders, such as SNAT1, mediate the net uptake of a group of amino acids into cancer cells. Amino acid harmonizers, such as ASCT2 and LAT1, ensure that all amino acids are present in the cytosol and rapidly exchange different amino acids (Fig. 9, WT). As outlined in this and other studies, the GCN2/ATF4 amino acid stress response is critical for adaptation to amino acid imbalance (for a review, see Ref.30), for instance caused by lack of ASCT2 (Fig. 9, ASCT2ko). Rescue transporters, such as SNAT2 and ASCT1, provide redundant capacity and are up-regulated under such stress conditions. The data presented here further support this model and point to potential pitfalls in the use of amino acid transport inhibitors as anticancer therapeutics in cell lines with robust transporter plasticity. The plasticity allows overcoming situations of nutrient limitation (27). The differential response of cancer cells to ASCT2 inhibition, at least in part, can be explained by differences in transporter plasticity. In 143B cells, SNAT2 protein was rapidly up-regulated after 6 h of complete amino acid depletion, whereas HCC1806 cells showed a much slower response. SNAT2 surface expression was accompanied by a concurrent increase of system A activity. Despite up-regulation of a SNAT2 antibody–reactive band in HCC1806 cells after 12 h of complete amino acid depletion, only a small increase in system A transport activity was observed. This may reflect the slower onset of SNAT2 protein expression or may suggest incomplete maturation of SNAT2 in this cell line, resulting in an inactive transporter. The higher basal system A activity in HCC1806 cells (presumably mediated by SNAT1) and the expression of ATF4 in amino acid–rich media suggest that HCC1806 cells are partially stressed even under nutrient-rich conditions, limiting further adaptation. Consistently, ASCT2ko was accompanied by a significant increase in system A activity in 143B cells, but not in HCC1806 cells. SNAT2 and ASCT2 have similar substrate specificity, and it appears plausible that increased activity of SNAT2 can compensate for the loss of ASCT2. We cannot exclude that other factors, such as differences in amino acid metabolism, contribute to the differential vulnerability ensuing transporter deletion. In amino acid–rich media, HCC1806 breast cancer cells and 143B osteosarcoma cells grow to confluence in the absence of ASCT2. However, any further disruption of amino acid homeostasis reveals a greater vulnerability of HCC1806 cells compared with 143B cells. For instance, the combination of ASCT2ko, GCN2 inhibition by TAP20, and LAT1 inhibition by JPH203 completely halted growth of HCC1806 cells, whereas 143B cells could still grow (Fig. 8). LAT1 transports most essential amino acids, and the resilience against JPH203 in 143B ASCT2ko cells may be caused by up-regulation of LAT2 or nutrient import via macropinocytosis (31). Neither ASCT2wt cell line was sensitive to JPH203 alone, confirming previous data for HCC1806 cells (18) and refuting the notion that LAT1 is essential for signaling to mTORC1 (7). The combination of ASCT2ko, inhibition of GCN2, and silencing of SNAT1 completely halted growth in HCC1806 cells, which is consistent with our proposed model. Our model predicts that combined inhibition of an amino acid loader and a rescue transporter will cause significant vulnerability in a wide range of cancer cells. In a related approach, disturbing amino acid homeostasis by asparaginase treatment in combination with GCN2 inhibition was proposed for cancer cells with low asparaginase activity (32). Our data suggest that it appears meaningful to analyze which types of cancer cells display an integrated stress response already under nutrient-rich conditions, which will render them more susceptible to disruptions of amino acid homeostasis.
Figure 9.
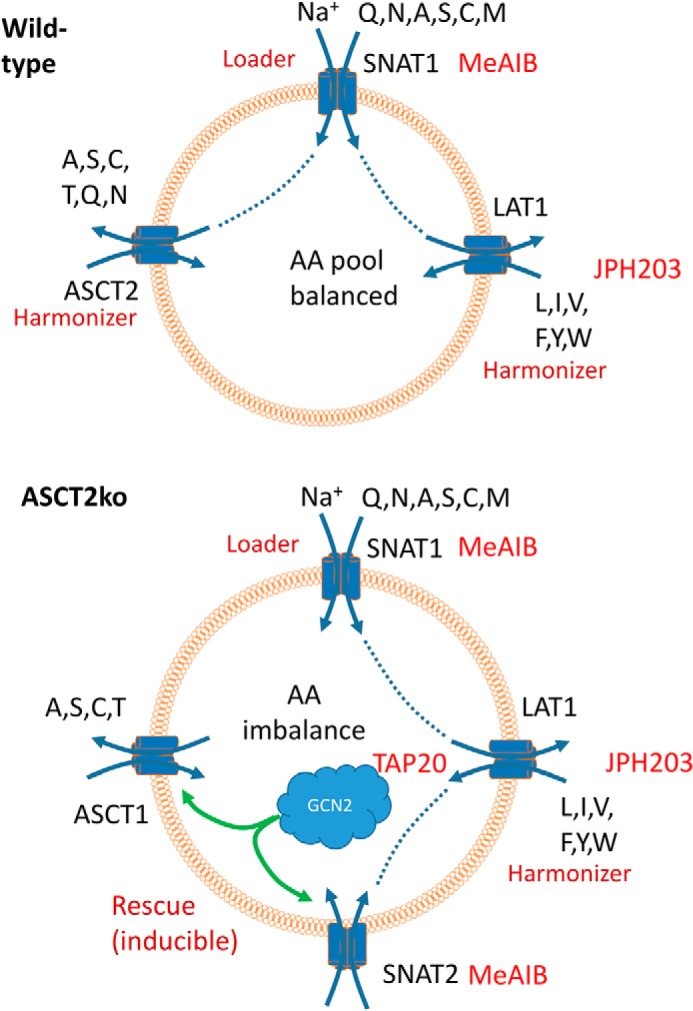
Model of neutral amino acid homeostasis. A, cancer cells express amino acid loaders, such as SNAT1, to accumulate nonessential amino acids, which are used as exchange substrates for amino acid harmonizers ASCT2 and LAT1, which are highly active in cancer cells. These rapidly harmonize all neutral amino acid pools. For clarity, only selected transporters are shown. B, deletion of ASCT2 causes an amino acid stress response that results in up-regulation of redundant rescue transporters, such as ASCT1 and SNAT2. Targets of inhibitors TAP20, JPH203, and MeAIB are shown.
The reagents used in this study, such as TAP20 and JPH203, are highly potent inhibitors of their proposed targets. TAP20 has similar potency to inhibit glycogen synthase kinase 3α/β (GSK3) (Table 2). GSK3β, in particular, is expressed in many cancer cell lines, and its inhibition is associated with activation of the canonical WNT/β-catenin pathway, which in turn has been shown to suppress cell growth (33). However, suppression of cell growth through this mechanism would require ASCT2ko (Fig. 8). JPH203 was developed as a specific inhibitor of LAT1 (34), which we confirmed in a recent study (22). However, the compound may inhibit transporter-unrelated targets. MeAIB is a well-known inhibitor of SNAT1 and SNAT2 (35), but as a proline analogue, it could cause off-target effects on other proline transporters.
Table 2.
Inhibition of selected protein kinases by TAP20
| Protein kinase | IC50 |
|---|---|
| nm | |
| GCN2 | 17 |
| CDK9/cycD1 | 180 |
| FLT1 | >3,000 |
| FLT3 | >3,000 |
| FYN | >3,000 |
| GSK3α | 1.7 |
| GSK3β | 12 |
| ITK | >3,000 |
| KDR | >3,000 |
| LCK | >3,000 |
| LYN | >3,000 |
| PKCθ | >3,000 |
| Aurora B | >3,000 |
GCN2, General control nonderepressible 2; CDK, Cyclin-depedent kinase; FLT, fms related tyrosine kinase; ITK, interleukin-2-inducible T-cell kinase; KDR, kinase insert domain receptor; LCK, lymphocyte cell-specific protein-tyrosine kinase; PKC, protein kinase C.
For the first time, we have also demonstrated a specific role for ASCT2 in cancer cells. We have previously demonstrated in 143B cells that ASCT2 did not provide glutamine for the glutaminolysis pathway, and its deletion did not affect mTORC1 signaling (12), as was previously proposed by Nicklin et al. (7). Similarly, ASCT2ko did not affect mTORC1 signaling in HCC1806 cells as shown here or in liver cancer cells as shown by Bothwell et al. (14). However, ASCT2 knockout enhanced glutamine dependence at low concentrations and had a distinct effect on cell migration in 143B cells. These data could explain the unique cancer-specific function of ASCT2 proposed by Cormerais et al. (15). Their experiments showed that ASCT2 was dispensable in LS147T (colon adenocarcinoma) and A549 (lung adenocarcinoma) cells in culture but reduced tumor growth in xenografts, particularly of those derived from A549 cells. This suggests that ASCT2 inhibition/knockout are either masked in nutrient-rich media or that the effects of ASCT2 knockout on migration may be more important in vivo. Due to its function as a harmonizer, ASCT2 acts as an indirect sensor of nutrient limitation, highlighting the role of microenvironmental conditions for cancer cell growth.
Experimental procedures
Reagents
The GCN2 inhibitor (1R,3R)-3-[3-(2-methyl-quinolin-6-yl)-3H-[1,2,3]triazolo[4,5-d]pyrimidin-5-ylamino]-cyclopentanecarboxylic acid amide was named TAP20 for the purpose of this study. The compound was developed and provided by Merck KGaA (Darmstadt, Germany) (36). The compound inhibits GCN2, GSK3α, and GSK3β, but does not inhibit other tested protein kinases (Table 2).
Cell lines and cell culture
Human thymidine kinase–negative osteosarcoma cells, 143B (TK−), were a gift from Dr. David Tscharke (John Curtin School of Medical Research, Australian National University), and human HCC1806 breast cancer cells were purchased from the American Type Culture Collection (ATCC). Both cell lines were cultured either in DMEM/Ham's F12 (Sigma, 6124; supplemented with 2 mm glutamine) or in BME (Thermo Fisher Scientific, 21010) supplemented with 0.5 mm glutamine and with 10% dialyzed FBS (Life Technologies) and nonessential amino acids (Table 1) at 37 °C in a humidified atmosphere of 5% CO2 in air. For subculturing, cells were detached by trypsinization (0.05 or 0.25% trypsin, EDTA; Gibco) and counted using a Scepter cell counter (Millipore) or a hemocytometer. All complete media for maintaining cells were supplemented with 2 mm l-glutamine (Gibco). Cell viability after trypsinization was generally ≥95% as evaluated by trypan blue exclusion.
Tumor spheroids
To generate a mother culture, a 75-cm2 culture dish was coated with 15 ml of 1% agarose in PBS/DMEM/F12. The dish was seeded with 30 × 106 cells in 20 ml of DMEM/F12 supplemented with different glutamine concentrations and 10% dialyzed FBS. Formation of cell aggregates was examined after 24 h by light microscopy. After spheroids started to form, they were transferred to a 50-ml Falcon tube. After 1–2 min, the supernatant, containing small spheroids, was transferred to a 500-ml spinner flask, and the media were topped up to 100 ml. The spinner flask was placed on a stirrer plate inside an incubator for at least 48 h. Media were renewed after 48 h, by replacing 75% of the spheroid supernatant. Tumor spheroid diameters were measured by microscopy.
Genomic mutation of the ASCT2 (SLC1A5) gene
A commercial CRISPR/Cas9 system was used (Sigma). Generation of ASCT2ko 143B cells was described recently (12), and the same method was used to mutate ASCT2 in HCC1806 cells. Briefly, the construct U6gRNA-pCMV-Cas9–2A-GFP contains a 22-bp guide RNA (cctcgaagcagtcaacctcccg), resulting in cleavage/repair of SLC1A5 in exon 7. An endotoxin-free preparation (Macherey and Nagel) of the plasmid was used for transfection of HCC1806 cells maintained in DMEM, Ham's F12, 10% FBS, 2 mm glutamine. Cells were seeded in a 60-mm dish and grown to 80% confluence. Immediately before transfection, cells were replenished with fresh DMEM, Ham's F12, 10% FBS, 2 mm glutamine. Plasmid DNA (4 μg) and 10 μl of Lipofectamine 2000 (Invitrogen) were separately incubated in 500 μl of Opti-MEM (Invitrogen) for 5 min at room temperature, before combining them and incubating for a further 20 min at room temperature to form transfection complexes. The complexes were then added dropwise to the cells, and the dishes were placed in an incubator at 37 °C and 5% CO2; media were refreshed after 6 h. After 48 h of expression, cells were trypsinized (0.25% trypsin, EDTA (Invitrogen)) and collected by centrifugation (500 × g) followed by three washes in Dulbecco's PBS supplemented with 5 mm glucose and 1% dialyzed FBS (Sigma). Cells were then passed through a cell strainer (70 μm; Corning), centrifuged, and suspended in PBS (pH 7.4) supplemented with 5 mm glucose and 1% dialyzed FBS. Single-cell sorting was performed using an ARIA II FACS machine (FACS Facility, The Australian National University) with GFP-channel intensity set at two different levels. Single cells were collected in 96-well plates containing DMEM, Ham's F12, 10% FBS, 2 mm glutamine and incubated for up to 3 weeks at 37 °C and 5% CO2. Established clones were trypsinized and seeded into 25-cm2 culture flasks (Corning) for further propagation. Inactivation of ASCT2 was verified by immunoblotting and genomic sequencing.
RNA silencing
Low passages (<20) of 143B cells were grown in DMEM/Ham's F12 (Sigma, D6241) medium supplemented with 10% FBS and 2 mm glutamine. On the day before transfection, cells were split and seeded in 35-mm cell culture dishes at 150,000–300,000 cells. Immediately before transfection the medium was renewed. For transfection (all volumes per dish) 4 μl of Lipofectamine RNAiMAX (Life Technologies) was combined with 250 μl of Opti-MEM (Life Technologies), and separately 30 pmol of the RNAi construct (Ambion Silencer Select Pre-designed siRNAs: EIF2AKA4, ID S54067; SLC38A1, ID S37592; ASCT1 ID, S12913 and S12914; Universal Negative Control Number 1 (Sigma) was used as a negative control siRNA) was combined with 250 μl of Opti-MEM. Both solutions were combined after 5 min and incubated for a further 20–30 min at room temperature before adding the transfection complexes dropwise to the cells. All transfections were performed in triplicates. Transfected cells were incubated at 37 °C and 5% CO2 for 4–6 h, after which the medium was replaced with fresh DMEM, Ham's F12, 10% FBS, 2 mm glutamine. Western blotting was performed after 48 h unless stated otherwise. For growth assays, transfected cells were detached by trypsin treatment and seeded at 4,000–5,000 cells/well.
Growth and migration assays
For growth assays, HCC1806 and 143B cells were seeded into 96-well culture plates at 4,000–5,000 cells/well and kept in DMEM, Ham's F12, 10% FBS or in BME, 10% dialyzed FBS supplemented with 0.5 or 2 mm glutamine. Cell proliferation was measured with an IncuCyte FLR system (Essen BioScience) using a scan interval of 3 h. IncuCyte data are shown as cell confluence (mean ± S.E.) at set intervals. For migration, cells were seeded at 35,000–40,000 cells/well of an image lock plate (Essen Bioscience) in DMEM, Ham's F12, 10% FBS (Sigma, D8473; 2 mm glutamine). After reaching confluence, media were removed, and cells were washed twice with DMEM/F12 (Sigma, D6421; glutamine-free, no FBS). Cells were then incubated for 24 h in DMEM/F12 (Sigma, D6421) supplemented with 0.3% FBS. A scratch tool was used to remove cells followed by two washing steps with DMEM/F12 (Sigma, D6421; glutamine-free, no FBS). Migration was observed for 28 h in DMEM/F12 (Sigma, D6421) supplemented with 0.3% FBS and different glutamine concentrations using a scan every 3 h.
Tumor xenografts
Animal experiments were approved by the Sydney Local Health District Animal Welfare Committee (Protocol Number 2013-030). ASCT2wt and ASCT2ko 143B cells were suspended in a solution of ice-cold 50:50 Matrigel:Hanks' balanced salt solution (final concentration, 0.5 × 10⁶ cells/100 μl), and 100 μl was injected subcutaneously into the right flanks of anesthetized 8–12-week-old female athymic nu/nu mice (Animal Resource Centre, Perth, Australia), five mice per group in three separate experiments. Tumors were measured three times per week using digital calipers, and tumor volume was calculated using the following equation: d1 × d22 × π/6 where d1 and d2 refer to diameter measurements taken in two dimensions perpendicular to each other. Mice were euthanized as a group when the tumor burden of any one mouse reached ∼1,000 mm3, with tumors removed and weighed.
Cultrex 3D spheroid invasion assay
This assay was performed using a commercial system (Trevigen). Initially, 143B ASCT2wt and ASCT2ko cells were seeded in 1× spheroid formation medium (extracellular matrix) (3000 cells/well in 50 μl) into low-adhesion, round-bottom 96-well plates to induce formation of spheroids. The plates were centrifuged at 300 × g for 3 min to position cells at the bottom of the well. Working on ice, 50 μl of invasion matrix was added to the spheroids after 72 h. Subsequently, plates were centrifuged at 300 × g at 4 °C to position the spheroids at the bottom of their wells. Gel formation was initiated by incubation at 37 °C for 1 h followed by addition of 100 μl of prewarmed culture medium. Plates were then incubated at 37 °C and 5% CO2 in a humidified incubator for 3–6 days, and images were taken with a Leica M205FA stereomicroscope. Invasion perimeter area was measured using the Leica Application Suite, version 4.12.
Protein kinase assays
GCN2 activity was determined by incubating GCN2 (30 nm) with 10 μm ATP and 80 nm GFP-labeled eIF2α at room temperature in reaction buffer (50 mm HEPES, pH 7.0, 10 mm MgCl2, 5 mm MnCl2, 0.1% BSA, 1% DMSO, 2 mm DTT). The reaction was stopped by addition of EDTA. Phosphorylated eIF2α was detected by a terbium chelate–labeled phospho-eIF2α antibody. Binding of the antibody generates a ratiometric FRET signal (340/495/520 nm), which is proportional to GCN2 activity (Lanthascreen). The IC50 values for other kinases were determined using the KinaseProfilerTM at Millipore (Eurofins).
Amino acid flux assays
All flux assays were performed in a water bath at 37 °C as described previously (25) with some modifications. Briefly, cells were grown to confluence in 35-mm culture dishes. For Na+-dependent transport, Hanks' balanced salt solution (136.6 mm NaCl, 5.4 mm KCl, 2.7 mm Na2HPO4, 1.3 mm CaCl2, 0.5 mm MgCl2, 0.44 mm KH2PO4, 0.41 mm MgSO4, 5 mm HEPES, pH 7.5) supplemented with 5 mm glucose was used. For Na+-independent transport, NaCl was substituted with N-methyl-d-glucamine chloride, and sodium phosphate was substituted with potassium phosphate. l-[U-14C]glutamine (1.85 MBq/ml, 9.26 GBq/mmol; PerkinElmer Life Sciences) and l-[U-14C]alanine (1.85 MBq/ml, 9.26 GBq/mmol; PerkinElmer Life Sciences) were used at ∼2,000 dpm/nmol with unlabeled l-amino acid adjusted to 100 μm final concentration. Transport rates were normalized to the amount of cell-derived protein measured by Bradford assay (Sigma). Uptake rates were expressed as mean ± S.D., and statistical differences were evaluated by ANOVA.
Preparation of cell homogenates and surface biotinylation
Cells were grown to ∼80% confluence in 100-mm culture dishes in DMEM/F12, 10% FBS, 2 mm glutamine before the monolayer was gently washed thrice with ice-cold PBS, pH 7.4. Cells were kept on ice at all times. To lyse the cells, 500 μl radioimmune precipitation assay lysis buffer (Sigma) supplemented with the EDTA-free protease inhibitor Pefabloc (Roche Applied Science) was added, and the cells were collected with a cell scraper. The lysate was transferred to a reaction tube and incubated on ice for 15 min before homogenization in an Omni Pro200 for 20 s. The samples were incubated on ice for an additional 15 min before centrifugation at 13,000 × g for 5 min at 4 °C. Supernatants were collected, and protein determined using a Bradford assay. Homogenate aliquots of 50–100 μg were loaded onto a polyacrylamide gel (Invitrogen). After electrophoresis, proteins were transferred onto nitrocellulose membranes for immunodetection.
For surface biotinylation, cells were grown in 60-mm dishes and washed thrice in 5 ml of modified PBS (supplemented with 1 mm CaCl2, 0.6 mm MgCl2, pH 8.0). Cells were then covered with 2 ml of 0.5 mg/ml EZ-link Sulfo-NHS-lc-Biotin (Thermo Fisher Scientific) in modified PBS, pH 8.0, and incubated for 30 min at room temperature on a rotary shaker at low speed. Biotinylation was terminated by washing thrice in modified PBS supplemented with 100 mm glycine, pH 8.0. Cells were scraped, collected in a 1.5-ml reaction tube, and lysed by addition of 1 ml of 150 mm NaCl, 1% Triton X-100, 20 mm Tris-HCl, pH 7.5. The homogenate was incubated on ice for 1.5 h to complete lysis. Subsequently, the lysate was centrifuged at 13,000 × g in a table-top centrifuge for 10 min, and the supernatant was transferred to a new tube. After protein determination, equal amounts of cell lysate were added to 150 μl of high-capacity streptavidin-agarose beads (Thermo Fisher Scientific). Beads were incubated overnight at 4 °C on a rotary shaker before washing four times in lysis buffer. The streptavidin-agarose slurry was mixed with protein sample buffer and reducing reagent. After boiling for 5 min, 40-μl samples were loaded onto a polyacrylamide gel. After electrophoresis, proteins were transferred onto nitrocellulose for immunodetection.
SDS-PAGE and Western blotting
To prepare the protein samples for SDS-PAGE, 50–100 μg of total protein was mixed with 4× lithium dodecyl sulfate sample buffer (Invitrogen) and 10× reducing agent (Invitrogen) and made up to a final volume of 20 μl using deionized water. Homogenized samples were then incubated at 70 °C for 10 min before being loaded on the gel. Electrophoresis was performed using 4–12% Bis-Tris polyacrylamide NuPAGE® gels (Invitrogen) in an XCell SureLock® Mini-Cell (Invitrogen) under reducing conditions according to standard procedures. The SeeBlue Plus 2 prestained protein ladder (Invitrogen) was used to estimate the apparent molecular weight of proteins. Following SDS-PAGE, proteins were transferred onto nitrocellulose membranes (GE Healthcare) using the Mini Trans-Blot Electrophoretic Transfer Cell (Bio-Rad) according to standard protocols. Blots were blocked for 2 h at room temperature (or overnight at 4 °C) in 50 ml of 10% (w/v) skim milk in PBS, pH 7.4, with 0.15% Tween 20 (PBS-T). After washing thrice in PBS-T for 10 min each, the blots were incubated with the primary antibody for 2 h or overnight in 5 ml of skim milk (2%, w/v) in PBS-T at dilutions listed in Table 3. Excess primary antibody was removed by washing thrice in PBS-T. Blots were incubated with 5 ml of diluted secondary antibody for 2 h. After washing thrice in PBS-T and a final rinse in PBS, immunoreactive bands were detected by enhanced chemiluminescence using Luminata Crescendo or Luminata Forte Western HRP Substrate (Millipore Merck). For reprobing, the same blots were incubated for 30 min at 70 °C in 50 ml of stripping buffer (62.5 mm Tris-HCl, pH 6.8, 2% SDS,100 mm 2-mercaptoethanol). Membranes were then washed thrice with PBS-T and blocked for 3 h using 10% (w/v) skim milk in PBS-T before reprobing with the next antibody as described above.
Table 3.
Source of antibodies and dilution for Western blotting
HRP, horseradish peroxidase; rpS6, ribosomal protein S6.
| Target | Manufacturer | Dilution | Molecular weight × 103 |
|---|---|---|---|
| ASCT1 (SLC1A4) | Cell Signaling Technology | 1:500 | 60–80 |
| ASCT2 (SLC1A5) | Cell Signaling Technology (D7C12) | 1:2,000 | 49–75 |
| SNAT1 (SLC38A1) | Millipore | 1:2,000 | 54 |
| SNAT2 (SLC38A2) | Abcam | 1:2,000 | 56 |
| LAT1 (SLC7A5) | Cell Signaling Technology | 1:1,000 | 39 |
| 4EBP1 | Cell Signaling Technology | 1:1,000 | 15–20 |
| Phospho-4EBP1 (Thr-37/46) | Cell Signaling Technology | 1:1,000 | 15–20 |
| eIF2a | Cell Signaling Technology | 1:1,000 | 38 |
| Phospho-eIF2a (Ser-51) | Cell Signaling Technology | 1:1,000 | 38 |
| rpS6 | Cell Signaling Technology | 1:1,000 | 32 |
| Phospho-rpS6 (Ser-240/244) | Cell Signaling Technology | 1:1,000 | 32 |
| ATF4 | Cell Signaling Technology | 1:1,000 | 49 |
| FAK | Cell Signaling Technology | 1:1,000 | 125 |
| MLC | Cell Signaling Technology | 1:1,000 | 18 |
| Phospho-MLC (Ser-19) | Cell Signaling Technology | 1:1,000 | 18 |
| Na/K-ATPase | Abcam | 1: 7,500 | 113 |
| Actin | Cell Signaling Technology | 1:5,000 | 45 |
| Rabbit IgG (HRP conjugate) | GE Healthcare | 1:1,000–1:10,000 | |
| Mouse IgG (HRP conjugate) | Cell Signaling Technology | 1:5,000–1:10,000 |
Statistical analysis
Numerical results are either reported as raw data (scatter plots, box-whisker plots) or as average data (mean ± S.D.). The number of repeats (n) used for the statistical analysis is stated in the figure legends. Cells were seeded from at least three different starting cultures to provide biological repeats. Statistical analysis of differences was computed by Student's t test when two groups were compared or by ANOVA if more than two groups were compared. Comparison of two groups in larger assemblies were made by post hoc tests. p values are reported in the figures.
Author contributions
A. B., M. v. G., D. D., A. W., and J. H. resources; A. B., G. G.-C., F. R., M. v. G., D. D., and S. B. data curation; A. B., G. G.-C., F. R., M. v. G., A. W., J. H., and S. B. formal analysis; A. B. validation; A. B., G. G.-C., F. R., M. v. G., D. D., A. W., and J. H. investigation; A. B., G. G.-C., F. R., M. v. G., A. W., and J. H. visualization; A. B. methodology; A. B., G. G.-C., F. R., M. v. G., D. D., A. W., J. H., and S. B. writing-review and editing; A. W., J. H., and S. B. funding acquisition; S. B. conceptualization; S. B. supervision; S. B. writing-original draft; S. B. project administration.
Acknowledgments
We thank Ralph Lindemann and Dirk Vocke (both from Merck KGaA, Darmstadt, Germany) for fruitful discussions on the mechanism and use of the GCN2 inhibitors and for providing a collaborative atmosphere for the project. Rajini Nagarajah helped with the animal experiments.
This work was supported in part by a Merck KGaA speed grant (to S. B.), Australian Research Council Discovery Project Grant DP180101702 (to S. B.), and Cancer Council New South Wales Grants RG17-04 and RG18-06 (to J. H.). The authors declare that they have no conflicts of interest with the contents of this article.
- SLC1A5
- solute carrier family 1 member 5
- SNAT
- sodium neutral amino acid transporter
- LAT1
- l-type amino acid transporter 1
- AARE
- amino acid response element
- BME
- basal medium Eagle
- GPNA
- γ-glutamyl-p-nitroanilide
- DMEM
- Dulbecco's modified Eagle's medium
- FBS
- fetal bovine serum
- MeAIB
- N-methylaminoisobutyric acid
- EGFR
- epidermal growth factor receptor
- ko
- knockout
- ROCK
- Rho-associated protein kinase
- TAP20
- (1R,3R)-3-[3-(2-methyl-quinolin-6-yl)-3H-[1,2,3]triazolo[4,5-d]pyrimidin-5-ylamino]-cyclopentanecarboxylic acid amide
- FAK
- focal adhesion kinase
- MLC
- myosin light chain
- GSK3
- glycogen synthase kinase 3
- ANOVA
- analysis of variance
- Bis-Tris
- 2-[bis(2-hydroxyethyl)amino]-2-(hydroxymethyl)propane-1,3-diol.
References
- 1. Bröer S., and Bröer A. (2017) Amino acid homeostasis and signalling in mammalian cells and organisms. Biochem. J. 474, 1935–1963 10.1042/BCJ20160822 [DOI] [PMC free article] [PubMed] [Google Scholar]
- 2. Hosios A. M., Hecht V. C., Danai L. V., Johnson M. O., Rathmell J. C., Steinhauser M. L., Manalis S. R., and Vander Heiden M. G. (2016) Amino acids rather than glucose account for the majority of cell mass in proliferating mammalian cells. Dev. Cell 36, 540–549 10.1016/j.devcel.2016.02.012 [DOI] [PMC free article] [PubMed] [Google Scholar]
- 3. Fuchs B. C., and Bode B. P. (2005) Amino acid transporters ASCT2 and LAT1 in cancer: partners in crime? Semin. Cancer Biol. 15, 254–266 10.1016/j.semcancer.2005.04.005 [DOI] [PubMed] [Google Scholar]
- 4. Bhutia Y. D., Babu E., Ramachandran S., and Ganapathy V. (2015) Amino acid transporters in cancer and their relevance to “glutamine addiction”: novel targets for the design of a new class of anticancer drugs. Cancer Res. 75, 1782–1788 10.1158/0008-5472.CAN-14-3745 [DOI] [PubMed] [Google Scholar]
- 5. Wang Q., and Holst J. (2015) L-type amino acid transport and cancer: targeting the mTORC1 pathway to inhibit neoplasia. Am. J. Cancer Res. 5, 1281–1294 [PMC free article] [PubMed] [Google Scholar]
- 6. Scalise M., Galluccio M., Console L., Pochini L., and Indiveri C. (2018) The human SLC7A5 (LAT1): the intriguing histidine/large neutral amino acid transporter and its relevance to human health. Front. Chem. 6, 243 10.3389/fchem.2018.00243 [DOI] [PMC free article] [PubMed] [Google Scholar]
- 7. Nicklin P., Bergman P., Zhang B., Triantafellow E., Wang H., Nyfeler B., Yang H., Hild M., Kung C., Wilson C., Myer V. E., MacKeigan J. P., Porter J. A., Wang Y. K., Cantley L. C., et al. (2009) Bidirectional transport of amino acids regulates mTOR and autophagy. Cell 136, 521–534 10.1016/j.cell.2008.11.044 [DOI] [PMC free article] [PubMed] [Google Scholar]
- 8. Wang Q., Hardie R. A., Hoy A. J., van Geldermalsen M., Gao D., Fazli L., Sadowski M. C., Balaban S., Schreuder M., Nagarajah R., Wong J. J., Metierre C., Pinello N., Otte N. J., Lehman M. L., et al. (2015) Targeting ASCT2-mediated glutamine uptake blocks prostate cancer growth and tumour development. J. Pathol. 236, 278–289 10.1002/path.4518 [DOI] [PMC free article] [PubMed] [Google Scholar]
- 9. van Geldermalsen M., Wang Q., Nagarajah R., Marshall A. D., Thoeng A., Gao D., Ritchie W., Feng Y., Bailey C. G., Deng N., Harvey K., Beith J. M., Selinger C. I., O'Toole S. A., Rasko J. E., et al. (2016) ASCT2/SLC1A5 controls glutamine uptake and tumour growth in triple-negative basal-like breast cancer. Oncogene 35, 3201–3208 10.1038/onc.2015.381 [DOI] [PMC free article] [PubMed] [Google Scholar]
- 10. Hassanein M., Hoeksema M. D., Shiota M., Qian J., Harris B. K., Chen H., Clark J. E., Alborn W. E., Eisenberg R., and Massion P. P. (2013) SLC1A5 mediates glutamine transport required for lung cancer cell growth and survival. Clin. Cancer Res. 19, 560–570 10.1158/1078-0432.CCR-12-2334 [DOI] [PMC free article] [PubMed] [Google Scholar]
- 11. Esslinger C. S., Cybulski K. A., and Rhoderick J. F. (2005) Nγ-Aryl glutamine analogues as probes of the ASCT2 neutral amino acid transporter binding site. Bioorg. Med. Chem. 13, 1111–1118 10.1016/j.bmc.2004.11.028 [DOI] [PubMed] [Google Scholar]
- 12. Bröer A., Rahimi F., and Bröer S. (2016) Deletion of amino acid transporter ASCT2 (SLC1A5) reveals an essential role for transporters SNAT1 (SLC38A1) and SNAT2 (SLC38A2) to sustain glutaminolysis in cancer cells. J. Biol. Chem. 291, 13194–13205 10.1074/jbc.M115.700534 [DOI] [PMC free article] [PubMed] [Google Scholar]
- 13. Fuchs B. C., Perez J. C., Suetterlin J. E., Chaudhry S. B., and Bode B. P. (2004) Inducible antisense RNA targeting amino acid transporter ATB0/ASCT2 elicits apoptosis in human hepatoma cells. Am. J. Physiol. Gastrointest. Liver Physiol. 286, G467–G478 10.1152/ajpgi.00344.2003 [DOI] [PubMed] [Google Scholar]
- 14. Bothwell P. J., Kron C. D., Wittke E. F., Czerniak B. N., and Bode B. P. (2018) Targeted suppression and knockout of ASCT2 or LAT1 in epithelial and mesenchymal human liver cancer cells fail to inhibit growth. Int. J. Mol. Sci. 19, E2093 10.3390/ijms19072093 [DOI] [PMC free article] [PubMed] [Google Scholar]
- 15. Cormerais Y., Massard P. A., Vucetic M., Giuliano S., Tambutté E., Durivault J., Vial V., Endou H., Wempe M. F., Parks S. K., and Pouyssegur J. (2018) The glutamine transporter ASCT2 (SLC1A5) promotes tumor growth independently of the amino acid transporter LAT1 (SLC7A5). J. Biol. Chem. 293, 2877–2887 10.1074/jbc.RA117.001342 [DOI] [PMC free article] [PubMed] [Google Scholar]
- 16. Hassanein M., Qian J., Hoeksema M. D., Wang J., Jacobovitz M., Ji X., Harris F. T., Harris B. K., Boyd K. L., Chen H., Eisenberg R., and Massion P. P. (2015) Targeting SLC1a5-mediated glutamine dependence in non-small cell lung cancer. Int. J. Cancer 137, 1587–1597 10.1002/ijc.29535 [DOI] [PMC free article] [PubMed] [Google Scholar]
- 17. Ren P., Yue M., Xiao D., Xiu R., Gan L., Liu H., and Qing G. (2015) ATF4 and N-Myc coordinate glutamine metabolism in MYCN-amplified neuroblastoma cells through ASCT2 activation. J. Pathol. 235, 90–100 10.1002/path.4429 [DOI] [PubMed] [Google Scholar]
- 18. van Geldermalsen M., Quek L. E., Turner N., Freidman N., Pang A., Guan Y. F., Krycer J. R., Ryan R., Wang Q., and Holst J. (2018) Benzylserine inhibits breast cancer cell growth by disrupting intracellular amino acid homeostasis and triggering amino acid response pathways. BMC Cancer 18, 689 10.1186/s12885-018-4599-8 [DOI] [PMC free article] [PubMed] [Google Scholar]
- 19. Chiu M., Sabino C., Taurino G., Bianchi M. G., Andreoli R., Giuliani N., and Bussolati O. (2017) GPNA inhibits the sodium-independent transport system L for neutral amino acids. Amino Acids 49, 1365–1372 10.1007/s00726-017-2436-z [DOI] [PubMed] [Google Scholar]
- 20. Schulte M. L., Khodadadi A. B., Cuthbertson M. L., Smith J. A., and Manning H. C. (2016) 2-Amino-4-bis(aryloxybenzyl)aminobutanoic acids: a novel scaffold for inhibition of ASCT2-mediated glutamine transport. Bioorg. Med. Chem. Lett. 26, 1044–1047 10.1016/j.bmcl.2015.12.031 [DOI] [PMC free article] [PubMed] [Google Scholar]
- 21. Schulte M. L., Fu A., Zhao P., Li J., Geng L., Smith S. T., Kondo J., Coffey R. J., Johnson M. O., Rathmell J. C., Sharick J. T., Skala M. C., Smith J. A., Berlin J., Washington M. K., et al. (2018) Pharmacological blockade of ASCT2-dependent glutamine transport leads to antitumor efficacy in preclinical models. Nat. Med. 24, 194–202 10.1038/nm.4464 [DOI] [PMC free article] [PubMed] [Google Scholar]
- 22. Bröer A., Fairweather S., and Bröer S. (2018) Disruption of amino acid homeostasis by novel ASCT2 inhibitors involves multiple targets. Front. Pharmacol. 9, 785 10.3389/fphar.2018.00785 [DOI] [PMC free article] [PubMed] [Google Scholar]
- 23. Suzuki M., Toki H., Furuya A., and Ando H. (2017) Establishment of monoclonal antibodies against cell surface domains of ASCT2/SLC1A5 and their inhibition of glutamine-dependent tumor cell growth. Biochem. Biophys. Res. Commun. 482, 651–657 10.1016/j.bbrc.2016.11.089 [DOI] [PubMed] [Google Scholar]
- 24. Lu H., Li X., Lu Y., Qiu S., and Fan Z. (2016) ASCT2 (SLC1A5) is an EGFR-associated protein that can be co-targeted by cetuximab to sensitize cancer cells to ROS-induced apoptosis. Cancer Lett. 381, 23–30 10.1016/j.canlet.2016.07.020 [DOI] [PMC free article] [PubMed] [Google Scholar]
- 25. Deitmer J. W., Bröer A., and Bröer S. (2003) Glutamine efflux from astrocytes is mediated by multiple pathways. J. Neurochem. 87, 127–135 10.1046/j.1471-4159.2003.01981.x [DOI] [PubMed] [Google Scholar]
- 26. Kallinowski F., Runkel S., Fortmeyer H. P., Förster H., and Vaupel P. (1987) L-Glutamine: a major substrate for tumor cells in vivo? J. Cancer Res. Clin. Oncol. 113, 209–215 10.1007/BF00396375 [DOI] [PMC free article] [PubMed] [Google Scholar]
- 27. Kilberg M. S., Shan J., and Su N. (2009) ATF4-dependent transcription mediates signaling of amino acid limitation. Trends Endocrinol. Metab. 20, 436–443 10.1016/j.tem.2009.05.008 [DOI] [PMC free article] [PubMed] [Google Scholar]
- 28. Mackenzie B., and Erickson J. D. (2004) Sodium-coupled neutral amino acid (system N/A) transporters of the SLC38 gene family. Pflugers Arch. 447, 784–795 10.1007/s00424-003-1117-9 [DOI] [PubMed] [Google Scholar]
- 29. Dorsch D., Wegener A., Hölzemann G., Busch M., Calderini M., and Pöschke O. (2016) Triazolopyrimidine derivatives as the first potent and selective inhibitors of the kinase GCN2, in American Chemical Society Meeting, Philadelphia, August 21–25, 2016, Abstract Medi 44, American Chemical Society, Washington, D. C. [Google Scholar]
- 30. Kilberg M. S., Balasubramanian M., Fu L., and Shan J. (2012) The transcription factor network associated with the amino acid response in mammalian cells. Adv. Nutr. 3, 295–306 10.3945/an.112.001891 [DOI] [PMC free article] [PubMed] [Google Scholar]
- 31. Commisso C., Davidson S. M., Soydaner-Azeloglu R. G., Parker S. J., Kamphorst J. J., Hackett S., Grabocka E., Nofal M., Drebin J. A., Thompson C. B., Rabinowitz J. D., Metallo C. M., Vander Heiden M. G., and Bar-Sagi D. (2013) Macropinocytosis of protein is an amino acid supply route in Ras-transformed cells. Nature 497, 633–637 10.1038/nature12138 [DOI] [PMC free article] [PubMed] [Google Scholar]
- 32. Nakamura A., Nambu T., Ebara S., Hasegawa Y., Toyoshima K., Tsuchiya Y., Tomita D., Fujimoto J., Kurasawa O., Takahara C., Ando A., Nishigaki R., Satomi Y., Hata A., and Hara T. (2018) Inhibition of GCN2 sensitizes ASNS-low cancer cells to asparaginase by disrupting the amino acid response. Proc. Natl. Acad. Sci. U.S.A. 115, E7776–E7785 10.1073/pnas.1805523115 [DOI] [PMC free article] [PubMed] [Google Scholar]
- 33. Chen E. Y., DeRan M. T., Ignatius M. S., Grandinetti K. B., Clagg R., McCarthy K. M., Lobbardi R. M., Brockmann J., Keller C., Wu X., and Langenau D. M. (2014) Glycogen synthase kinase 3 inhibitors induce the canonical WNT/β-catenin pathway to suppress growth and self-renewal in embryonal rhabdomyosarcoma. Proc. Natl. Acad. Sci. U.S.A. 111, 5349–5354 10.1073/pnas.1317731111 [DOI] [PMC free article] [PubMed] [Google Scholar]
- 34. Oda K., Hosoda N., Endo H., Saito K., Tsujihara K., Yamamura M., Sakata T., Anzai N., Wempe M. F., Kanai Y., and Endou H. (2010) L-type amino acid transporter 1 inhibitors inhibit tumor cell growth. Cancer Sci. 101, 173–179 10.1111/j.1349-7006.2009.01386.x [DOI] [PMC free article] [PubMed] [Google Scholar]
- 35. Bröer S. (2014) The SLC38 family of sodium-amino acid co-transporters. Pflugers Arch. 466, 155–172 10.1007/s00424-013-1393-y [DOI] [PubMed] [Google Scholar]
- 36. Dorsch D., Hölzemann G., Calderini M., Wegener A., and Pöschke O. (September 12, 2014) Triazolo[4,5-d]pyrimidine Derivatives for the Treatment of Diseases Such as Cancer. International Patent WO/2014/135244