

ABSTRACT
Oncology treatment has been revolutionized by the introduction of immune checkpoint inhibitor drugs, which enable 20–40% of patients to generate anti-tumor immune responses. Combination treatment approaches with chemotherapeutic drugs may enable responses in the remaining patient cohorts. In this regard, a handful of drugs are promising due to their ability to induce immunogenic cell death in target cells. However, these agents are systemically delivered and indiscriminately cytotoxic to proliferating cells. By contrast, antibody-drug conjugates can selectively deliver a cytotoxic payload to a tumor, sparing most healthy cells. The ability of antibody-drug conjugates to induce immunogenic cell death in target cells has not yet been determined, although preclinical in vivo studies suggest this possibility. Here, we describe for the first time production of the in vitro hallmarks of immunogenic cell death – ecto-calreticulin and secreted ATP and HMGB1 protein – by cells in response to treatment with antibody-drug conjugates bearing a maytansine payload.
KEYWORDS: Immunogenic cell death, antibody-drug conjugate, ADC, maytansine, immunooncology
Introduction
The cancer clinical landscape has changed dramatically since the 2003 publication of the human reference genome sequence. Those data and the advances in sequencing technologies that soon followed led to the discovery of many new therapeutic targets for oncology drug development.1 Today, the promise of precision medicine – treatment guided in part by a tumor’s expression of predictive biomarkers – is within sight for many patients.2-4 These include cytotoxic molecules that directly kill tumor cells, and immune-modulating molecules that indirectly control malignancies through activation of an anti-tumor immune response.
Of the directly-cytotoxic targeted therapeutics, the research and pharmaceutical communities have focused much attention on antibody-drug conjugates, which offer the promise of improved anti-cancer efficacy with reduced side effects and toxicities.5 This potential arises through the targeted delivery of a cytotoxic small molecule payload conjugated to an antibody specific for a cell surface tumor antigen (Figure 1). Upon engagement of its antigen at the cell surface, the antibody-drug conjugate is internalized into the tumor cell, degraded in the lysosome, and the cytotoxic payload is released to mediate cell death. Four antibody-drug conjugates have now achieved FDA approval, with many more in clinical trials.5,9
Figure 1.

Temporal sequences of events define both an antibody-drug conjugate’s activity and the process of immunogenic cell death.
(Top, A-D) An antibody-drug conjugate comprises a monoclonal antibody that specifically-recognizes a tumor-associated cell surface antigen connected by a chemical linker to a cytotoxic small molecule payload (star). (a) The antibody-drug conjugate binds to its cognate antigen at the tumor cell surface and is internalized. (b and c) Intracellular trafficking through the endosomal-lysosomal pathway leads to eventual degradation in the lysosome. (c and d) The released cytotoxic payload escapes from the lysosome, binds to its target in the cytosol or nucleus, and initiates cell death.(Bottom, e–i) Upon exposure to an ICD-inducing treatment (e), target cells initiate a spatiotemporal sequence of events that – in an immunocompetent host – culminates in the generation of a durable immune response. (f) Early on, still viable cells with intact plasma membranes translocate calreticulin to their cell surface. There it acts as a phagocytic signal for dendritic cells and other professional antigen presenting cells. (g) Subsequently, as the treated target cells undergo apoptosis, they secrete ATP, which functions as a chemoattractant promoting the recruitment (white arrows) of immune cells and the release of proinflammatory cytokines. (h) Finally, as target cell membranes permeabilize during secondary necrosis, HMGB1 is released further promoting local immune cell recruitment (white arrows) and mediating proinflammatory effects by binding a number of immune receptors. (i) Dendritic cells mature and engage with CD4+ and CD8+ T cells, leading to cytotoxic T lymphocytes (CTLs) with specificity for the target cells. Importantly, the in vitro induction of these three damage associated molecular patterns (DAMPs) has been shown to predict a drug’s ability to elicit ICD and has been used as the basis of high throughput screens to find ICD-inducing small molecules.6-8
Of the immune-modulating drugs, the most promising and dominant class is the immune checkpoint inhibitors, prominently represented by anti-PD-1/PD-L1 and CTLA-4 reagents. These drugs are monoclonal antibodies that bind to inhibitory cell surface antigens generally found on immune cells (CTLA-4 and PD-1) or tumors (PD-L1). Therapeutic antibody binding to the receptors relieves the related inhibitory signals, allowing an immune response to proceed against tumor cells. Patients who respond to these therapies can achieve remarkable results, success that is evidenced by the rapid incorporation of immune checkpoint inhibitors into the clinical arsenal. To date, six independent immune checkpoint inhibitor drugs have received FDA approval, together addressing eight mostly solid tumor-based indications.10
Despite this progress, 60–80% of patients treated with immune checkpoint inhibitor drugs fail to respond.11,12 Although the biology underlying this primary resistance is not yet fully understood, it is thought to reflect a generally immunosuppressive tumor microenvironment, where the balance of signals tips towards immune tolerance. Combination treatments, where patients receive both chemotherapy and an immune checkpoint inhibitor, may improve overall response rates. Over 200 clinical trials are underway investigating this possibility.13 Early results suggest that combination approaches can offer improved responses relative to chemotherapy alone;14 however, it is not yet clear whether combination treatments are superior relative to immune checkpoint inhibitor treatment alone. Considering that some chemotherapeutic drugs promote an anti-tumor immune response by stimulating neoantigen production, changing the cytokine milieu within the tumor microenvironment, and promoting immunogenic cell death (ICD), there is a strong rationale that chemotherapy/immune checkpoint inhibitor combinations will demonstrate synergistic effects to control disease.13
Chemotherapeutics exhibiting an ability to induce ICD are of particular interest for combination treatments.1,15,16 ICD denotes a spatiotemporal sequence of events executed by a dying cell, which – in the context of an immunocompetent host – results in the recruitment and activation of antigen-presenting cells and T cells, and the establishment of long-term anti-tumoral immunity.2-4,17 This process, one consequence of which is the infiltration of T cells into the tumor microenvironment, can sensitize otherwise refractory tumors to treatment with immune checkpoint inhibitor drugs in mouse models.5,18 Although ICD-inducing drugs represent <10% of all FDA approved chemotherapeutics,5,6,9 most of the small molecule cytotoxic payloads used in antibody-drug conjugates – including the maytansine-derivative, ansamitocin P3, monomethylauristatin E (MMAE), tubulysin, and pyrrolobenzodiazepine (PBD) – have been shown to activate dendritic cells and enhance the anti-tumor efficacy of immune checkpoint inhibitors in animal models.10,19-22
While the immunostimulatory capacity of antibody-drug conjugates has now been well-established, the mechanisms underlying this activity have not yet been elucidated. Here, we examined tumor cell response to antibody-drug conjugate treatment by using a set of in vitro markers as a surrogate indication of ICD induction: cell-surface exposed calreticulin, extracellular ATP, and high mobility group box 1 (HMGB1) secretion.7,11,12 By using molecules bearing the same cytotoxic payload but with different target specificities, we explored the effects of using targeted and non-targeted antibody-drug conjugates, where each construct reciprocally served as an isotype control for the other. The results indicated that antibody-drug conjugates can selectively elicit hallmarks of ICD on target antigen-expressing cells but not antigen-negative cells.
Results and discussion
Although the recruitment of the immune system and the establishment of anti-tumor immunity can only be definitively demonstrated in vivo, ICD is characterized by the release of immunostimulatory damage-associated molecular patterns (DAMPs, Figure 1), which can be measured in vitro.6-8,13
In this work, we explored the effects caused by antibody-drug conjugate-mediated intracellular delivery of the anti-microtubule compound, maytansine. An antibody-drug conjugate comprises an antibody with specificity towards a particular cell surface cancer antigen, a cytotoxic small molecule payload, and a chemical linker joining the two together (Figure 1). Here, our antibody-drug conjugates carried a maytansine payload ligated through a noncleavable linker.14,23 This moiety was conjugated site-specifically to the C-terminus of αHER2 and αCD79b antibody heavy chains using aldehyde tag technology.13,24-26 We selected these two target antigens because their expression tends to be non-overlapping on human cell lines. Thus, each construct could serve as an isotype control for the other, lending additional confidence to our results.
Guided by the pioneering work of Zitvogel, Kroemer, and their colleagues, we set out to assess the in vitro ICD potential of our antibody-drug conjugates using established protocols for the detection of three DAMPs identified as essential to the immunogenic potential of ICD inducers: cell-surface exposed calreticulin, extracellular ATP, and HMGB1 secretion.6-8 Quickly, we realized that the established methods would require adjustments to suit our needs, which included both the particularities of antibody-drug conjugate-mediated payload delivery and cost considerations. Regarding the former, we were faced with challenges in target cell selection and in determining optimal drug concentrations and time points for the three readouts. Regarding the latter, we opted to develop our own ELISA assay for the detection of secreted HMGB1, rather than purchase costly commercial kits.
Antibody-drug conjugates are designed to be internalized only by cells expressing target antigen at their cell surface. This constraint was the first hurdle that we faced in terms of establishing an assay to measure in vitro surrogate markers of ICD. We conducted initial screens to find a pair of cells orthogonally-expressing either HER2 or CD79b that responded to treatment with free maytansine or mitoxantrone (a positive control for ICD induction) by displaying cell surface calreticulin, and releasing ATP and HMGB1. Previous in vitro studies had tested small molecules in the 1–10 μM range, and we used mitoxantrone at 10 μM (Supplemental Figure 1). For maytansine (and subsequent work with antibody-drug conjugates), we elected to treat cells with payload concentrations representative of physiological levels achieved during a typical antibody-drug conjugate dosing regimen.23 For this reason free maytansine and antibody-drug conjugates were used at doses equivalent to 100 nM maytansine (or ~8 μg/mL antibody-drug conjugate). As others have previously described, we observed that not all cell lines responded in the same way to treatment with the small molecule drugs.27 Some treated cells produced all three hallmarks of ICD, while others produced only one or two of the markers. Using the free payloads as an initial screen to identify cell lines that could undergo a robust ICD response to treatment was a useful part of our assay development strategy. Assay timing was also important. By contrast to most published methods, we were not able to detect changes in all three ICD markers during the first 24 h after treatment.6,8 Eventually, we settled on monitoring cell-surface calreticulin, secreted ATP, and released HMGB1 daily over a 72 h period post-treatment. With this longitudinal perspective, we were able to capture temporal changes that generally correlated with descriptions of the ICD process.7 Ultimately, we selected the HER2-positive human breast cancer cell line, BT474, and the CD79b-positive human lymphoma cell line, BJAB, as target cells for these experiments.
Calreticulin (CRT), an ER chaperone, is translocated to the cell surface early in the ICD response while cell membrane integrity is still intact.17 For this reason, CRT exposure was quantified only in the viable cell population, as determined using flow cytometric detection of a cell’s ability to exclude propidium iodide (PI-). Treated cells were compared to untreated controls and the CRT+ population was reported as a percent of live (PI-) cells (Figure 2). Treatment of the HER2+/CD79b- BT474 cells with free maytansine led to a significant increase in the percentage of CRT+PI- cells by 24 h post-treatment (p < 0.01, paired t-test). This increase was maintained at 48 h and was elevated by 72 h post-dose. By contrast, treatment of BT474 cells with the αHER2 antibody-drug conjugate had no effect at 24 h. However, by 48 h the percentage of CRT+PI- cells began to increase and by 72 h post-treatment was significantly elevated in the αHER2 antibody-drug conjugate-treated cells as compared to controls (p < 0.01, paired t-test). In keeping with the target specificity imparted by antibody-mediated payload delivery, treatment of BT474 cells with the non-binding αCD79b antibody-drug conjugate had no effect on the percentage of CRT+PI- cells over 72 h. When the same reagents were incubated with the HER2-/CD79b+ BJAB cells, a reciprocal result was obtained, whereby the free maytansine and the αCD79b antibody-drug conjugate significantly increased the percentage of CRT+PI- cells by 24 h post-dose (each p < 0.01, paired t-test), while treatment of the cells with the non-binding αHER2 antibody-drug conjugate had no effect over 72 h.
Figure 2.

Treatment with antibody-drug conjugates selectively induces hallmarks of ICD on antigen-expressing, but not antigen-negative, target cells in vitro.
Three DAMPs that constitute essential features of ICD were measured on HER2+/CD79b- BT474 cells and HER2-/CD79b+ BJAB cells for up to 72 h after in vitro treatment with the cytotoxic anti-microtubule compound, maytansine, or with maytansine-bearing αHER2 and αCD79b antibody-drug conjugates. Exposure of cell-surface calreticulin (top panels) on viable cells was monitored by flow cytometry, using exclusion of propidium iodide to indicate cell viability. ATP release (middle panels) from cells was measured in conditioned medium by using the ENLITEN ATP kit. Secreted HMGB1 (bottom panels) was quantified in conditioned medium by using a sandwich ELISA. For all panels, n ≥ 2, with test conditions assayed in quadruplicate. Error bars represent standard deviation. Asterisks denote the result of a two-tailed, paired t-test comparing treatment groups relative to the control group at the same time point: * p < 0.05, ** p < 0.01.
ATP, a potent chemoattractant, is secreted as cells undergoing ICD enter apoptosis.17 HER2+/CD79b- BT474 cells showed a spike in secreted ATP levels at 40 h post-treatment with free maytansine (p < 0.01, paired t-test) and at 64 h post-treatment with the αHER2 antibody-drug conjugate (p < 0.01, paired t-test; Figure 2). By contrast, after treatment with the αCD79b antibody-drug conjugate, ATP secretion from BT474 cells was essentially unchanged over three days. When the same reagents were incubated with the HER2-/CD79b+ BJAB cells, the converse result was obtained. Treatment of BJAB cells with either free maytansine or the αCD79b antibody-drug conjugate induced ATP secretion within 16 h post-treatment (each p < 0.01, paired t-test), whereas treatment with the αHER2 antibody-drug conjugate had no effect on the HER2- cells over 64 h.
The nuclear protein HMGB1 is released as cell membranes break down during secondary necrosis.17,28 In the ICD literature, release of HMGB1 is measured by two primary means – using commercial ELISA kits to directly quantify HMGB1 protein, or by using fluorescence microscopy to visualize release of a GFP-tagged variant of HMGB1 from engineered target cells.7 Due to the unique requirements of our system where target cell lines could change with the antigen specificity of the antibody-drug conjugate being tested, we needed the flexibility of being able to directly quantify HMGB1 protein released from any target cell line of interest. At the same time, we wanted the ability to screen a number of cells and assay conditions during the method scouting process. The relatively high cost of the commercial ELISA kits prompted us to explore the possibility of developing our own method using commercially-available reagents. We eventually created a sandwich ELISA assay by using a mouse monoclonal anti-human antibody as a capture reagent and a rabbit polyclonal anti-human antibody as a detection reagent. To generate standard curves, we used commercially-available recombinant human HMGB1 protein. During the development process, we discovered a significant matrix effect for fetal bovine serum-containing cell culture media. Namely, media contributed a high level of background signal when compared to PBS (data not shown). Interestingly, this background signal degraded when media was incubated under cell culture conditions at 37°C and 5% CO2 (Supplemental Figure 2). We reasoned that during the course of an experiment the HMGB1 background signal originating from the media would diminish with time in culture, and that signal detected over that background level would reflect HMGB1 protein release from cells. Accordingly, in order to normalize background signals between the standard curve and the experimental samples and enable quantitation of released HMGB1 in our studies, we used pre-incubated cell culture media (kept at 37°C/5% CO2 for the same length of time as the experimental samples) as the matrix for generating the standard curve. The final assay had a dynamic range of 2.3–150 ng/mL (Supplemental Figure 3) and samples were tested neat (no dilution).
HER2+/CD79b- BT474 cells showed no change in HMGB1 levels over the first 24 h post-treatment. By 48 h, cells treated with free maytansine demonstrated significantly increased HMGB1 release (p < 0.02, paired t-test), which was maintained at 72 h (Figure 2). BT474 cells incubated with the αHER2 antibody-drug conjugate began to increase HMGB1 secretion at 48 h and by 72 h had significantly higher secreted HMGB1 levels as compared to untreated cells (p < 0.03, paired t-test). BT474 cells treated with the non-binding αCD79b antibody-drug conjugate slightly, but not significantly, increased HMGB1 secretion over 72 h. When the same reagents were incubated with the HER2-/CD79b+ BJAB cells, no change in HMGB1 levels relative to controls was detected after 24 h post-treatment, although background levels appeared to be relatively high. By 48 h post-treatment, HMGB1 levels observed in untreated cells were lower, and by comparison cells treated with free maytansine showed significantly increased HMGB1 secretion (p < 0.02, paired t-test), which continued through 72 h. Similarly, cells treated with the targeted αCD79b antibody-drug conjugate exhibited significantly higher levels of secreted HMGB1 starting at 48 h post-dose (p < 0.01, paired t-test). By contrast, treatment of BJAB cells with the non-binding αHER2 antibody-drug conjugate did not induce HMGB1 release over 72 h.
In addition to causing the ICD-associated release of DAMPs, ICD inducers by definition must be cytotoxic to target cells. We performed in vitro cytotoxicity assays to demonstrate the potency of free maytansine and maytansine-conjugated antibody-drug conjugates against BT474 and BJAB cell lines. Maytansine has been well-characterized as a highly potent molecule with typical IC50 values in the subnanomolar range.29,30 Consistent with previous reports, we observed that treatment with free maytansine resulted in the cell death of BT474 and BJAB cells with IC50 values of 0.42 and 0.27 nM, respectively (Figure 3). In accordance with their mechanism of action requiring cell surface target antigen expression for activity, the in vitro potency of the maytansine-bearing αHER2 and αCD79b antibody-drug conjugates was dependent on the cell line. Specifically, the constructs showed reciprocal activity against the (HER2+/CD79b-) BT474 and (HER2-/CD79b+) BJAB cells, with treatment producing cell death only when the target cell/antibody-drug conjugate combination resulted in productive antibody binding (Figure 3). Against cells expressing their cognate target antigen, the antibody-drug conjugates demonstrated in vitro potency similar to that of free maytansine (i.e., 0.4 and 0.29 nM for BT474 and BJAB cells, respectively). By contrast, neither construct was cytotoxic against target antigen-negative cells.
Figure 3.

Antibody-drug conjugates demonstrate target antigen-dependent potency in vitro.
HER2+/CD79b- BT474 and HER2-/CD79b+ BJAB cells were used as targets to assess the in vitro potency of free maytansine and maytansine-bearing αHER2 and αCD79b antibody-drug conjugates. Cells were treated with the compounds at doses ranging from ~0.1 to 200 nM maytansine equivalents and 5 days later cell viability was measured using the CellTiter-Glo® assay. Samples were plated in duplicate; error bars represent standard deviation.
Having established the target specificity of ICD-related DAMP induction by maytansine-bearing antibody-drug conjugates, we set out to further characterize the molecular mechanisms through which the maytansine payload was acting on target cells. For this work, we monitored treated cells for indicators of apoptotic cell death, ER stress, autophagy, and type I interferon signaling. Each of these processes has been experimentally-linked to one or more of the hallmark features of ICD and many ICD-inducing treatments will provoke these responses in competent cells. However, as outlined in a recent review by Galluzzi and colleagues,31 several pathways can lead to an ICD outcome, and not all danger signals may be universally required to achieve this outcome in all scenarios. Therefore, it was of interest to show how our selected target cells responded to maytansine.
ICD was originally described as a type of apoptotic caspase-dependent cell death32, yet more recent studies have shown that ICD can be mediated via multiple regulated forms of cell death, including necroptosis.31,33,34 Maytansine and its related structural analogs have been previously shown to kill cells via an apoptotic mechanism involving mitotic arrest and p53 activation,35,36 events that can occur upstream of caspase-dependent apoptosis in some settings.37 We used a flow cytometric assay to determine whether maytansine operated through a similar process on BT474 and BJAB cells. Specifically, we monitored treated cells for reactivity with Annexin V protein, which recognizes cell surface-exposed phosphatidylserine and serves as a common marker of early-stage apoptotic cells.38 Cells in late stage-apoptosis and necrosis were identified by their inability to exclude propidium iodide (PI). Thus, we defined apoptotic cells as Annexin V+/PI-, and necrotic cells as Annexin V+/PI+. Untreated BT474 and BJAB cells both comprised predominately (85–92%) viable, non-apoptotic cells (Annexin V-/PI-). When treated with maytansine (100 nM) both the BT474 and BJAB cell lines showed increases in the percentages of apoptotic cells at early time points, with the percentages of necrotic cells increasing at later time points (Figure 4), supporting the interpretation that cells were dying via an apoptotic mechanism. In keeping with the results of our previous studies, the reaction kinetics differed between the two target cell lines, with BT474 cell responses lagging behind BJAB cell responses by 24 h or more.
Figure 4.

Maytansine treatment induces apoptotic death in target cell lines.
BT474 (a) and BJAB (b) cells in culture were treated with free maytansine and monitored by flow cytometry for indications of apoptotic or necrotic cell death as determined by Annexin V reactivity and propidium iodide (PI) membrane permeability. Cell status was assigned as follows: Annexin V-/PI-, viable cells (blue); Annexin V+/PI-, apoptotic cells (orange); Annexin V+/PI+, necrotic cells (red). Untreated (control) and treated cells were monitored over a three- point time course that differed for each cell type (hours shown on left axes). Numbers indicate the percentage of total cells observed at each stage of cell death.
An ER stress response has been shown to precede cell surface calreticulin exposure. A central aspect of this stress response is a global reduction in protein synthesis mediated via phosphorylation of eukaryotic translation initiation factor 2A (EIF2A), a regulatory component of the ternary complex that brings the initiator Met-tRNAi to the 40S ribosomal subunit.39 A number of studies have demonstrated that EIF2A is phosphorylated in the context of ICD. 7,15,40,41 Accordingly, we asked whether the target cell lines used in our study – BT474 and BJAB – increased the phosphorylation of EIF2A after treatment with free maytansine (100 nM). Indeed, as determined by immunoblotting, induction of phosphorylated EIF2A was observed in both cell lines as early as 16 h post-maytansine treatment (Figure 5).
Figure 5.

Maytansine treatment promotes the phosphorylation of EIF2A in target cell lines.
BT474 (a) and BJAB (b) cells in culture were either untreated (top) or treated with free maytansine (100 nM, bottom) for the times indicated. Cells were directly lysed into Laemmli buffer containing DTT, transferred to PVDF membranes, and probed by immunoblotting for EIF2A total protein (eIF2a) or Ser51 phosphorylated-EIF2a (P-eIF2A).
In the majority of models, autophagy is required for ATP secretion during ICD.42,43 However, in some systems, autophagy is dispensable for the ICD process.7,44,45 We monitored for autophagy by using an immunoblot approach to visualize conversion of LC3-I to LC3-II in untreated and maytansine-treated cells. Inclusion of lysosomal protease inhibitors was used to monitor flux, thereby strengthening data interpretation.46 In keeping with the previous observations that autophagy can be associated with ICD but is not required for the process, we noted that maytansine had divergent effects on the two tested cell lines (Figure 6). Namely, maytansine treatment (100 nM) clearly induced LC3-II production in BJAB cells but not in BT474 cells. The negative response in BT474 cells prompted us to investigate whether mitoxantrone, which we considered to be a positive control for ICD induction, would elicit autophagy in this system. The results obtained with mitoxantrone (10 μM) mirrored those seen with maytansine: BJAB cells, but not BT474 cells, yielded LC3-II in response to treatment.
Figure 6.
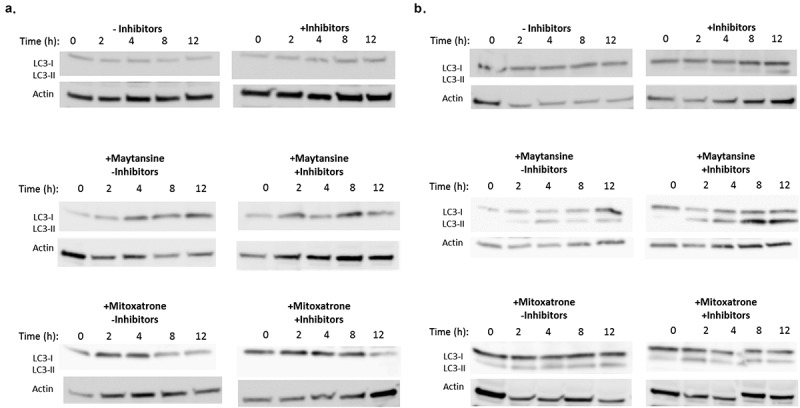
Maytansine induction of autophagy is target cell line-dependent.
BT474 (a) and BJAB (b) cells in culture were either untreated or treated with free maytansine (100 nM) or mitoxantrone (10 μM). These treatment groups were further divided into cells cultured with or without lysosomal protease inhibitors. After the indicated times, cells were directly lysed into Laemmli buffer containing DTT, transferred to PVDF membranes, and probed by immunoblotting for LC3B protein, which can be detected as LC3-I and its lipidated form LC3-II. Conversion of LC3-I to LC3-II is indicative of autophagy.
Type I interferon response has been described as the “fourth hallmark of ICD”.47,48 Classically associated with the host immune response to viral infections,49 type I interferon response is manifested during ICD in an autocrine fashion by target cells. Cells undergoing ICD are activated through a TLR3-dependent mechanism that results in a signal cascade leading to type I interferon signaling and eventual chemokine (C-X-C motif) ligand 10 (CXCL10) secretion. Targeted cells that are deficient in TLR3 or in type I interferon receptors fail to elicit an immune response in murine vaccination experiments, indicating that the signaling pathway is required for ICD.15,47,48 We used an ELISA assay to detect secreted CXCL10 protein in conditioned media from treated BT474 and BJAB cells. Initial experiments using maytansine alone failed to reveal CXCL10 production in either cell line, prompting us to include three additional small molecule controls – mitoxantrone, doxorubicin, and cyclophosphamide – that had been previously confirmed as bona fide ICD inducers based on in vivo studies.15 We took daily time points of conditioned medium from treated cells and monitored for CXCL10 production for up to 3 days post-treatment. BT474 cells secreted CXCL10 only in response to mitoxantrone (10 μM) or doxorubicin (10 μM), starting at 24 and 72 h post-dose, respectively. Specifically, with respect to mitoxantrone we detected 228 ± 34 pg/mL CXCL10 in BT474 conditioned medium at 24 h, with the concentration rising to 309 ± 6 pg/mL after 72 h. With respect to doxorubicin, we detected 61 ± 20 pg/mL CXCL10 in BT474 conditioned medium after 72 h. No other conditions induced detectable CXCL10 signals (assay limit of detection ~40 pg/mL, assay limit of quantitation ~50 pg/mL). Considering the wide differences in response times to mitoxantrone and doxorubicin, we extended the observation period for BT474 cells up to 120 h (5 days). However, no CXCL10 secretion was noted in response to either maytansine (100 nM) or cyclosporin (10 μM), even up to 5 d post-treatment. By contrast to BT474, no CXCL10 production was detected in BJAB conditioned medium up to 72 h after cells were treated with maytansine or any of the positive control compounds, highlighting the importance of cell line selection with respect to the manifestation of ICD-related DAMPs.
While developing methods to investigate whether antibody-drug conjugates could elicit in vitro production of ICD-related DAMPs, we considered that the timing of responses might differ from those mediated by free drugs due to the processing requirements inherent in an antibody-drug conjugate’s mechanism of action (Figure 1). These include cell surface antigen binding, internalization, trafficking through the endosomal/lysosomal pathway, construct degradation, release of the cytotoxic payload from the lysosome, and finally, payload activation of cell death pathways. These steps are sequential and their duration is likely to differ by cell type and by target antigen. We anticipated that the production of DAMPs would occur fastest in cells treated with free maytansine – which is cell-membrane permeable and thus immediately able to initiate cytotoxicity – and that antibody-drug conjugate-mediated effects might take longer to manifest. Indeed, this pattern was observed in the BT474 cells, where the ICD hallmarks were first detected in response to free maytansine with a response to the αHER2 antibody-drug conjugate following ~24 h later (Figure 2). By contrast, in the BJAB cells ICD markers were produced with similar kinetics in response to both free maytansine and the αCD79b antibody-drug conjugate. These differences suggest that timing is a variable that should be explored during method development when testing different target antigens or cell lines.
Here, we showed that maytansine and maytansine-based antibody-drug conjugates induced the production of the three major ICD hallmarks in vitro, and that some related molecular mechanisms – including apoptotic cell death and ER stress – were also activated in cells after maytansine treatment. By contrast, we observed that maytansine’s ability to activate other ICD-related molecular mechanisms – including autophagy, and type I interferon response – varied with respect to the tested cell line. While the only bona fide method of determining ICD potential remains in vivo vaccination assays, these results support previously published data demonstrating that antibody-drug conjugates stimulate immune cells both in vitro and in vivo, and that the constructs act in synergy with immune checkpoint inhibitors in preclinical models.19-22 Although we focused on maytansine conjugates, the literature indicates that several payloads, including maytansine, monomethylauristatin E (MMAE), tubulysin, and pyrrolobenzodiazepine (PBD), all appear to have similar immunostimulatory activities in vivo. This is particularly interesting in light of the fact that <20 other small molecules, including only ~8 approved anti-cancer drugs, are known to be triggers of ICD.7 Thus, antibody-drug conjugates are among a handful of therapeutics with the potential to be used clinically in combination therapies to improve responses to immune checkpoint inhibitor drugs.50 Clinical data from antibody-drug conjugate-treated patients strengthens this hypothesis. For example, treatment with brentuximab vedotin, an MMAE-conjugated anti-CD30 construct, increases the number of tumor-infiltrating CD8 + T cells,19 a population associated with a productive anti-tumor immune response.51,52 In addition, clinical efficacy of antibody-drug conjugates has been observed in patients expressing little or no target antigen on their tumors, suggesting that indirect mechanisms, potentially immune-mediated, lead to tumor control in these patients.53-55
Looking forward, as chemotherapy/immune checkpoint inhibitor combinations become increasingly important, the ability of antibody-drug conjugates to selectively deliver their payload to target cells may yield two significant advantages over systemically-delivered ICD-inducing chemotherapeutics. First, the conventional small molecule drugs induce bone marrow suppression as a primary toxicity,13 depleting immune cells and potentially compromising the efficacy of immune checkpoint inhibition. Second, through off-target toxicities, systemic dosing of ICD-inducing drugs may lead to the breaking of peripheral immune tolerance and autoimmune complications.56 This latter point has not been a major complication for small molecule ICD inducers used as single agents, but may become more likely when immune checkpoint inhibitor drugs are co-delivered, changing the balance of inhibitory/stimulatory signals that normally contribute to self-tolerance. By contrast, antibody-drug conjugates may be better tolerated in both respects enabling improved outcomes from combination treatments.23,50 This possibility is currently being explored in clinical trials testing at least seven different antibody-drug conjugates in combination with various immune checkpoint inhibitors.
Material and methods
Cell lines
BT474 (ATCC) and BJAB (DMSZ) were cultured in RPMI-1640 media (Corning) supplemented with 10–20% fetal bovine serum (VWR Seradigm Lifescience) and glutamine (Thermo Fisher Scientific) at 37°C under 5% CO2.
Antibody-drug conjugate generation and analysis
αHER2 and αCD79b antibody-drug conjugates were generated using aldehyde technology and HIPS chemistry as previously described, and were analyzed using published methods.25 HIPS-4AP-maytansine (RED-106) was used as the small molecule payload.23 The constructs had a drug-to-antibody ratio of ~1.8.
Cytotoxicity assays
Using a white-walled 96-well plate, cells were plated at 5000 cells per well in 100 μL of growth media. The following day, cells were treated with antibody-drug conjugates serially diluted in growth media. Untreated and maytansine-treated cells were included on each plate as controls. After five days, viability was determined using the CellTiter-Glo® Assay (Promega). Chemiluminescence was measured on a SpectraMax M5 (Molecular Devices) and viability calculated using Prism 6 software (GraphPad).
Treatment of cells for ICD marker measurements
Cells were plated at 8 × 10⁴ cells per well in 100 μL of media. Flat bottom or U-bottom plates were used for BT474 or BJAB cells, respectively. The following day, media was changed. This step significantly improved ATP assay reproducibility by reducing variability among replicate wells. Then, cells were treated with media alone, maytansine (100 nM), αHER2 RED-106 (50 nM antibody/90 nM payload), or αCD79b RED-106 (50 nM antibody/90 nM payload) for 16–72 h. In some instances, additional controls were used at the following concentrations: mitoxantrone (10 μM), gemcitabine (10 μM), doxorubicin (10 μM), or cyclophosphamide (10 μM).
Calreticulin measurement
Cells were assayed at 24, 48, and 72 h post-treatment. The adherent BT474 cells were lifted with TrypLE (ThermoFisher) for 2 min at 37°C. Both BT474 and BJAB cells were washed with PBS/2% FBS and than fixed in 0.5% paraformaldehyde for 5 min. After washing twice with cold PBS/2% FBS, cells were incubated for 5 min with FC block (eBioscience) followed by 30 min with anti-calreticulin-FITC (Abcam) or isotype control-FITC (Abcam). Cells were washed twice with PBS/2% FBS. Propidium iodide (PI) was added and samples analyzed by flow cytometry on a FACSCanto™ instrument (Becton-Dickinson) using FACS Diva™ software.
Extracellular ATP
At 16, 40, and 64 h post-treatment, culture media was transferred to Eppendorf tubes and centrifuged gently. Extracellar ATP concentrations were determined by the ENLITEN ATP Assay (Promega). Chemiluminescence was measured on a SpectraMax ME (Molecular Devices).
Extracellular HMGB1
Culture media was collected at 24, 48, and 72 h post-treatment. Analytes were captured on a Nunc Maxisorp 96-well plate coated at pH 9 with 1 μg/mL αHMGB1 (clone 1D5, Sigma) and blocked with casein buffer (ThermoFisher). A standard curve was generated using recombinant human HMGB1 protein (R&D Systems) added to culture media that had been incubated at 37°C/5% CO2 for the same number of days as the experimental samples. This step had the effect of normalizing background signals observed in fresh culture media. Media from the experimental samples was transferred to fresh tubes, centrifuged gently to pellet debris, then added to the prepared plate along with the standard curve. After 1 h, the plate was washed with PBS 0.1% Tween-20, and an αHMGB1 polyclonal antibody (ab18256, Abcam) was added at 1 μg/mL in PBS for 1 h. The plate was washed and an anti-rabbit peroxidase-conjugated secondary antibody (Jackson Immunoresearch) was applied at a 1:3000 dilution in PBS. After 30 min, the plate was washed with PBS 0.1% Tween-20 and bound secondary was detected using Ultra TMB (Thermo Fisher); signals were read on a Molecular Devices Spectra Max M5 plate reader. With respect to sample handling, we found that experimental samples could not be frozen for subsequent analysis as the HMGB1 signal degraded. However, samples could be kept at 4°C for analysis on the following day.
Immunoblotting
Cells were plated in 6-well plates at 5 × 10⁵ cells per well in 3 mL of growth media. The following day, cells were washed twice with PBS and treated with media containing the test compounds. For the eIF2a experiments, cells were treated with media alone or with maytansine (100 nM) for 16 or 24 h. For the autophagy experiments, cells were treated with media alone, or with maytansine (100 nM) or mitoxatrone (10 μM) in the presence or absence of E46D (10 μg/mL, ApexBio) and pepstatin A (10 μg/mL, Adipogen) for 2, 4, 8, or 12 h. Upon harvest, cells were washed once with cold PBS and then lysed directly using Laemmli buffer (Invitrogen) containing DTT. Samples were electrophoretically-separated using a 4–20% gel (BioRad) and transferred to PVDF membranes (Invitrogen). Proteins were detected using the following antibodies: anti-LC3B (NovusBio, NB100-2220), anti-actin (NovusBio, #NB600-503), anti-eIF2a (Invitrogen, #AHO1182), and anti-Phospho-eIF2a (Ser51, Cell Signaling, #3398S).
Apoptosis/necrosis determination by flow
Cells were plated in 6 well plates at 5 × 10⁵ cells per well in 3 mL of growth media. The following day, cells were washed 2x with PBS and treated with media alone, maytansine (100 nM), or mitoxatrone (10 μM) for 2–72 h. At the indicated times, cells were harvested and labeled using a BD Annexin V:FITC Apoptosis Detection Kit (BD Biosciences) according to the manufacturer’s instructions. Then, cells were analyzed by flow cytometry on a FACSCanto™ instrument (Becton-Dickinson) using FACS Diva™ software.
CXCL10 ELISA
Cells were plated in 96-well plates at 1 × 10⁵ (flat bottom) or 3 × 10⁵ cells (U-bottom) per well in 100 μL of media for BT474 or BJAB cells, respectively. The following day, media was changed and the cells were treated with media alone, maytansine (100 nM), mitoxantrone (10 μM), gemcitabine (10 μM), doxorubicin (10 μM), or cyclophosphamide (10 μM) for up to 120 or 72 h for BT474 or BJAB cells, respectively. Samples were kept at 4°C for up to 2 days until analysis by ELISA using a Human CXCL10 DuoSet ELISA Kit (R&D Systems) according to the manufacturer’s instructions. The experiment was performed in duplicate; results are reported as pg/mL ± standard deviation.
Statistical analyses
Prism 6 software (GraphPad) was used to perform the statistical tests described in the text.
Disclosure of potential conflicts of interest
All authors are employees of Catalent Biologics.
Supplementary material
supplemental data for this article can be accessed publisher’s website.
References
- 1.Wheeler DA, Wang L.. From human genome to cancer genome: the first decade. Genome Res. 2013;23:1054–1062. doi: 10.1101/gr.157602.113. [DOI] [PMC free article] [PubMed] [Google Scholar]
- 2.La Thangue NB, Kerr DJ. Predictive biomarkers: a paradigm shift towards personalized cancer medicine. Nat Rev Clin Oncol. 2011;8:587–596. doi: 10.1038/nrclinonc.2011.121. [DOI] [PubMed] [Google Scholar]
- 3.Gibney GT, Weiner LM, Atkins MB. Predictive biomarkers for checkpoint inhibitor-based immunotherapy. Lancet Oncol. 2016;17:e542–51. doi: 10.1016/S1470-2045(16)30406-5. [DOI] [PMC free article] [PubMed] [Google Scholar]
- 4.Perez-Gracia JL, Sanmamed MF, Bosch A, Patiño-Garcia A, Schalper KA, Segura V, Bellmunt J, Tabernero J, Sweeney CJ, Choueiri TK, et al. Cancer treatment reviews. Cancer Treat Rev. 2017;53:79–97. doi: 10.1016/j.ctrv.2016.12.005. [DOI] [PubMed] [Google Scholar]
- 5.Beck A, Goetsch L, Dumontet C, Corvaïa N. Strategies and challenges for the next generation of antibody–drug conjugates. Nat Rev Drug Discov. 2017;16:315–337. doi: 10.1038/nrd.2016.268. [DOI] [PubMed] [Google Scholar]
- 6.Menger L, Vacchelli E, Adjemian S, Martins I, Ma Y, Shen S, Yamazaki T, Aq S, Michaud M, Mignot G, et al. Cardiac glycosides exert anticancer effects by inducing immunogenic cell death. Sci Transl Med. 2012;4:143ra99. doi: 10.1126/scitranslmed.3003807. [DOI] [PubMed] [Google Scholar]
- 7.Kepp O, Senovilla L, Vitale I, Vacchelli E, Adjemian S, Agostinis P, Apetoh L, Aranda F, Barnaba V, Bloy N, et al. Consensus guidelines for the detection of immunogenic cell death. OncoImmunology. 2014;3:e955691. doi: 10.4161/21624011.2014.955691. [DOI] [PMC free article] [PubMed] [Google Scholar]
- 8.Sukkurwala AQ, Adjemian S, Senovilla L, Michaud M, Spaggiari S, Vacchelli E, Baracco EE, Galluzzi L, Zitvogel L, Kepp O, et al. Screening of novel immunogenic cell death inducers within the NCI mechanistic diversity set. OncoImmunology. 2014;3:e28473. doi: 10.4161/onci.28473. [DOI] [PMC free article] [PubMed] [Google Scholar]
- 9.Drake PM, Rabuka D. Recent developments in ADC technology: preclinical studies signal future clinical trends. Bio Drugs. 2017;31:521–531. [DOI] [PMC free article] [PubMed] [Google Scholar]
- 10.van Den Borne S. U.S. FDA approved Immune-checkpoint inhibitors for cancer [Internet] MediPaper Medical Communications Ltd. [accessed 2018 July27]. https://medi-paper.com/us-fda-approved-immune-checkpoint-inhibitors-approved-immunotherapies/#ppt
- 11.Jenkins RW, Barbie DA, Flaherty KT. Mechanisms of resistance to immune checkpoint inhibitors. Nature Publishing Group. 2018;118:9–16. [DOI] [PMC free article] [PubMed] [Google Scholar]
- 12.Du S, McCall N, Park K, Guan Q, Fontina P, Ertel A, Zhan T, Dicker AP, Lu B. Blockade of tumor-expressed PD-1 promotes lung cancer growth. Oncoimmunology. 2018;7:e1408747. doi: 10.1080/2162402X.2017.1408747. [DOI] [PMC free article] [PubMed] [Google Scholar]
- 13.Brown JS, Sundar R, Lopez J. Combining DNA damaging therapeutics with immunotherapy: more haste, less speed. Nature Publishing Group. 2017;118:312–324. [DOI] [PMC free article] [PubMed] [Google Scholar]
- 14.Langer CJ, Gadgeel SM, Borghaei H, Papadimitrakopoulou VA, Patnaik A, Powell SF, Gentzler RD, Martins RG, Stevenson JP, Jalal SI, et al. Carboplatin and pemetrexed with or without pembrolizumab for advanced, non-squamous non-small-cell lung cancer: a randomised, phase 2 cohort of the open-label KEYNOTE-021 study. Lancet Oncol. 2016;17:1497–1508. doi: 10.1016/S1470-2045(16)30498-3. [DOI] [PMC free article] [PubMed] [Google Scholar]
- 15.Bezu L, Gomes-de-Silva LC, Dewitte H, Breckpot K, Fučíková J, Spisek R, Galluzzi L, Kepp O, Kroemer G. Combinatorial strategies for the induction of immunogenic cell death. Front Immunol. 2015;6:187. [DOI] [PMC free article] [PubMed] [Google Scholar]
- 16.Galluzzi L, Buqué A, Kepp O, Zitvogel L, Kroemer G. Immunological effects of conventional chemotherapy and targeted anticancer agents. Cancer Cell. 2015;28:690–714. [DOI] [PubMed] [Google Scholar]
- 17.Kroemer G, Galluzzi L, Kepp O, Zitvogel L. Immunogenic cell death in cancer therapy. Annu Rev Immunol. 2013;31:51–72. doi: 10.1146/annurev-immunol-032712-100008. [DOI] [PubMed] [Google Scholar]
- 18.Pfirschke C, Engblom C, Rickelt S, Cortez-Retamozo V, Garris C, Pucci F, Yamazaki T, Poirier-Colame V, Newton A, Redouane Y, et al. Immunogenic chemotherapy sensitizes tumors to checkpoint blockade therapy. Immunity. 2016;44:343–354. doi: 10.1016/j.immuni.2015.11.024. [DOI] [PMC free article] [PubMed] [Google Scholar]
- 19.Muller P, Martin K, Theurich S, Schreiner J, Savic S, Terszowski G, Lardinois D, Heinzelmann-Schwarz VA, Schlaak M, Kvasnicka HM, et al. Microtubule-depolymerizing agents used in antibody-drug conjugates induce antitumor immunity by stimulation of dendritic cells. Cancer Immunology Research. 2014;2:741–755. doi: 10.1158/2326-6066.CIR-13-0163. [DOI] [PubMed] [Google Scholar]
- 20.Rios-Doria J, Harper J, Rothstein R, Wetzel L, Chesebrough J, Marrero A, Chen C, Strout P, Mulgrew K, McGlinchey K, et al. Antibody-drug conjugates bearing pyrrolobenzodiazepine or tubulysin payloads are immunomodulatory and synergize with multiple immunotherapies. Cancer Res. 2017;77:2686–2698. doi: 10.1158/0008-5472.CAN-16-2854. [DOI] [PubMed] [Google Scholar]
- 21.Martin K, Müller P, Schreiner J, Prince SS, Lardinois D, Heinzelmann-Schwarz VA, Thommen DS, Zippelius A. The microtubule-depolymerizing agent ansamitocin P3 programs dendritic cells toward enhanced anti-tumor immunity. Cancer Immunol Immunother. 2014;63:925–938. doi: 10.1007/s00262-014-1565-4. [DOI] [PMC free article] [PubMed] [Google Scholar]
- 22.Müller P, Kreuzaler M, Khan T, Ds T, Martin K, Glatz K, Savic S, Harbeck N, Nitz U, Gluz O, et al. Trastuzumab emtansine (T-DM1) renders HER2+ breast cancer highly susceptible to CTLA-4/PD-1 blockade. Sci Transl Med. 2015;7:315ra188. doi: 10.1126/scitranslmed.aad3106. [DOI] [PubMed] [Google Scholar]
- 23.Drake PM, Carlson A, McFarland JM, Banas S, Barfield RM, Zmolek W, Kim YC, Huang BCB, Kudirka R, Rabuka D. CAT-02-106, a site-specifically conjugated anti-cd22 antibody bearing an mdr1-resistant maytansine payload yields excellent efficacy and safety in preclinical models. Mol Cancer Ther. 2018;17:161–168. doi: 10.1158/1535-7163.MCT-17-0776. [DOI] [PubMed] [Google Scholar]
- 24.Rabuka D, Rush JS, deHart GW, Wu P, Bertozzi CR. Site-specific chemical protein conjugation using genetically encoded aldehyde tags. Nat Protoc. 2012;7:1052–1067. doi: 10.1038/nprot.2012.045. [DOI] [PMC free article] [PubMed] [Google Scholar]
- 25.Drake PM, Albers AE, Baker J, Banas S, Barfield RM, Bhat AS, de Hart GW, Garofalo AW, Holder P, Jones LC, et al. Aldehyde tag coupled with HIPS chemistry enables the production of ADCs conjugated site-specifically to different antibody regions with distinct in vivo efficacy and PK outcomes. Bioconjugate Chem. 2014;25:1331–1341. doi: 10.1021/bc500189z. [DOI] [PMC free article] [PubMed] [Google Scholar]
- 26.Agarwal P, Kudirka R, Albers AE, Barfield RM, de Hart GW, Drake PM, Jones LC, Rabuka D. Hydrazino-pictet-spengler ligation as a biocompatible method for the generation of stable protein conjugates. Bioconjugate Chem. 2013;24:846–851. doi: 10.1021/bc400042a. [DOI] [PubMed] [Google Scholar]
- 27.Shoemaker RH. The NCI60 human tumour cell line anticancer drug screen. Nat Rev Cancer. 2006;6:813–823. doi: 10.1038/nrc1951. [DOI] [PubMed] [Google Scholar]
- 28.Bianchi ME, Crippa MP, Manfredi AA, Mezzapelle R, Rovere-Querini P, Vénéreau E. High-mobility group box 1 protein orchestrates responses to tissue damage via inflammation, innate and adaptive immunity, and tissue repair. Immunol Rev. 2017;280:74–82. doi: 10.1111/imr.12601. [DOI] [PubMed] [Google Scholar]
- 29.Kovtun YV, Audette CA, Mayo MF, Jones GE, Doherty H, Maloney EK, Erickson HK, Sun X, Wilhelm S, Ab O, et al. Antibody-Maytansinoid Conjugates Designed to Bypass Multidrug Resistance. Cancer Res. 2010;70:2528–2537. doi: 10.1158/0008-5472.CAN-09-3546. [DOI] [PubMed] [Google Scholar]
- 30.Zhao RY, Wilhelm SD, Audette C, Jones G, Leece BA, Lazar AC, Goldmacher VS, Singh R, Kovtun Y, Widdison WC, et al. Synthesis and evaluation of hydrophilic linkers for antibody–maytansinoid conjugates. J Med Chem. 2011;54:3606–3623. doi: 10.1021/jm2002958. [DOI] [PubMed] [Google Scholar]
- 31.Galluzzi L, Buqué A, Kepp O, Zitvogel L, Kroemer G. Immunogenic cell death in cancer and infectious disease. Nat Rev Immunol. 2016;17:97–111. doi: 10.1038/nri.2016.107. [DOI] [PubMed] [Google Scholar]
- 32.Casares N, Pequignot MO, Tesniere A, Ghiringhelli F, Roux S, Chaput N, Schmitt E, Hamai A, Hervas-Stubbs S, Obeid M, et al. Caspase-dependent immunogenicity of doxorubicin-induced tumor cell death. J Exp Med. 2005;202:1691–1701. doi: 10.1084/jem.20050915. [DOI] [PMC free article] [PubMed] [Google Scholar]
- 33.Yang H, Ma Y, Chen G, Zhou H, Yamazaki T, Klein C, Pietrocola F, Vacchelli E, Souquere S, Sauvat A, et al. Contribution of RIP3 and MLKL to immunogenic cell death signaling in cancer chemotherapy. OncoImmunology. 2016;5:1–13. doi: 10.1080/2162402X.2016.1149673. [DOI] [PMC free article] [PubMed] [Google Scholar]
- 34.Aaes TL, Kaczmarek A, Delvaeye T, De Craene B, De Koker S, Heyndrickx L, Delrue I, Taminau J, Wiernicki B, De Groote P, et al. Vaccination with necroptotic cancer cells induces efficient anti-tumor immunity. Cell Reports. 2016;15:274–287. [DOI] [PubMed] [Google Scholar]
- 35.Venghateri JB, Gupta TK, Verma PJ, Kunwar A, Panda D. Ansamitocin P3 depolymerizes microtubules and induces apoptosis by binding to tubulin at the vinblastine site. PLoS One. 2013;8:e75182. doi: 10.1371/journal.pone.0075182. [DOI] [PMC free article] [PubMed] [Google Scholar]
- 36.Tassone P. Cytotoxic activity of the maytansinoid immunoconjugate B-B4-DM1 against CD138+ multiple myeloma cells. Blood. 2004;104:3688–3696. doi: 10.1182/blood-2003-11-3979. [DOI] [PubMed] [Google Scholar]
- 37.Schuler M, Bossy-Wetzel E, Goldstein JC, Fitzgerald P, Green DR. p53 induces apoptosis by caspase activation through mitochondrial cytochrome c release. J Biol Chem. 2000;275:7337–7342. doi: 10.1074/jbc.275.10.7337. [DOI] [PubMed] [Google Scholar]
- 38.Vermes I, Haanen C, Steffens-Nakken H, Reutellingsperger C. A novel assay for apoptosis Flow cytometric detection of phosphatidylserine expression on early apoptotic cells using fluorescein labelled Annexin V. J Immunol Methods. 1995;184:39–51. doi: 10.1016/0022-1759(95)00072-I. [DOI] [PubMed] [Google Scholar]
- 39.Holcik M. Could the eIF2α-independent translation be the achilles heel of cancer? Front Oncol. 2015;5:337. doi: 10.3389/fonc.2015.00264. [DOI] [PMC free article] [PubMed] [Google Scholar]
- 40.Hetz C. The unfolded protein response: controlling cell fate decisions under ER stress and beyond. Nat Rev Mol Cell Biol. 2012;13:89–102. doi: 10.1038/nrm3270. [DOI] [PubMed] [Google Scholar]
- 41.Panaretakis T, Kepp O, Brockmeier U, Tesniere A, Bjorklund A-C, Chapman DC, Durchschlag M, Joza N, Pierron G, van Endert P, et al. Mechanisms of pre-apoptotic calreticulin exposure in immunogenic cell death. Embo J. 2009;28:578–590. doi: 10.1038/emboj.2009.1. [DOI] [PMC free article] [PubMed] [Google Scholar]
- 42.Michaud M, Martins I, Sukkurwala AQ, Adjemian S, Ma Y, Pellegatti P, Shen S, Kepp O, Scoazec M, Mignot G, et al. Autophagy-dependent anticancer immune responses induced by chemotherapeutic agents in mice. Science. 2011;334:1573–1577. doi: 10.1126/science.1208347. [DOI] [PubMed] [Google Scholar]
- 43.Martins I, Wang Y, Michaud M, Ma Y, Aq S, Shen S, Kepp O, Tivier DME, Galluzzi L, Perfettini J-L, et al. Molecular mechanisms of ATP secretion during immunogenic cell death. Cell Death Differ. 2013;21:79–91. doi: 10.1038/cdd.2013.75. [DOI] [PMC free article] [PubMed] [Google Scholar]
- 44.Garg AD, Dudek AM, Agostinis P. Autophagy-dependent suppression of cancer immunogenicity and effector mechanisms of innate and adaptive immunity. OncoImmunology. 2014;2:e26260. doi: 10.4161/onci.26260. [DOI] [PMC free article] [PubMed] [Google Scholar]
- 45.Garg AD, Dudek AM, Ferreira GB, Verfaillie T, Vandenabeele P, Krysko DV, Mathieu C, Agostinis P. ROS-induced autophagy in cancer cells assists in evasion from determinants of immunogenic cell death. Autophagy. 2014;9:1292–1307. doi: 10.4161/auto.25399. [DOI] [PubMed] [Google Scholar]
- 46.Klionsky DJ, Abdelmohsen K, Abe A, Abedin MJ, Abeliovich H, Arozena AA, Adachi H, Adams CM, Adams PD, Adeli K, et al. Guidelines for the use and interpretation of assays for monitoring autophagy. (3rd edition) Autophagy. 2016;12:1–222. [DOI] [PMC free article] [PubMed] [Google Scholar]
- 47.Vacchelli E, Sistigu A, Yamazaki T, Vitale I, Zitvogel L, Kroemer G. Autocrine signaling of type 1 interferons in successful anticancer chemotherapy. OncoImmunology. 2015;4:e988042. doi: 10.1080/2162402X.2015.1008371. [DOI] [PMC free article] [PubMed] [Google Scholar]
- 48.Sistigu A, Yamazaki T, Vacchelli E, Chaba K, Enot DP, Adam J, Vitale I, Goubar A, Baracco EE, Dios CRE, et al. Cancer cell–autonomous contribution of type I interferon signaling to the efficacy of chemotherapy. Nat Med. 2014;20:1301–1309. [DOI] [PubMed] [Google Scholar]
- 49.Schoggins JW, Wilson SJ, Panis M, Murphy MY, Jones CT, Bieniasz P, Rice CM. A diverse range of gene products are effectors of the type I interferon antiviral response. Nature. 2011;472:481–485. doi: 10.1038/nature09907. [DOI] [PMC free article] [PubMed] [Google Scholar]
- 50.Gerber H-P, Sapra P, Loganzo F, May C. Combining antibody–drug conjugates and immune-mediated cancer therapy: what to expect? Biochem Pharmacol. 2016;102:1–6. doi: 10.1016/j.bcp.2015.12.008. [DOI] [PubMed] [Google Scholar]
- 51.Galon J. Type, density, and location of immune cells within human colorectal tumors predict clinical outcome. Science. 2006;313:1960–1964. doi: 10.1126/science.1129139. [DOI] [PubMed] [Google Scholar]
- 52.Lanitis E, Dangaj D, Irving M, Coukos G. Mechanisms regulating T-cell infiltration and activity in solid tumors. Annals of Oncology. 2017;28:18–32. doi: 10.1093/annonc/mdx075. [DOI] [PubMed] [Google Scholar]
- 53.Bartlett NL, Smith MR, Siddiqi T, Advani RH, O’Connor OA, Sharman JP, Feldman T, Savage KJ, Shustov AR, Diefenbach CS, et al. Brentuximab vedotin activity in diffuse large B-cell lymphoma with CD30 undetectable by visual assessment of conventional immunohistochemistry. Leuk Lymphoma. 2017;58:1607–1616. doi: 10.1080/10428194.2016.1256481. [DOI] [PubMed] [Google Scholar]
- 54.Jacobsen ED, Sharman JP, Oki Y, Advani RH, Winter JN, Bello CM, Spitzer G, Palanca-Wessels MC, Kennedy DA, Levine P, et al. Brentuximab vedotin demonstrates objective responses in a phase 2 study of relapsed/refractory DLBCL with variable CD30 expression. Blood. 2015;125:1394–1402. doi: 10.1182/blood-2014-07-591040. [DOI] [PubMed] [Google Scholar]
- 55.Pfeifer M, Zheng B, Erdmann T, Koeppen H, McCord R, Grau M, Staiger A, Chai A, Sandmann T, Madle H, et al. Anti-CD22 and anti-CD79B antibody drug conjugates are active in different molecular diffuse large B-cell lymphoma subtypes. Leukemia. 2015;29:1578–1586. doi: 10.1038/leu.2014.245. [DOI] [PubMed] [Google Scholar]
- 56.Sharma P, Misra A, Singh V, Gupta A, Saroha S, Singh S. Cyclophosphamide and epirubicin-induced diabetes mellitus in breast cancer: a rare occurrence. J Pharmacol Pharmacother. 2016;7:146. doi: 10.4103/0976-500X.189684. [DOI] [PMC free article] [PubMed] [Google Scholar]
Associated Data
This section collects any data citations, data availability statements, or supplementary materials included in this article.