. 2019 Mar 12;8:e44771. doi: 10.7554/eLife.44771

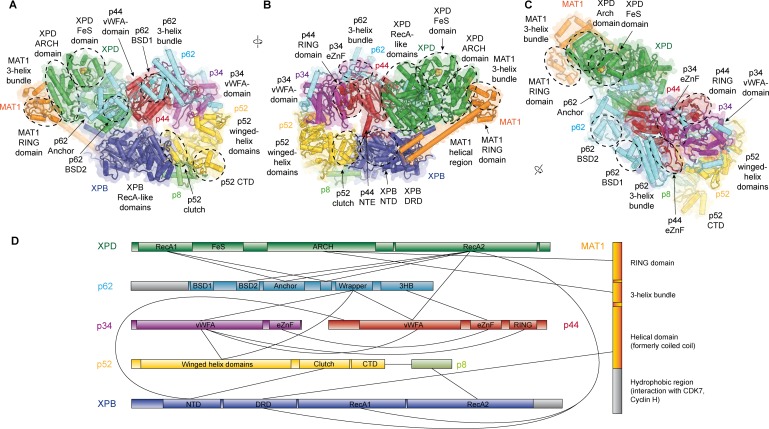
Figure 1. Structure of the TFIIH core complex.

(A, B, C) Three views of the structure of the TFIIH core complex and MAT1. Subunits are color-coded and labeled (in color); individual domains are labeled (in black) and circled if needed for clarity. (D) Domain-level protein-protein interaction network between the components of the TFIIH core complex and MAT1 derived from the interactions observed in our structure. Proteins are shown with the same colors as in A and major unmodeled regions are shown in grey. Abbreviations: CTD: C-terminal domain; DRD: DNA damage recognition domain; FeS: iron sulfur cluster domain; NTD: N-terminal domain; vWFA: von Willebrand Factor A.

Figure 1.

Figure 1—figure supplement 1. Sample micrograph, sample 2D classes, and data processing scheme for global reconstruction.
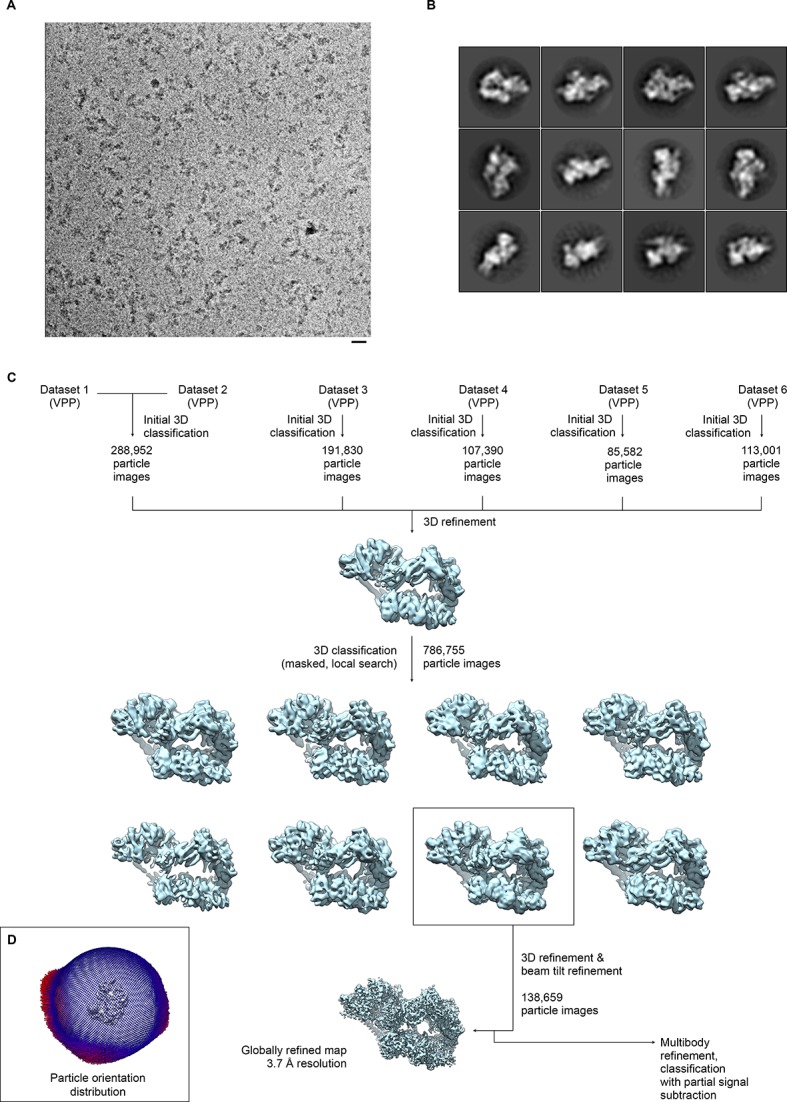
Figure 1—figure supplement 1.

(A) Sample micrograph from dataset 2. TFIIH particles are clearly visible. Scale bar: 200 Å. (B) Sample 2D classes from dataset 2. Note that 2D classification was only used for initial characterization of the datasets, but not for subsequent data processing. (C) Data processing workflow. The datasets (DS) were initially processed individually, with the exception of DS6, where particles from DS4 were used to compensate for orientation bias, and DS1/DS2, which were joined for processing. Subsequently, the datasets were pooled and sub-classified. The best class was used for the final refinement to obtain a globally refined map at 3.7 Å resolution (see Figure 1—figure supplement 2). The classified VPP dataset was also used for further processing and classification of sub-regions (Figure 1—figure supplements 35). (D) Depiction of the orientation distribution of the particle images in the final reconstruction. As also evident from the 2D classes (C), the orientations populate mostly a zone that corresponds to particles adhering to the carbon support with long axis of the complex parallel to the support layer, and a range of orientations arising from rotation of the particles around that long axis.
Figure 1—figure supplement 2. Resolution estimation, validation statistics, and quality of the density.
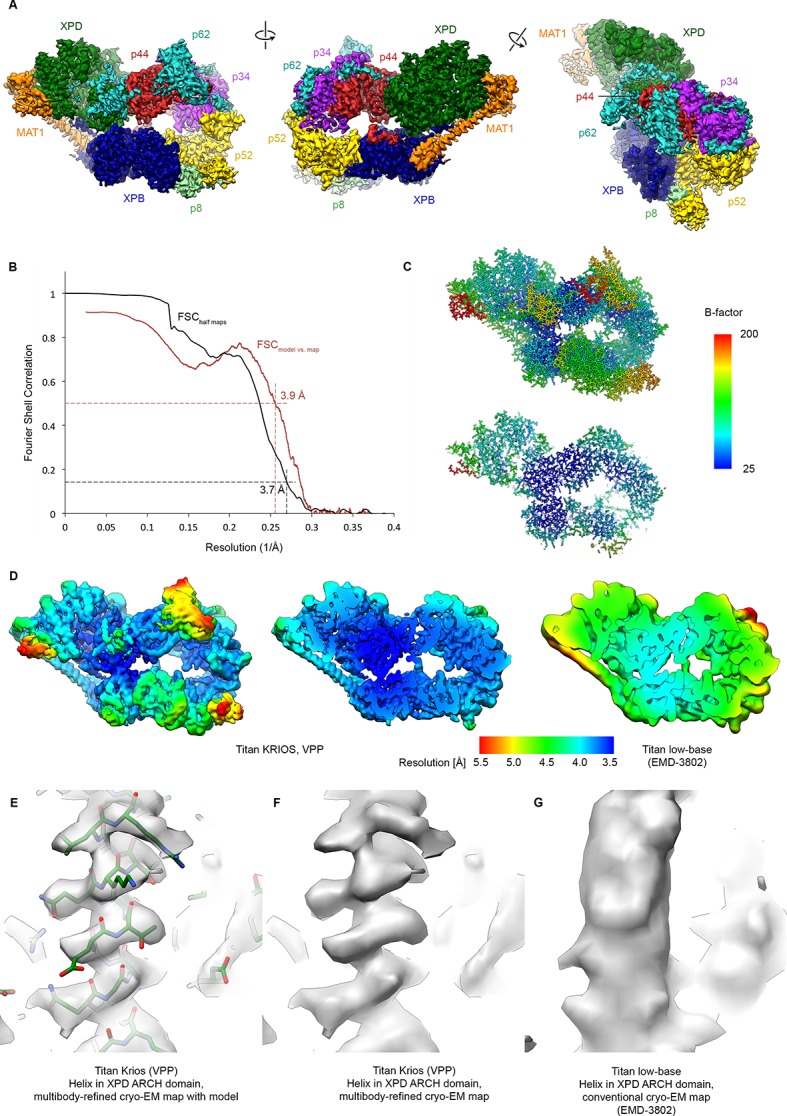
Figure 1—figure supplement 2.

(A) Three views of the refined, sharpened, and low-pass filtered cryo-EM map of the TFIIH core complex. Protein subunits are color-coded and labeled. (B) Fourier shell correlation (FSC) curves. Black: FSC curve between cryo-EM half-maps. Red: FSC curve between map and refined model. The resolution at the appropriate thresholds (Rosenthal and Henderson, 2003; Scheres and Chen, 2012) is indicated. (C) B-factor distribution on the refined TFIIH coordinate model. (D) Local resolution estimation, computed by windowed FSC in RELION 3. (E, F, G) Comparison of the 3.6 Å multibody-refined cryo-EM map of the TFIIH core complex (E, F) with our previous 4.4 Å cryo-EM map (G) shows substantial improvements in map quality in the more peripheral and flexible regions of the complex (an α-helix from the XPD ARCH domain is shown).
Figure 1—figure supplement 3. Focused classification of the p62 BSD2 domain.
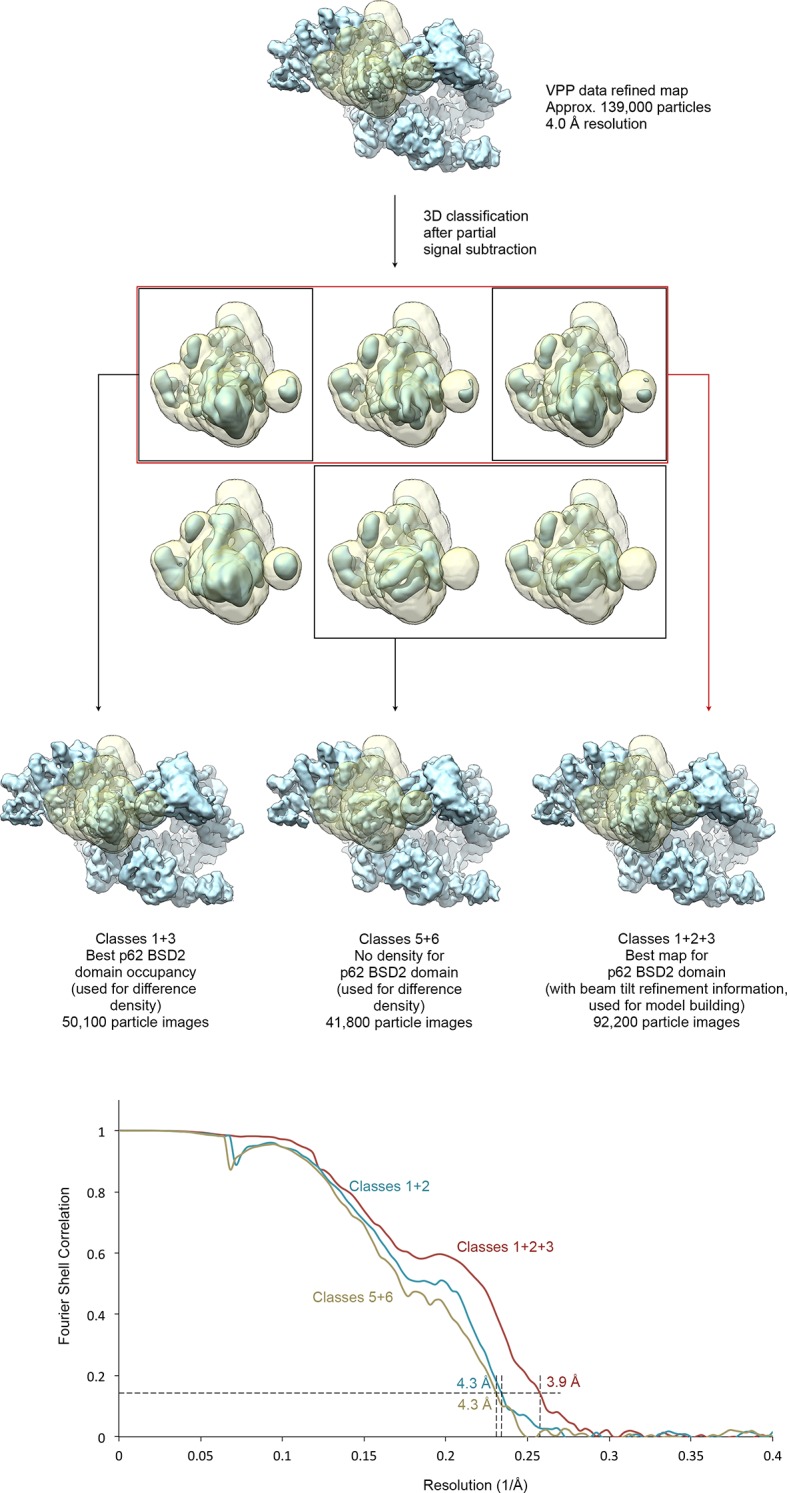
Figure 1—figure supplement 3.

(A) Focused classification for the p62 BSD2 domain and adjacent structural elements using the classified VPP dataset (indicated in Figure 1—figure supplement 1). Partial signal subtraction (Bai et al., 2015) and masking were used to focus the classification on the region of interest (mask shown in transparent yellow). Selected classes were refined using the selected but un-subtracted particle images because the region of interest is too small for efficient image alignment (Nguyen et al., 2016). (B) FSC curves for the three refined maps shown in (A), indicating resolution of 3.9–4.3 Å according to the FSC = 0.143 criterion (Rosenthal and Henderson, 2003).
Figure 1—figure supplement 4. Focused classification and interpretation of the MAT1 RING domain density.
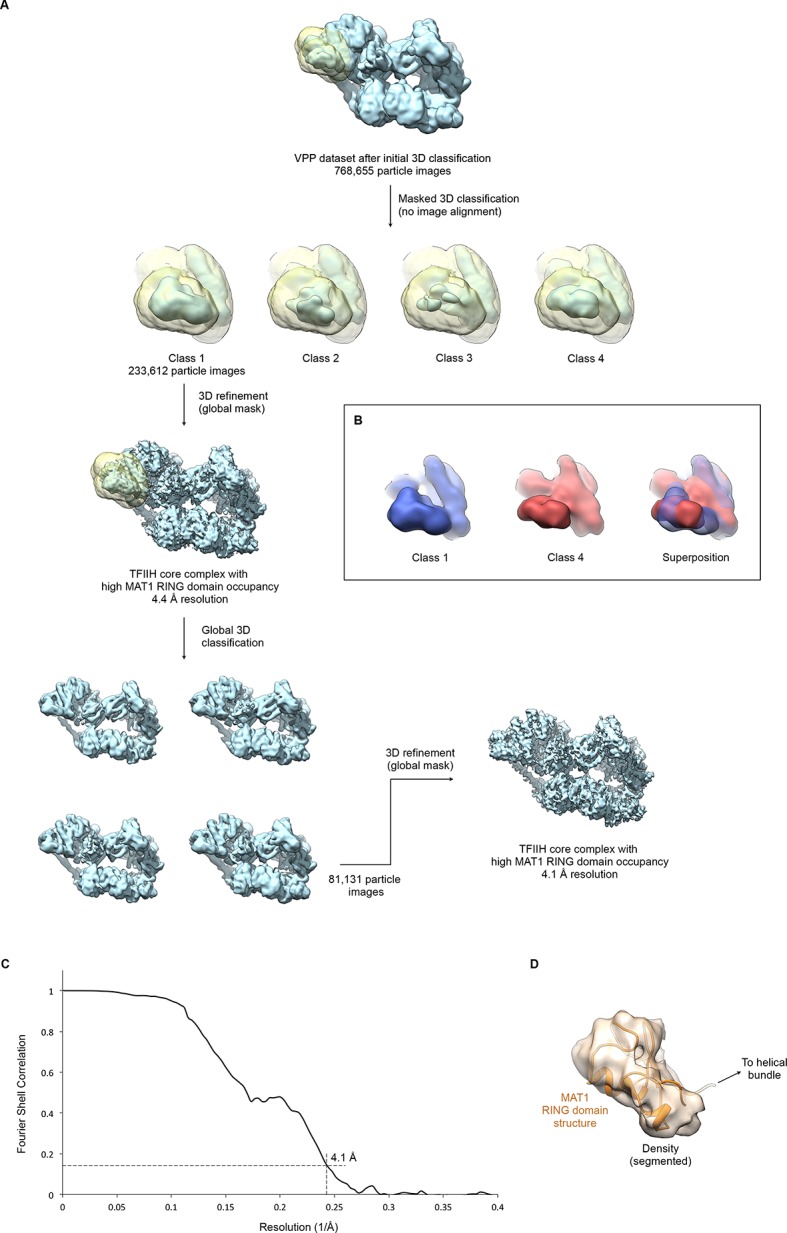
Figure 1—figure supplement 4.

(A) The entire pool of pre-classified TFIIH particles from the VPP datasets was subjected to alignment-free focused 3D classification using a mask that covers the MAT1 RING domain and helical bundle. Signal subtraction was not required due to the peripheral location of the region in the complex and the orientation distribution of the particle images. After one round of additional global classification (to select for overall particle quality and conformation), the class showing the most highly occupied density for the MAT1 RING domain was refined to 4.1 Å resolution (using beam tilt values imported from the best-resolution refinement, Figure 1—figure supplement 1). (B) 3D classes differed not only in occupancy (i.e. classes 2 and 3 showed low occupancy and fragmented density for the MAT1 RING domain) but also in the orientation of the MAT1 RING domain, which is flexibly attached to the complex. Classes 1 and 4 are shown in different colors individually and superposed to highlight the different orientations of the MAT1 RING domain. (C) The FSC curve estimates a resolution of 4.1 Å for the refined map of TFIIH with high occupancy of the MAT1 RING domain. (D) Best fit of the structure of the MAT1 RING domain (Gervais et al., 2001) into the cryo-EM map, obtained using the FITMAP command in UCSF CHIMERA (Pettersen et al., 2004) with 100 independent initial placements before local optimization at 5 Å resolution. This fit shows the best correlation between model and map and additionally satisfies geometrical constraints imposed by the continuity of the peptide chain between the RING domain and the MAT1 helical bundle.
Figure 1—figure supplement 5. Multibody refinement.
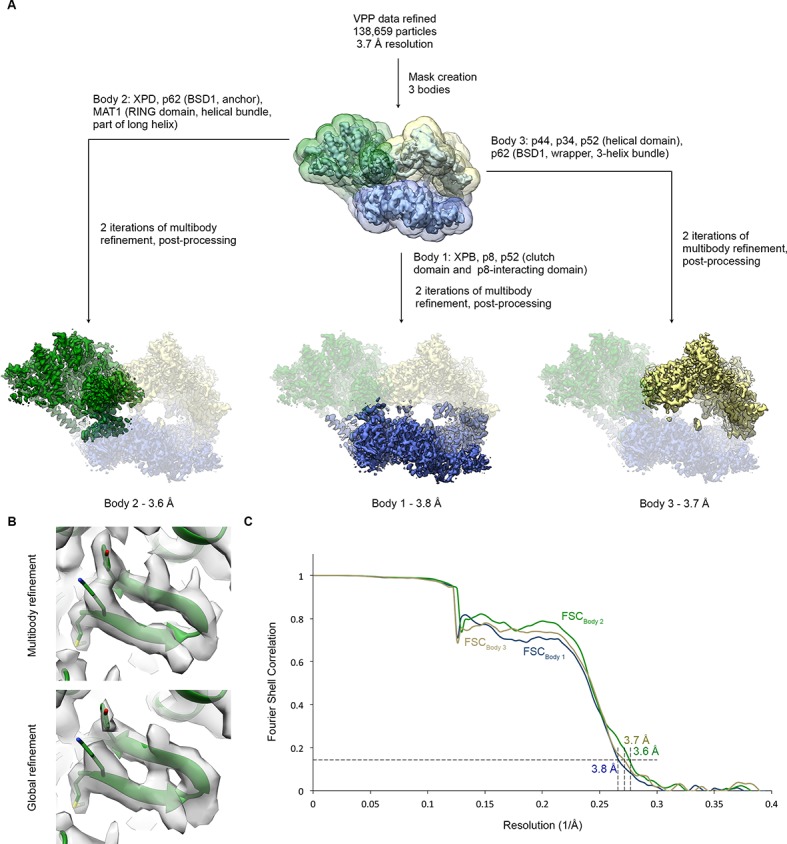
Figure 1—figure supplement 5.

(A) Schematic for multibody refinement (Nakane et al., 2018) of the classified VPP dataset (indicated in Figure 1—figure supplement 1). Three bodies were used and subjected to multibody refinement using the corresponding masks. (B) Example of the improvement of the cryo-EM density for the XPD N-terminus after multibody refinement (top) relative to the global refinement (bottom). (C) FSC curves for the refined bodies, indicating resolutions of 3.6–3.8 Å according to the FSC = 0.143 criterion (Rosenthal and Henderson, 2003).
Figure 1—figure supplement 6. Detailed architecture of the TFIIH core complex.
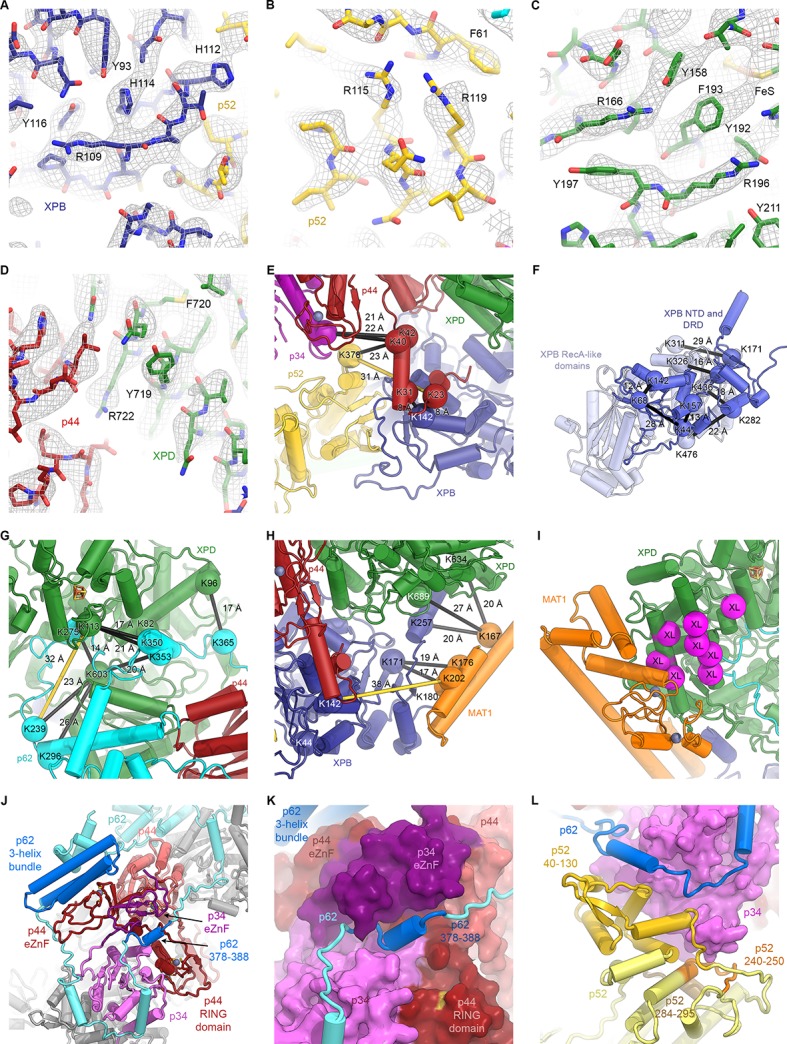
Figure 1—figure supplement 6.

(A–D) The refined coordinate model is shown in the 3.7 Å-resolution cryo-EM map or the 3.6 Å-resolution multi-body refined XPD map. Large side chains are indicated. (E–H) Mapping of CX-MS data (Luo et al., 2015) onto the atomic coordinate model. Crosslinked residues are shown as spheres, crosslinks as black lines (crosslinks > 30 Å apart as yellow lines). (E) Crosslinks between the p44 NTE and XPB, p52, and p34 confirm the tracing of the p44 NTE towards the XPB NTD. (F) Intramolecular crosslinks in XPB validate the tracing of the XPB NTD. (G) Crosslinks between p62 and XPD. Crosslinks between p62 and p44 are not shown (see Materials and methods and Supplementary file 4). (H) Crosslinks between MAT1 and XPB and XPD. One strong outlier connecting XPB K44 to the MAT1 helical bundle (>100 Å distance) is a likely false positive and is not shown. (I) Location of site-specific crosslinks between RAD3, the yeast XPD homolog (RAD3 residues carrying the crosslinker mapped onto the XPD structure and shown as purple spheres) and TFB3, the yeast MAT1 homolog (Warfield et al., 2016). (J) Interlocking zinc-binding domains of p44 and p34 mediate interactions between these proteins in the hinge region. The p62 C-terminal 3-helix bundle binds to the p44 eZnF domain. (K) Residues 378–388 of p62 are sandwiched between the zinc-binding domains of p34 and p44. (L) View of the p62-p52-p34 interaction region.