

Abstract
The muscle and tendon complex of the foot helps to support the foot arch and generates the muscle force of the foot. The present study investigated the force‐generating capacity of the toe flexor muscles and the dynamic function of the foot arch when standing upright, and the relationships between these indices. The maximum toe flexor force and foot arch height in the sitting and standing positions were studied in the left and right feet of 224 healthy young individuals. To measure the maximum isometric force of the toe flexor muscles, the subjects exerted maximum force on a toe grip dynamometer. Measurements were repeated three times with at least a 1‐min rest period between bouts, and the maximum value among the measurements for each foot was used for further analysis. The absolute value of the toe flexor strength was normalised by body mass. The foot arch height was measured the distance between the tuberosity of the navicular bone and the floor, and normalised by height. The relative foot arch height difference between the sitting and standing positions was evaluated as the foot arch dynamics. The maximum isometric toe flexor strength was 42% higher in the standing position than in the sitting position. There was no relationship between the relative toe flexor strength and the relative foot arch height in either the sitting or standing positions; however, the relative increase in toe flexor strength from sitting to standing (the force amplification factor) was related to the foot arch dynamics, and the flexible foot arch showed a greater increase in the toe flexor strength from sitting to standing compared with the strength in the stiff foot arch. The results of this study suggest that the force‐generating capacity of the toe flexor muscles is augmented by bodyweight bearing in upright standing. Additionally, the force amplification mechanism is mechanically regulated by the dynamic function of the foot arch in conjunction with the stretching of the muscle–tendon complex of the foot.
Keywords: foot arch dynamics, foot arch height, foot flexibility, force amplifier, force enhancement, isometric toe flexor strength
Introduction
Through the human evolutionary process, the biomechanical function of the foot needed to adapt to upright bipedal movement. The human foot is the terminal component of a closed kinetic chain in the lower limb, and only the foot contacts the ground during upright locomotion. For the functional base of the body, the human foot naturally adapted to bear bodyweight through daily upright activities over years. It is believed that the functional role of the foot has become specific to supporting body mass during upright locomotion (Tam et al. 2014). The unique truss structure of the foot is created by many bones and muscles. A foot consists of three arches: the medial longitudinal, lateral longitudinal and transversal arches. The truss structure of the foot or the foot arch is considered to play a spring‐like role to absorb shock and reduce ground reaction force during movements (Ker et al. 1987). Because of this unique anatomical structure of the foot, scientists have endeavoured to discover the function of the human foot for decades. However, how the functional role of the foot arch relates to the function of the foot muscles remains a subject of discussion.
The toe flexor muscles contributed to producing force at the metatarsophalangeal (MTP) joints, and the cross‐sectional areas of the intrinsic and extrinsic foot muscles were related to the toe flexor muscle strength (Kurihara et al. 2014). Practically, the toe flexor muscle strength has an important role in enhancing the physical performance of the lower limbs in humans. Indeed, maximum toe flexor strength was significantly correlated with dynamic lower‐limb physical performances such as sprinting and horizontal jumping in children (Morita et al. 2015) and adolescents (Otsuka et al. 2015). The toe flexor muscles also help support the foot arches (Bojsen‐Møller, 1979). Regarding the clinical relevance of the toe flexor muscle strength, the foot strength and structure often gets attention because it is considered to be associated with injuries (Kaufman et al. 1999; Williams et al. 2001). Weak foot muscles may cause pain and movement problems, which include difficulties in walking or running (Garth & Miller, 1989) and increased risk of falls in elderly individuals (Mickle et al. 2009). In fact, atrophy of the toe flexor muscles in the forefoot has been reported in patients with plantar fasciitis (Chang et al. 2012). In contrast, strong toe flexors help prevent increased mobility when pronation control is required and thus lead to a decreased risk of lower‐limb overuse injuries (Aibast et al. 2017). The abductor hallucis muscle is one of the toe flexor muscles and has a function in elevating the arch of the foot when the hallux is fixed on the ground (Wong, 2007). Therefore, for preventing lower‐limb injuries and movement problems, it is important to quantify the morphological characteristics and muscle strength of the foot and understand the specific functions of the human foot.
Given that the muscle and tendon complex of the foot helps to support the foot arch and generates the muscle force of the foot at the MTP joint during bipedal movement (Bojsen‐Møller, 1979; Kura et al. 1997; McKeon et al. 2015), it is necessary to clarify the relationship between the function of the foot muscles and foot morphology in upright standing. It is conceivable that the dynamic function of the foot arch could be related to the muscle functions of the foot when standing upright. However, there is no study available on how the forced‐generating capacity of the foot relates to the foot arch in upright standing. Therefore, the present study investigated the force‐generating capacity of toe flexor muscles and the dynamic function of the foot arch when standing upright and the relationships between these indices. Understanding the architectural and muscular functions of the foot may give an insight into how humans evolutionally advanced to upright bipedal locomotion, and provide practical information about the prevention of the modern increases in the number of work‐ and sports‐related musculoskeletal disorders of the foot.
Methods
Subjects
Potential volunteers were verbally recruited from a class at local universities. Individuals who were physically active and healthy but did not experience regular foot exercise training were invited to participate in the study. After a preliminary screening evaluation that included a medical history and fitness profile, subjects who did not have a history of serious foot and leg injury or surgery, were not taking any medications, and had no medical risk factors, and no foot deformity and neuroarthropathy were included in the test. In all, 224 healthy young individuals (men, 127; women, 97; age, 20.1 ± 1.8 years; height, 166.8 ± 8.4 cm; body mass, 59.4 ± 10.6 kg, mean ± SD) who met the inclusion criteria participated. A total of 448 feet, including both the left and right feet of each subject, (men, 254; women, 194) were pooled and used for analysis in accordance with previous studies (Williams & McClay, 2000; Gilmour & Burns, 2001; McPoil et al. 2008). Gilmour & Burns (2001) showed that there were significant differences between the left and right feet in the foot arch height, whereas McPoil et al. (2008) showed that there were no significant differences between the left and right feet for any of the foot measurements. Whether the left and right feet were independent variables remains a subject of discussion; however, we dealt with each of the task‐related independent components in each foot. The methods and all procedures used during this experiment were in accordance with current local guidelines and the Declaration of Helsinki and were approved by the Ethical Committee for Human Experiments of Toin University of Yokohama. All subjects were informed about the experimental procedure as well as the purpose of the study prior to the onset of study. Written informed consent was obtained from all participants.
Experimental procedure
Toe flexor strength (TFS)
The TFS was measured in the sitting and standing positions using a specifically designed toe grip dynamometer (T.K.K.3361, Takei Scientific Instruments Co., Niigata, Japan). The details of the apparatus and methodology and the reproducibility of the measurement have been described elsewhere (Kurihara et al. 2014; Morita et al. 2015; Otsuka et al. 2015; Yamauchi & Koyama, 2015; Koyama & Yamauchi, 2017). The range of force with this dynamometer is 1–400 N. The experimental setup is shown in Fig. 1. The dynamometer consisted of strain gauge force transducers, and the force was measured when the grip bar was pulled. After the subjects warmed up for a few minutes and stretched their leg and foot muscles, the foot was placed on the dynamometer and was fixed with the heel stopper. During the measurements, each subject placed the arms in front of the chest and was instructed to perform the task without flexing the knee joint in the sitting position or extending the hip joint in the standing position. The opposite foot was positioned beside the dynamometer. Prior to the maximum measurement, subjects performed three to five trials at a submaximum level of isometric force. For the measurement of maximum TFS, subjects exerted maximum force for ~ 3 s on the dynamometer. The maximum values of the three measurements for each foot were used for further analysis. The TFS relative to body mass (BM) was represented by relative TFS: rTFS = TFS (N) × BM (kg)−1.
Figure 1.

Experimental setup for the toe flexor strength and foot arch function. (A) The toe grip dynamometer and toe flexor strength measurement in sitting and standing positions. (B) Measurement sites for the foot arch height (FAH) in sitting (solid black line) and standing (dotted grey line) positions. The foot arch dynamics was assessed using the relative FAH change between sitting and standing: (FAHsitting – FAHstanding)/FAHsitting × 100.
Additionally, the TFS difference between sitting and standing (force amplification factor) was evaluated using the following equation:
where TFSstanding was defined as the TFS when standing with approximately 50% bodyweight on each foot, and TFSsitting was defined as the TFS when sitting and bearing no weight on either foot.
Foot arch height and function
The foot arch height (FAH) was measured in the sitting and standing positions using a ruler (Morita et al. 2015). To measure the FAH, the most medial prominence of the navicular tuberosity was palpated and marked with a black pen (Fig. 1). The vertical distance between the navicular tuberosity of the foot and the floor was measured as the FAH. The vertical height of the navicular bone has been used as a noninvasive clinical measure of the medial longitudinal arch (Gilmour & Burns, 2001). The FAH relative to the height was represented by relative FAH: rFAH = FAH/height × 100. The foot arch dynamics was assessed using an equation for calculating the relative foot arch height change between non‐weight‐bearing sitting and standing with approximately 50% of the bodyweight on each foot. This equation is a modification of the foot mobility test described by McPoil et al. (2008).
where the FAHsitting was defined as the FAH while sitting with no weight on either foot, and the FAHstanding was defined as the FAH while standing with approximately 50% of bodyweight on each foot. The foot arch dynamics was further classified into stiff and flexible foot arches based on the mean and standard deviation values (McPoil & Cornwall, 2005).
Data analysis
All data are presented as the means ± SD. The Kolmogorov–Smirnov test was used to determine the normally distributed variables. If the measurement variables were not normally distributed, the nonparametric Wilcoxon rank‐sum test was used to determine the significance of variables measured in the sitting and standing position. If the measurement variables were normally distributed, a paired Student's t‐test was used. A paired Student's t‐test was used to determine the significance of variables measured in the sitting and standing positions. The effect size (ES: Cohen's d) was calculated to examine the average effect of posture (sitting and standing) and foot arches (stiff and flexible). The ES was classified as trivial (0–0.19), small (0.20–0.49), medium (0.50–0.79) and large (0.80 and greater) degrees (Cohen, 1992). The least‐squares regression analysis was performed for the relationships between different parameters. The Kruskal–Wallis non‐parametric inferential test, following by pair‐wise comparisons using Dunn's procedure with Bonferroni correction for multiple comparisons, was used to determine the significance of TFS variables among the groups of the normal (the average value), stiff and flexible arches in men and women. The level of statistical significance was set at P < 0.05.
Results
Table 1 summarises muscle strength and morphological characteristics of the foot when sitting and standing. The values of TFS, rTFS, FAH in sitting and standing and the foot arch dynamics were not normally distributed, whereas those of rFAH in sitting and standing were normally distributed and had equal variances. The TFS and rTFS were significantly increased from sitting to standing, and the relative TFS difference between sitting and standing (the force amplification factor) was 42.1 ± 33.9%, 36.9 ± 30.0% and 49.0 ± 37.5% overall, and for men and women, respectively. The FAH was significantly decreased from sitting to standing, and the relative FAH change from sitting to standing (the foot arch dynamics) was 12.9 ± 8.0%, 11.7 ± 6.9% and 14.5 ± 9.0% overall, and for men and women, respectively. Gender differences were found in all foot variables, except the rFAH in the sitting position.
Table 1.
Muscle strength and morphological characteristics of the foot when sitting and standing
| Variables | Sitting | Standing | Differences | 95 % CI | Effect size | |
|---|---|---|---|---|---|---|
| Sitting | Standing | |||||
| TFS (N) | ||||||
| Overall | 126.9 ± 49.7 | 173.2 ± 61.7* | 46.3 ± 34.7 | 122.3–131.5 | 167.5–179.0 | 1.33 |
| Men | 152.2 ± 44.3 | 202.7 ± 55.1* | 50.5 ± 37.8 | 146.7–157.7 | 195.9–209.5 | 1.34 |
| Women | 93.8 ± 34.9** | 134.7 ± 46.9* , ** | 40.9 ± 29.4 | 88.9–98.7 | 128.0–141.3 | 1.39 |
| rTFS (N kg−1) | ||||||
| Overall | 2.12 ± 0.71 | 2.91 ± 0.89* | 0.79 ± 0.59 | 2.05–2.19 | 2.82–2.99 | 1.34 |
| Men | 2.34 ± 0.68 | 3.11 ± 0.82* | 0.77 ± 0.59 | 2.26–2.42 | 3.01–3.21 | 1.32 |
| Women | 1.83 ± 0.65** | 2.64 ± 0.91* , ** | 0.81 ± 0.59 | 1.74–1.92 | 2.51–2.77 | 1.37 |
| FAH (cm) | ||||||
| Overall | 4.99 ± 0.75 | 4.34 ± 0.74* | 0.65 ± 0.41 | 4.92–5.06 | 4.27–4.41 | 1.57 |
| Men | 5.19 ± 0.65 | 4.58 ± 0.66* | 0.61 ± 0.38 | 5.11–5.27 | 4.50–4.66 | 1.63 |
| Women | 4.71 ± 0.78** | 4.02 ± 0.73* , ** | 0.69 ± 0.45 | 4.60–4.82 | 3.92–4.13 | 1.53 |
| rFAH | ||||||
| Overall | 2.99 ± 0.42 | 2.60 ± 0.41* | 0.39 ± 0.25 | 2.95–3.03 | 2.56–2.64 | 1.55 |
| Men | 3.02 ± 0.38 | 2.66 ± 0.38* | 0.36 ± 0.22 | 2.97–3.07 | 2.62–2.71 | 1.63 |
| Women | 2.95 ± 0.46 | 2.52 ± 0.44* , ** | 0.43 ± 0.28 | 2.88–3.02 | 2.46–2.58 | 1.53 |
All values represent the means ± SD. 95% CI, 95% confidence interval.
FAH, foot arch height; the rTFS was calculated using the TFS relative to body mass; the rFAH was calculated using the FAH relative to height; rTFS, relative toe flexor strength; TFS, toe flexor strength.
A significant difference between sitting and standing at P < 0.01.
A significant difference between men and women at P < 0.01.
The TFS was significantly correlated with body mass both in the sitting position (overall: r = 0.562; men: r = 0.264; women: r = 0.337) and standing position (overall: r = 0.548; men: r = 0.300; women: r = 0.284). The FAH was significantly correlated with height both in the sitting position (overall: r = 0.368; women: r = 0.315) and standing position (overall: r = 0.413; men: r = 0.128; women: r = 0.326), but not in the sitting position in men (r = 0.109). Because the TFS and FAH were affected by body size, the normalised variables were used to determine the correlations between the TFS and FAH. There was no relationship between the rTFS and rFAH either in the sitting position (overall: r = 0.003; men: r = 0.063; women: r = −0.129) or standing position (overall: r = 0.017; men: r = −0.046; women: r = −0.015), indicating that the rTFS and rFAH were independent variables.
The stiff foot arch was defined if the foot arch dynamics was less than 4.93% (n = 66, men = 42, women = 24), and the flexible foot arch was defined if the foot arch dynamics was greater than 20.89% (n = 69, men = 27, women = 42). TFS and rTFS in the stiff foot arch (n = 42) in men were 153.3 ± 44.7 N and 2.28 ± 0.66 N kg−1 when the sitting position and 189.0 ± 54.3 N and 2.80 ± 0.74 N kg−1 when in the standing position, whereas those in the flexible foot arch (n = 27) were 138.4 ± 44.3 N and 2.09 ± 0.62 N kg−1 when the sitting position and 206.1 ± 61.8 N and 3.10 ± 0.84 N kg−1 when in the standing position. TFS and rTFS in the stiff foot arch (n = 24) in women were 95.3 ± 32.5 N and 1.87 ± 0.61 N kg−1 when in the sitting position and 133.9 ± 45.1 N and 2.64 ± 0.87 N kg−1 when in the standing position, whereas those in the flexible foot arch (n = 42) were 84.6 ± 34.9 N and 1.64 ± 0.65 N kg−1 when in the sitting position and 119.6 ± 46.5 N and 2.30 ± 0.82 N kg−1 when in the standing position. When comparing these TFS and rTFS variable among the groups of normal (the average value), stiff and flexible arches, no significant differences were found either in men or women.
To evaluate how the increase in toe flexor strength in standing related to the dynamic function of the foot arch, least‐squares regression analysis was used and revealed that the force amplification factor was correlated with the foot arch dynamics overall (r = 0.155, P < 0.01) and for men (r = 0.215, P < 0.01), but not for women (r = 0.059, P = 0.414). Additionally, when comparing the force amplification factor between the flexible and stiff foot arches, the flexible foot arch showed a greater increase in the TFS from the sitting to the standing position (P < 0.01, ES = 0.468; Fig. 2). This increase in the TFS in the flexible foot arch when standing (the force amplification factor) was 51.1 ± 41.7% of the value of that in the sitting position, whereas the force amplification factor in the stiff foot arch was 33.5 ± 32.8% of the value of that in the sitting position.
Figure 2.
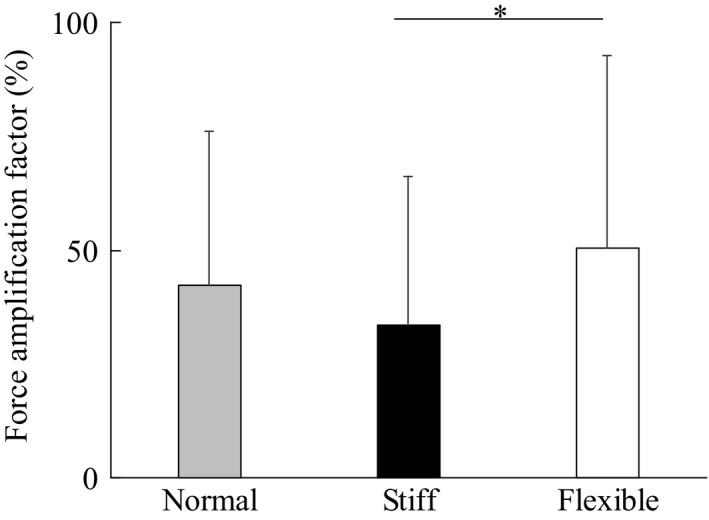
The TFS difference between sitting and standing (the force amplification factor) in the stiff arch and flexible arch. All values represent the means ± SD. The force amplification factor = (TFSstanding – TFSsitting)/TFSsitting × 100; Normal: the average value of the force amplification factor for 448 feet as a reference; * Significant difference between the stiff foot arch (n = 66) and the flexible foot arch (n = 69) at P < 0.01.
Discussion
This study showed the force‐generating capacity of the foot and the function of the foot arch in upright standing. Maximum isometric toe flexor strength was significantly higher when standing than when sitting. No relationship between the relative maximum toe flexor strength and relative foot arch height was found either in the sitting or standing positions; however, the relative increase in toe flexor strength from sitting to standing was related to the foot arch dynamics, and the flexible foot arches showed a greater increase in toe flexor strength from sitting to standing compared with the stiff foot arches. The results of this study suggest that the force‐generating capacity of the toe flexor muscle is augmented by bodyweight bearing in upright standing. Additionally, this force amplification mechanism in upright standing is mechanically regulated by the dynamic function of the foot arch in conjunction with the stretching of the muscle–tendon complex of the foot. To our knowledge, this study explains for the first time experimentally, the integrativism of the force‐generating capacity of the foot and the dynamic functions of the foot arch in upright standing.
This study showed that the maximum toe flexor strength was significantly higher in the standing position than in the sitting position. It is interesting to know the mechanism underlying the increase in the force‐generating capacity of the toe flexor muscles when standing compared with when sitting. The tension of the plantar fascia is increased when a vertical force is applied to the truss structure of the foot (Erdemir et al. 2004). Stretching of the plantar fascia and muscles could increase the tension of the muscle and tendon complex of the foot arch (Caravaggi et al. 2009). When activated muscle fibres are forcefully stretched, muscles can produce a higher force than when they are not stretched (Minozzo et al. 2013). To increase force production of the muscle, the muscles could be stretched prior to the muscle shortening (Mero et al. 1992). The results of this study suggest that the stretching of the foot muscles may change the properties of the contractile machinery of the foot, which enhances the force production (Fig. 3). Changes in the length of the intrinsic and extrinsic foot muscles induced by bodyweight bearing when standing may also affect the length–tension relationship of the foot muscles. Therefore, it is conceivable that changes in the muscle and tendon complex of the foot arch might help to generate the muscle force of the foot during movement.
Figure 3.

Schematic diagram of the force amplification mechanism for the toe flexors in upright standing. MTC, Muscles, tendon, fascia & aponeurosis complex; MTP, metatarsophalangeal joints.
Toe flexor strength was independent of the foot arch height. This finding agreed with our previous study in children that showed that the toe flexor strength was not related to the foot arch height (Morita et al. 2015). Nevertheless, the foot arch is considered to play a spring‐like role in absorbing shock and reducing the ground reaction force during the movements (Ker et al. 1987). The foot arch seems to function by storing and releasing elastic strain energy during repetitive dynamic movements (Morita et al. 2015). This suggests that the toe flexor muscles help to support the foot arches and contribute to the generation of force at the MTP joints (Bojsen‐Møller, 1979; Kura et al. 1997; McKeon et al. 2015). Increasing the vertical load on the foot lowers the foot arch height and increases the activities of the intrinsic muscles of the foot (Kelly et al. 2014). Considering that a vertical force enhances the intrinsic muscles of the foot by changing the form of the foot arch during dynamic upright activities (Franettovich et al. 2007; Caravaggi et al. 2009), the increase in standing TFS compared with that during sitting could be induced by the stretching of the muscle‐tendon complex of the foot. A correlation analysis revealed the positive relationships between the relative differences in the TFS from sitting and standing positions (the force amplification factor) and the relative differences in the FAH from sitting and standing positions (the foot arch dynamics), partly explaining the mechanical advantage of the function of the foot arch. Additionally, the flexible foot arch showed a greater increase in TFS from sitting to standing than the stiff foot arch (51.1 vs. 33.5). The stiff foot arch showed a smaller force amplification factor but the flexible foot arch showed a larger force amplification factor compared with the average value of the force amplification factor (42.1%). This indicates that increasing the stiffness of the muscle and tendon complex of the foot by stretching the muscle and tendon complex of the foot can enhance the force‐generating capacity of the foot. It should be acknowledged that the characteristics of the foot sole, such as heel pad compression, contribute to some extent to the foot arch dynamics.
Based on these anatomical structures and muscular force‐generating capacity of the foot, our findings indicate that the significance of the truss structure in the foot arches could be attributed to increases in the tension of the plantar fascia and muscles and the increase in the strength of the toe flexors when standing (Fig. 3). During walking, the winding of the plantar fascia around the metatarsal heads occurs after the mid‐stance when the foot is ready to lift off the ground; therefore, the foot muscles activate and generate forces in the push‐off phase of the gait (Hicks, 1954). This function of the foot arch is to increase the muscle force at the MTP joints with an increase in plantar fascia tension (Caravaggi et al. 2009). This might also be influenced by the neurological factors of the foot because the force‐generating capacity of the muscles is generally determined by both neurological and musculoskeletal factors. Therefore, further study is needed to identify the effects of changes in the anatomical structure of the foot arch on neuromuscular properties of the foot during locomotion. Additionally, an extension of the knee joint when standing may influence the activities of the extrinsic foot muscles. Because the muscles of the leg and the foot mechanically reflect to the joint moment via the kinetic chain, an extension of the knee may increase the stiffness of the lower leg to generate a larger force to the foot.
From a practical standpoint, the results of this study may provide new ideas to understand the mechanical properties of the foot and to develop the functions of the foot to improve physical performance. With caution, some artefactual factors on the foot such as shoes and ankle/foot braces might affect the function of the foot arch and impair the force‐generating capacity of the foot. Indeed, we showed that the acute responses in ground reaction force, lower limb joint kinematics and muscle activities during a drop jump were different in shod and barefoot conditions (Koyama & Yamauchi, 2018). Additionally, limiting the movements of the ankle joint and the foot using ankle braces impaired the force production of the muscles of the foot and lower leg (Yamauchi & Koyama, 2015) as well as the jump performance (Koyama et al. 2014). These findings suggest that optimising foot function should be considered in the functional role of both foot muscle strength and foot arch dynamics in the upright standing locomotion.
There were several limitations inherent to this study. Confounding factors such as physical activity levels and ages were not considered in this study. These factors may have influenced some of the measured variables of the foot. The foot muscles have adapted to bear bodyweight during physical activities over the years. When barefoot, the foot muscles are used to grip the ground, whereas the sole of a shoe prevents the foot from gripping the ground. Individuals who habitually walk barefoot have different morphological characteristics of the foot (Hollander et al. 2017) and running forms (Lieberman et al. 2010) than individuals with the habit of wearing shoes. Further studies should examine the nature of the muscle adaptation in the foot, including the neural factors of the intrinsic muscles of the foot. Additionally, because the toe flexor strength was positively correlated with body mass, it is interesting to know how body mass affects the adaptation of muscle strength and morphology of the foot. Therefore, we need to stratify variables further and specifically address the subgroups of overweight and obese sedentary subjects in a future study. Further study is still required for investigation of the force‐generating capacity of the foot muscles and the foot arch dynamics in upright standing.
Conclusion
The maximum isometric toe flexor strength was significantly higher in the standing position than in the sitting position. The toe flexor strength was not related to the foot arch height; however, the increase in the force‐generating capacity of the foot in upright standing was affected by the foot arch dynamics. Therefore, the force‐generating capacity of the foot and the dynamic functions of the foot arch were influenced by both external and internal factors (e.g. loading, arch flexibility) in upright standing in the human. This study reconceptualises the role of the foot arch structure in human upright standing in that the foot arch structure functions not only as a shock absorber but also as a force amplifier of the foot muscles.
Conflicts of interest
The authors report no conflicts of interest related to this work.
Acknowledgements
The authors thank all subjects who participated in this study. This work was supported by the Ministry of Education, Culture, Sports, Science and Technology: Grant‐in‐Aid for Young Scientists (A) to J.Y.; Grant‐in‐Aid for Exploratory Research to J.Y.; and Grant‐in‐Aid for Scientists (C) to K.K
References
- Aibast H, Okutoyi P, Sigei T, et al. (2017) Foot structure and function in habitually barefoot and shod adolescents in Kenya. Curr Sports Med Rep 16, 448–458. [DOI] [PubMed] [Google Scholar]
- Bojsen‐Møller F (1979) Calcaneocuboid joint and stability of the longitudinal arch of the foot at high and low gear push off. J Anat 129, 165–176. [PMC free article] [PubMed] [Google Scholar]
- Caravaggi P, Pataky T, Goulermas JY, et al. (2009) A dynamic model of the windlass mechanism of the foot: evidence for early stance phase preloading of the plantar aponeurosis. J Exp Biol 212, 2491–2499. [DOI] [PubMed] [Google Scholar]
- Chang R, Kent‐Braun JA, Hamill J (2012) Use of MRI for volume estimation of tibialis posterior and plantar intrinsic foot muscles in healthy and chronic plantar fasciitis limbs. Clin Biomech 27, 500–505. [DOI] [PubMed] [Google Scholar]
- Cohen J (1992) A power primer. Psychol Bull 112, 155–159. [DOI] [PubMed] [Google Scholar]
- Erdemir A, Hamel AJ, Fauth AR, et al. (2004) Dynamic loading of the plantar aponeurosis in walking. J Bone Joint Surg Am 86‐A, 546–552. [DOI] [PubMed] [Google Scholar]
- Franettovich MM, McPoil TG, Russell T, et al. (2007) The ability to predict dynamic foot posture from static measurements. J Am Podiatr Med Assoc 97, 115–120. [DOI] [PubMed] [Google Scholar]
- Garth WP Jr, Miller ST (1989) Evaluation of claw toe deformity, weakness of the foot intrinsics, and posteromedial shin pain. Am J Sports Med 17, 821–827. [DOI] [PubMed] [Google Scholar]
- Gilmour JC, Burns Y (2001) The measurement of the medial longitudinal arch in children. Foot Ankle Int 22, 493–498. [DOI] [PubMed] [Google Scholar]
- Hicks JH (1954) The mechanics of the foot. II. The plantar aponeurosis and the arch. J Anat 88, 25–30. [PMC free article] [PubMed] [Google Scholar]
- Hollander K, de Villiers JE, Sehner S, et al. (2017) Growing‐up (habitually) barefoot influences the development of foot and arch morphology in children and adolescents. Sci Rep 7, 8079. [DOI] [PMC free article] [PubMed] [Google Scholar]
- Kaufman KR, Brodine SK, Shaffer RA, et al. (1999) The effect of foot structure and range of motion on musculoskeletal overuse injuries. Am J Sports Med 27, 585‐593. [DOI] [PubMed] [Google Scholar]
- Kelly LA, Cresswell AG, Racinais S, et al. (2014) Intrinsic foot muscles have the capacity to control deformation of the longitudinal arch. J R Soc Interface 11, 20131188. [DOI] [PMC free article] [PubMed] [Google Scholar]
- Ker RF, Bennett MB, Bibby SR, et al. (1987) The spring in the arch of the human foot. Nature 325, 147–149. [DOI] [PubMed] [Google Scholar]
- Koyama K, Kato T, Yamauchi J (2014) The effect of ankle taping on the ground reaction force in vertical jump performance. J Strength Cond Res 28, 1411‐1417. [DOI] [PubMed] [Google Scholar]
- Koyama K, Yamauchi J (2017) Altered postural sway following fatiguing foot muscle exercises. PLoS ONE 12, e0189184. [DOI] [PMC free article] [PubMed] [Google Scholar]
- Koyama K, Yamauchi J (2018) Comparison of lower limb kinetics, kinematics and muscle activation during drop jumping under shod and barefoot conditions. J Biomech 69, 47–53. [DOI] [PubMed] [Google Scholar]
- Kura H, Luo ZP, Kitaoka HB, et al. (1997) Quantitative analysis of the intrinsic muscles of the foot. Anat Rec 249, 143–151. [DOI] [PubMed] [Google Scholar]
- Kurihara T, Yamauchi J, Otsuka M, et al. (2014) Maximum toe flexor muscle strength and quantitative analysis of human plantar intrinsic and extrinsic muscles by a magnetic resonance imaging technique. J Foot Ankle Res 7, 26. [DOI] [PMC free article] [PubMed] [Google Scholar]
- Lieberman DE, Venkadesan M, Werbel WA, et al. (2010) Foot strike patterns and collision forces in habitually barefoot versus shod runners. Nature 463, 531–535. [DOI] [PubMed] [Google Scholar]
- McKeon PO, Hertel J, Bramble D, et al. (2015) The foot core system: a new paradigm for understanding intrinsic foot muscle function. Br J Sports Med 49, 290. [DOI] [PubMed] [Google Scholar]
- McPoil TG, Cornwall MW (2005) Use of the longitudinal arch angle to predict dynamic foot posture in walking. J Am Podiatr Med Assoc 95, 114–120. [DOI] [PubMed] [Google Scholar]
- McPoil TG, Cornwall MW, Medoff L, et al. (2008) Arch height change during sit‐to‐stand: an alternative for the navicular drop test. J Foot Ankle Res 1, 3. [DOI] [PMC free article] [PubMed] [Google Scholar]
- Mero A, Komi PV, Gregor RJ (1992) Biomechanics of sprint running: a review. Sports Med 13, 376–392. [DOI] [PubMed] [Google Scholar]
- Mickle KJ, Munro BJ, Load SR, et al. (2009) Toe weakness and deformity increase the risk of falls in older people. Clin Biomech 24, 787–791. [DOI] [PubMed] [Google Scholar]
- Minozzo FC, Baroni BM, Correa JA, et al. (2013) Force produced after stretch in sarcomeres and half‐sarcomeres isolated from skeletal muscles. Sci Rep 3, 2320. [DOI] [PMC free article] [PubMed] [Google Scholar]
- Morita N, Yamauchi J, Kurihara T, et al. (2015) Toe flexor strength and foot arch height in children. Med Sci Sports Exerc 47, 350–356. [DOI] [PubMed] [Google Scholar]
- Otsuka M, Yamauchi J, Kurihara T, et al. (2015) Toe flexor strength and lower‐limb physical performance in adolescent. Gazz Med Ital Arch Sci Med 174, 307–313. [Google Scholar]
- Tam N, Astephen Wilson JL, Noakes TD, et al. (2014) Barefoot running: an evaluation of current hypothesis, future research and clinical applications. Br J Sports Med 48, 349–355. [DOI] [PubMed] [Google Scholar]
- Williams DS, McClay IS (2000) Measurements used to characterize the foot and the medial longitudinal arch: reliability and validity. Phys Ther 80, 864‐871. [PubMed] [Google Scholar]
- Williams DS 3rd, McClay IS, Hamill J (2001) Arch structure and injury patterns in runners. Clin Biomech 16, 341–347. [DOI] [PubMed] [Google Scholar]
- Wong YS (2007) Influence of the abductor hallucis muscle on the medial arch of the foot: a kinematic and anatomical cadaver study. Foot Ankle Int 28, 617–620. [DOI] [PubMed] [Google Scholar]
- Yamauchi J, Koyama K (2015) Influence of ankle braces on the maximum strength of plantar and toe flexor muscles. Int J Sports Med 36, 592–595. [DOI] [PubMed] [Google Scholar]