Abstract.
In an effort to increase the efficiency and cure rate of nonmelanoma skin cancer (NMSC) excisions, we have developed a point-of-care method of imaging and evaluation of skin cancer margins. We evaluate the skin surgical specimens using a smart, near-infrared probe (6qcNIR) that fluoresces in the presence of cathepsin proteases overexpressed in NMSC. Imaging is done with an inverted, flying-spot fluorescence scanner that reduces scatter, giving a 70% improved step response as compared to a conventional imaging system. We develop a scheme for careful comparison of fluorescent signals to histological annotation, which involves image segmentation, fiducial-based registration, and nonrigid free-form deformation on fluorescence images, corresponding color images, “bread-loafed” tissue images, hematoxylin and eosin (H&E)-stained slides, and pathological annotations. From epidermal landmarks, spatial accuracy in the bulk of the sample is , which when extrapolated with a linear stretch model, suggests an error at the margin of , within clinical reporting standards. Cancer annotations on H&E slides are transformed and superimposed on the fluorescence images to generate the final results. Using this methodology, fluorescence cancer signals are generally found to correspond spatially with histological annotations. This method will allow us to accurately analyze molecular probes for imaging skin cancer margins.
Keywords: skin cancer, molecular imaging, fluorescence imaging, histology validation, image registration, image processing
1. Introduction
The incidence of nonmelanoma skin cancer (NMSC), including basal cell carcinoma (BCC) and squamous cell carcinoma (SCC), continues to increase rapidly in the United States. From the years 2002–2006 to 2007–2011, the incidence of NMSC had increased from 3.4 to 4.9 million cases per year,1 which has led to a disproportionate increase in average spending from $3.6 to $8.1 billion per year over these time periods. The margins of NMSC cannot be identified with the naked eye and, therefore, various procedures and technologies have been developed to define the margins during or after the surgical procedure.
Current NMSC treatment methods include Mohs micrographic surgery (MMS), conventional excision, electrodessication, and curettage. In MMS, tissue is repeatedly excised and examined in histology during the procedure. This method provides the lowest recurrence rates and spares healthy tissue for optimal cosmetic results for removal of BCC and SCC.2,3 Following MMS, there is an recurrence rate,4 which exceeds alternative treatments for NMSC.5 Despite the clinical utility of MMS, the procedure has strict indications, mostly due to its cost, and is not possible to use for all skin cancers, resulting in conventional excisional surgery for million cases per year.1 Unlike MMS, conventional excisions do not employ methods to determine the status of the surgical margins during the perioperative period. Instead, the surgical margins are predetermined by the size and the type of tumor. Curettage (scraping of cancer cells from the lesion), followed by electrodessication (electrosurgery), is an option for certain small cancerous lesions.2,3
There are research and emergent clinical imaging methods for skin cancer. To provide more efficient histopathological evaluation of excised sections in MMS, tiled fluorescence confocal mosaicking microscopy with acridine orange stain offers a faster alternative to frozen histology, at comparable resolution of with high sensitivity/specificity (96.6%/89.2% for BCC detection).6 Autofluorescence and Raman scattering microscopy on MMS-excised fresh tissues use endogenous molecular spectra to differentiate cancer and healthy tissue with faster speed, at a resolution of 20 to , and with sensitivity/specificity of 95%/94% for BCC detection.7 Light-sheet microscopy, which has better tissue penetration, has been recently investigated for three-dimensional skin biopsy autofluorescence imaging with cellular-level resolution.8 In addition to imaging excised tissues, a variety of noninvasive imaging devices can be applied preoperatively for lesion examination, including polarization techniques, confocal microscopy, ultrasound, and optical coherence tomography (OCT), as reviewed by Tkaczyk.9 Optical polarization can be used to assess field of view and 100- to depth and so disruption of dermal collagen structure can be evaluated for BCC with resolution on the order of . But it is unclear if collagen structure is sufficiently altered enough to allow cancer detection.10 Fluorescence confocal microscopy has high lateral resolution of 0.5 to and axial resolution of 3 to ,11 but scanning requires a long imaging time to cover a lesion. OCT has a lateral resolution of and axial resolution of ,12 and high-frequency ultrasound (20 MHz) has a lateral resolution of and axial resolution of .13 The spatial resolution of OCT and ultrasound suffer from scattering and speckle noises. And it is difficult to differentiate inflammatory processes, cancer, and scarring in OCT.14 The most common commercial noninvasive skin imaging devices in the United States are Vivascope®, which is a reflectance confocal microscopy, and Vevo® MD, which uses high-frequency ultrasound. Vivascope® provides en face () view and high resolution but has low penetration depth. The time required for imaging a skin sample is 25 min, thus limiting acceptance. Vevo® MD provides an view similar to histology, provides fast refresh rates for imaging new regions, and has various depth and resolution depending on the frequency. For both commercial modalities, images require specialized training for interpretation. Costs for these systems are high.
There are downsides to conventional excision surgery. It fails to generate cure rates comparable to MMS (46% to 81% for SCC and 83% to 92% for BCC versus 92% to 99% in Mohs15,16), likely due to the use of greatly subsampled evaluations for cancer. Specimens are “bread-loafed” at 2 to 3 mm intervals and only one histological section consisting of about is analyzed. As a result, of the surgical margin is analyzed by a pathologist. Further, it takes typically 1 to 3 days for analysis. That is, excised specimens are formalin-fixed, paraffin-embedded, stained, and analyzed by a pathologist. If cancer is found on the surgical margin, the cost for re-excision is high and patient compliance is an issue. These differences present a significant unmet need for an approach to achieve similar benefits as with MMS (100% margin assessment and very low re-excision rates perioperatively), but at a lower cost.
We have developed a point-of-care imaging method to assess the margins of excised skin cancer perioperatively,17 which uses a quenched fluorescent activity-based probe cleaved in the presence of cathepsin that is overexpressed in NMSC.18–20 The previous results of this method have been encouraging, as topical application of the quenched fluorescent activity-based probe GB119 detected cancer-associated cathepsin protease activity21 from the dermal side of debulked NMSC tissue with 99% sensitivity and 89% specificity.22 Here, we demonstrate improvements to the imaging system in which light scatter is negligible and a new, bright near-infrared (NIR) quenched protease probe (6qcNIR)23 is used. The probe has emission at 799 nm where autofluorescence is minimal (see Sec. 2 for more details). In this technical study, we characterize the imaging system (Odyssey CLx; LI-COR Biosciences, Lincoln, Nebraska); develop a specialized method for accurate comparisons of the fluorescence image to gold standard histology, which includes puzzle-fit software; and provide some preliminary evaluations of our method for evaluating skin excisions.
2. Experimental Methods
We developed experimental methods and a registration method (“puzzle-fit,” described in the next section) to allow for the detection and evaluation of the quenched fluorescent activity-based probe activation to delineate cancer in resected skin samples. The experimental methods included acquisition of the surgical samples, application of the probe, imaging of the fluorescent probe and sample, formalin fixation, and histological processing. We introduced control points and documented each step with images to enable accurate alignment of the fluorescence signal with the histological image. In addition, using a fluorescent phantom24 we compared LI-COR Odyssey CLx to an episcopic macroscopic charge-coupled device system (Maestro PerkinElmer, Inc., Waltham, Massachusetts) to determine the best imaging approach for identifying cancer-associated fluorescence.
2.1. Tissue Handling
All tissues were obtained in collaboration with the Cleveland VA Medical Center under an approved IRB protocol (#16066-H46). Color and fluorescence images of all next-door surgically excised NMSC specimens were obtained before and after probe application. The 6qcNIR probe was a low-molecular-weight () NIR noncovalent quenched fluorescent activity-based probe. 6QC was a substrate probe for cysteine cathepsins using a core Cbz-Phe-Lys peptide sequence. The probe was functionalized with a Dylight 780-B1 fluorophore (excitation: 783 nm, emission: 799 nm) attached to the peptide by a six-carbon alkyl linker and a NIR quencher, QC-1, conjugated to the lysine side chain.25 On cleavage of the substrate amide bond by cathepsins, which was overexpressed in NMSC, two fragments were produced. The fragment containing the fluorophore was released with a free amine that can be protonated in the acidic lysosome, leading to its accumulation in tumor tissue. 6qcNIR displayed less autofluorescence as compared to GB119 with Cy5 fluorophore (excitation: 650 nm, emission: 670 nm), because GB119 had a shorter emission wavelength. The 6qcNIR probe was topically applied to the epidermal surface of the excised tissue through a paper applicator for 10 min prior to imaging. Skin tissues were placed on a glass slide with the epidermal side facing down toward the inverted episcopic Odyssey imager. An autofluorescence image and a probe fluorescence image were obtained using the Odyssey system, which is equipped with solid-state diode lasers that provide excitation at a wavelength of 785 nm. The fresh skin tissue was transferred on the glass slide to restrict tissue deformation for color imaging. To simulate Odyssey inverted imaging, we set up an imaging station with a digital camera (Coolpix S6900; Nikon Corporation, Tokyo, Japan) mounted onto a copy stand and the specimen table on top of the camera. After imaging, the tissue was scored by cutting the epidermal surface with a #15 blade scalpel and black ink was added to the score to enhance visibility. The black scoring mark aided in the puzzle-fit registration, as described in Sec. 3.1. The tissue was clipped with a staple to identify the 12 o’clock (north), 9 o’clock (west), 6 o’clock (south), and 3 (east) o’clock positions.
Following the fresh tissue-handling procedure, the tissue was fixed in formalin for about 24 h for standard H&E processing. The 3 o’clock and 9 o’clock sides of the formalin-fixed tissue specimens were stained with blue and black ink, respectively, for orientation prior to bread-loafing. Bread-loafed blocks were cut at a width of 2 to 3 mm and placed at intervals of 2 to 3 mm. Color images of bread-loaf blocks were obtained using the copy stand and digital camera with bilateral and unilateral oblique illumination to ensure delineation of the edges. Each slice of the bread-loaf was turned to the 12 o’clock edge, processed, and sectioned to obtain H&E slides in the standard of care, conventional fashion with paraffin embedding and H&E staining. The slides were then digitized and annotated for cancer by two dermatologists (Daniel Popkin, MD, PhD and Margaret Mann, MD) with OlyVIA software (Olympus Life Science, Tokyo, Japan).
2.2. Imaging System Characterization
The Odyssey scanning, focused-laser beam, episcopic fluorescence imaging system was used for fluorescence imaging. The Odyssey system recorded a large field of view (), exceeding the size of the largest routine skin excision; captured 14-bit images, enabling the recording of both bright and dim fluorescence signals; acquired variable pixel sizes, including pixels used in this study to enable determination of the cancer-free margin; and has an adjustable (0 to 4 mm) focus distance. The Odyssey was closed during image acquisition, allowing for room lighting. The system excited and recorded fluorophores from a small volume that was raster scanned, thereby reducing the effect of light scatter on the images. Its ability to reduce light scatter was one of the most important attributes for our studies. The solid-state diode lasers of Odyssey could simultaneously provide light excitation at 685 and 785 nm. Maestro was a macroscopic fluorescence imaging system used in our previous study.22 It captured 12-bit images; enabled manual selection of filter sets and therefore could image most of the common fluorophores that emits ; and recorded adjustable field of view and resolution where highest resolution was and largest field of view was . Maestro used a xenon light source and a high resolution, scientific-grade CCD imaging sensor.
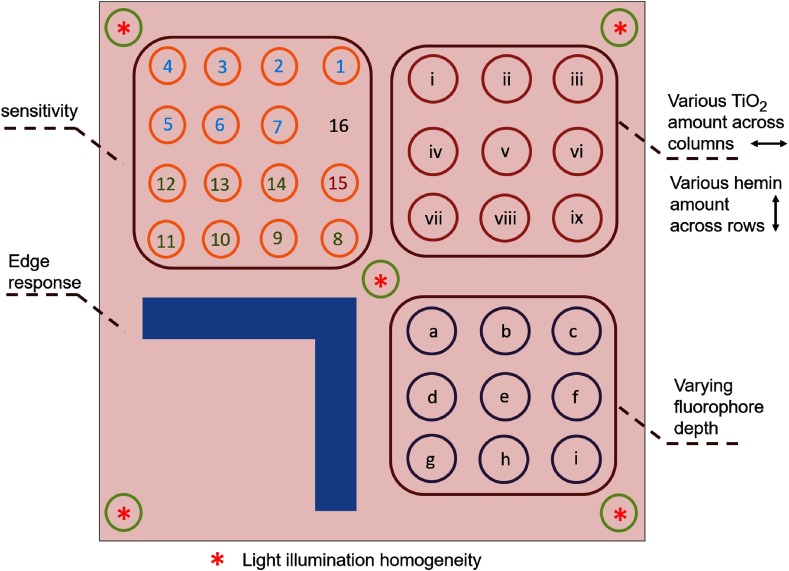
To compare the Odyssey system with Maestro in more details, a fluorescence phantom was imaged.24 The phantom contained regions for testing the sensitivity, optical properties, varying fluorophore depths, system edge responses, and light illumination homogeneity (Fig. 1). The sensitivity test region contained of hemin and various amounts of Qdots at an emission wavelength of 800 nm. The optical properties region contained 5 nM Qdots, various amounts of scatter-inducing (reduced scattering coefficient of for ), and the absorption material hemin (absorption coefficient of for and for ). The varying fluorophore depth region contained of , of hemin, and 10 nM Qdots embedded at varying depths in the phantom. The edge response region contained of hemin, of , and 10 nM Qdots. The illumination homogeneity region contained of and 10 nM Qdots. The background of the phantom contained of Nigrosin and of . The phantom was imaged with the Odyssey system at focus distances of 0, 0.5, 1.0, 1.5, 2, and 3 mm. In addition, the four quadrants were separately imaged using the Maestro system, due to the limitations of the field of view.
Fig. 1.
Fluorescence phantom layout. Upper left quadrant: sensitivity test region. Upper right quadrant: optical properties region with 5-nM Qdots and various amounts of across the columns and various amounts of hemin across the rows. Lower left quadrant: edge response region. Lower right quadrant: varying fluorophore depth region. The homogeneity region lies over the four corners and center of the phantom.
3. Puzzle-Fit Algorithm and Analysis
To evaluate the ability of the probe fluorescence signal to identify cancer on the skin samples, the annotated histological images were registered to probe fluorescence images using our multistep “puzzle-fit” algorithm. As detailed in Sec. 2, color and fluorescence images of fresh tissue samples were obtained, the epidermal side of the tissue was scored and clipped, the tissue was fixed, the fixed tissue was bread-loafed into blocks, the blocks were processed to create paraffin blocks, H&E slides were obtained and digitized, and histological images were annotated for cancer. “Puzzle-fit” included registration and reconstruction steps to enable the user to overlay the annotations from histological images to the correct locations on the fluorescence images. The steps included mapping the annotated histological images to corresponding bread-loaf blocks, reconstructing a continuous skin cancer specimen from the bread-loafed blocks, and registering the “reconstructed fixed tissue images” to the probe fluorescence images. Finally, the cancer annotations were overlaid on the probe fluorescence image as vertical annotation curves to determine co-localization of the fluorescence signal with annotated sites of cancer. The “puzzle-fit” algorithm was implemented in MATLAB and included a graphical user interface for interactive processing. The algorithm is described in the following subsections.
3.1. Mapping Annotated Histological Images to Corresponding Bread-Loaf Blocks
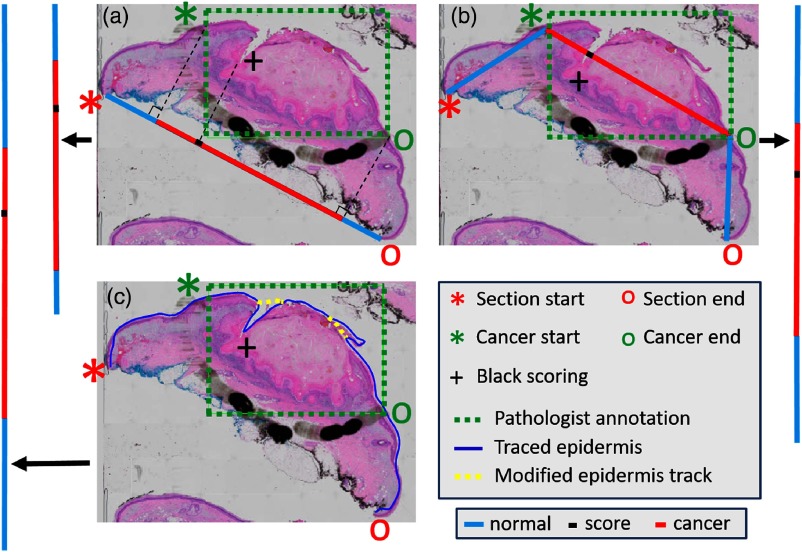
Each histological annotation was mapped to a vertical “annotation line” on the epidermal image of the fixed bread-loaf block. Conventions were red (cancer), blue (non-cancer), and black (scoring mark). Three methods were created and evaluated to account for possible tissue distortions after fixation and histological processing. The digitized H&E color image was processed for optimized visualization and measurement. H&E color images were converted to grayscale and then median- and Gaussian-filtered to remove fine tissue details. The edges of the smoothed H&E image were enhanced via Sobel filtering. Given the manually identified histological annotations (section start and end points, cancer start and end points, and black scoring points), the following three methods were created to project the annotation points onto the “annotation line” (Fig. 2): line projection, where the section start and end points were connected with a straight line to create perpendicular projections of the other points to the line; trapezoidal projection, where line segments were created to connect the section start point to the cancer start point, the cancer start point to the cancer end point, and the cancer end point to the section end point; the black scoring point was projected onto the corresponding line segment, and a final line was created by stitching these three line segments together; and epidermis-extraction projection, where dynamic programming26 was used to trace the epidermis, and the contour was smoothened by sampling 10% of all points and by fitting a piecewise polynomial cubic spline. Optional manual editing reduced errors due to tears and debris. An “annotation line” was obtained by straightening the smoothed epidermis curve. The “annotation lines” were further mapped to the section plane on the epidermal image of the corresponding fixed tissue bread-loaf blocks using the black scoring marks as a guide.
Fig. 2.
Methods for the mapping of cancer annotations to the “annotation line” of fixed tissue bread-loaf blocks. The methods include (a) line projection, (b) trapezoidal projection, and (c) epidermis-extraction projection. The H&E slide is shown with the pathologists’ annotations. Section start and end points, cancer start and end points, and black scoring point are identified accordingly. The final lines to superimpose on the epidermal image are shown as vertical lines on the sides that are colored red (cancer), blue (noncancer), and black (black scoring point). For the epidermis-extraction projection, the curve is manually smoothened to avoid the extra distance due to tears and debris. See previous text for additional details.
3.2. Reconstruction of a Continuous Surgical Specimen from Bread-Loaf Blocks
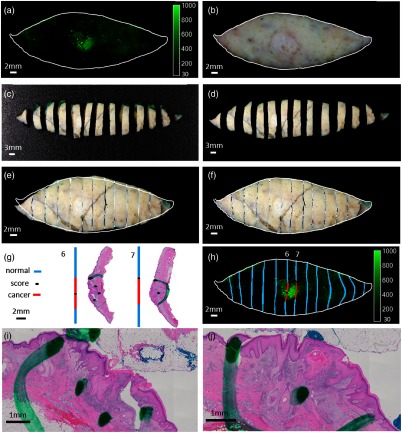
Our “puzzle-fit” algorithm required multiple steps to reconstruct a continuous surgical specimen [Fig. 3(f)] from bread-loafed blocks [Fig. 3(c)]. First, the bread-loaf blocks image was preprocessed to obtain segmented, vertically aligned, individual tissue blocks. Briefly, the block image [Fig. 3(c)] was processed according to the following steps: (1) apply Canny edge detection to each of the three oblique illumination images to obtain a final binary edge image with an “OR” operation; (2) manually edit any edge errors (e.g., an edge from protruding fat or drop out); (3) apply a morphological filling operation to obtain a binary mask image, which is used with the “AND” operation with the original image to obtain an image of each individual tissue block; and (4) following a connected components operation, adjust each bread-loaf block to be vertically aligned by rotation around the geometric center. Two “corners” of the two blocks on the tips and four “corners” of the blocks between the tips were manually identified. For the two blocks on the tips, the angle of the line connecting the two “corners” was calculated and rotation was applied so that the line and the block were vertically aligned. For blocks in between, the two angles of the lines connecting the left two “corners” and right two “corners” were calculated. The rotation angle to vertically align the block was determined by averaging the two angles. The result of these preprocessing steps is shown in Fig. 3(d).
Fig. 3.
Method to evaluate the cancer sites of the excised human skin cancer specimens. (a) Fresh tissue probe fluorescence image. (b) Fresh tissue color image that is registered to the probe fluorescence image. (c) Following fixation, the specimen is bread-loafed into tissue blocks. (d) The block image is processed after segmentation and rotation adjustment. (e) The affine registration result of the “reconstructed fixed tissue image.” (f) The nonrigid, free-form deformation, registered, reconstructed, and fixed tissue image after affine registration. (g) Each slice of the bread loaf is turned on its edge (12 o’clock), processed, and sectioned to obtain H&E slides from the tissue blocks. Areas of cancer on each histological section are marked by a pathologist. Histological annotations are then projected onto lines in blue as normal regions, red as cancer regions, and black as the scoring marks. (h) The histological section is registered to the corresponding tissue slice, and the areas of cancer are copied onto the fluorescence image. To aid registration, a tissue score is added by cutting the tissue specimen surface with a scalpel. Zoomed in view of the center in H&E slide from tissue blocks 6 and 7 are shown in (i) and (j), respectively.
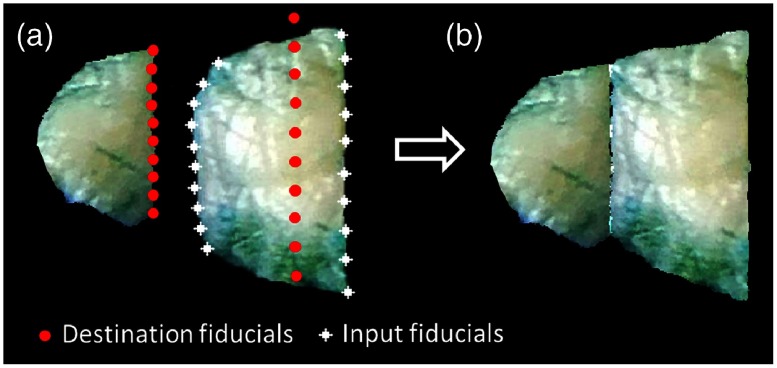
Following preprocessing, the preprocessed blocks were reconstructed into a continuous two-dimensional image using fiducial-based, thin-plate, spline registration.27 The histology lab technicians always make nearly parallel, straight, vertical cuts on the formalin-fixed tissues, an observation which informed our reconstruction process. The left most, first tissue block (9 o’clock tip) was first processed to obtain a straight, vertical eastern edge mimicking the result of a knife cut. Along the eastern edge, eight edge points were created between the two “corners”. From these, horizontal lines to the western edge were created and each of the eight distances was recorded. Then, a set of destination points was created, which consisted of the 10 points along the eastern side straightened into a vertical line and eight points on the western side maintaining the horizontal distances. We now had the input block image with the original points and new corresponding destination points, allowing us to perform thin-plate spline transfer from the input to the output block image. Next, the second block was processed to maintain its median width (west-east distance) and stitched to the eastern edge of output block 1. On input block 2, eight east-edge and eight west-edge points, equally vertically spaced between the two “corners” on the east and west, respectively, were obtained. Then, a set of destination points was created, which consisted of the 10 points along the western side of the output block 2 matching the eastern side of the output block 1 and 10 points along the eastern side of the output block 2. All of these points were vertically aligned. Multiple steps were used to place the 10 destination points on the eastern side of output block 2. We used the median east–west distance of input block 2 to set the width of block 2, giving the horizontal position of the vertical line of points. We set the vertical length of the east edge equal to that of the input and fixed the vertical location of the eastern edge of block 2 to maintain the percentage of the east edge above (below) the northwest “corner” of the original input block. With the 20 destination points so identified, thin-plate spline was applied to stitch the second tissue block to the first (Fig. 4). This process was continued until stitching was complete and a “reconstructed fixed tissue image” was obtained. These “annotation lines” of each block [Fig. 3(g)] were carried along the reconstruction process.
Fig. 4.
An example of the second block reconstruction process. (a) The white fiducials are generated on the input block with even spacing, given the four “corners.” The red fiducials are the corresponding destinations. (b) The white fiducials are registered to the red fiducials and the block is transformed using a thin-plate spline.
3.3. Registration of “Reconstructed Fixed Tissue Images” to Corresponding Probe Fluorescence Images
Each “reconstructed fixed tissue image” was registered to the corresponding fresh tissue color image and, in turn, to the associated fluorescence images. First, the fresh-tissue color image from the digital camera was registered to the probe fluorescence image from the Odyssey system using a simple transformation model (translation, rotation, and homogeneous scaling), which was computed by minimizing the distance between the manually identified corresponding control points. The control points were epidermal skin features, such as hair follicles, recognizable textures, and surgeons’ green marks. Optionally, if matching control points cannot be identified, an automatic registration algorithm was used with the same transformation model. The fresh-tissue color image was segmented from the background by color-based segmentation and the probe fluorescence image was segmented by intensity-based thresholding to create binary foreground images. Then, an iterative registration algorithm was applied to minimize the similarity measure (i.e., the mean square difference between the binary foreground images). Finally, a “registered fresh-tissue color image” [Fig. 3(b)] was obtained.
Next, the “reconstructed fixed tissue image” was registered to the “registered fresh-tissue color image” and, in turn, to the associated probe fluorescence image by simple transformation (translation, rotation, and homogeneous scaling) followed by nonrigid registration, as there was often significant deformation of the tissue after formalin fixation. Both images were converted to grayscale images for simple and nonrigid registration. The simple registration was performed using the manually identified epidermal control points. Optionally, registration can be accomplished with normalized mutual information as similarity measure. Once the images were roughly registered, a free-form deformation model-based nonrigid registration,28 which uses normalized mutual information as similarity measure, was applied. The calculated transformation and deformation fields were applied to red, green, and blue channels of the “reconstructed fixed tissue image” to form a “registered fixed tissue image.” Representative results of the simple and nonrigid registrations are shown in Figs. 3(e) and 3(f), respectively. The “annotation lines” associated with the reconstructed blocks can be warped using the same simple and free-form deformation transformations to correlate with the fluorescence signals [Fig. 3(h)].
3.4. Spatial Accuracy Analysis
The most important sources of co-localization error in the puzzle-fit process were assessed by measuring Euclidean distances between natural skin landmarks on the “registered fixed tissue image” and “registered fresh-tissue color image.” Several corresponding skin landmarks, such as hair follicles, nodules, and skin pigments, were manually identified and the results were recorded in terms of the mean and standard deviation measured in millimeters. The width of a fresh skin specimen should be 1 to 2 cm. Assuming linear stretching model and a matched boundary, the error on the 1 mm margin of a sample will be about 10% to 20% of the error in the center.
4. Results
4.1. Characterization of the Fluorescence Imaging System
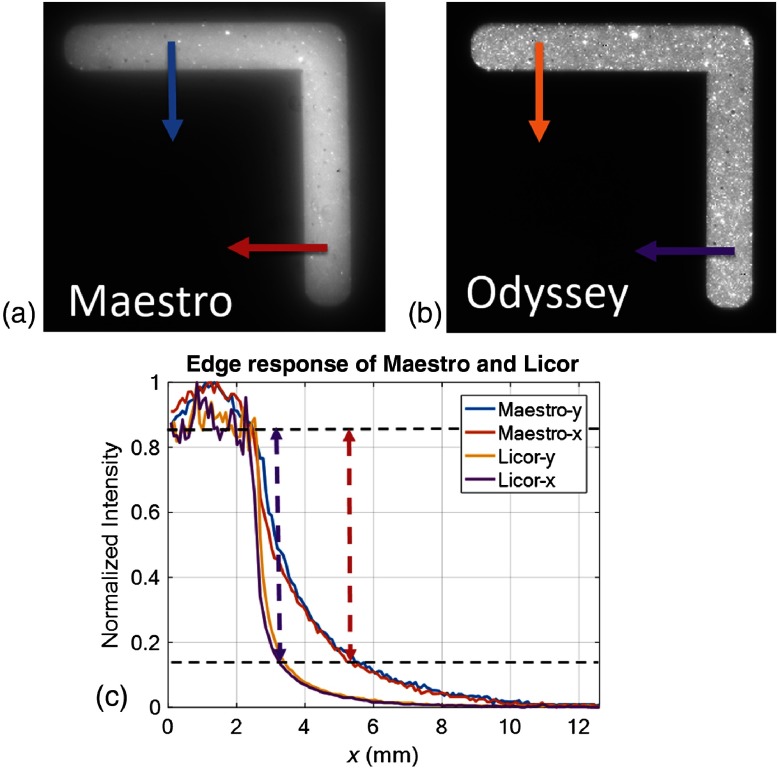
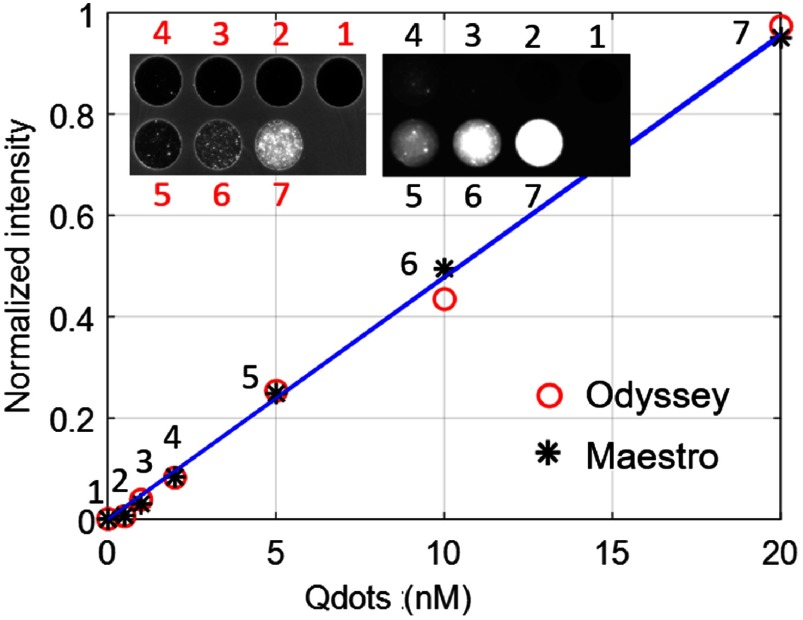
The phantom images obtained from the Odyssey system were compared with those obtained with the previously used Maestro macroscopic imaging system (Fig. 5) and with the published results from the EagleRay-V3 system using a slightly different version of the phantom.24 Blurring due to light scatter was clearly reduced on images obtained with the Odyssey as compared to the Maestro system [Figs. 5(a) and 5(b)]. Edge step responses (distance of 15% to 85% of the normalized intensity levels) were 2.7 mm (Maestro) and 0.8 mm (Odyssey). For comparison, we measured 1.6 mm (EagleRay-V3) from Fig. 5(b) in Anastasopoulou et al.24 The Odyssey system gave identical step responses in the and (the fast and slow scanning directions), respectively. Because of the reduction in scatter, the Odyssey image even showed heterogeneities (spots) in the phantom that were blurred out in the Maestro image. The sharp edge response of the Odyssey system ensures the ability to assess clear cancer margins. Both the Odyssey and Maestro systems have good sensitivity and give a linear response with a zero intercept as a function of the fluorophore concentration (Fig. 6).
Fig. 5.
Edge response comparison of the Maestro and Odyssey systems. (a) Maestro phantom imaging result, (b) Odyssey phantom imaging result, and (c) normalized intensity profiles of edge response along the and directions on the Maestro and Odyssey images. The edge response of the Maestro and Odyssey images are 0.8 and 2.7 mm, respectively.
Fig. 6.
The sensitivities of the Odyssey and Maestro systems (linearity) with the imaging result embedded in the upper left corner.
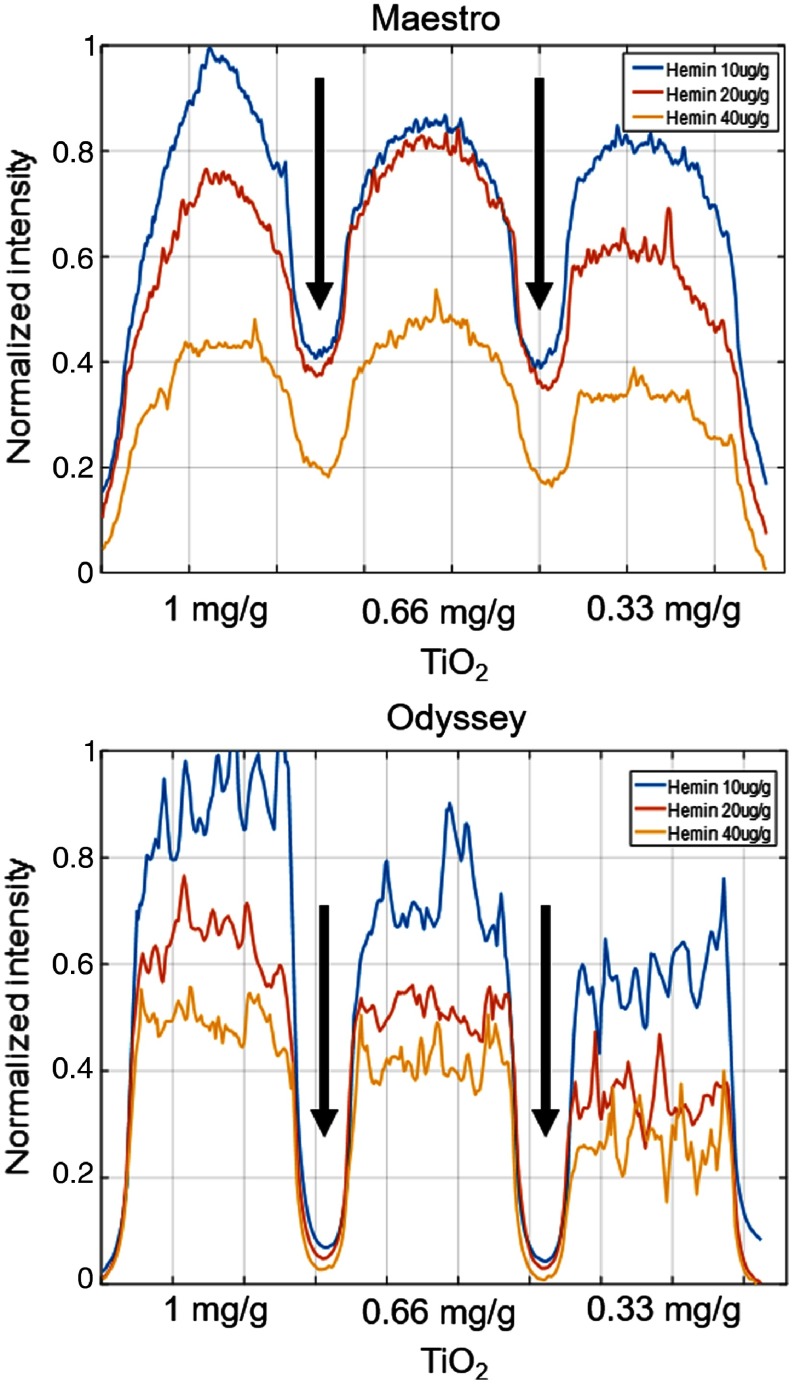
To examine the intensity profile along rows in the optical properties region and to avoid the nonhomogeneous artifact of the phantom, the one-dimensional signals from the Maestro and Odyssey images were smoothened by local regression using the weighted linear least-squares approximation method and a linear polynomial model, as shown in Fig. 7. With 5 nM Qdots, the Maestro and EagleRay-V3 systems [Fig. 4(b) in Anastasopoulou et al.24] exhibited similar intensity trends ( hemin hemin > hemin). For the Odyssey images, the fluorescence intensity ranking was hemin hemin hemin. With the Odyssey system, more scattering (increased ) results in increased fluorescence intensity with fixed absorber (hemin) amount. The diffusive edge and scattering effect can be seen between wells from the Maestro image as compared to the sharp edge and low scattering of the Odyssey image, as indicated by the black arrows.
Fig. 7.
Fluorescence intensity in each well of the optical properties area of the phantom. With 5-nM Qdots, the Maestro and EagleRay-V3 systems exhibit similar intensity trends with different amounts of absorption (hemin) and scattering () materials. With the Odyssey system, more scattering results in increased fluorescence intensity with a fixed amount of the absorber material. The diffusive edge and scattering effect can be seen between wells from the Maestro image as compared to the sharp edge and low scattering of the Odyssey image, as indicated by the black arrows.
Imaging of the fluorophore at different depths demonstrated that the intensity decreased as the fluorophore embedded deeper in all three systems. Although not a confocal system, the Odyssey can focus at various distances. Imaging at various focus distances with the Odyssey system showed that, regardless of the depth of the fluorophore, the strongest response would always originate from a focus distance of 0.5 mm. The normalized intensity decreased most rapidly with the Odyssey system at a focus depth of 0.5 mm and slowest with the EagleRay-V3 system [Fig. 4(b) in Anastasopoulou et al.24].
To test the illumination homogeneity, the mean intensity was compared across the five wells among the Maestro, Odyssey, and EagleRay-V3 systems (Fig. 6 in Anastasopoulou et al.24), which gave relative standard deviations of 3.3%, 2.5%, and 18.7%, respectively. The higher variation of the Odyssey system arose from the heterogeneity of the phantom. The four quadrants of the phantom were separately imaged with the Maestro system. Therefore, the illumination homogeneity was compared among the four corners without the center. The Maestro system has four fiber-optic illuminator arms on the four corners; therefore, the illumination was homogeneous. The EagleRay-V3 system has more illumination variance among the five wells,24 as it has one light fiber bundle that incorporates white and fluorescence light sources.29
4.2. Puzzle-Fit Algorithm for Mapping Histological Annotations to Fluorescence Signals
The size change after formalin fixation and three different methods for creating the “annotation line” were evaluated by analyzing in detail the three skin cancer specimens. The longest tip-to-tip Euclidian length of the fixed tissue was of that of the fresh tissue and the width of the fixed tissue was of that of the fresh tissue. The lengths of the “annotation line” from the line projection, trapezoidal projection, and epidermis-extraction projection were , , and , respectively, of the corresponding lengths of the fresh tissue images, as calculated from the nine bread-loaf blocks with cancer annotation. Previous reports described that most of the “shrinkage” of skin tissue occurred during excision (71% to 100% of total shrinkage) prior to fixation and that relatively little occurred as a result of fixation and histological processing.30–32 We chose the trapezoidal projection method for all additional processing because it has an H&E to fresh tissue length ratio closest to 1 and the smallest standard deviation. Furthermore, fresh tissue can be laid relatively flat on the glass slide, whereas the epidermis curled downward to the dermis after fixation and histological processing. Line projection was good if there was no curling difference between images of H&E and fresh tissues. Epidermis-extraction projection was good, provided the fresh tissue was completely flat. Trapezoidal projection was considered the best option to approximate differences in the curling of the epidermis between the H&E and fresh tissues.
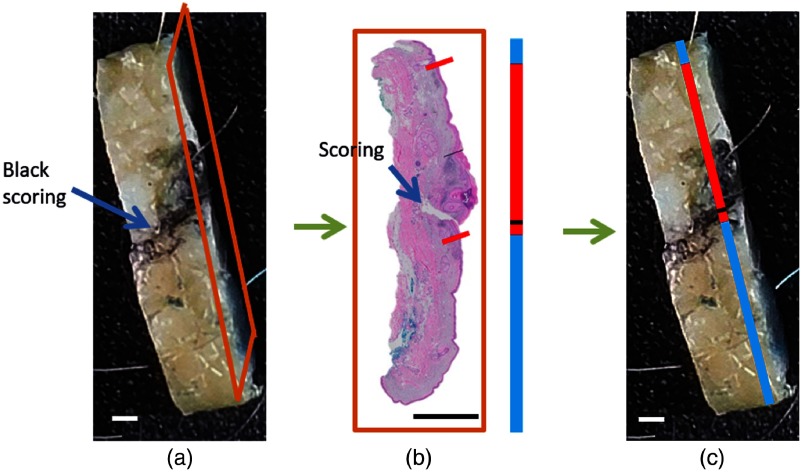
Figure 8 shows an example of scoring marks aiding the localization of the “annotation line” to the section plane on the top-view image of the corresponding fixed tissue bread-loaf block using the trapezoidal projection method.
Fig. 8.
The scoring mark point of an “annotation line” aids its localization in the bread-loaf block. (a) The bread-loaf block color image shows a thin scoring mark with a black ink smudge on the surface. Tissue sections for H&E are obtained from cuts into the tissue block with the orange frame outlining the starting surface. (b) The digitized H&E slide and corresponding “annotation line” that are obtained using the trapezoidal projection are shown. (c) The “annotation line” is moved along the tissue block image until the scoring mark corresponds to the black scoring mark. The line placement indicates the location of the acquired histological section. For almost all specimens, H&E slides are taken from the eastern (12 o’clock) edge. .
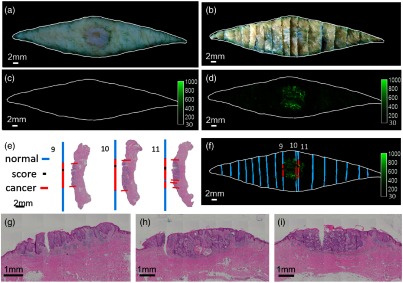
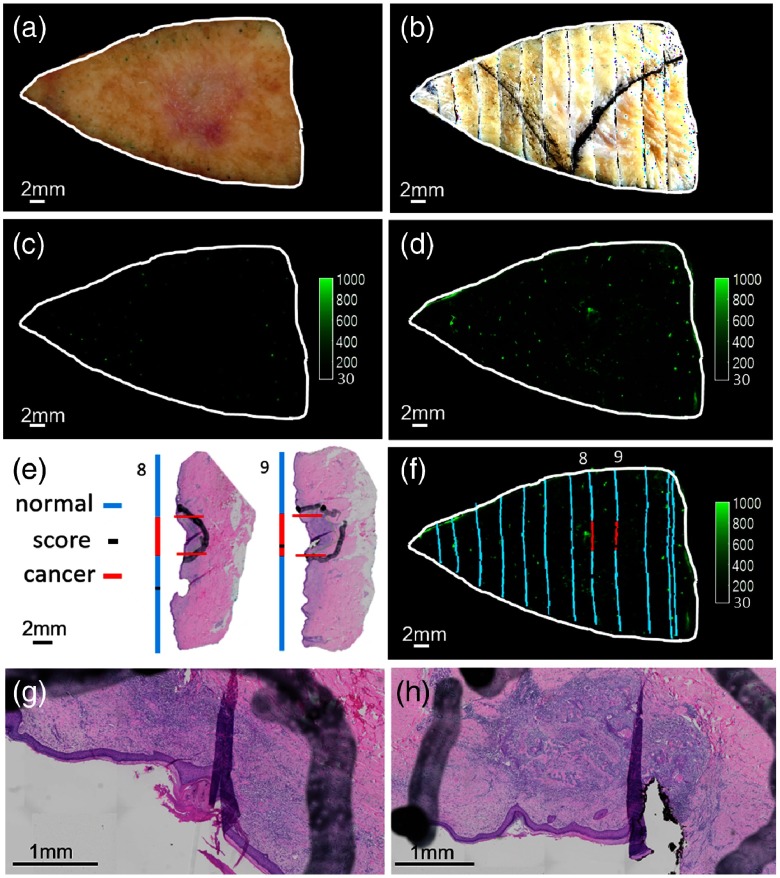
SCC and BCC puzzle-fit results are shown in Figs. 9 and 10. Following puzzle-fit processing, correlations between cancer probe fluorescence and histological annotations of cancer are demonstrated [Figs. 9(f) and 10(f)]. In these figures, good registration is evident as the boundary from the color fresh tissue image superimposes well with the reconstructed bread-loaf and fluorescence images. The scoring mark helps in identifying the potential errors in the bread-loaf blocks-embedding process. For example, it is determined in Fig. 9(f) that the H&E slide for blocks 9 and 11 are obtained from the western (6 o’clock) edge, whereas the H&E slide for block 10 is obtained from the eastern (12 o’clock) edge. This effectively results in double H&E sampling at the edge between blocks 10 and 11 and no H&E sampling at the edge between blocks 9 and 10, which further highlights the potential for undersampling with traditional histology.
Fig. 9.
Puzzle-fit mapping of histological SCC images to the fluorescent cancer signals. (a) The fresh tissue color image. (b) The registered fixed tissue image. This sample belongs to the early protocol where tissue was scored but no black ink was added. (c) Autofluorescence image. (d) Probe fluorescence image. (e) H&E images and the “annotation lines” from trapezoidal projection method. (f) Fluorescence image fused with the “annotation lines”. The white outline of the fresh tissue border from (a) maps well to the registered fixed tissue image (b) and fluorescence images (c) and (d). Zoomed in view of center in H&E images from tissue blocks 9, 10, and 11 are shown in (g), (h), and (i), respectively. There is very good correspondence between histological cancer annotations and cancer-probe fluorescence.
Fig. 10.
Puzzle-fit mapping of histological BCC images to the fluorescent cancer signals. (a) The fresh tissue color image. (b) The registered fixed tissue image. (c) Autofluorescence image. (d) Probe fluorescence image. (e) H&E images and the “annotation lines” from trapezoidal projection method. (f) Fluorescence image fused with the “annotation lines.” The white outline of the fresh tissue border from (a) maps well to the registered fixed tissue image (b) and fluorescence images (c) and (d). Zoomed in view of center in H&E images from tissue blocks 8 and 9 are shown in (g) and (h), respectively. There is good correspondence between histological cancer annotation and cancer-probe fluorescence in tissue block 8, but not in tissue block 9.
In the BCC sample (Fig. 10), there is evidence of cancer from histology without a strong fluorescence signal in tissue block 9. Potentially, this is due to insufficient penetration of probe, as the epidermis was intact and the BCC tumor was deeper than some other tumors. In the same sample, there is cancer in tissue block 8 with a strong fluorescence signal. In this case, there is superficial erosion of the epidermis, potentially aiding probe penetration.
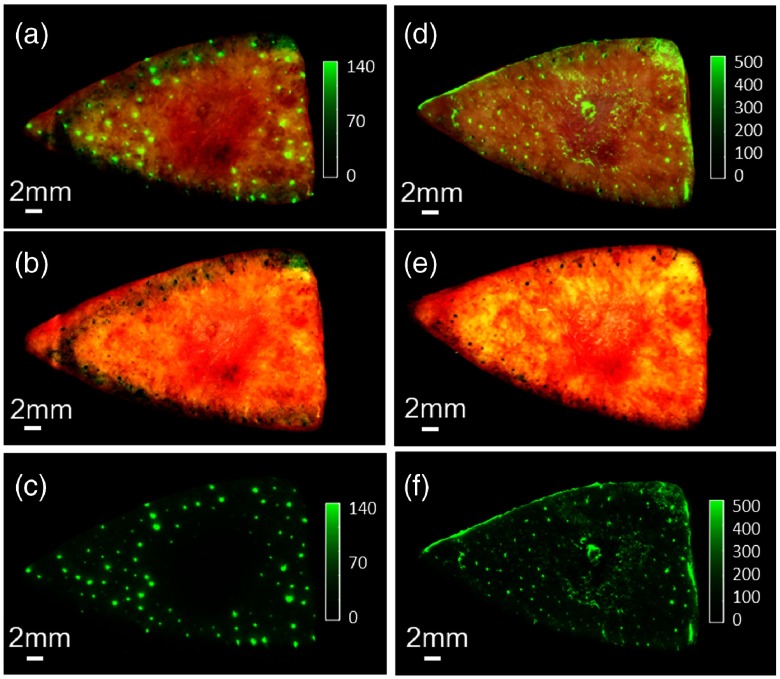
There are small bright spots between the autofluorescence image [Fig. 10(c)] and the probe fluorescence image [Fig. 10(d)]. Comparing associated color images with fluorescence signals, we sometimes identify autofluorescent hair follicles (Fig. 11). Though the molecular origin is not yet identified, hair follicles can be readily identified because they are small isolated dots, because they are autofluorescent (visible prior to probe application), and because one can also see hair remnants in the color tissue image.
Fig. 11.
Fluorescent hair follicles. Autofluorescence image (c) and the associated color image (b) are merged in (a) to show the hair follicles before applying the probe. Probe fluorescence image (f) and the associated color image (e) are merged in (d) to show the hair follicles after applying the probe. The color and fluorescence images are both enhanced to show the hair follicles.
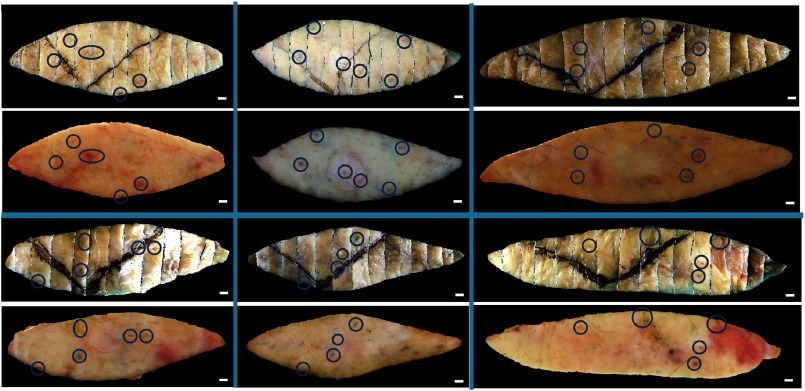
The registration accuracy of the interior between the “registered fixed tissue image” and the “registered fresh tissue color image” were further assessed by computing the Euclidean distances between corresponding epidermal landmarks in 60 specimens. Example landmarks are shown in Fig. 12. The registration accuracy of 60 specimens and 129 landmarks was , where at least some of the uncertainty was due to the ambiguity when identifying the control points on relatively large skin landmarks. Extrapolated with the linear stretch model (Sec. 3.4) suggested an error at the margin of for a typical sample with a width of 1.5 cm. This error was sufficiently small () to ensure unambiguous visual interpretation of the results and, thus, was clinically useful.
Fig. 12.
Representative skin landmarks providing corresponding points to assess the registration accuracy between the fresh tissue samples and corresponding images reconstructed from bread-loaf blocks. Shown are six image pairs with the fresh tissue images below the reconstructed images. The skin landmarks circled in blue include nodules, pigments, and hair follicles. .
5. Discussion and Conclusion
We have developed point-of-care molecular imaging methods for the assessment of skin cancer margins in surgical specimens. This immediate readout, point-of-care technology will offer significant advantages over traditional histological analysis, which greatly undersamples the surgical specimen and requires days for processing. We have a significant time advantage using this technology (tissue washing and probe application: 15 min, fluorescence imaging: 2 min, interpretation: seconds) that cuts down processing time by compared to traditional histology. Compared with Vivascope® reflectance confocal microscopy, which might take hours to image a rhombus shape excision with 50- and 20-mm diagonals,9 our technology is sufficiently fast to not interfere with the clinical work flow. Compared to OCT and high-frequency ultrasound, our technology allows molecular imaging of cancer-associated cathepsins, has less background signal, and is therefore easier to interpret. In this study, we have described an improved flying-spot imaging system (LI-COR Odyssey CLx) and registration methods for evaluating the ability of a new fluorescent smart probe (6qcNIR) to identify skin cancer perioperatively.
In phantom experiments, the flying-spot Odyssey system is proven to be superior to conventional macroscopic imaging systems for our application. The results of the phantom test have showed that the Odyssey system allowed for the sharpest edge response, as compared to the Maestro and EagleRay-V3 systems, and linear response to the fluorophore concentration. The fluorescence intensity with respect to various amounts of absorption material (hemin) and scattering material () differs between the Odyssey system and the macroscopic fluorescence Maestro and EagleRay-V3 systems, likely because the flying point scanner has a focused narrow laser beam and a small emission detector. The reduced scattering coefficient of of is at 750 nm. The absorption coefficients are 0.25 and for 20 and of hemin, respectively.24 Normal skin, BCC, and SCC have scattering coefficients of 40, 16, and , respectively and absorption coefficients of 2.5, 0.4, and .33 Skin has a much larger scattering coefficient than the in the phantom. The Odyssey, thus, is expected to detect more signals, which is helpful in cancer detection. Although the Odyssey system takes longer to image the specimens, the general specimen in the present study required a scanning time of , which would not hinder clinical flow. These experimental results combined with other positive attributes (e.g., large format imaging up to , uniform imaging response unlike a macroscopic imaging system, 12-bit wide dynamic range imaging enabling capture of both bright and dim fluorescence, and depth focusing) render the Odyssey system a desirable imaging solution.
The deformation (size change and “curling down” of skin tissue) in fixation and histological processing led us to adopt the trapezoidal projection for the “annotation lines.” Though we expect minor size changes from formalin fixation,29–31 the length and width of the fixed tissue were and , respectively, of those of the fresh tissue. The relatively large variance could be due to “curling down” of the edge, as fat is reported to shrink more than muscular soft tissue34 and soft tissue is known to expand with formalin fixation for days.35 Therefore, the fresh tissue epidermal side will lie relatively more flat on the glass slide, as compared to the “curling down” fixed tissue. After histological processing, the ratio of the lengths of the H&E to the fresh tissues, as calculated from the trapezoidal projection, was closest to 1. Qualitatively, trapezoidal projection best approximated the “curling” difference between the H&E and fresh tissue images.
The accuracy between the histological cancer annotations and the probe fluorescence signal can be further analyzed. The “puzzle-fit” accuracy based on the registration accuracy () between the “registered fixed tissue image” and “registered fresh tissue color image” can be calculated using skin landmarks that are independent from the fiducials-based thin-plate spline registration. The accuracy of the proposed trapezoidal projection method is estimated to be for a typical fresh tissue width of 1.5 cm and an average length error of 1% between the H&E and fresh tissues. A black scoring mark is used to guide mapping of the “annotation lines” to the bread-loaf blocks. However, there is no independent set to measure the accuracy of this mapping process. The accumulated “puzzle-fit” accuracy is estimated to be and the most significant source of error is the registration error of the “registered fixed tissue image” to the “registered fresh tissue color image.”
There may be potential improvements to the methods. (1) Automated identification of additional fiducials could lead to improved accuracy between the registered fixed tissue image and the fresh tissue color image. (2) To allow for the assessment of “annotation line” mapping accuracy, extra landmarks could be created, such as a second set of scoring marks or pins dipped in histology ink for use as section plane markers (histology lab technicians will be requested to cut through the points inked by pins). However, these improvements will result in a deviation from the standard of care and less likely to be adapted in the clinical setting.
Here, we have created detailed and accurate methods for image acquisition and histological evaluation of molecular probes for imaging sites of cancer on skin specimens. These results indicate that point-of-care imaging technique with a protease probe (6qcNIR) applied on excised skin tissues could provide patients and physicians with an inexpensive, fast, easily interpretable, Mohs-like procedure to reduce callbacks and potentially reduce unnecessary tissue excision. We are currently performing a prospective clinical evaluation of the 6qcNIR probe and imaging methods with dermatologist readers. The evaluation methodology described herein will be the key for providing an accurate evaluation. Given the current limitations of standard histology, this technology may lead to disruptive solutions in cancer treatment.
Acknowledgments
Research reported in this publication was supported by the National Institute of Health (NIH) under Award No. R44CA180296-02. We thank Jennifer Hudson and Lindsay Tobias for their assistance with histological procedures. We thank Enago (www.enago.com) for the English language review. This research was conducted in the space renovated using funds from an NIH construction Grant No. (C06 RR12463) awarded to CWRU in 1997–2000. DW acted as veracity guarantor.
Biographies
Yiqiao Liu is a third-year PhD student at Case Western Reserve University, Ohio. She completed her BS degree in biomedical engineering at Sichuan University, China. She has industry research experience in the field of image processing. Her research interests include image registration and segmentation, machine learning, cancer, and cryoimaging.
Ethan Walker is a research assistant professor at Case Western Reserve University. He is interested in the development of a live-time imaging technique to rapidly and reliably identify basal and squamous skin cancer in the margins of conventionally resected skin cancer samples, which would significantly impact the quality of patient care.
Sukanya Raj Iyer is a graduate research assistant at Case Western Reserve University and is working toward earning her master’s degree in biomedical engineering. Her current research focuses on machine learning and medical imaging, especially in the field of oncology. Prior to pursuing her graduate studies, she earned her bachelor’s degree in biomedical engineering at Mumbai University, India, and worked as a software engineer in cardiac imaging at Capgemini, India.
Mark Biro is a first-year internal medicine dermatology resident at Medstar Washington Hospital Center affiliated with Georgetown University, Washington, D.C., and recent graduate of Case Western Reserve University School of Medicine.
InYoung Kim earned her MD degree and PhD from the University of Chicago Pritzker School of Medicine. She completed an internship in internal medicine at the University of Chicago-NorthShore. Her current research project involves rapid visualization of nonmelanoma skin cancer.
Bo Zhou received his MS degree in biomedical engineering from Case Western Reserve University, in 2016, and his MS degree in computer vision from Robotics Institute, Carnegie Mellon University, Pennsylvania, in 2019. His research interest mainly focuses on medical imaging and medical/computer vision.
Brian Straight is the president and CEO at Akrotome Imaging. He earned his PhD from Purdue University, Indiana. He is a highly motivated and creative individual with more than 20 years of experience in high-tech private sector growth and development with focus on life sciences/healthcare environment.
Matthew Bogyo is a professor of pathology, of microbiology and immunology, and by courtesy, of chemical and systems biology at Stanford University, California. He is a member of Bio-X, Stanford Cancer Institute, and a faculty fellow of Stanford ChEM-H. He continues his research using chemical, biochemical, and cell biological methods to study protease function in human disease.
James P. Basilion is a professor of radiology and biomedical engineering, the director of the Case Center for Imaging Research, vice chair of basic sciences research for the Department of Radiology, codirector of the cancer imaging program at the Case Comprehensive Cancer Center, and a fellow of the National Foundation for Cancer Research. He continues his research in molecular imaging and in pursuing the development of targeted agents for image-guided surgery, biopsy, targeted photodynamic therapy, and targeted drug delivery with both small molecules and nanotechnology.
Daniel L. Popkin earned his MD and PhD degrees from Washington University School of Medicine, Missouri. He completed his internship in general medicine and his residency in dermatology at Washington University/Barnes-Jewish Hospital in St. Louis, Missouri. He is an assistant professor at Case Western Reserve University and assistant chief of dermatology at the LSCVAMC.
David L. Wilson is the Robert Herbold professor of biomedical engineering and radiology, Case Western Reserve University. His interests are image processing and analysis, cardiovascular imaging, coronary artery OCT, and cryoimaging. He serves on NIH study sections, editorial boards, and conference committees. He has trained numerous PhD students and postdocs, all of whom are quite exceptional. In addition to federal- and state-funded research activities, he is a director of CWRU’s Interdisciplinary Biomedical Imaging NIH T32 training grant.
Disclosures
Dr. Basilion is an inventor of intellectual property licensed to Akrotome Imaging. He is an officer of Akrotome, owns equity, and receives royalty payments. Dr. Basilion also receives research funding support through an SBIR grant to Akrotome. Dr. Straight is CEO of Akrotome Imaging.
References
- 1.Ad Hoc Task Force et al. , “AAD/ACMS/ASDSA/ASMS 2012 appropriate use criteria for Mohs micrographic surgery: a report of the American Academy of Dermatology, American College of Mohs Surgery, American Society for Dermatologic Surgery Association, and the American Society for Mohs Surgery,” J. Am. Acad. Dermatol. 67, 531–550 (2012). 10.1016/j.jaad.2012.06.009 [DOI] [PubMed] [Google Scholar]
- 2.Kauvar A. N. B., et al. , “Consensus for nonmelanoma skin cancer treatment: basal cell carcinoma, including a cost analysis of treatment methods,” Dermatol. Surg. 41, 550–571 (2015). 10.1097/DSS.0000000000000296 [DOI] [PubMed] [Google Scholar]
- 3.Kauvar A. N. B., et al. , “Consensus for nonmelanoma skin cancer treatment, part II: squamous cell carcinoma, including a cost analysis of treatment methods,” Dermatol. Surg. 41, 1214–1240 (2015). 10.1097/DSS.0000000000000478 [DOI] [PubMed] [Google Scholar]
- 4.Mohs F. E., “Chemosurgery for the microscopically controlled excision of cutaneous cancer,” Head Neck Surg. 1, 150–163 (1978). 10.1002/(ISSN)1930-2398 [DOI] [PubMed] [Google Scholar]
- 5.Garcia C., Holman J., Poletti E., “Mohs surgery: commentaries and controversies,” Int. J. Dermatol. 44, 893–905 (2005). 10.1111/ijd.2005.44.issue-11 [DOI] [PubMed] [Google Scholar]
- 6.Jain M., Rajadhyaksha M., Nehal K., “Implementation of fluorescence confocal mosaicking microscopy by ‘early adopter’ Mohs surgeons and dermatologists: recent progress,” J. Biomed. Opt. 22, 024002 (2017). 10.1117/1.JBO.22.2.024002 [DOI] [PMC free article] [PubMed] [Google Scholar]
- 7.Kong K., et al. , “Diagnosis of tumors during tissue-conserving surgery with integrated autofluorescence and Raman scattering microscopy,” Proc. Natl. Acad. Sci. U.S.A. 110, 15189–15194 (2013). 10.1073/pnas.1311289110 [DOI] [PMC free article] [PubMed] [Google Scholar]
- 8.Abadie S., et al. , “3D imaging of cleared human skin biopsies using light-sheet microscopy: a new way to visualize in-depth skin structure,” Skin Res. Technol. 24, 294–303 (2018). 10.1111/srt.2018.24.issue-2 [DOI] [PubMed] [Google Scholar]
- 9.Tkaczyk E. R., “Innovations and developments in dermatologic non-invasive optical imaging and potential clinical applications,” Acta Derm. Venereol. 97(218), 5–13 (2017). 10.2340/00015555-2717 [DOI] [PMC free article] [PubMed] [Google Scholar]
- 10.Rohani P., et al. , “Collagen disruption as a marker for basal cell carcinoma in presurgical margin detection,” Lasers Surg. Med. 50, 902–907 (2018). 10.1002/lsm.22948 [DOI] [PubMed] [Google Scholar]
- 11.Astner S., et al. , “Clinical applicability of in vivo fluorescence confocal microscopy for noninvasive diagnosis and therapeutic monitoring of nonmelanoma skin cancer,” J. Biomed. Opt. 13, 014003 (2008). 10.1117/1.2837411 [DOI] [PubMed] [Google Scholar]
- 12.Gambichler T., et al. , “In vivo optical coherence tomography of basal cell carcinoma,” J. Dermatol. Sci. 45, 167–173 (2007). 10.1016/j.jdermsci.2006.11.012 [DOI] [PubMed] [Google Scholar]
- 13.Dill-Müller D., Maschke J., “Ultrasonography in dermatology,” J. Dtsch. Dermatol. Ges. 5, 689–707 (2007). 10.1111/ddg.2007.5.issue-8 [DOI] [PubMed] [Google Scholar]
- 14.Kuranov R., et al. , “Complementary use of cross-polarization and standard OCT for differential diagnosis of pathological tissues,” Opt. Express 10, 707–713 (2002). 10.1364/OE.10.000707 [DOI] [PubMed] [Google Scholar]
- 15.Rowe D. E., Carroll R. J., Day C. L., “Prognostic factors for local recurrence, metastasis, and survival rates in squamous cell carcinoma of the skin, ear, and lip: implications for treatment modality selection,” J. Am. Acad. Dermatol. 26, 976–990 (1992). 10.1016/0190-9622(92)70144-5 [DOI] [PubMed] [Google Scholar]
- 16.Smeets N. W. J., et al. , “Surgical excision vs Mohs’ micrographic surgery for basal-cell carcinoma of the face: randomised controlled trial,” Lancet 364, 1766–1772 (2004). 10.1016/S0140-6736(04)17399-6 [DOI] [PubMed] [Google Scholar]
- 17.Liu Y., et al. , “Molecular imaging and validation of non-melanoma skin cancer margins,” Proc. SPIE 10579, 105790Y (2018). 10.1117/12.2293847 [DOI] [Google Scholar]
- 18.Jedeszko C., Sloane B. F., “Cysteine cathepsins in human cancer,” Biol. Chem. 385, 1017–1027 (2005). 10.1515/BC.2004.132 [DOI] [PubMed] [Google Scholar]
- 19.Fröhlich E., Möhrle M., Klessen C., “Cathepsins in basal cell carcinomas: activity, immunoreactivity and mRNA staining of cathepsins B, D, H and L,” Arch. Dermatol. Res. 295, 411–421 (2004). 10.1007/s00403-003-0449-9 [DOI] [PubMed] [Google Scholar]
- 20.Kawada A., et al. , “Expression of cathepsin D and B in invasion and metastasis of squamous cell carcinoma,” Br. J. Dermatol. 137, 361–366 (1997). 10.1111/j.1365-2133.1997.tb03739.x [DOI] [PubMed] [Google Scholar]
- 21.Walker E., et al. , “Microscopic detection of quenched activity-based optical imaging probes using an antibody detection system: localizing protease activity,” Mol. Imaging Biol. 16, 608–618 (2014). 10.1007/s11307-014-0736-1 [DOI] [PMC free article] [PubMed] [Google Scholar]
- 22.Walker E., et al. , “Rapid visualization of nonmelanoma skin cancer,” J. Am. Acad. Dermatol. 76, 209–216.e9 (2017). 10.1016/j.jaad.2016.09.008 [DOI] [PMC free article] [PubMed] [Google Scholar]
- 23.Ofori L. O., et al. , “Design of protease activated optical contrast agents that exploit a latent lysosomotropic effect for use in fluorescence-guided surgery,” ACS Chem. Biol. 10, 1977–1988 (2015). 10.1021/acschembio.5b00205 [DOI] [PMC free article] [PubMed] [Google Scholar]
- 24.Anastasopoulou M., et al. , “Comprehensive phantom for interventional fluorescence molecular imaging,” J. Biomed. Opt. 21, 091309 (2016). 10.1117/1.JBO.21.9.091309 [DOI] [PubMed] [Google Scholar]
- 25.Yim J. J., et al. , “Optimization of a protease activated probe for optical surgical navigation,” Mol. Pharm. 15, 750–758 (2018). 10.1021/acs.molpharmaceut.7b00822 [DOI] [PubMed] [Google Scholar]
- 26.Lee B., Yan J.-Y., Zhuang T.-G., “A dynamic programming based algorithm for optimal edge detection in medical images,” in Proc. Int. Workshop Med. Imaging Augmented Reality, pp. 193–198 (2001). 10.1109/MIAR.2001.930285 [DOI] [Google Scholar]
- 27.Bookstein F. L., “Principal warps: thin-plate splines and the decomposition of deformations,” IEEE Trans. Pattern Anal. Mach. Intell. 11, 567–585 (1989). 10.1109/34.24792 [DOI] [Google Scholar]
- 28.Rueckert D., et al. , “Nonrigid registration using free-form deformations: application to breast MR images,” IEEE Trans. Med. Imaging 18, 712–721 (1999). 10.1109/42.796284 [DOI] [PubMed] [Google Scholar]
- 29.Glatz J., et al. , “Concurrent video-rate color and near-infrared fluorescence laparoscopy,” J. Biomed. Opt. 18, 101302 (2013). 10.1117/1.JBO.18.10.101302 [DOI] [PubMed] [Google Scholar]
- 30.Blasdale C., et al. , “Effect of tissue shrinkage on histological tumour-free margin after excision of basal cell carcinoma,” Br. J. Dermatol. 162(3), 607–610 (2010). 10.1111/bjd.2010.162.issue-3 [DOI] [PubMed] [Google Scholar]
- 31.Kerns M. J. J., et al. , “Shrinkage of cutaneous specimens: formalin or other factors involved?” J. Cutaneous Pathol. 35(12), 1093–1096 (2008). 10.1111/j.1600-0560.2007.00943.x [DOI] [PubMed] [Google Scholar]
- 32.Dauendorffer J. N., et al. , “Shrinkage of skin excision specimens: formalin fixation is not the culprit,” Br. J. Dermatol. 160(4), 810–814 (2009). 10.1111/bjd.2009.160.issue-4 [DOI] [PubMed] [Google Scholar]
- 33.Lister T., Wright P. A., Chappell P. H., “Optical properties of human skin,” J. Biomed. Opt. 17, 090901 (2012). 10.1117/1.JBO.17.9.090901 [DOI] [PubMed] [Google Scholar]
- 34.Docquier P.-L., et al. , “Formalin fixation could interfere with the clinical assessment of the tumor-free margin in tumor surgery: magnetic resonance imaging-based study,” Oncology 78, 115–124 (2010). 10.1159/000306140 [DOI] [PubMed] [Google Scholar]
- 35.Vickerton P., Jarvis J., Jeffery N., “Concentration-dependent specimen shrinkage in iodine-enhanced microCT,” J. Anat. 223, 185–193 (2013). 10.1111/joa.12068 [DOI] [PMC free article] [PubMed] [Google Scholar]


