

Abstract
In healthy adult skeletal muscle fibers microtubules form a three-dimensional grid-like network. In the mdx mouse, a model of Duchenne muscular dystrophy (DMD), microtubules are mostly disordered, without periodicity. These microtubule defects have been linked to the mdx mouse pathology. We now report that increased expression of the beta 6 class V β-tubulin (tubb6) contributes to the microtubule changes of mdx muscles. Wild-type muscle fibers overexpressing green fluorescent protein (GFP)-tubb6 (but not GFP-tubb5) have disorganized microtubules whereas mdx muscle fibers depleted of tubb6 (but not of tubb5) normalize their microtubules, suggesting that increasing tubb6 is toxic. However, tubb6 increases spontaneously during differentiation of mouse and human muscle cultures. Furthermore, endogenous tubb6 is not uniformly expressed in mdx muscles but is selectively increased in fiber clusters, which we identify as regenerating. Similarly, mdx-based rescued transgenic mice that retain a higher than expected tubb6 level show focal expression of tubb6 in subsets of fibers. Tubb6 is also upregulated in cardiotoxin-induced mouse muscle regeneration, in human myositis and DMD biopsies, and the tubb6 level correlates with that of embryonic myosin heavy chain, a regeneration marker. In conclusion, modulation of a β-tubulin isotype plays a role in muscle differentiation and regeneration. Increased tubb6 expression and microtubule reorganization are not pathological per se but reflect a return to an earlier developmental stage. However, chronic elevation of tubb6, as occurs in the mdx mouse, may contribute to the repeated cycles of regeneration and to the pathology of the disease.
Introduction
Mammalian skeletal muscle fibers have an unusual microtubule organization. These long, post-mitotic multinucleated cells have Golgi complexes fragmented into small stacks of cisternae positioned around the nuclei and throughout the fibers. The small Golgi elements nucleate a three-dimensional network of microtubules (1) whose organization depends on muscle contractile activity (2,3). In the fast-twitch muscle fibers that predominate in the mouse, microtubules form a striking orthogonal grid that is close to the plasmalemma and surrounds the fiber core (1). How this microtubule organization supports muscle function is still far from clear. However, a link between muscle microtubule organization and the protein dystrophin has stimulated work and debate.
Dystrophin is the 427 kDa protein missing in Duchenne muscular dystrophy (DMD), an X-linked lethal disease (5). The most frequently used mouse model of DMD is the mdx mouse line. The mdx mouse lacks dystrophin (6) and mdx muscle microtubules are disordered (7), in part because dystrophin binds and guides microtubules (8,9). In support of this hypothesis, re-expression of complete or partial dystrophins in mdx muscles restores microtubule organization and muscle physiology to various degrees, showing that different parts of dystrophin are responsible for different aspects of the mdx pathology and of microtubule organization (7,9–12). However, transgenic re-expression of a dystrophin lacking in vitro microtubule binding activity unexpectedly rescued microtubule organization (10). Thus, additional factors besides dystrophin must be involved in muscle microtubule organization.
At first glance, microtubules, which are assembled from linear chains of α- and β-tubulin dimers, have a rather simple structure. However, there are several isotypes of mammalian α- and β-tubulins, at least 10 for each, encoded by distinct genes (14). Additional diversification results from tubulin post-translational modifications (15–18) such as C-terminal tyrosination and detyrosination of α-tubulin. These modifications have been proposed as the cause of increased muscle rigidity and production of reactive oxygen species in the mdx mouse (4,19) and, therefore, as a link between microtubule changes and mdx or DMD pathology. However, the increase in α-tubulin detyrosination in mdx muscle is offset by an increase in total α-tubulin (9,10,20) and fibrosis has recently been shown to be the primary source of increased rigidity in the mdx mouse diaphragm (20). The link between microtubule changes and mdx or DMD pathology remains poorly understood.
So far, little attention has been given to the tubulin isotypes of skeletal muscle, perhaps because all tubulin isotypes appear essentially interchangeable (21). However, while exploring published RNA sequencing (RNA-seq) data (4), we noticed that the β-tubulin beta 6 class V (hereafter referred to as tubb6) is particularly elevated in DMD biopsies. An earlier genome-wide expression profile of young asymptomatic DMD patients had revealed tubb6 as one of the most upregulated RNAs and the most upregulated tubulin isotype (~4.2-fold) (22). An in silico analysis of the Gene Expression Omnibus database placed tubb6 among the genes that specify DMD pathology (23). Tubb6 also emerged as one of the most upregulated transcripts in a microarray analysis of the gastrocnemius muscle of 3-month-old mdx mice (24) and among the 10 most increased RNAs and proteins of mdx muscles (25). Furthermore, overexpression or downregulation of tubb6 in proliferating fibroblasts affects microtubule dynamics and impairs mitosis (26–28). In contrast, overexpression of another β-tubulin, beta 5 class I (tubb5), which differs from tubb6 by only a few amino acids, has no effect (29). We decided to investigate whether tubb6 contributes to the microtubule differences between wild-type (WT) and mdx mice.
The flexor digitorum brevis (FDB) muscle was chosen for in vivo overexpression or knocking down of specific genes, as previously (1). WT FDB fibers overexpressing tubb6 show microtubules that resemble those in mdx fibers while mdx FDB fibers with tubb6 knocked down have microtubules that resemble those in WT fibers. No such effects were observed when tubb5 was overexpressed or knocked down instead of tubb6. Quantitation of tubb6 in mdx transgenic mouse lines rescued by dystrophin constructs or by overexpression of the dystrophin homolog utrophin revealed that a few mouse lines had higher or lower tubb6 than expected from the analysis of their microtubules. Further experiments revealed that, in mdx and other mouse lines, tubb6 expression is highly heterogeneous and that elevated tubb6 marks regenerating fibers. Congruently, tubb6 is elevated in an experimental model of cardiotoxin (CTX)-induced mouse muscle regeneration and in muscle biopsies of patients affected by several forms of myositis, a muscle disease that presents with muscle regeneration. Finally, tubb6 is elevated during differentiation of human primary muscle cells and of the mouse muscle cell line C2 whose myotubes (Mts) have a dense network of longitudinal microtubules.
We propose that an increase in tubb6 that occurs normally during muscle differentiation causes microtubule disorganization in adult muscle fibers. In mdx, and potentially in DMD and other muscle diseases, the “signature” increase in tubb6 (22,23) may initiate microtubule defects that are then amplified when tubb6 is acutely upregulated during muscle regeneration.
Results
Tubb6 is expressed in WT and mdx muscle fiber microtubules
Transcriptomics and proteomics have found tubb6 in muscle extracts (24,25) but nerves, blood vessels, fat, fibroblasts and other cell types account for about 50% of the nuclei in skeletal muscles (30). To verify that tubb6 is expressed in muscle fibers, collagenase-dissociated fibers of the FDB muscle were used. This preparation is free from most non-muscle cells. In WT fibers, tubb6 immunofluorescence is found in few fibers and consists mostly of puncta partially aligned with the α-tubulin grid (Fig. 1A–C). In mdx fibers, in contrast, tubb6 is easily detectable and colocalizes with α-tubulin (Fig. 1D–F). The mdx microtubule network is characteristically dense and disordered, as confirmed by microtubule directionality analysis with the TeDT software (Fig. 1G; see Methods). The 90-degree peak that represents periodic transverse microtubules is absent from the mdx profile (31). The fraction of FDB fibers positive for tubb6 varies between experiments, as does the fraction of fibers with central nuclei, a sign of muscle regeneration. No mdx FDB fiber shows a perfect microtubule grid; at best, some show occasional transverse microtubules.
Figure 1.
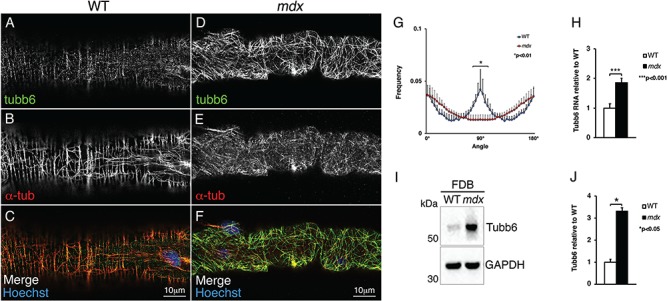
Tubb6 RNA and protein are expressed within muscle fibers and increased in mdx compared to WT. Single collagenase-dissociated fibers of the FDB muscle were doubly stained with the original anti-tubb6 antibody (green) and with anti-α-tubulin (red). In WT fibers, tubb6 staining is punctate and covers only some of the microtubules while α-tubulin shows the expected grid-like organization (A–C). In mdx mice, a brighter tubb6 staining is detected along all microtubules and the microtubule network is disordered (D–F). Microtubule organization was quantitated using the TeDT microtubule directionality software (G; see Materials and Methods). The peak at 90° corresponds to transverse microtubules. In FDB, tubb6 is significantly elevated at both RNA (H; 1.9 ± 0.13-fold) and protein level (I and J; 3.30 ± 0.15-fold). Glyceraldehyde 3-phosphate dehydrogenase (GAPDH) was used as loading control.
In RNA from total FDB, tubb6 is 1.90 ± 0.13-fold higher in mdx than in WT mice (P = 0.00012; Fig. 1H) while in protein extracts from collagenase-dissociated FDB fibers tubb6 is 3.30 ± 0.15-fold higher (Fig. 1I and J; P = 0.0424). Interestingly, tubb6 is already increased in 3-week-old mdx mice (10.24 ± 0.50-fold in the gastrocnemius; Supplementary Material, Fig. S2A and B, P = 0.0018). Therefore, tubb6 is increased in mdx muscle fibers before regeneration starts (usually at 4–5 weeks), as it also is increased in pre-symptomatic DMD children (22,23).
Overexpression of tubb6 alters the organization of cortical muscle microtubules in WT FDB fibers
To assess whether increasing tubb6 affects muscle microtubules, FDB muscle of WT mice were injected with a complementary DNA (cDNA) encoding green fluorescent protein (GFP)-tubb6. In this, as in subsequent experiments, a cDNA expressing GFP-tubb5 was used as a control. Tubb5 is also increased in mdx compared to WT muscle (Supplementary Material, Fig. S3A–C). Six days after the injections, muscles were removed and dissociated into single fibers that were stained for α-tubulin with an Alexa 568-labeled secondary antibody. GFP-tubb6 overexpression (Fig. 2A) dramatically changes the microtubule network (shown in grayscale) compared to GFP-tubb5 overexpression (Fig. 2B), mock-injection of phosphate-buffered saline (PBS; Fig. 2C) or no injection (Fig. 2D). Directionality analysis (Fig. 2E) confirms that GFP-tubb6 overexpression causes a significant loss of transverse microtubules. In addition, tubb6 overexpression increases the density of the microtubule network (2.10 ± 0.40-fold, P < 0.0001; Fig. 2F). Immunoblotting for GFP shows that the GFP-tubb5 and GFP-tubb6 fusion proteins (~80 kDa) have similar expression levels (P = 0.8177; Fig 2G and H). The level of GFP-tubb6 (82 kDa) was also compared to the level of endogenous tubb6 (55 kDa; Fig. 2I and J). GFP-tubb6 is expressed 13.11 ± 0.54-fold higher than endogenous tubb6 in WT muscle (P = 0.0426) and ~5-fold higher than tubb6 in mdx muscle. Interestingly, the level of endogenous tubb6 itself is elevated 5.16 ± 0.45-fold in the GFP-tubb6 overexpressing FDB (P = 0.0381) but its level is not significantly changed in GFP-tubb5 overexpressing FDB (1.12 ± 0.40-fold, P = 0.7092).
Figure 2.
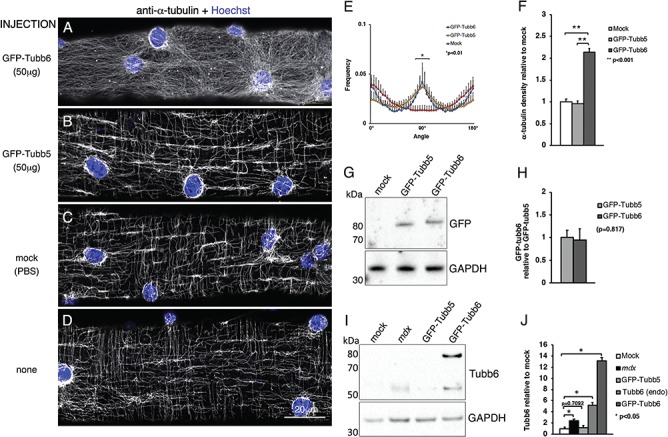
In vivo overexpression of GFP-tubb6 in WT FDB fibers mimics the microtubule alterations of mdx fibers. The FDB muscles of WT mice were injected with different cDNAs. Six days later, we collected the muscles, dissociated their fibers, plated them and stained them with anti-α-tubulin followed by an Alexa-568-conjugated secondary antibody and Hoechst. Fibers expressing GFP constructs were identified by their green fluorescence. The α-tubulin staining was imaged in the red channel but is represented in grayscale for better contrast (A–D). Cortical microtubules of GFP-tubb6 overexpressing fibers are disordered, without preferential directionality or periodicity (A) but microtubules of GFP-tubb5 overexpressing fibers (B) are unaffected and undistinguishable from those of mock-transfected fibers (C) or uninjected fibers (D). Changes in microtubule organization of GFP-tubb6-overexpressing fibers are reflected in the directionality profile (E). Tubb6 overexpression also specifically increases microtubule density (F). Immunoblot analysis with anti-GFP shows that GFP-tubb6 and GFP-tubb5 (~80 kDa) are expressed at comparable levels (G). (I and J) Extracts from FDB fibers overexpressing GFP-tubb6 reveal two tubb6 bands (I): endogenous tubb6 (~55 kDa) and GFP-tubb6 (~80 kDa). GFP-tubb6 is increased 13.11 ± 0.54-fold (P = 0.0426) and endogenous tubb6 is increased 5.16 ± 0.45-fold (P = 0.0381) compared to control WT samples. GFP-tubb6 is increased 5-fold and endogenous tubb6 2-fold compared to the mdx sample but the latter difference is not significant. No significant change in the level of tubb6 was observed in the GFP-tubb5-overexpressing fibers. The results are the average of n = 4 independent experiments.
To confirm that GFP-tubb6 and GFP-tubb5 fusion proteins are incorporated into microtubules, their GFP fluorescence was imaged. At the highest dose of plasmid used (50 μg), there was a high background, likely due to unincorporated GFP. At the lower dose (5 μg), GFP-tubb6 (Supplementary Material, Fig. S3D–F) and GFP-tubb5 (Supplementary Material, Fig. S3G–I) both outlined all microtubules. In all experiments, there was a range of expression and fibers with a higher level of GFP-tubb6 showed stronger alterations of microtubule pattern and density.
To rule out that the effects of GFP-tubb6 on the microtubule network are due to the N-terminal GFP, the C-terminal GFP construct tubb6-GFP was also tested and found incorporated into microtubules. It also affected microtubule network directionality and density (Supplementary Material, Fig. S4A–D) although tubb6-GFP was expressed at lower level compared to its N-terminal counterpart. We conclude that ectopic GFP fusion proteins of tubb6 and tubb5 are both incorporated into microtubules but that only the tubb6 constructs affect directionality and density of the cortical microtubule network, making WT muscle fibers resemble mdx muscle fibers despite the presence of dystrophin.
Muscle fiber regeneration is observed after long-term overexpression of GFP-tubb6
In mdx mice or DMD patients, tubb6 may be elevated chronically. To test the effect of prolonged tubb6 overexpression, FDB muscles were collected at two months (instead of six days) after injection of GFP-tubb6. Unexpectedly, hematoxylin and eosin (H&E)-stained frozen muscle sections gave signs of muscle damage and regeneration: fibers with small diameters and central nuclei (Fig. 3A–C, arrows). Other sections were used to measure the cross-sectional area (CSA) of GFP-positive fibers, i.e. those expressing GFP-tubb6 or GFP-tubb5 (Fig. 3D and E). Anti-laminin staining (red) was done to profile all fibers. GFP-tubb6-expressing muscles contained both larger and smaller fibers than GFP-tubb5-expressing muscles (Fig. 3F) and had fibers with central nuclei in similar proportion to that in mdx FDB muscle (Table 1). Thus, long-term overexpression of GFP-tubb6 leads to muscle fiber death and regeneration.
Figure 3.
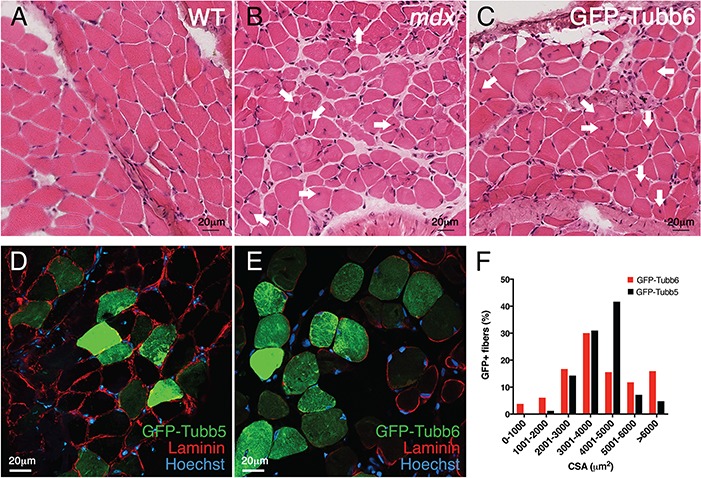
Long-term overexpression of GFP-tubb6 (2 months) affects muscle morphology. One of the FDB muscles of a WT mouse was injected with GFP-tubb6 or GFP-tubb5 cDNA. Two months later, injected and contralateral control muscles were collected. Frozen sections were stained with H&E (A–C) or labeled with anti-laminin and imaged under fluorescence (D and E). The green channel shows the GFP tag of GFP-tubb5 (D) or GFP-tubb6 (E). In the GFP-tubb6-overexpressing FDB muscle, we observe changes in fiber size in comparison to uninjected control. Arrows in B and C point to some of the fibers with central nuclei whose number is increased in GFP-tubb6 overexpressing FDB, as in mdx FDB (see Table 1). The cross-sectional area (CSA) of GFP-positive fibers was calculated for the GFP-tubb5 and GFP-tubb6 sets of fibers (F), showing that GFP-tubb6 overexpressing muscles contain both thicker and thinner fibers than the control muscle. The data presented in this figure are representative of n = 3 separate experiments. A quantitative analysis of fibers with central nuclei in WT, mdx, GFP-tubb6- and GFP-tubb5-overexpressing FDB is shown in Table 1. Altogether, these alterations indicate signs of regeneration after the expression of GFP-tubb6.
Table 1.
GFP-tubb6-injected FDB muscles show an increase in centrally-nucleated fibers
| FDB genotype and treatment | Mean ± SD (%) |
|---|---|
| WT, mock-injected (n = 1004) | 5.77 ± 0.15 |
| WT, GFP-Tubb5 injected (n = 883) | 8.72 ± 2.22a |
| WT, GFP-Tubb6 injected (n = 1014) | 13.31 ± 0.64b |
| mdx (n = 1125) | 14.48 ± 0.27c |
n is the total number of FDB fibers analyzed from three separate experiments. Statistical analysis refers to the comparison with mock-injected FDB fibers:
a P = 0.607
b P < 0.01
c P < 0.001.
Depletion of tubb6 from mdx FDB fibers improves cortical microtubule organization
To determine whether depletion of tubb6 from mdx fibers could improve their microtubule network organization, one of the FDB muscles of 2-month-old mdx mice (n = 4) was injected with cDNAs encoding tubb6- or tubb5-specific short hairpin RNAs (shRNAs) while the contralateral FDB muscle was injected with an equal amount of a non-targeted (scrambled) shRNA. Six days later, fibers were plated for microscopy and proteins extracted for immunoblots. The fibers expressing the shRNA could be detected by the fluorescence of the cytoplasmic GFP tag but no correlation should be expected between the degree of shRNA activity and the level of GFP fluorescence since the two are under control of different promoters (see Materials and Methods sections for details). The organization of cortical microtubules, verified by staining for α-tubulin with a red-labeled secondary antibody (shown in grayscale), was significantly improved in those fibers expressing the tubb6 shRNA (Fig. 4A) compared to those expressing the tubb5 shRNA (Fig. 4B), the non-targeted shRNA (Fig. 4C) or to an uninjected muscle (Fig. 4D). Immunoblot analysis showed an average tubb6 reduction of 60% (P = 0.0252; Fig. 4E and F) and a tubb5 reduction of 50% (P = 0.0050; Fig. 4G and H). Directionality analysis confirmed the visual assessment (n = 125 fibers analyzed; P = 0.0017; Fig. 4I). Microtubule density in tubb6 shRNA-treated fibers was also significantly reduced (~50% of scrambled, P < 0.0001) while tubb5 and scrambled shRNA-treated fibers were not modified (n = 30 fibers analyzed, P = 0.3377; Fig. 4J). Finally, depletion of tubb6 did not affect the level of tubb5 and, reciprocally, depletion of tubb5 did not affect the level of tubb6 (Fig. 4K–N). Attempts to verify the decrease of tubb6 in GFP-positive fibers by immunofluorescence were unsuccessful (see discussion). Thus, microtubule disorganization, characteristic of mdx fibers, can be normalized by selectively decreasing the level of tubb6 despite the absence of dystrophin.
Figure 4.
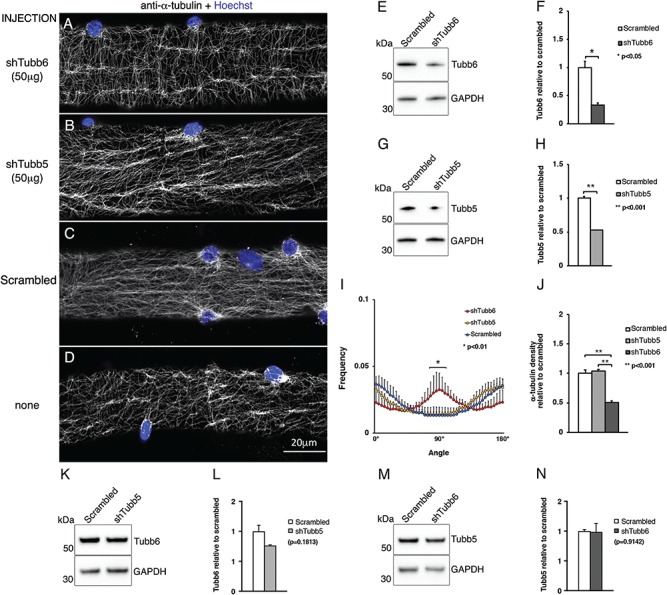
Depletion of tubb6 from mdx FDB fibers in vivo normalizes cortical microtubule organization. Tubb6 shRNA injection in the FDB of mdx mice restores a grid-like organization of cortical microtubules (A) not seen after depletion of tubb5 (B), treatment with non-targeting (scrambled) shRNAs (C) or in uninjected FDB fibers of mdx mice (D). Microtubules and nuclei were stained as in Figure 2. Immunoblot analysis with anti-tubb6 (E) and anti-tubb5 (G; see Materials and Methods and Supplementary Material, Fig. S1A and B for antibody specificity controls) shows a similar reduction of the two β-tubulins compared to scrambled (F, H: ~60 and 50%, respectively). Restoration of the orthogonal microtubule distribution in shtubb6-treated FDB fibers and of the density of cortical microtubules is shown in (I) and (J). ShRNA-mediated downregulation of tubb5 does not affect tubb6 expression (K and L) and, reciprocally, downregulation of tubb6 does not affect the level of tubb5 (M and N). The results are the average of n = 4 independent experiments.
Increases in the level of tubb6 cause increases in α-tubulin detyrosination, in the overall level of α-tubulin and in the level of NOX2
Increased detyrosination of α-tubulin has been presented as a source of pathology in skeletal and cardiac muscle (4,19,32) but upregulation of NAPDH oxidase 2 (NOX2) has recently been shown to affect muscle physiology more than tubulin detyrosination does (20). The possibility that overexpression or downregulation of tubb6 affects detyrosinated (dY) tubulin or NOX2 was addressed. Validation of the anti-dY-tubulin antibody was carried out (see Materials and Methods and Supplementary Material, Fig. S1C and D), and dY-tubulin level was found increased by 2.60 ± 0.10-fold in GFP-tubb6 overexpressing fibers and by 2.80 ± 0.02-fold in mdx FDB fibers, both compared to mock-transfected fibers (Fig. 5A and B). As noticed by others before (9,10,20), there was an overall increase in α-tubulin (1.90 ± 0.10-fold), erasing the specific change in the ratio of dY-tubulin to total α-tubulin (Fig. 5C and D; Table 2). α-Tubulin detyrosination is significantly decreased in samples injected with tubb6 targeted shRNA compared to those injected with scrambled shRNA. No changes in dY-tubulin or in total α-tubulin are found in GFP-tubb5-overexpressing or in tubb5 shRNA-treated fibers (Table 2 and Fig. 5A–D; Table 3 and Fig. 5E and F). Immunofluorescence of dY-tubulin in untreated WT and mdx FDB muscle fibers shows discrete, often transverse and curly microtubules around nuclei and in the cytoplasm (Fig. 5G–L; white arrows). This pattern resembles that of microtubule remnants after nocodazole treatment (1) and of cold-resisting microtubules (our unpublished data). As for NOX2, its catalytic component gp91phox is significantly increased in GFP-tubb6 overexpressing FDB (2.30 ± 0.01-fold compared to mock-transfected fibers). No significant change was detected in GFP-tubb5 overexpressing FDB fibers (Table 2 and Fig. 5 M–N). As previously shown in the diaphragm (20), gp91phox is elevated in the gastrocnemius of 3-week-old mdx mice compared to WT (9.47 ± 0.25, P < 0.0001; Supplementary Material, Fig. S2C and D). Thus, WT muscles overexpressing tubb6 have levels of dY-tubulin, α-tubulin and NOX2 similar to those in mdx muscle.
Figure 5.
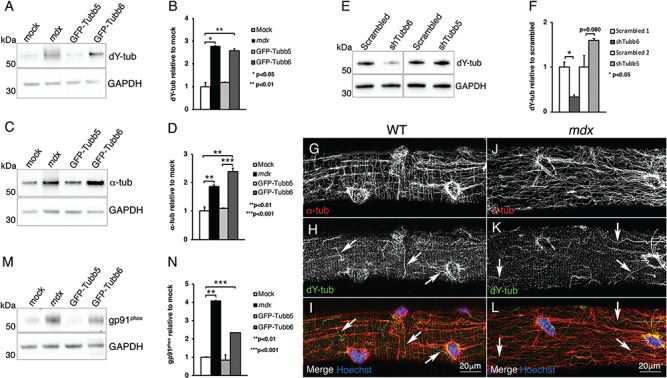
Changes in the amount of tubb6 also affect dY tubulin, total α-tubulins and NOX2 expression. Immunoblot analysis reveals that in vivo overexpression of GFP-tubb6 in WT FDB increases the level of detyrosinated α-tubulin (dY-tub) by 2.60 ± 0.10-fold (A and B). This is similar to the 2.80 ± 0.02-fold increase of dY-tub in mdx FDB fibers compared to mock-transfected. GFP-tubb5 overexpression has no effect (1.10 ± 0.02-fold). However, GFP-tubb6 overexpressing WT fibers and mdx fibers show a comparable increase in total α-tubulin (C and D). There is therefore no change in the fraction of dY-tub. In vivo downregulation of tubb6, but not of tubb5 (E), reduces the level of dY-tub in mdx FDB fibers (E and F). Immunofluorescence staining of single FDB fibers shows that dY microtubules represent a small fraction of the total α-tubulin staining in both WT (G–I) and mdx FDB (J–L). In vivo overexpression of GFP-tubb6 also increases the level of gp91phox, the catalytic subunit of NOX2, 2.30 ± 0.01-fold compared to mock-transfected fibers (M and N). In GFP-tubb5-overexpressing fibers gp91phox level is not increased. A quantitation of the changes and P-values for α-tubulin, dY-tubulin and gp91phox in the various genotypes is shown in Tables 2 and 3.
Table 2.
Increase in α-tubulin, dY-tubulin and gp91phox in mdx, GFP-tubb6- and GFP-tubb5-overexpressing FDB fibers compared to mock-transfected FDB fibers
| mdx | GFP-tubb6 | GFP-tubb5 | |
|---|---|---|---|
| α-tubulin | 1.90 ± 0.10 (0.0321) | 2.40 ± 0.10(0.0024) | 1.10 ± 0.02 (0.6013) |
| dY-tubulin | 2.80 ± 0.02 (0.0360) | 2.60 ± 0.10 (0.0085) | 1.20 ± 0.01 (0.2930) |
| gp91 phox | 4.10 ± 0.01 (0.0009) | 2.30 ± 0.01 (0.0034) | 0.80 ± 0.30 (0.7250) |
Values are expressed as average ± SD and calculated from three separate experiments. P-values are shown in parentheses. dY, detyrosinated tubulin.
Table 3.
Changes in dY-tubulin in shTubb6-treated FDB fibers
| shTubb6 | shTubb5 | |
|---|---|---|
| dY-tubulin | 0.33 ± 0.04 (0.0150) | 1.60 ± 0.04 (0.0804) |
Values are expressed as average ± SD and calculated from three separate experiments. P-values are shown in parentheses. dY, detyrosinated tubulin.
Tubb6 expression and microtubule pattern are normalized in some but not all rescued mdx mouse lines
Based on the previous results, we predicted that rescued mdx mouse lines (9,10) would show a level of tubb6 correlated to the state of their microtubule pattern. The expression of tubb6 in gastrocnemius extracts from various mouse lines was measured (Fig. 6A and B). ΔMTB and Fiona mouse muscle extracts showed a low, WT-like level of tubb6 (see Methods for the full name of the mouse lines). The Fiona mouse result was unexpected: while the ΔMTB mouse is normal in all respects including its muscle microtubules (10), the Fiona mouse is only partially rescued by overexpression of utrophin and shows mdx-like microtubules in extensor digitorum longus fibers (9). In contrast, Δ71–78 and Sgcb −/− mice showed elevated tubb6, unexpectedly for Δ71–78; the Sgcb −/− mouse is a knockout for β-sarcoglycan (13) and has mdx-like microtubules (10) but the Δ71–78 mouse has normal microtubules (10). Adding to the complexity, the variance in tubb6 between animals of the same line is so high that tubb6 level in Δ71–78 and Sgcb −/− mice is not significantly different from WT. Altogether, these results do not support a simple correlation between microtubule organization and tubb6 levels.
Figure 6.
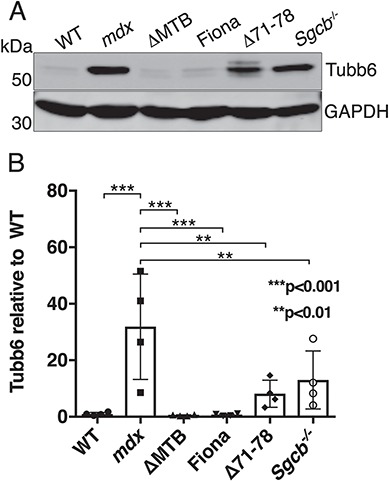
Comparison of tubb6 expression in different mouse lines. Tubb6 is markedly increased in gastrocnemius extracts of mdx mice (31.87 ± 18.64-fold) compared to WT mice (A). Tubb6 is normal in ΔMTB mice in which dystrophic phenotype and microtubules are rescued and it is elevated in the mdx-like mouse line knockout for β-sarcoglycan (Sgcb −/−) (10). Unexpectedly, the level of tubb6 is also normal in Fiona (52) in which microtubules are disordered while tubb6 is higher than WT in Δ71–78 mice (53), which have normal microtubules (9,10). However, because of the large variation between animals, the level of tubb6 found in mdx-based transgenic mice is not significantly different from WT. The gel shown is one representative of four.
Tubb6 expression in mdx muscle and other mouse line muscles is concentrated in fibers with central nuclei and disordered microtubules
At this point, endogenous tubb6 had been localized in single FDB fibers only (Fig. 1) and a variability in the proportion of positive fibers was noticed. To analyze endogenous tubb6 expression in situ thick vibratome sections of tibialis anterior (TA) muscles cut transversely (i.e. perpendicular to the long axis of the muscle) were stained. The confocal images were tiled to view the whole section. Tubb6 staining was not detected in WT muscle (Fig. 7A–C). In mdx muscle, however, clusters of tubb6-positive fibers were found (Fig. 7E) strikingly heterogeneous in size and staining intensity. Higher magnification views of different areas (Fig. 7F and G) reveal that practically all tubb6-positive fibers are centrally nucleated, i.e. regenerated (33). Discrete immunoglobulin G (IgG)-positive, i.e. necrotic fibers (Fig. 7H–I) were also observed. These are also indices of regeneration (34). Furthermore, immunoblots of gastrocnemius muscle extracts showed a correlation between tubb6 and the regeneration marker embryonic myosin heavy chain (eMHC), with similar mouse-to-mouse variation in mdx muscle (Fig. 7J and K). Both eMHC and tubb6 signals were markedly reduced for Δ71–78 and Fiona muscle extracts compared to mdx muscles. We conclude that tubb6 is elevated in regenerating muscle fibers, its staining identifies different stages of muscle regeneration that coexist in mdx muscles, and the variation in tubb6 levels is linked to the variation in regeneration between mdx animals (33,34).
Figure 7.
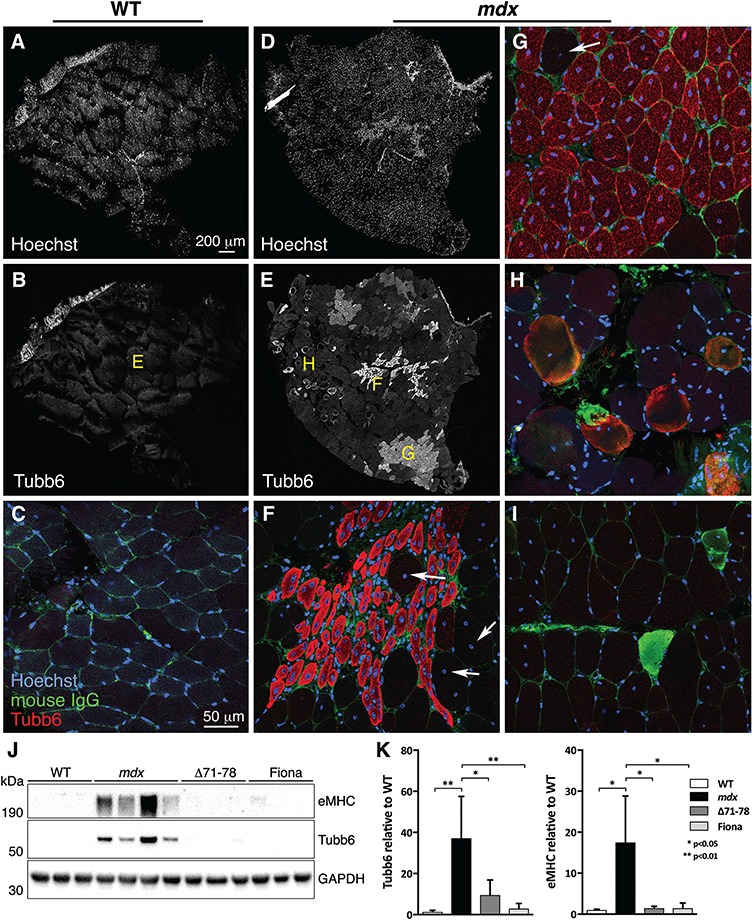
Tubb6 expression in mdx muscle is focal and concentrated in fibers with central nuclei, indicating a link with muscle regeneration. To visualize endogenous tubb6 while keeping all fibers in their native arrangement, we stained 125 μm thick vibratome sections of WT (A–C) and mdx (D–I) TA muscles with anti-tubb6 (red), anti-mouse IgG (green) and Hoechst 33342 (blue). The anti-IgG served as marker for necrotic fibers (34). Views of whole muscle sections were obtained by tiling confocal images captured on the Leica SP5 confocal microscope with a 25X 0.9 numerical aperture (NA) water immersion lens. Hoechst staining (A, D) and anti-tubb6 staining (B, E) are represented in black and white for better contrast. Imaging conditions and post-imaging treatments for tubb6 were the same for WT and mdx sections. (E) reveals a surprising degree of heterogeneity of tubb6 expression in mdx muscle. No tubb6 was detected in WT muscle sections (B) imaged in identical conditions (autofluorescence is present in a band at the edge of the muscle). Single confocal images captured with a 63X 1.4 NA oil immersion lens provide details of the previous images. Yellow letters in (B) and (E) indicate the origin of these panels. All fibers positive for tubb6 in (F–H) show central nuclei. Rim-stained fibers in (H) show central nuclei and some IgG expression. (I) shows two IgG-positive fibers from a separate muscle section. There are some large diameter tubb6-negative fibers with central nuclei (arrows in F and G). Images from similar but longitudinal mdx, Fiona and Δ71–78 muscle sections are shown in Supplementary Material, Figure S5. Together they show that tubb6 is highly concentrated at early stages of muscle regeneration, particularly in myotubes (F) and young fibers (G). For more evidence of a link between tubb6 expression and regeneration, we immunoblotted gastrocnemius muscle extracts of WT, mdx, Δ71–78 and Fiona mice for tubb6 and embryonic myosin heavy chain (eMHC). Each lane corresponds to a different mouse. In mdx samples tubb6 and eMHC are highly increased compared to the other genotypes and show similar variance (see quantitation in K). The scale bar in (A) serves for (A–B), (D–E). The scale bar in (C) serves for (C, F–I).
We repeated the tubb6 staining on longitudinal sections of mdx, Δ71–78 and Fiona muscles (Supplementary Material, Fig. S5). The results helped us identify the different stages of regeneration encountered (Table 4). Each of the mouse genotypes show focal expression of tubb6 and signs of regeneration, but to different degrees with more frequent cases in Δ71–78 than in Fiona mouse sections where we only encountered a single case of tubb6-positive myotube fiber and mononucleated cells near centrally nucleated fibers. Strikingly, we did not find normally organized microtubules in any tubb6-positive fiber (Table 5A). Attempts to simultaneously visualize tubb6 and eMHC on the longitudinal muscle sections were unsuccessful.
Table 4.
Stages of muscle regeneration identified in mdx and other mouse lines and in CTX-injected WT mice (Figs 7, 8 and Supplementary Material, Fig. S5)
| Stages | Cell death (necrosis) |
Regeneration
I |
Regeneration
II |
Regeneration
III |
Maturation |
|---|---|---|---|---|---|
| Examples | Fig. 7H and ISupplementary Material, Fig. S5B and JFig. 8B | Supplementary Material, Fig. S5D Fig. 8B | Fig. 7F Supplementary Material, Fig. S5C and FFig. 8B | Fig. 7G Supplementary Material, Fig. S5B, H and IFig. 8N–P | Fig. 7F and GFig. 8C |
| Markers | |||||
| IgG | ++ | − | − | − | − |
| Tubb6 | +/− | +/− | ++ | + | +/− |
| eMHC | − | − | − | + | +/− |
| CN a | +/− | N/A | + | + | + |
| Fiber aspect | Variable | Mononucleated myoblasts & other cells | Myotubes | Muscle fibers | Large muscle fibers |
CN: central nuclei
Several stages of regeneration can be observed simultaneously in the same muscle section, from cell death to new fiber maturation and forward to the next cycle of cell death and regeneration. We identify fibers that are IgG-positive but tubb6- and CN-negative (i.e. those in Fig. 7I and Supplementary Material, Fig. S5J) as undergoing a first cycle of regeneration while fibers positive for all three markers (Fig. 7H) may be undergoing a further cycle. When regenerated fibers recover without further damage (after CTX injections), both tubb6 and eMHC become undetectable but nuclei remain central.
Table 5.
Correlation between tubb6 expression and microtubule pattern
| Microtubules | Grid-like | Grid-like | No grid | No grid | ||
|---|---|---|---|---|---|---|
| tubb6 | - | + | - | + | ||
| A. mdx-linked regeneration | WT | 49 | 0 | 1 | 0 | |
| mdx | 15 | 0 | 4 | 20 | ||
| Δ71–78 | 52 | 0 | 6 | 18 | ||
| total | 116 | 0 | 11 | 38 | ||
| B. CTX-induced regeneration | CTX, 7 days injected | 14 | 0 | 2 | 136 | |
| CTX, 7 days control | 30 | 0 | 1 | 1 | ||
| CTX, 28 days injected | 11 | 0 | 23 | 0 | ||
| CTX, 28 days control | 48 | 0 | 1 | 0 | ||
| total | 103 | 0 | 27 | 137 |
Confocal images of tubb6 and α-tubulin staining in longitudinal vibratome sections were examined. Fibers were counted and binned into four categories based on microtubule pattern and tubb6 level. Only images with both stainings identifiable were considered. The images had been collected over several months by two researchers looking for tubb6-positive fibers. There were three to five animals per group. Tubb6 expression appears incompatible with a grid-like organization of microtubules.
CTX injection confirms a link between tubb6, regeneration and disordered microtubules
To investigate whether tubb6 involvement would occur during muscle regeneration in a WT mouse, CTX injection of the WT TA muscle was performed, an experimental in vivo model of acute muscle regeneration (35,36). Muscles were collected 3, 5, 7, 10, 14 and 28 days post-injection, the last point corresponding to the time required for full recovery from CTX-induced injury (36). Untreated contralateral TA muscles served as control.
RNA-seq analysis (Fig. 8, upper left) showed a sharp increase in tubb6 expression with a time-course similar to that of myogenin (myog; differentiation marker) and pax7 (pax7; satellite cell activation marker), and just preceding the increase in eMHC (myh3). The maximum increases were 20.80 ± 0.50-fold for tubb6, 58.30 ± 0.30-fold for myog, 15.60 ± 8.70-fold for pax7 and 20 ± 0.1-fold for myh3.
Figure 8.
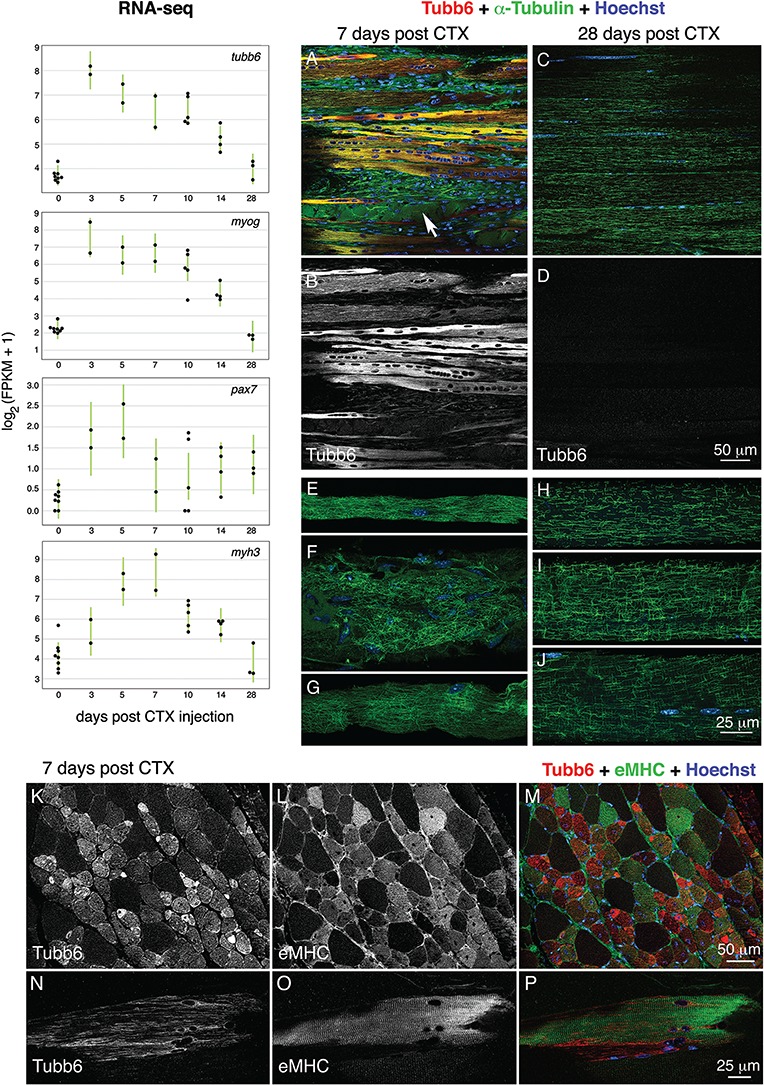
Tubb6 is also increased at an early stage in an experimental model of muscle regeneration with morphological features similar to those of mdx muscle. To find out whether tubb6 increases in other models of muscle regeneration, we examined WT TA muscles injected with cardiotoxin (CTX). RNA-seq results (n = 18 mice) show that tubb6 RNA is increased 20.80 ± 0.50-fold 3 days after CTX injection. After 28 days, tubb6 and most other RNAs are back to normal. Tubb6 changes follow a time course closely parallel to those of myogenin (myog; 58.30 ± 0.30-fold increase at day 3) and similar to those of pax7 (15.60 ± 8.70-fold at day 5) and eMHC (myh3; 20.10 ± 0.10-fold at day 7). Images from TA muscles collected 7 days post-CTX injection, sectioned longitudinally and stained for tubb6 and α-tubulin (A and B) resemble images from mdx sections (see Fig. 7 and Supplementary Material, Fig. S5); they show necrotic IgG-positive fibers (A, arrow) and thin densely stained tubb6-positive myotubes. In sections from muscles collected 28 days post-CTX injection (C and D), no staining above background is observed for tubb6, but microtubules appear incompletely recovered. Fibers remain centrally nucleated. Contralateral uninjected muscles (not shown) were indistinguishable from age-matched WT controls. Single fibers were prepared from the same muscles by manual teasing and stained for α-tubulin only (E–J). At 7 days post-CTX injection (E–G), the disordered microtubule pattern resembled that of mdx fibers. At 28 days (H–J) there was incomplete recovery. Finally, transverse (K–M) and longitudinal (N–P) sections from 7-day-injected muscles were stained for tubb6 and eMHC. Tubb6 expression overlaps with but precedes eMHC. Fibers showing neither marker presumably escaped CTX. The longitudinal image shows a fiber with well-striated myosin bands but abnormal longitudinal microtubules. The images are representative of n = 3 independent experiments. Quantitation of tubb6 expression versus microtubule organization is shown in Table 5.
Immunofluorescence of sections (Fig. 8A–D) and of single-teased fibers (Fig. 8E–J) from CTX-injected TA muscle showed features similar to those in mdx mice. Muscles taken 7 days after CTX injection showed tubb6-positive myotubes and small fibers with longitudinal microtubules (Fig. 8A and B), mononucleated cells and necrotic fibers (Fig. 8A, arrow). Single-teased fibers (Fig. 8E–G) showed a dense, disordered, mdx muscle-like microtubule network. In muscles taken 28 days after CTX injection, in contrast, tubb6 staining was practically absent (Fig. 8C and D), as were mononucleated cells and IgG-positive fibers. Microtubules were much improved compared to day 7 samples but not completely recovered (Fig. 8H–J). Microtubule reorganization thus lags behind other aspects of regeneration.
Co-staining of CTX-injected muscle sections for tubb6 and eMHC (Fig. 8K–P) showed that the two markers overlap but are not synchronized; the strongest tubb6-expressing myotubes are not positive for eMHC and some strong eMHC-positive fibers are only weakly tubb6-positive. Large fibers that are negative for both markers and do not have central nuclei were likely not affected by CTX. Staining of a longitudinally sectioned muscle (Fig. 8N–P) shows striated eMHC staining and longitudinal microtubules similar to those of myotubes or tubb6 overexpressing fibers in Δ71–78 muscle. Quantitation of the link between tubb6 expression and microtubule pattern (Table 5B) reinforces the notion that elevated tubb6 expression is incompatible with a normal grid-like microtubule pattern, regardless of the cause of regeneration.
The link between tubb6 expression and central nucleation 7 days after CTX injection was quantitated. Taking tiled images of whole muscle sections (as in Fig. 7E), a total of 2245 fibers were counted, 1210 of which showed central nuclei; 1198 of these centrally nucleated fibers were positive for tubb6. Thus, 99% of regenerated fibers show increased tubb6, indicating a tight correlation between the two. The fraction of tubb6-positive fibers that showed central nuclei was smaller (70%) possibly because many immature fibers (such as those shown in Fig. 8B) do not yet have a continuous row of central nuclei.
The possible elevation of tubb6 in different human muscle diseases that present with muscle regeneration was also evaluated. Indeed, tubb6 mRNA is significantly upregulated in muscle biopsies of patients with different types of myositis: antisynthetase syndrome (ASS; 9.2-fold), dermatomyositis (DM; 2.6-fold), inclusion body myositis (IBM; 3.8-fold) and immune mediated necrotizing myositis (IMNM; 6.4-fold). Data are normalized to tubb6 expression in normal muscle tissue (NT). In human myositis, DMD biopsies and CTX-injected mouse muscles, the increase in tubb6 level correlates positively with the upregulation of myog, pax7 and myh3 (Fig. 9A and B) and with the downregulation of myosin heavy chain variants only expressed in mature fibers (myh1 and myh2; Fig. 9A and C).
Figure 9.
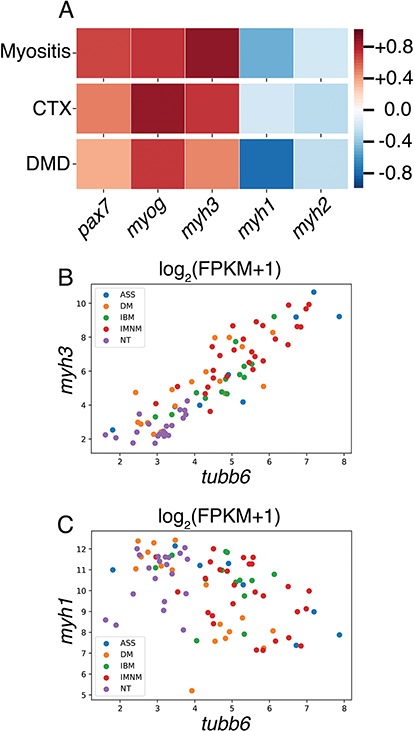
Tubb6 RNA is also upregulated in human myositis and DMD muscles and in these, like in CTX-injected mouse muscles, tubb6 RNA level is positively correlated with myogenic and regeneration markers and negatively correlated with markers of mature muscle. Spearman correlation analysis shows that in human muscle biopsies of patients affected by several forms of myositis, DMD and in CTX-injected mouse muscles, tubb6 expression positively correlates with myogenin (myog), pax-7 (pax7) and eMHC (myh3) and negatively correlates with adult myosin heavy chains MYH1 and MYH2 (myh1 and myh2) (A). Scatter plots for myositis are shown in (B) and (C). DMD analysis was carried out on results previously published by others (4).
ASS: antisynthetase syndrome; DM: dermatomyositis; IBM: inclusion body myositis; IMNM: immune mediated necrotizing myositis; NT: normal muscle tissue.
Tubb6 is upregulated during differentiation of C2 and human primary muscle cells
The strong upregulation of tubb6 at early stages of regeneration suggests it may be similarly upregulated during normal muscle differentiation. Indeed, tubb6 increases 2.30 ± 0.30-fold (P = 0.0155) during differentiation of the mouse muscle cell line C2 (Fig. 10A–I) while myogenin is increased 4.10 ± 0.41-fold (P = 0.0051; Fig. 10J–L). Interestingly, tubb6 RNA is also upregulated during in vitro differentiation of human primary skeletal muscle myoblasts with a maximum increase of 1.46 ± 0.05-fold three days after induction of myogenic differentiation (Fig. 10M).
Figure 10.
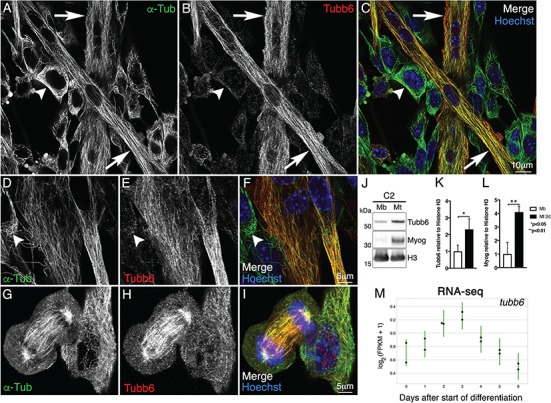
Tubb6 is upregulated during differentiation of C2 mouse muscle cells and of human myoblasts. C2 cultures after 48h in fusion medium show both myoblasts (arrowheads) and myotubes (arrows) stained for tubb6 (red) and α-tubulin (green). Tubb6 expression is higher in myotubes than in myoblasts (A–C, D–F), as confirmed by immunoblot (J–L, 2.30±0.30-fold; Mb: myoblasts; Mt: myotubes). In undifferentiated cells, the only feature strongly positive for tubb6 is the mitotic spindle (G–I). Myogenin (Myog) was used to evaluate C2 myotube differentiation (4.10±0.41-fold compared to myoblasts). Histone H3 was used as loading control. Tubb6 is also significantly increased during differentiation of human primary skeletal muscle myoblasts (1.46±0.05-fold; M). Day 0 corresponds to undifferentiated human myoblasts.
Discussion
How microtubule organization is disrupted in dystrophic muscle is poorly understood. Here, we show that a component of the microtubules themselves, the β-tubulin tubb6, plays a part.
Overexpressing tubb6 perturbs the WT microtubule network while knocking down tubb6 improves the mdx microtubule network. In contrast, increasing or knocking down the similar β-tubulin tubb5 is inconsequential. Improvement of the microtubule network in mdx fibers expressing tubb6 shRNA but not tubb5 shRNA (Fig. 4) is remarkable. The shRNA-expressing fibers were identified thanks to the GFP marker encoded in the shRNA cDNA vectors and the microtubule pattern of these fibers was assessed based on α-tubulin staining. The total tubb6 decrease was also measured by immunoblotting. However, it was not possible to estimate the tubb6 decrease in individual fibers. Indeed, shRNA and GFP levels being controlled by different promoters, the level of GFP in individual fibers does not reflect the level of shRNA. Furthermore, GFP and tubb6 could not be visualized simultaneously because of incompatible fixation requirements. The best control is then the absence of normal-looking microtubules in tubb5 shRNA-treated samples and in the other controls. One could consider an alternative explanation, i.e. that tubb6 shRNA kills regenerating fibers and only leaves tubb6-negative normal fibers and non-regenerating fibers. In this case, however, there should be an increase in GFP-negative fibers with normal-looking microtubules and these were not found.
There is no clear bimodal distribution of microtubule pattern in mdx FDB fibers; instead, a high fraction of collagenase-dissociated FDB fibers have a distorted microtubule network to start with. Even WT FDB microtubules do not appear as well organized as they are in teased fibers or in vivo (1), although their microtubule dynamics are normal (1). We are currently investigating whether experimental conditions during collagenase treatment and fiber plating contribute to this pattern degradation. Another factor to consider is the elevation of tubb6 in pre-regeneration mdx fibers (22, 23 and Supplementary Material, Fig. S2), possibly affecting microtubules.
If tubb6 only caused microtubule defects and even cell death (Fig. 3), why would it be increased in mdx and DMD muscles? The finding that tubb6 also increases during muscle differentiation (Fig. 10) and that its increase is linked to muscle regeneration in the mdx mouse (Fig. 7), in the WT mouse injected with CTX (Fig. 8) and in myositis and other human inflammatory muscle diseases including DMD (Fig. 9) indicates that tubb6 is not the toxic tubulin that it first seemed to be.
During regeneration, tubb6 appears most concentrated in myotubes (Fig. 7F, Supplementary Material, Fig. S5D and Fig. 8A and B) whose normal microtubule organization is one of parallel longitudinal microtubules (38–40), useful for transport of sarcomeric myosin (41). The switch to the grid-like microtubule network occurs later during muscle fiber maturation and may require a decrease in tubb6. It has not been observed in muscle cultures and CTX injection is a useful model to follow this stage of myogenesis in vivo (43). However, regeneration does not exactly reproduce development since it reuses the “empty ghosts” of the original fibers (43). Nuclei remain central after regeneration (33), perhaps an explanation for the incomplete microtubule recovery (Fig. 8).
The degree of variability in tubb6 expression between mice and between muscles is surprising but it is known that muscular dystrophy affects different muscles in an animal and even the same muscle to different degrees when comparing animals (33,34,64). A published image showing quite different patterns of Evans Blue Dye uptake (a sign of damaged sarcolemma) in two mdx littermates (34) strikingly illustrates this observation. Additionally, FDB extracts, prepared from purified muscle fibers, may give different results compared to gastrocnemius and TA extracts, prepared from whole muscles and therefore including a large fraction of other cells. Tubb6 is known as a ubiquitous tubulin (26) but it is not expressed at the same level in every cell type; removing the non-muscle components of the tissue may change the amount of tubb6 compared to other proteins and tubulins.
Both GFP-tubb6 and tubb6-GFP become incorporated into microtubules and affect their distribution, but expression of GFP-tubb6 reaches much higher levels. We hypothesize that this is not just a question of the amount of plasmid injected. β-Tubulins are controlled by a post-transcriptional mechanism that protects cells from excessive unassembled β-tubulin and limits ectopic overexpression of tubulins (47,48). This mechanism involves the four N-terminal amino acids of the β-tubulin and is blocked if they are substituted, for example by an N-terminal GFP, hence the higher expression of GFP-tubb6 (47).
The single-teased fiber preparation has been essential for understanding the organization of muscle microtubules (2–4,7–10,20,44,45) and for distinguishing cortical from core fiber microtubules. However, because of staining difficulties with anti-tubb6 (see Immunofluorescence in the Methods section) much of the present work uses vibratome sections, with the caveat that longitudinal sections only occasionally follow the surface of a fiber, making the distinction between core and cortical microtubules difficult. We have thus far not been able to obtain microtubule staining from frozen sections, likely because microtubules depolymerize in the cold. It is regrettable that human DMD biopsies are usually immediately frozen, making the assessment of their microtubules practically impossible.
Dystrophin has been implicated in microtubule organization, providing a direct link between muscular dystrophy and microtubule alterations. There is much support for this hypothesis; dystrophin binds and appears to guide microtubules in WT muscle (8,9) and several mdx mouse lines rescued by re-expression of dystrophin constructs show restored muscle microtubules (7,9–12). In contrast, the mdx line Fiona, rescued by overexpression of utrophin, a homolog of dystrophin that lacks microtubule binding, does not show microtubules restored to the same degree (8,9). Furthermore, mutations or absence of ankyrin B and obscurin, two proteins necessary for dystrophin localization, also perturb microtubules (37,46). However, there are arguments against a direct role for dystrophin; WT and mdx microtubules can be altered regardless of dystrophin by changing the level of tubb6 (this work), of dY-tubulin (19) or of NOX2 (20). Furthermore, microtubule organization in mdx was rescued with a transgenic or recombinant dystrophin lacking in vitro microtubule binding activity (10). Thus, the jury is still out on a direct role for dystrophin in microtubule disorganization in the mdx muscle. Plectin has also been implicated in microtubule organization in mdx fibers (62) and nNOS (42,45) and CLIMP-63 (61) have been implicated in muscle microtubule organization, but not in the mdx muscle. There must be multiple pathways affecting a protein network as diverse and complex as microtubules, and these pathways may work differently depending on the context.
In conclusion, tubb6 regulation plays a role in muscle differentiation and regeneration, in the mdx mouse, in DMD and in several forms of human myositis. To the best of our knowledge, this is the first example of a tubulin isotype-specific role in muscle. Tubb6-specific functions have been described in other tissues: tubb6 is one of three β-tubulins directly interacting with a brain kinase involved in Parkinson’s Disease (49); tubb6 has been identified as a methylation biomarker for ulcerative colitis-associated neoplasia (50) and tubb6 affects human sensitivity to inflammatory cell death (51). Hopefully, tubb6 will now be useful as a new marker of regeneration in inflammatory diseases of skeletal muscle and as a tool for understanding the role of microtubules in these diseases.
Materials and Methods
Antibodies
Rabbit anti-dY tubulin (ab48389), rabbit anti-laminin (ab11575) and mouse anti-myogenin (clone F5D) were purchased from Abcam (Cambridge, MA); rat anti-tyrosinated tubulin (clone YL1/2) from Accurate Chemical and Scientific Corporation (Westbury, NY) mouse anti-α-tubulin (clone DM1A) and anti-tubb5 (clone SAP.4G5) from Sigma; mouse anti-gp91phox from BD Bioscience (San Jose, CA); mouse anti-eMHC (clone F1.652–S) from the Developmental Studies Hybridoma Bank (University of Iowa); rabbit anti-GAPDH from Novus Biologicals (Centennial, CO); rabbit anti-GFP from Cell Signaling Technology (Danvers, MA) and Alexa-conjugated anti-mouse or rabbit IgG from Molecular Probes-Thermo Fisher Scientific (Waltham, MA). We received rabbit anti-dY-tubulin from G. Cooper IV and, after his death in 2012, from Tommy Gallien (University of South Carolina). For tubb6 work, Antony Frankfurter (University of Virginia) and Anutosh Ganguly (University of Calgary, Canada) generously shared some of the original rabbit anti-tubb6 antibody generated by Antony Frankfurter (57) and used in cited work by the Frankfurter and Cabral laboratories. We also obtained our own rabbit polyclonal anti-mouse tubb6 by immunizing rabbits with the synthetic peptide CGGGEINE (Genemed Synthesis, Inc., San Antonio, TX), which includes the four C-terminal amino acids of mouse tubb6 (EINE) with a poly-glycine linker and N-terminal cysteine for covalent coupling to Keyhole Limpet Hemocyanin. Antisera from two immunized rabbits were pooled and affinity-purified against the same peptide immobilized on CNBr-activated agarose. The specificity of the anti-tubb6, tubb5 and tubb4b antibodies, commercial and proprietary, was tested by immunoblot against bovine serum albumin (BSA)-conjugated peptides (Peptide 2.0, Chantilly, VA) with the sequence of the mouse tubb6 (NDGEEAFEDEDEEEINE) or tubb5 (ATAEEEEDFGEEAEEEA) C-terminal tail (CTT). A BSA-conjugated peptide with the mouse tubb4b sequence (ATAEEEGEFEEEAEEEVA) was used as a negative control (Supplementary Material, Fig. S1A and B). We have not found any commercial anti-tubb6 antibody to pass this specificity test; in particular, the anti-pan-β-tubulin antibodies DM1B and TUB2.1 did not detect either GFP-tubb6 or the tubb6 peptide in immunoblot (not shown), confirming for TUB2.1 the results of Yang and co-workers (63). The specificity of the tyrosinated and dY α-tubulin (dY-tub) antibodies was tested against BSA-conjugated peptides with the mouse tuba1a-specific CTT (DSVEGEGEEEGEEY) with or without the last tyrosine (Y) residue (Supplementary Material, Fig. S1C and D). Peptides were conjugated to BSA using click chemistry linker technology acquired from SoluLink (San Diego, CA). Peptides were derivatized at the amino terminus by reaction with succinimidyl 6-hydrazinonicotinate acetone hydrazone (S-HyNic, Solulink S1002). The peptides (3.5 mm) were dissolved in PBS containing Na-Borate, pH ~8, followed by addition of 10 mm S-HyNic and allowed to react for 1–2 h at room temperature. Peptides were cleaned of unreacted S-HyNic by anion exchange chromatography on DEAE-Sephadex Fast Flow. Peptides were eluted with 2.5% (w/v) trifluoroacetic acid, and the solvent removed by vacuum centrifugation. BSA MilliporeSigma (St. Louis, MO) was random labeled by succinimidyl 4-formylbenzoate (S-4FB, Solulink S1008). BSA (0.15 mm) was dissolved in PBS containing 10 mm Na-Borate, pH 8.5, followed by addition of DMSO stock of S-4FB to a final concentration of 0.2 mm. Following incubation for 1–2 h, unreacted small molecules were removed by size exclusion chromatography (Thermo Fisher, Zeba 7k Spin column). Final conjugate was produced by incubating overnight at 4°C with 0.1 mm BSA-4FB and ~0.25 mm HyNic-peptide in coupling buffer (0.1 M Na-phosphate, 0.15 M NaCl, pH 6.0), followed by size exclusion chromatography to remove unreacted peptides. This yielded conjugate with peptide/BSA molar ratio of <1, typically 0.5.
Mice
Male C57BL/6, C57BL/10ScSnJ (WT) and C57BL/10ScSn-DMDmdx/J (mdx) mice were purchased from the Jackson Laboratory (Bar Harbor, ME, USA) and euthanized at 3–12 weeks unless otherwise specified. Congenic Fiona-mdx (52), dystrophin deleted exons 71–78 (DysΔ71–78-mdx) (53) and dystrophin deleted microtubule-binding site (DysΔMTB-mdx) mice (10) were bred for at least ten generations onto the mdx mouse strain obtained from the Jackson Laboratory. Sgcb−/− mice (13) were originally obtained from the Jackson Laboratory (B6.129-Sgcbtm1Kcam/1J) and backcrossed onto C57BL/6 mice. All mice used in this study were male since DMD affects males only. Fiona, Δ71–78, ΔMTB and Sgcb−/− mice were bred at the University of Minnesota and shipped live to the National Institutes of Health (NIH). All animals were housed and treated in accordance with the standards set by both National Institute of Arthritis and Musculoskeletal and Skin Diseases (NIAMS) and University of Minnesota Institutional Animal Care and Use Committees.
Hereafter, we will refer to the different mouse lines as follows:
C57BL/6, and C57BL/10ScSnJ: WT
C57BL/10ScSn-DMDmdx/J: mdx
Fiona-mdx: Fiona
DysΔ71–78-mdx: Δ71–78
DysΔMTB-mdx: ΔMTB
Sgcb−/− : Sgcb−/−
C2 cultures
The mouse skeletal muscle cell line C2 was cultured as described (38). Undifferentiated myoblasts were plated on tissue culture dishes with or without gelatin-coated glass coverslips in growth medium consisting of Dulbecco’s modified Eagle’s Medium (DMEM) with 4.5 g/l glucose and L-glutamax (Gibco) supplemented with 20% fetal bovine serum FBS; HyClone-Thermo Fisher Scientific (Waltham, MA), 0.5% chick embryo extract MP Biomedicals (Santa Ana, CA) and 1 mm sodium pyruvate Corning (Corning, NY). When cells reached 60–70% confluence, growth medium was replaced with fusion medium consisting of DMEM supplemented with 4% horse serum Gemini Bioproducts, INC (West Sacramento, CA) and 1 mm sodium pyruvate (Corning). Once in fusion medium, C2 cultures received a daily half-feed. They were fixed or collected after 48 h.
Human myoblasts primary cell culture
Normal human skeletal muscle cells from a single donor Lonza (Walkersville, MD) were cultured as previously described (54). When cultures reached 80% confluence, the cells were induced to differentiate into myotubes by replacing the growth medium with medium containing DMEM, 2% horse serum and L-glutamine. Cells were harvested immediately before initiating the differentiation (day 0) and every 24 h during the next 6 days afterwards.
Human biopsies
All available muscle biopsy specimens from patients enrolled in the longitudinal cohort of the National Institutes of Health (Bethesda, MD) and the Johns Hopkins Myositis Center (Baltimore, MD) were included in the study if the patients had IBM, DM, IMNM or ASS. NT from the Neuromuscular Department of the Johns Hopkins Hospital and from the University of Kentucky were used for comparison purposes.
Plasmids
To overexpress the β-tubulins tubb6 and tubb5, we generated the cDNAs on a pDEST40 vector backbone with the following strategies: mouse tubb6 (NM_026473.2) was cloned into the pENTR/D-TOPO (pEDT) vector (Invitrogen) using the tubb6-containing plasmid PS100010 with a C-terminal GFP tag OriGene (Rockville, MD) and sequence verified. Tubb6 was then amplified from the PS100010 plasmid to generate the pEDT-tubb6 vector. Using the Gateway Recombination system Life Technologies (Carlsbad, CA), pEDT-tubb6 was recombined into a pDEST40 vector containing an N-terminal or a C-terminal enhanced GFP (eGFP) tag. The pDEST40-GFP-tubb6 and the pDEST40-tubb6-GFP constructs were purified using EndoFree Plasmid Giga Kit Qiagen (Germantown, MD); mouse tubb5 (NM_011655.5) was amplified from RNA isolated from C2C12 cells using nested PCR with the following primers: first round Fwd (5′-TAGAACCTTCCTGCGGTCGT-3′), first round Rev (3′-AGGGCAGTTGGAGAAAGCTG-5′), second round Fwd (5′-CACCATGAGGGAAATCGTGCACAT-3′) and second round Rev (3′-TTAGGCCTCCTCTTCTGCCTCCT-5′). The PCR product of tubb5 was inserted into pENTR/D-TOPO vector (Invitrogen). Using the Gateway Recombination system (Life Technologies), pEDT-tubb5 was recombined into a pDEST40 vector containing an N-terminal eGFP tag to produce pDEST40-GFP-tubb5 and purified using EndoFree Plasmid Giga Kit.
To induce the knockdown of the beta-tubulins tubb6 and tubb5, we used pGFP-V-RS plasmids (OriGene) encoding 29-mer shRNAs targeting the mouse tubb6 mRNA with the following sequences:
shRNA A: 5′-ACTACAATGAGTCATCCTCTAAGAAGTAC-3′,
shRNA B: 5′-CTCTATGACATCTGCTTCCGCACGCTCAA-3′,
shRNA C: 5′-AGCAGTACCAGGACGCCACGGTCAATGAT-3′,
shRNA D: 5′-ATGAGCGGTGTCACCACATCACTGCGTTT-3′. The mouse tubb5 mRNA was targeted with the following sequences:
shRNA A: 5′-GAGCAACATGAACGACCTCGTCTCTGAGT-3′,
shRNA B: 5′-CCTCTCACCAGCCGTGGAAGCCAGCAGTA-3′,
shRNA C: 5′-CAGCAGGTCTTCGATGCCAAGAACATGAT-3′,
shRNA D: 5′-TGAAGGAGGTGGATGAGCAGATGCTCAAC-3′. In all experiments, a non-effective 29-mer shRNA with the sequence 5′-GCACTACCAGAGCTAACTCAGATAGTACT-3′ was used as a control (scrambled). In the pGFP-V-RS vector, transcription of shRNA molecules is driven by the U6 promoter. The expression of turbo GFP is driven by a separate cytomegalovirus promoter.
cDNA injection and electroporation in the FDB muscle
To obtain cDNA expression in the FDB muscle, we followed the protocol originally described in (55) as adapted in (1). Mice were anesthetized with 4% isoflurane during the entire procedure and were injected subcutaneously with a 0.05 mg/kg solution of Buprenorphine HCl to avoid pain. To allow the cDNA to reach the FDB fibers, the extracellular matrix and the connective tissue surrounding the muscles were digested with 10 μl of 0.5 U/μl solution of hyaluronidase (Sigma) injected through the skin at the heel. After ~1 h, we injected 5–50 μg of endotoxin-free cDNA Genewiz (South Plainsfield, NJ) in sterile Dulbecco’s Phosphate-Buffered Saline (DPBS; Gibco). Fifteen minutes later, acupuncture needles (0.20 × 25 mm, Tai Chi; Lhasa OMS) were inserted under the skin at the heel and at the base of the toes, and connected to an ECM 830 BTX electroporator BTX Harvard Apparatus (Holliston, MA). Six pulses, 20 ms each at 1 Hz were applied to yield ~75 V/cm electric field. Six days later, unless otherwise specified, the FDB muscle was removed. The expression of the cDNA was confirmed by the presence of GFP-positive fibers under fluorescence illumination using the dissection microscope MZ FLIII Leica Microsystems (Buffalo Grove, IL). The efficiency of transfection ranged from 40 to 80% of FDB fibers depending on the cDNA employed.
Muscle tissue sections
Vibratome sections: Microtubules do not survive the preparation of frozen sections; therefore, thick sections (125 μm) were prepared with a VT 1000S vibrating blade (vibratome; Leica) in the Biological Imaging Core facility of the National Eye Institute, NIH. Whole legs were removed, skinned and fixed for 2 h in 4% paraformaldehyde (PFA) in PBS, prepared from a 16% stock solution Electron Microscopy Sciences (Hatfield, PA). Gastrocnemius or TA were then dissected and further fixed for another 2 h. Muscles were cut into pieces of about 2 × 2 × 4 mm and embedded in a 7% solution of low gelling temperature agarose (Sigma type XI or OmniPur Agarose) while keeping track of fiber orientation. The agarose was prepared in 1X PBS at 60°C. Undissolved clumps of agarose were removed by vigorous stirring with a metal spatula and subsequent microwave reheating. Sodium azide (0.05% final) was added and agarose was poured on the muscle and solidified on ice.
Cryosections: FDB muscles were removed, covered with a drop of O.C.T. compound (Tissue-Tek-Sakura) and immediately snap frozen using liquid nitrogen-cooled isopentane. Cross sections (8 μm) were cut on a CM1850 cryostat (Leica), mounted on Superfrost Plus slides (Thermo Scientific), air dried and stored at −20°C until used.
CTX injury of the TA
Muscle injury and regeneration was induced using the mouse CTX model as previously described (35). Briefly, 6-week-old anesthetized C57BL/6 mice (n = 19) were unilaterally injured via intramuscular injection of 0.1 ml of 10 μM CTX in the TA muscle. The contralateral (uninjured) TA muscle served as control (day 0, n = 8). Muscles were harvested at days 3 (n = 2), 5 (n = 2), 7 (n = 2), 10 (n = 5), 14 (n = 4) and 28 (n = 3) post-injury and RNA was prepared for sequencing or muscles were fixed for vibratome sectioning and for fiber teasing at days 7 and 28.
Muscle fiber preparation
FDB: Mice were sacrificed by CO2 and cervical dislocation. FDB muscles were dissected, rinsed in sterile serum-free DMEM and incubated with rotation for 3 h at 37°C in a solution of 1.5 mg/ml collagenase from Clostridium histolyticum (Sigma) and 1.0 mg/ml BSA (Sigma) in sterile serum-free DMEM. Fibers were then dissociated by repeated pipetting in and out of a 1 ml glass pipette and plated in a 0.2 ml droplet of fusion medium onto 60 mm tissue culture dishes for immunoblots or 35 mm dishes containing a #1.5 glass coverslip covered with 1:10 Matrigel (Corning) for immunofluorescence. After 2 h, fibers were fed with fusion medium. Fibers were then used within 24 h, before denervation-induced reorganization of microtubules and other cytoskeletal components occurs (2,56).
Teased fibers: Small strips of fixed TA were placed in PBS on a Sylgard-coated tissue culture dish. We teased single fibers with Dumont #5 fine forceps, under a MZ FLIII dissection microscope (Leica). At least 20 fibers per staining were incubated and washed in one well of a 24-well plate containing a Falcon cell culture insert (8 μm pore size) to facilitate transfer and fiber retention. The fibers were finally transferred to a drop of Vectashield mounting medium Vector Laboratories (Burlingame, CA) on a glass slide, covered with a #1.5 glass coverslip and sealed with nail polish.
Immunofluorescence
Coverslips with plated FDB muscle fibers were rinsed in DPBS and fixed for 20 min in 1 or 2% PFA (Electron Microscopy Science) in PBS pH 7.4 or for 7 min in −20°C methanol. Non-specific staining was reduced by blocking for 2 h at room temperature in 5% BSA (Sigma), 1% normal goat serum (Sigma) and 0.04% saponin (Sigma) in PBS pH 7.4 with NaN3. Fibers were then incubated with primary antibodies in blocking buffer overnight at 4°C and with secondary antibodies for 2 h at room temperature. Between and after antibody incubations, fibers were gently rinsed in PBS-0.04% saponin three times for 5 min.
Coverslips with C2 cells were treated similarly except that secondary antibody incubations were 1 h long.
Vibratome sections were treated with the Mouse-On-Mouse basic kit blocking reagent (Vector Laboratories) in PBS, 0.04% saponin and 1% normal goat serum (Sigma) for 2 h to reduce non-specific staining and then incubated with primary antibodies in Mouse-On-Mouse protein diluent in PBS, 0.04% saponin and 1% normal goat serum for 1 h at room temperature. Sections or teased fibers were then washed in PBS-0.04% saponin overnight at 4°C. The next day, sections were washed twice in PBS-0.04% saponin for 20 min each at room temperature, incubated in secondary antibodies for 1 h and washed for at least 1 h. Sections were then mounted in Vectashield in chambers made with Secure Seal Spacers (20 mm diameter X 0.12 mm depth, Electron Microscopy Sciences) attached to glass slides.
Teased fibers were treated exactly as vibratome sections. Primary antibody incubation took place overnight at 4°C, washes were three times 20 min each, secondary antibody incubation was 2 h at room temperature and mounting was in Vectashield on a glass slide then covered with a #1.5 coverslip and sealed with nail polish.
Cryosections were fixed in 2% PFA in PBS for 20 min at room temperature and blocked in 5% normal goat serum, 1% BSA and 0.04% saponin in PBS for 1 h at room temperature. They were incubated overnight at 4°C in primary antibodies diluted in blocking buffer and at room temperature for 1 h in secondary antibodies also diluted in blocking buffer. Between and after antibody incubations, sections were washed in PBS-0.04% saponin three times for 5 min each. In all immunofluorescence experiments, Hoechst 33342 (1 μg/ml) was added to the last rinse to counterstain nuclei and Vectashield was used as mounting medium.
Remarks about tubb6 staining: the original anti-tubb6 antibody (57) requires methanol fixation, which works well for C2 cultures and reasonably well for plated FDB fibers but does not work for large muscles such as TA, or gastrocnemius. Usually we resolve the problem by fixing the muscle with aldehyde fixatives first, dividing the muscle in fiber bundles and doing a second fixation of the bundles with methanol. This did not work for tubb6. Our newly generated anti-tubb6 did not work well on single fibers but stained C2 cultures and vibratome sections, in both cases fixed with PFA (1 to 4%) in PBS pH 7.4 and permeabilized with 0.04% saponin or Triton X-100. However, we could not verify that the two antibodies have the same sensitivity when staining muscle sections. The difficulties with anti-tubb6 antibodies may be related to the very C-terminal location of the short epitope. Similar images were obtained when tubb6 and α-tubulin staining were done individually, ruling out competition between the two antibodies.
H&E staining
Cryosections were stained with Gill modified 0.1% hematoxylin Harleco-MilliporeSigma (St. Louis, MO) and 1% eosin Y (Harleco) solutions, rinsed twice in double-distilled water, dehydrated by passages in ascending alcohols and finally clarified with two passages in xylene. Coverslips were mounted using Permount mounting medium (Fisher Scientific). Section micrographs were acquired with a SCN400F slide scanner (Leica).
Microscopy
Immunofluorescence micrographs were collected on a Zeiss LSM 780 or a Leica SP5 confocal microscope in the NIAMS Light Imaging Section using 40X 1.25NA or 63X 1.4NA oil immersion lenses with zoom set to 1.0 or 2.0, unless otherwise specified. Images shown are single optical sections or maximum projections of Z-stacks of images and were collected with 1.0 Airy Unit pinholes in sequential scanning to avoid cross-talk between channels. Images for tiling were taken with a 25X 0.9NA Leica water immersion objective on the SP5 and tiled with the SP5 software. Images were exported in 8-bit RGB or grayscale TIFF format and linearly adjusted, cropped and resized for montages (when needed) in Photoshop CC 2017 (Adobe).
Image analysis
The Image J software (freely available at rsb.info.nih.gov/ij) was used for counts of central nuclei, assessment of CSA, and measurements of microtubule density. Tubb6-positive and tubb6-negative muscle fibers with central nuclei after CTX injection were visually identified and quantitated by using the count tool in Adobe Photoshop CS6 Extended Version. Analysis of microtubule directionality was performed using the TeDT directionality software (31).
Immunoblotting
For FDB fibers, C2 myoblasts and C2 myotubes, coverslips or dishes were rinsed once with Ca-free PBS. Fibers or cells were collected by scraping with a rubber spatula and spun down. Gastrocnemius muscles were dissected, flash-frozen in liquid nitrogen and pulverized to a powder with a liquid nitrogen-cooled mortar and pestle. From here, on all samples were treated similarly. They were lysed in 1X sample buffer National Diagnostic (Atlanta, GA), boiled for 5 min, incubated at room temperature for 30 min and centrifuged at 14 000 rpm for 10 min to clear lysates of insoluble material. Proteins were separated at 200 V on 4–12% NOVEX NuPAGE Bis-Tris 1.0 mm gradient gels (Invitrogen) using 1X NuPAGE MES SDS running buffer (Life Technologies) according to the manufacturer’s instructions. To equalize loading, we first ran a gel with equal volumes of each protein extract and stained the gel with a colloidal blue staining kit (Invitrogen). The gel was then scanned to generate a high-resolution (600 dpi) digital image and the relative amount of each protein extract was calculated based on the summed intensity of each lane assessed with ImageJ. A second gel was then ran based on these calculations. Proteins were transferred from the gel to NOVEX nitrocellulose membrane (0.45 μm pore size) (Life Technologies) in 1X NOVEX NuPAGE transfer buffer (Invitrogen) with 10% or 20% methanol for 1 h at 100V. The membranes were blocked in tris-buffered saline-tween 20 (TBS-T) (25 mm Tris, 136 mm NaCl, 3 mm KCl, 0.1% Tween-20, pH 7.4) with 5% non-fat milk, incubated for 1 h at room temperature with primary antibodies and for 1 h with horseradish peroxidase-conjugated anti-mouse or anti-rabbit secondary antibodies Bio-Rad (Hercules, CA). Washes (3 times, 10 min each in TBS-T) were done after primary and secondary antibody incubations. Peroxidase activity was revealed with either SuperSignal West Pico chemiluminescent substrate or SuperSignal Femto Maximum Sensitivity substrate (Thermo Scientific) and visualized on a XRS+ Chemidoc (Biorad) driven by Image Lab Software v.5.2.1 (Biorad). Multiple digital images with increasing exposure times were generated for each blot. Protein band quantitation was performed with the Image Lab Software on images without pixel saturation for the bands of interest.
The immunoblot shown in Figure 6A was generated at the University of Minnesota. Briefly, gastrocnemius muscles from mice of the indicated genotypes were processed as described in the previous section but were resuspended in 1% SDS in PBS with protease inhibitors (100 nM aprotinin, 1 mm benzamidine, 10 μM E-64, 10 μM leupeptin, 1 mm pepstatin A, 1 mm phenylmethanesulfonylfluoride, 1 μM calpain inhibitor I and 1 μM calpeptin). Samples were then incubated at room temperature with end-over-end rotation for 30 min, followed by centrifugation at 14 000 rpm for 10 min to clear lysates of insoluble material. Total protein concentration of the lysates was determined by A280 measurement (NanoDrop 1000, Thermo Fisher Scientific). Lysates were then diluted to equal concentrations before Laemmli sample buffer was added and boiled for 5 min. Equal amounts of protein were then separated by SDS-PAGE, transferred to polyvinylidene difluoride membranes, blocked with 5% milk in PBS and incubated with the indicated primary antibodies overnight at 4°C. The next day, membranes were washed (four times, 5 min each in 0.1% Tween in PBS) before incubation with DyLight secondary antibodies for 1 h at room temperature. Membranes were again washed as above before being imaged with an Odyssey Infrared Scanner LICOR Biosciences (Lincoln, NE). Protein bands were then quantified using LI-COR Image Studio software.
RNA-seq
FDB: Muscles from 2- or 5-month-old WT and mdx mice were dropped into RNAlater (Ambion), cleaned of identifiable non-muscle components (fat, blood vessels, tendons) and cut into small fragments under a dissection microscope. Muscle pieces were transferred to 2 ml tubes containing 1.4 mm ceramic beads (VWR, Radnor, PA) and 1 ml Trizol (Invitrogen). Samples were pulverized in a Precellys 24 Bertin Technologies (Rockville, MD) in 2 runs at 6000 rpm for 15 s each. Chloroform (0.2ml) was added to each. The tubes were spun for 15 min in a cooled Eppendorf tabletop centrifuge and the RNA was extracted from the upper aqueous phase with a PureLink RNA Mini Kit. Residual DNA was removed by treatment with PureLink DNase (Invitrogen–Thermo–Fisher, Carlsbad, CA). RNA was quantitated and rated in an Agilent 2100 bioanalyzer (Agilent Technologies (Santa Clara, CA), Waldbronn, Germany) and mRNA from samples with a RNA integrity number (RIN) >8.5 was then isolated, fragmented and primed with NEBNext Oligo d(T)25 beads. Finally, cDNA was prepared in a thermal cycler and purified with Agencourt AMPure XP Beads Beckman Coulter (Atlanta, GA). Libraries were sequenced on Illumina Hiseq 2500 in the NIAMS Sequencing Facility and the results were then interpreted in the NIAMS Biodata and Discovery Section. Casava 1.8.2 was used to demultiplex and convert Illumina’s BCL format to FastQ format. FastQ reads were mapped to mm10 build using Tophat 2.1.0. Partek GS 6.6 was used to generate an RPKM (Reads per Kilobase Million) table. This work utilized the computational resources of the NIH HPC Biowulf cluster (http://hpc.nih.gov).
CTX-injected TA: RNA-seq was performed as previously described (58). Briefly, RNA was prepared from mouse muscle using a standard TRIzol protocol. Paired-end libraries were prepared using NeoPrep™ system according to the TruSeq™ Stranded mRNA Library Prep protocol in an Illumina HiSeq 2500 or 3000 machine. Reads were aligned using the STAR v.2.5 (59). Gene expression levels were quantified using StringTie 1.3.3 (60).
Statistics
All experiments were performed with at least n = 3 animals, unless otherwise specified. Statistical analysis was done either in Excel Microsoft (Redmond, WA) or in Prism 7 GraphPad (San Diego, CA) software, unless differently specified. For the comparison of two groups, the unpaired two-tailed Student’s t-test was used. The one-way ordinary analysis of variance (ANOVA) test was used for the comparison of multiple groups. Data in the graphs are presented as mean ± SD and P-values are shown. For muscle injury experiments, the different gene categories were compared using the one-way ANOVA using the log2(FPKM+1) as the expression level measurement. Tukey’s post-hoc method was used to perform the multiple comparisons among groups. Categories with non-overlapping 95% confidence intervals were considered as statistically different. Expression level graphs were plotted using Python 3.5 using the packages Seaborn, Numpy and Pandas. Spearman rho was used to quantify the correlation between genes of interest. In all experiments, P-values <0.05 were considered significant.
Supplementary Material
Acknowledgements
We are grateful to Gustavo Gutierrez-Cruz (Laboratory of Muscle Stem Cells and Gene Regulation, NIAMS) for RNA sequencing, to Hong-Wei Sun and Stephen Brooks (Biodata Mining and Discovery Section, NIAMS) for analysis of the results, to Robert Fariss (Imaging Core, National Eye Institute) for sharing equipment and to Antony Frankfurter and Anutosh Ganguly (University of Calgary, Canada) for sharing the original anti-tubb6 antibody. We also acknowledge the personnel of the NIAMS Animal Care Facility. E.R. thanks Sarah Oddoux (Pictoreka, France) for first mentioning the β-tubulins.
Conflict of Interest statement. None declared.
Funding
National Institute of Arthritis and Musculoskeletal and Skin Diseases (RO1 AR042423 to J.M.E.); National Institute on Aging (NIA) (T32 AG029796 to J.T.O.); Intramural Research Program of NIAMS (to E.R. and A.L.M.); Intramural Research Program of National Institute of Child Health and Human Development (to D.S.).
References
- 1. Oddoux S., Zaal K.J., Tate V., Kenea A., Nandkeolyar S.A., Reid E., Liu W. and Ralston E. (2013) Microtubules that form the stationary lattice of muscle fibers are dynamic and nucleated at Golgi elements. J. Cell Biol., 203, 205–213. [DOI] [PMC free article] [PubMed] [Google Scholar]
- 2. Ralston E., Ploug T., Kalhovde J. and Lømo T. (2001) Golgi complex, endoplasmic reticulum exit sites, and microtubules in skeletal muscle fibers are organized by patterned activity. J. Neurosci., 21, 875–883. [DOI] [PMC free article] [PubMed] [Google Scholar]
- 3. Ralston E., Lu Z. and Ploug T. (1999) The organization of the Golgi complex and microtubules in skeletal muscle is fiber type-dependent. J. Neurosci., 19, 10694–10705. [DOI] [PMC free article] [PubMed] [Google Scholar]
- 4. Khairallah R.J., Shi G., Sbrana F., Prosser B.L., Borroto C., Mazaitis M.J., Hoffman E.P., Mahurkar A., Sachs F., Sun Y. et al. (2012) Microtubules underlie dysfunction in Duchenne muscular dystrophy. Sci. Signal., 5, ra56. [DOI] [PMC free article] [PubMed] [Google Scholar]
- 5. Hoffman E.P., Brown R.H. Jr. and Kunkel L.M. (1987) Dystrophin: the protein product of the Duchenne muscular dystrophy locus. Cell, 51, 919–928. [DOI] [PubMed] [Google Scholar]
- 6. Bulfield G., Siller W.G., Wight P.A. and Moore K.J. (1984) X chromosome-linked muscular dystrophy (mdx) in the mouse. Proc. Natl. Acad. Sci. U. S. A., 81, 1189–1192. [DOI] [PMC free article] [PubMed] [Google Scholar]
- 7. Percival J.M., Gregorevic P., Odom G.L., Banks G.B., Chamberlain J.S. and Froehner S.C. (2007) rAAV6-microdystrophin rescues aberrant Golgi complex organization in mdx skeletal muscles. Traffic, 8, 1424–1439. [DOI] [PubMed] [Google Scholar]
- 8. Prins K.W., Humston J.L., Mehta A., Tate V., Ralston E. and Ervasti J.M. (2009) Dystrophin is a microtubule-associated protein. J. Cell Biol., 186, 363–369. [DOI] [PMC free article] [PubMed] [Google Scholar]
- 9. Belanto J.J., Mader T.L., Eckhoff M.D., Strandjord D.M., Banks G.B., Gardner M.K., Lowe D.A. and Ervasti J.M. (2014) Microtubule binding distinguishes dystrophin from utrophin. Proc. Natl. Acad. Sci. U. S. A., 111, 5723–5728. [DOI] [PMC free article] [PubMed] [Google Scholar]
- 10. Belanto J.J., Olthoff J.T., Mader T.L., Chamberlain C.M., Nelson D.M., McCourt P.M., Talsness D.M., Gundersen G.G., Lowe D.A. and Ervasti J.M. (2016) Independent variability of microtubule perturbations associated with dystrophinopathy. Hum. Mol. Genet., 25, 4951–4961. [DOI] [PMC free article] [PubMed] [Google Scholar]
- 11. McCourt J.L., Talsness D.M., Lindsay A., Arpke R.W.,Chatterton P.D., Nelson D.M., Chamberlain C.M., Olthoff J.T., Belanto J.J., McCourt P.M. et al. (2018) Mouse models of two missense mutations in actin-binding domain 1 of dystrophin associated with Duchenne or Becker muscular dystrophy. Hum. Mol. Genet., 27, 451–462. [DOI] [PMC free article] [PubMed] [Google Scholar]
- 12. Nelson D.M., Lindsay A., Judge L.M., Duan D., Chamberlain J.S., Lowe D.A. and Ervasti J.M. (2018) Variable rescue of microtubule and physiological phenotypes in mdx muscle expressing different miniaturized dystrophins. Hum. Mol. Genet., 27, 2090–2100. [DOI] [PMC free article] [PubMed] [Google Scholar]
- 13. Durbeej M., Cohn R.D., Hrstka R.F., Moore S.A., Allamand V., Davidson B.L., Williamson R.A. and Campbell K.P. (2000) Disruption of the beta-sarcoglycan gene reveals pathogenetic complexity of limb-girdle muscular dystrophy type 2E. Mol. Cell, 5, 141–151. [DOI] [PubMed] [Google Scholar]
- 14. Ludueña R.F. and Banerjee A. (2008) In Fojo T. (ed), The Isotypes of Tubulin In The Role of Microtubules in Cell Biology, Neurobiology, and Oncology. Humana Press, Totowa, NJ, pp. 123–175. [Google Scholar]
- 15. Gundersen G.G., Kalnoski M.H. and Bulinski J.C. (1984) Distinct populations of microtubules: tyrosinated and nontyrosinated alpha tubulin are distributed differently in vivo. Cell, 38, 779–789. [DOI] [PubMed] [Google Scholar]
- 16. Edde B., Rossier J., Le Caer J.P., Desbruyeres E., Gros F. and Denoulet P. (1990) Posttranslational glutamylation of alpha-tubulin. Science, 247, 83–85. [DOI] [PubMed] [Google Scholar]
- 17. Redeker V., Levilliers N., Schmitter J.M., Le Caer J.P., Rossier J., Adoutte A. and Bre M.H. (1994) Polyglycylation of tubulin: a posttranslational modification in axonemal microtubules. Science, 266, 1688–1691. [DOI] [PubMed] [Google Scholar]
- 18. Gundersen G.G., Khawaja S. and Bulinski J.C. (1989) Generation of a stable, posttranslationally modified microtubule array is an early event in myogenic differentiation. J. Cell Biol., 109, 2275–2288. [DOI] [PMC free article] [PubMed] [Google Scholar]
- 19. Kerr J.P., Robison P., Shi G., Bogush A.I., Kempema A.M., Hexum J.K., Becerra N., Harki D.A., Martin S.S., Raiteri R. et al. (2015) Detyrosinated microtubules modulate mechanotransduction in heart and skeletal muscle. Nat. Commun., 6, 8526. [DOI] [PMC free article] [PubMed] [Google Scholar]
- 20. Loehr J.A., Wang S., Cully T.R., Pal R., Larina I.V., Larin K.V. and Rodney G.G. (2018) NADPH oxidase mediates microtubule alterations and diaphragm dysfunction in dystrophic mice. eLife, 7, 1–0.e31732. [DOI] [PMC free article] [PubMed] [Google Scholar]
- 21. Lewis S.A., Gu W. and Cowan N.J. (1987) Free intermingling of mammalian beta-tubulin isotypes among functionally distinct microtubules. Cell, 49, 539–548. [DOI] [PubMed] [Google Scholar]
- 22. Pescatori M., Broccolini A., Minetti C., Bertini E., Bruno C., D'Amico A., Bernardini C., Mirabella M., Silvestri G., Giglio V. et al. (2007) Gene expression profiling in the early phases of DMD: a constant molecular signature characterizes DMD muscle from early postnatal life throughout disease progression. FASEB J., 21, 1210–1226. [DOI] [PubMed] [Google Scholar]
- 23. An H.B., Zheng H.C., Zhang L., Ma L. and Liu Z.Y. (2013) Partial least squares based identification of Duchenne muscular dystrophy specific genes. J. Zhejiang Univ. Sci. B, 14, 973–982. [DOI] [PMC free article] [PubMed] [Google Scholar]
- 24. Marotta M., Ruiz-Roig C., Sarria Y., Peiro J.L., Nunez F., Ceron J., Munell F. and Roig-Quilis M. (2009) Muscle genome-wide expression profiling during disease evolution in mdx mice. Physiol. Genomics, 37, 119–132. [DOI] [PubMed] [Google Scholar]
- 25. Roberts T.C., Johansson H.J., McClorey G., Godfrey C., Blomberg K.E., Coursindel T., Gait M.J., Smith C.I., Lehtio J., El Andaloussi S. et al. (2015) Multi-level omics analysis in a murine model of dystrophin loss and therapeutic restoration. Hum. Mol. Genet., 24, 6756–6768. [DOI] [PMC free article] [PubMed] [Google Scholar]
- 26. Bhattacharya R. and Cabral F. (2004) A ubiquitous beta-tubulin disrupts microtubule assembly and inhibits cell proliferation. Mol. Biol Cell., 15, 3123–3131. [DOI] [PMC free article] [PubMed] [Google Scholar]
- 27. Bhattacharya R., Frankfurter A. and Cabral F. (2008) A minor beta-tubulin essential for mammalian cell proliferation. Cell Motil. Cytoskeleton, 65, 708–720. [DOI] [PubMed] [Google Scholar]
- 28. Bhattacharya R., Yang H. and Cabral F. (2011) Class V beta-tubulin alters dynamic instability and stimulates microtubule detachment from centrosomes. Mol. Biol. Cell, 22, 1025–1034. [DOI] [PMC free article] [PubMed] [Google Scholar]
- 29. Bhattacharya R. and Cabral F. (2009) Molecular basis for class V beta-tubulin effects on microtubule assembly and paclitaxel resistance. J. Biol. Chem., 284, 13023–13032. [DOI] [PMC free article] [PubMed] [Google Scholar]
- 30. Chemello F., Bean C., Cancellara P., Laveder P., Reggiani C. and Lanfranchi G. (2011) Microgenomic analysis in skeletal muscle: expression signatures of individual fast and slow myofibers. PLoS One, 6, 1–0.e16807. [DOI] [PMC free article] [PubMed] [Google Scholar]
- 31. Liu W. and Ralston E. (2014) A new directionality tool for assessing microtubule pattern alterations. Cytoskeleton (Hoboken), 71, 230–240. [DOI] [PMC free article] [PubMed] [Google Scholar]
- 32. Robison P., Caporizzo M.A., Ahmadzadeh H., Bogush A.I., Chen C.Y., Margulies K.B., Shenoy V.B. and Prosser B.L. (2016) Detyrosinated microtubules buckle and bear load in contracting cardiomyocytes. Science, 352, aaf0659. [DOI] [PMC free article] [PubMed] [Google Scholar]
- 33. Ikeda T., Ichii O., Otsuka-Kanazawa S., Nakamura T., Elewa Y.H. and Kon Y. (2016) Degenerative and regenerative features of myofibers differ among skeletal muscles in a murine model of muscular dystrophy. J. Muscle Res. Cell Motil., 37, 153–164. [DOI] [PubMed] [Google Scholar]
- 34. Straub V., Rafael J.A., Chamberlain J.S. and Campbell K.P. (1997) Animal models for muscular dystrophy show different patterns of sarcolemmal disruption. J. Cell Biol., 139, 375–385. [DOI] [PMC free article] [PubMed] [Google Scholar]
- 35. Mammen A.L., Casciola-Rosen L.A., Hall J.C., Christopher-Stine L., Corse A.M. and Rosen A. (2009) Expression of the dermatomyositis autoantigen Mi-2 in regenerating muscle. Arthritis Rheum., 60, 3784–3793. [DOI] [PMC free article] [PubMed] [Google Scholar]
- 36. Musarò A. (2014) The basis of muscle regeneration. Adv. Biol., doi: 10.1155/2014/612471. [DOI] [Google Scholar]
- 37. Ayalon G., Davis J.Q., Scotland P.B. and Bennett V. (2008) An ankyrin-based mechanism for functional organization of dystrophin and dystroglycan. Cell, 135, 1189–1200. [DOI] [PubMed] [Google Scholar]
- 38. Lu Z., Joseph D., Bugnard E., Zaal K.J. and Ralston E. (2001) Golgi complex reorganization during muscle differentiation: visualization in living cells and mechanism. Mol. Biol. Cell, 12, 795–808. [DOI] [PMC free article] [PubMed] [Google Scholar]
- 39. Zaal K.J., Reid E., Mousavi K., Zhang T., Mehta A., Bugnard E., Sartorelli V. and Ralston E. (2011) Who needs microtubules? Myogenic reorganization of MTOC, Golgi complex and ER exit sites persists despite lack of normal microtubule tracks. PLoS One, 6, 1–0.e29057. [DOI] [PMC free article] [PubMed] [Google Scholar]
- 40. Tassin A.M., Maro B. and Bornens M. (1985) Fate of microtubule-organizing centers during myogenesis in vitro. J. Cell Biol., 100, 35–46. [DOI] [PMC free article] [PubMed] [Google Scholar]
- 41. Pizon V., Gerbal F., Diaz C.C. and Karsenti E. (2005) Microtubule-dependent transport and organization of sarcomeric myosin during skeletal muscle differentiation. EMBO J., 24, 3781–3792. [DOI] [PMC free article] [PubMed] [Google Scholar]
- 42. Moon Y., Balke J.E., Madorma D., Siegel M.P., Knowels G., Brouckaert P., Buys E.S., Marcinek D.J. and Percival J.M. (2017) Nitric oxide regulates skeletal muscle fatigue, fiber type, microtubule organization, and mitochondrial ATP synthesis efficiency through cGMP-dependent mechanisms. Antioxid. Redox Signal., 26, 966–985. [DOI] [PMC free article] [PubMed] [Google Scholar]
- 43. Webster M.T., Manor U., Lippincott-Schwartz J. and Fan C.M. (2016) Intravital imaging reveals ghost fibers as architectural units guiding myogenic progenitors during regeneration. Cell Stem Cell, 18, 243–252. [DOI] [PMC free article] [PubMed] [Google Scholar]
- 44. Ralston E. (1993) Changes in architecture of the Golgi complex and other subcellular organelles during myogenesis. J. Cell Biol., 120, 399–409. [DOI] [PMC free article] [PubMed] [Google Scholar]
- 45. Percival J.M., Anderson K.N., Huang P., Adams M.E. and Froehner S.C. (2010) Golgi and sarcolemmal neuronal NOS differentially regulate contraction-induced fatigue and vasoconstriction in exercising mouse skeletal muscle. J. Clin. Invest., 120, 816–826. [DOI] [PMC free article] [PubMed] [Google Scholar]
- 46. Randazzo D., Giacomello E., Lorenzini S., Rossi D., Pierantozzi E., Blaauw B., Reggiani C., Lange S., Peter A.K., Chen J. et al. (2013) Obscurin is required for ankyrinB-dependent dystrophin localization and sarcolemma integrity. J. Cell Biol., 200, 523–536. [DOI] [PMC free article] [PubMed] [Google Scholar]
- 47. Yen T.J., Gay D.A., Pachter J.S. and Cleveland D.W. (1988) Autoregulated changes in stability of polyribosome-bound beta-tubulin mRNAs are specified by the first 13 translated nucleotides. Mol. Cell Biol., 8, 1224–1235. [DOI] [PMC free article] [PubMed] [Google Scholar]
- 48. Sisodia S.S., Gay D.A. and Cleveland D.W. (1990) In vivo discrimination among beta-tubulin isotypes: selective degradation of a type IV beta-tubulin isotype following overexpression in cultured animal cells. New Biol., 2, 66–76. [PubMed] [Google Scholar]
- 49. Law B.M., Spain V.A., Leinster V.H., Chia R., Beilina A., Cho H.J., Taymans J.M., Urban M.K., Sancho R.M., Blanca Ramirez M. et al. (2014) A direct interaction between leucine-rich repeat kinase 2 and specific beta-tubulin isoforms regulates tubulin acetylation. J. Biol. Chem., 289, 895–908. [DOI] [PMC free article] [PubMed] [Google Scholar]
- 50. Beggs A.D., James J., Caldwell G., Prout T., Dilworth M.P., Taniere P., Iqbal T., Morton D.G. and Matthews G. (2018) Discovery and validation of methylation biomarkers for ulcerative colitis associated neoplasia. Inflamm. Bowel Dis., 24, 1503–1509. [DOI] [PMC free article] [PubMed] [Google Scholar]
- 51. Salinas R.E., Ogohara C., Thomas M.I., Shukla K.P., Miller S.I. and Ko D.C. (2014) A cellular genome-wide association study reveals human variation in microtubule stability and a role in inflammatory cell death. Mol. Biol. Cell, 25, 76–86. [DOI] [PMC free article] [PubMed] [Google Scholar]
- 52. Tinsley J., Deconinck N., Fisher R., Kahn D., Phelps S., Gillis J.M. and Davies K. (1998) Expression of full-length utrophin prevents muscular dystrophy in mdx mice. Nat. Med., 4, 1441–1444. [DOI] [PubMed] [Google Scholar]
- 53. Crawford G.E., Faulkner J.A., Crosbie R.H., Campbell K.P., Froehner S.C. and Chamberlain J.S. (2000) Assembly of the dystrophin-associated protein complex does not require the dystrophin COOH-terminal domain. J. Cell Biol., 150, 1399–1410. [DOI] [PMC free article] [PubMed] [Google Scholar]
- 54. Nagaraju K., Raben N., Loeffler L., Parker T., Rochon P.J., Lee E., Danning C., Wada R., Thompson C., Bahtiyar G. et al. (2000) Conditional up-regulation of MHC class I in skeletal muscle leads to self-sustaining autoimmune myositis and myositis-specific autoantibodies. Proc. Natl. Acad. Sci. U. S. A., 97, 9209–9214. [DOI] [PMC free article] [PubMed] [Google Scholar]
- 55. DiFranco M., Quinonez M., Capote J. and Vergara J. (2009) DNA transfection of mammalian skeletal muscles using in vivo electroporation. J. Vis. Exp., 32, pii:1520. [DOI] [PMC free article] [PubMed] [Google Scholar]
- 56. Ralston E., Lu Z., Biscocho N., Soumaka E., Mavroidis M., Prats C., Lømo T., Capetanaki Y. and Ploug T. (2006) Blood vessels and desmin control the positioning of nuclei in skeletal muscle fibers. J. Cell Physiol., 209, 874–882. [DOI] [PubMed] [Google Scholar]
- 57. Spano A.J. and Frankfurter A. (2010) Characterization of anti-beta-tubulin antibodies. Methods Cell Biol., 95, 33–46. [DOI] [PubMed] [Google Scholar]
- 58. Amici D.R., Pinal-Fernandez I., Mazala D.A., Lloyd T.E., Corse A.M., Christopher-Stine L., Mammen A.L. and Chin E.R. (2017) Calcium dysregulation, functional calpainopathy, and endoplasmic reticulum stress in sporadic inclusion body myositis. Acta Neuropathol. Commun., 5, 24. [DOI] [PMC free article] [PubMed] [Google Scholar]
- 59. Dobin A., Davis C.A., Schlesinger F., Drenkow J., Zaleski C., Jha S., Batut P., Chaisson M. and Gingeras T.R. (2013) STAR: ultrafast universal RNA-seq aligner. Bioinformatics, 29, 15–21. [DOI] [PMC free article] [PubMed] [Google Scholar]
- 60. Pertea M., Pertea G.M., Antonescu C.M., Chang T.C., Mendell J.T. and Salzberg S.L. (2015) StringTie enables improved reconstruction of a transcriptome from RNA-seq reads. Nat. Biotechnol., 33, 290–295. [DOI] [PMC free article] [PubMed] [Google Scholar]
- 61. Osseni A., Sébastien M., Sarrault O., Baudet M., Couté Y., Fauré J., Fourest-Lieuvin A. and Marty I. (2016) Triadin and CLIMP-63 form a link between triads and microtubules in muscle cells. J. Cell Sci., 129, 3744–3755. [DOI] [PubMed] [Google Scholar]
- 62. Raith M., Valencia R.G., Fischer I., Orthofer M., Penninger J.M., Spuler S., Rezniczek G.A. and Wiche G. (2013) Linking cytoarchitecture to metabolism: sarcolemma-associated plectin affects glucose uptake by destabilizing microtubule networks in mdx myofibers. Skelet. Muscle., 3, 14. [DOI] [PMC free article] [PubMed] [Google Scholar]
- 63. Yang H., Cabral F. and Bhattacharya R. (2009) Tubulin isotype specificity and identification of the epitope for antibody Tub 2.1. Protein Eng. Des. Sel., 22, 625–629. [DOI] [PubMed] [Google Scholar]
- 64. Guiraud S., Edwards B., Squire S.E., Moir L., Berg A., Babbs A., Ramadan N., Wood M.J. and Davies K.E. (2018) Embryonic myosin is a regeneration marker to monitor utrophin based therapies for DMD. Hum. Mol. Genet., 10.1093/hmg/ddy353. [DOI] [PMC free article] [PubMed] [Google Scholar]
Associated Data
This section collects any data citations, data availability statements, or supplementary materials included in this article.