Short abstract
Background
The Multiple Sclerosis Severity Score (MSSS), combining the Expanded Disability Status Scale (EDSS) and disease duration, attempts to stratify multiple sclerosis (MS) patients based on their rate of progression. Its prognostic ability in the individual patient remains unproven.
Objectives
To assess the stability of MSSS within individual persons with MS in a longitudinal cohort, to evaluate whether certain factors influence MSSS variability, and to explore the ability of MSSS to predict future ambulatory function.
Methods
A single-center retrospective review was performed of patients following a single provider for at least 8 years. Mixed model regression modeled MSSS over time. A Kaplan–Meier survival plot was fitted, using change of baseline MSSS by at least one decile as the event. Cox modeling assessed the influence of baseline clinical and demographic factors on the hazard of changing MSSS by at least one decile. Linear models evaluated the impact of baseline EDSS, baseline MSSS, and other factors on the Timed 25-Foot Walk (T25FW).
Results
Out of 122 patients, 68 (55.7%) deviated from baseline MSSS by at least one decile. Final T25FW had slightly weaker correlation to baseline MSSS than to baseline EDSS, which was moderately strongly correlated with future log T25FW.
Conclusion
Individual MSSS scores often vary over time. Clinicians should exercise caution when using MSSS to prognosticate.
Keywords: Outcome measurement, progressive multiple sclerosis, EDSS, MSSS, T25FW
Introduction
Multiple sclerosis (MS) disease severity has long been recognized as heterogeneous, though prognostic uncertainty does little to comfort the newly diagnosed patient concerned about developing long-term disability. This heterogeneity may reflect variability in the underlying genetics,1 pathophysiology,2 neuroanatomical pathways affected,3 and medication response, among other factors, and is not fully accounted for by the currently used phenotypic descriptors.4 Progression on the Expanded Disability Status Scale (EDSS), the most widely used measure of MS-related disability, is not linear, nor does use of the EDSS enable distinction between those who have accumulated disability quickly and those who have done so over decades, rendering it a poor marker of severity, particularly in early disease. The Multiple Sclerosis Severity Score (MSSS), combining the EDSS and disease duration, emerged over a decade ago as a way of stratifying MS patients based on their rate of progression.5 It was derived using a probabilistic approach in which scores were calculated based on the distribution of disability scores (EDSS) within groups of MS patients of similar disease duration. It was intended to be used to describe a population of MS patients—patients with low MSSSs tended to progress at slower rates than those with higher MSSSs—and assumes that a patient’s MSSS decile will remain a stable indicator of their clinical trajectory. The MSSS has been used in numerous MS studies,6–11 though as a prognostic tool in the individual patient, its utility remains unproven.12
To formulate the MSSS, Roxburgh et al. collected information on 9892 patients in 11 countries, with a small minority of those having multiple recorded MSSSs.5 They reported a good correlation within individual MSSS ratings with up to 17 years of longitudinal assessments, excluding assessments made at year 0, which they found correlated weakly. Pachner and Steiner retrospectively tabulated the MSSS in 195 patients and randomly selected 10 to measure MSSS stability over time.12 They found nine of 10 had a stable MSSS, with an average range of 11.3 (scaled over 100), while one patient improved from 99 to 55.
Our objective was to assess the ability of the MSSS to predict disease course in individual patients followed longitudinally at a single academic MS center. First, we aimed to characterize the extent to which the MSSS remained stable or varied over time in this cohort of MS patients. We then evaluated whether certain clinical and demographic factors influenced the deviation from a patient’s expected disease trajectory as indicated by their MSSS. Finally, we aimed to determine whether baseline MSSS correlated with a non-EDSS-based longitudinal endpoint, the Timed 25-Foot Walk (T25FW), a part of the Multiple Sclerosis Functional Composite.13 The T25FW is used in clinical trials and in practice to assess walking impairment; worsening is closely tied to disease progression.14
Methods
This study was approved by Mount Sinai’s Program for Protection of Human Subjects. We performed a single-center retrospective chart review, including all patients with a diagnosis of MS and available records following with a single provider (AEM) for at least 8 years. Details regarding this longitudinal cohort have been previously published.15 The first patient visit occurred on May 17, 1984, and the final visit took place on April 2, 2009. Demographic and clinical data such as race, gender, age at disease onset, age at diagnosis, date of initial attack, type of initial attack (motor, sensory, brainstem, etc.), length of follow-up, and EDSS scores were retrieved from the medical record. MSSS was generated based on EDSS and time from initial neurological symptoms and divided into deciles. Patients who stayed within one decile of their initial MSSS were deemed to have followed their expected disease trajectory. Those whose final MSSS decile exceeded this boundary were considered worse than expected, and those whose final MSSS decile was below this boundary were considered better than expected.
Statistical analysis
Summary statistics of MSSS were calculated by years of follow-up. For many analyses where time was treated as a categorical variable, continuous outcomes were averaged within a year, and weights were used to account for multiple measurements within a year. Mixed model regression was performed with MSSS as the dependent variable, treating time both as a categorical variable as well as a continuous variable and fitting a linear trend. A Kaplan–Meier survival plot was fitted, using change of baseline MSSS by at least one decile as the event. Cox modeling was then used to determine the influence of baseline clinical and demographic factors (gender, type of first relapse, recovery from first relapse, age at onset, disease duration) on the hazard of changing MSSS by at least one decile.
In order to examine the relationship between either EDSS or MSSS and another independent endpoint of clinical importance—the T25FW—univariate linear regressions were performed with T25FW at 8, 10, and 12 years of follow-up, respectively, as the dependent variables, and baseline EDSS or MSSS as the independent variable. Due to the non-uniformity of follow-up times, values for T25FW were drawn from the closest visit taking place at ±1 year from each of these time points. Given the skewedness of the T25FW data, log transformations were used. A multivariate linear model was fitted to determine the impact of these and other variables (gender, type of first relapse, recovery from first relapse, age at onset, duration of follow-up) on T25FW at 8, 10, or 12 years. Data were analyzed on an available case basis. Statistics were performed with SAS 9.4 and StataMP 13.
Results
123 patients were included in the study. 72.4% (N = 89) were women, and 92.7% (N = 114) were Caucasian. Mean age at MS onset was 30.8 years (SD 8.9, range 10–58). Mean EDSS was 2.8 (SD 2.1); median EDSS was 2 (interquartile range (IQR) 1–3.5). If MSSS was not available (e.g., was not calculable) on the initial visit, the MSSS from the second visit was used (n = 19). Patients were followed for a mean duration of 11.8 years (SD 3.8, range 8–25).
Modeling MSSS
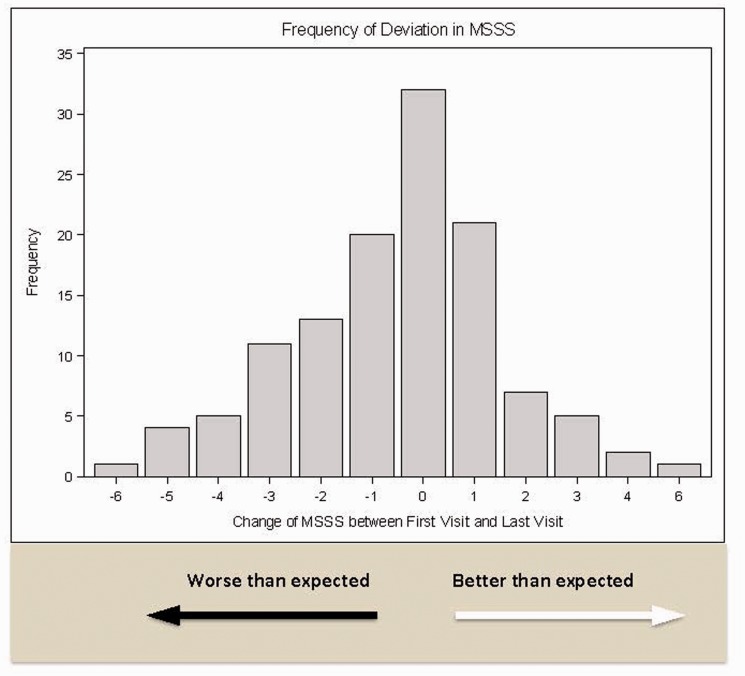
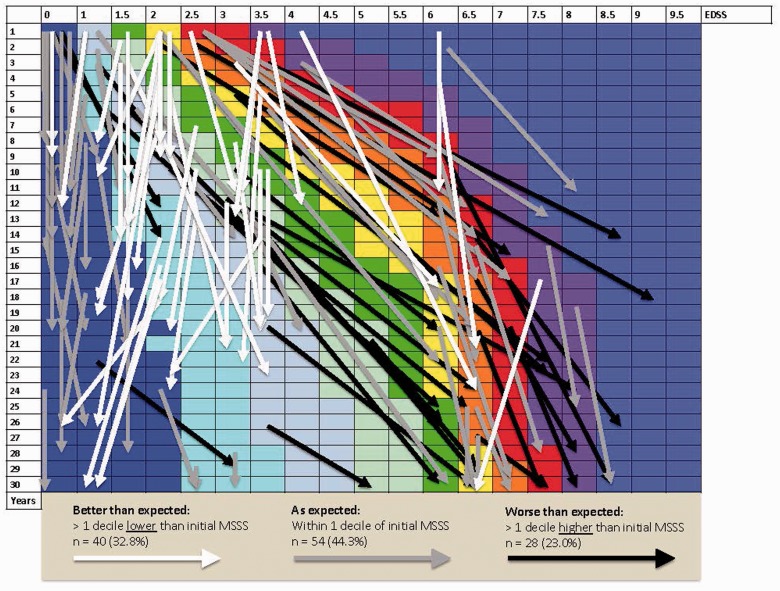
Of 122 patients with sufficient information, mean baseline MSSS was 3.93 (SD 2.79); median MSSS was 3.55 (IQR 1.28–6.26, range 0.04–9.74). By the end of follow-up, considering those with fluctuations of up to one decile to be “as expected,” 28 patients (23.0%) were worse than expected, 54 (44.3%) were as expected, and 40 (32.8%) were better than expected according to MSSS decile (Figures 1 and 2).
Figure 1.
Magnitude and frequency of changes in MSSS from the initial visit to the last visit.
Figure 2.
Individual patient outcomes: dispersion from projected deciles across disease severity. Arrows indicate individual patients during period of observation. The starting and ending points of the arrows demarcate the beginning and end of each follow-up period. Longer arrows correspond to longer duration of follow-up.
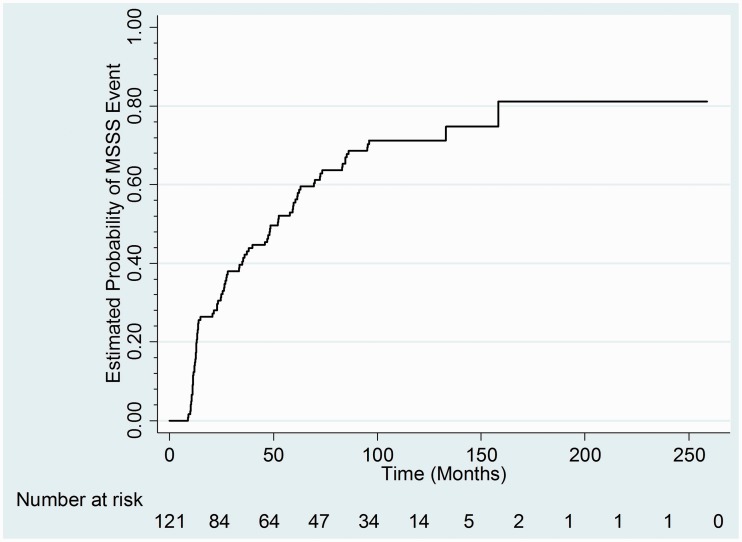
According to the survival analysis, an even larger number, n = 89 (72.9%), broke from their original MSSS at some point during follow-up, with a median of 52 months (95% confidence interval (CI) 35.4–62.7), noting that some then returned to their original decile by the end of follow-up. Of the clinical and demographic variables tested in the Cox model, only baseline disease duration had a statistically significant effect on the risk of changing MSSS by one decile, with a HR of 0.96 (95% CI 0.94–0.99, p = 0.0062; Figure 3). Every year increase in baseline disease duration made it 4% less likely that a patient’s MSSS would change by a decile or more.
Figure 3.
Kaplan–Meier plot of probability of baseline MSSS changing by at least one decile.
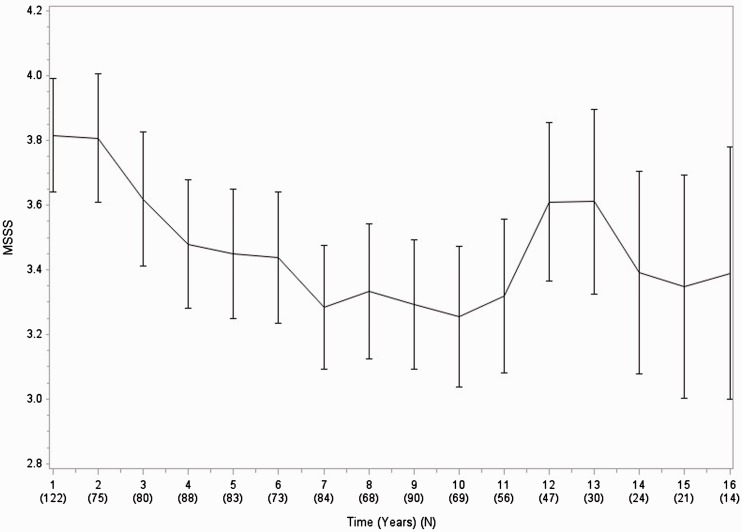
The mean MSSS fluctuated over the length of the follow-up, from baseline 3.93 (SD 2.8), to a minimum of 3.39 (SD 3.1) during the seventh year of follow-up, to a maximum of 5.65 (SD 2.8) during the 19th year of follow-up. The categorical mixed model had an F statistic of 1.59 (p = 0.07) (Figure 4 and Supplementary appendix). Estimated MSSS change from baseline to year 15 was −0.29 (p = 0.45). When focusing just on the change from baseline to 8 years of follow-up, the model showed an estimated decrease in MSSS by 0.54 (p = 0.02), while from 8 to 15 years of follow-up there was an estimated increase by 0.25 (p = 0.43) (see appendix). The overall F test for a time effect was marginally non-significant (F statistic = 2.90, p = 0.0634). The linear mixed model estimated a 1 year change of MSSS to be 0.047 (p = 0.005) (see appendix).
Figure 4.
Mean MSSS over time.
Predicting walking speed
Mean T25FW time was 8.4 s (SD 8.1) at 8 years (n = 83 patients), 7.7 s (SD 5.7) at 10 years (n = 66), and 8.2 s (SD 6.9) at 12 years (n = 38) (Table 1).
Table 1.
Patient demographic and clinical variables.
| Study participants (n = 123) | |
|---|---|
| Gender | Female: 72.4% (n = 89) |
| Race | Caucasian: 92.7% (n = 114) |
| African-American: 4.1% (n = 5) | |
| Hispanic: 3.3% (n = 4) | |
| Age at onset | Mean: 30.8 years (SD 8.9, range 10–58) |
| Disease duration at first visit | Mean: 9.1 years (SD 8.5, range 1–33) |
| Type of first relapse (can be more than one) | Brainstem: 22.8% (n = 28) |
| Pyramidal: 20.3% (n = 25) | |
| Cerebellar: 4.1% (n = 5) | |
| Visual: 17.1% (n = 21) | |
| Sensory: 52.0% (n = 64) | |
| Bowel/bladder: 1.6% (n = 2) | |
| Cerebral: 0% (n = 0) | |
| Recovery from first relapse | Yes: 67.0% (n = 73) |
| No: 33.0% (n = 36) | |
| Baseline EDSS | Mean 2.8 (SD 2.1, range 0–8) |
| Median 2.0 (IQR 1–3.5) | |
| Baseline MSSS | Mean 3.93 (SD 2.79, range 0.04–9.74) (n = 122) |
| Median 3.55 (IQR 1.28–6.26) | |
| Duration of follow-up | Mean: 11.8 years, SD = 3.8 (range 8–25) |
| 8 year T25FW (seconds) | Mean: 8.4 (SD 8.1) (n = 83) |
| 10 year T25FW (seconds) | Mean: 7.7 (SD 5.7) (n = 66) |
| 12 year T25FW (seconds) | Mean: 8.2 (SD 6.9) (n = 38) |
In univariate linear models with baseline MSSS as the predictor variable and log-transformed 8-, 10-, and 12-year T25FW as the dependent variable, baseline MSSS had Spearman correlation coefficients of 0.48, 0.49, and 0.61, respectively (Table 2). One point increase in baseline MSSS increased the respective 8-, 10-, and 12-year T25FW times by an estimated 12% (7–17%), 10% (5–15%), and 13% (7–19%). In univariate linear models with baseline EDSS as the predictor variable and log-transformed 8-, 10-, and 12-year T25FW as the dependent variable, baseline EDSS had Spearman correlation coefficients of 0.61, 0.53, and 0.57, respectively. One point increase in baseline EDSS increased the respective 8-, 10-, and 12-year T25FW times by 22% (15–30%), 15% (8–23%), and 27% (16–39%).
Table 2.
Results of unadjusted linear regression of baseline MSSS or EDSS at 8-, 10-, and 12-year T25FW. Parameter estimates, 95% CI, p values, and estimated risk ratio of increased T25FW.
| Beta coefficient (95% CI) | p value | Ratio estimate (95% CI) | |
|---|---|---|---|
| MSSS | |||
| 8-year T25FW | 0.11 (0.07–0.16) | <0.0001 | 1.12 (1.07–1.17) |
| 10-year T25FW | 0.09 (0.05–0.14) | 0.0001 | 1.10 (1.05–1.15) |
| 12-year T25FW | 0.12 (0.06–0.17) | 0.0001 | 1.13 (1.07–1.19) |
| EDSS | |||
| 8-year T25FW | 0.20 (0.14–0.26) | <0.0001 | 1.22 (1.15–1.30) |
| 10-year T25FW | 0.14 (0.08–0.21) | <0.0001 | 1.15 (1.08–1.23) |
| 12-year T25FW | 0.24 (0.15–0.33) | <0.0001 | 1.27 (1.16–1.39) |
In multivariate regressions of log T25FW using baseline MSSS as the predictor, disease duration also had a statistically significant correlation with log T25FW at 8 years (beta 0.02, p = 0.01) and 10 years (beta 0.02, p = 0.02) and was of borderline significance at 12 years (beta 0.02, p = 0.06); recovery from first relapse was statistically significant only at 10 years (beta −0.32, p = 0.03). In the multivariate regressions using baseline EDSS as the predictor variable, no other covariates had statistically significant correlation with T25FW (see appendix).
Discussion
In our retrospective study, we evaluated the extent to which the MSSS remains stable over time, the influence of clinical and demographic variables on MSSS variability, and the ability of baseline MSSS to predict future walking impairment as measured by the T25FW. We found that over time, the group’s mean MSSS first decreased mildly, then increased over the duration of follow-up. We note that varying lengths of follow-up and the intrinsic features of the MSSS (which cannot be determined beyond 30 years) limited our ability to interpret trends toward the end of the period of observation. On an individual level, patients could show considerable changes in their MSSS over time, and the majority of patients did not remain within one decile of their original MSSS. We found that MSSS in individual patients varied up or down by up to 6 deciles. Thus, relying on an initial MSSS to prognosticate on the individual patient level can be misleading in both a favorable and unfavorable direction.
We did not find the inclusion of gender, age at onset, type of first relapse, or recovery from first relapse to significantly impact the likelihood of a person’s MSSS changing by at least one decile. Only disease duration showed a mild effect on the probability of this event; longer disease duration made it slightly less likely that a person’s MSSS would change. This result is intuitive, as the MSSS has more potential for variability in the early years than later on in the disease course, and probably reflects two sources of error—true duration of disease and EDSS—in the calculation of MSSS. Disease duration is not entirely objective, since it is inherently difficult for physicians to establish precisely when first onset of MS symptoms occurred. Our finding that longer disease duration reduces the likelihood of MSSS change supports this notion, as the impact of inaccuracy in estimated disease duration early in disease course would be expected to diminish after years or decades of disease.
When we further evaluated the ability of baseline MSSS or EDSS to prognosticate ambulatory ability, using an endpoint—T25FW—that is not directly measured in either, we found that using baseline MSSS does not increase the ability to predict eventual walking impairment over baseline EDSS, which has a moderately strong correlation with future log T25FW.
Previous longitudinal studies have shown that some types of initial attack,16–18 and complete recovery from initial attack,19 are associated with better outcomes. In our cohort, there was no significant additional information obtained by adding the type of initial attack, recovery from initial attack, age, duration of disease, or gender to baseline EDSS when looking at long-term ambulatory function. Baseline EDSS alone was as good as any of these factors alone or in combination at predicting ultimate walking speed, though we could have been limited by our relatively small sample size. As the visits from which our data were extracted took place prior to the approval of dalfampridine,20 use of this symptomatic agent did not impact our analyses.
Our study has several limitations. This was a single-center, retrospective study, and as such may not be reflective of the broader MS population. We could not control for the use of disease-modifying therapies, as this was highly variable and would have diluted our statistical power. Currently available highly efficacious therapies were generally not used. Baseline T25FW was not routinely collected at initial visits over a decade ago, though inclusion of these data would have made the study’s findings more robust. Higher EDSS, which heavily weights walking ability, was associated with impairment on T25FW measured years later in our cohort but might not have had the same degree of correlation with other measures of disability that were not rigorously assessed, such as upper extremity function or cognition. Finally, patients with greater degrees of disability may have been underrepresented at later time points, either by being less likely to have long-term follow-up (though average MSSS actually rose over time), or by no longer being ambulatory and therefore unable to complete the T25FW.
In summary, we found that MSSS does not remain constant over time in a longitudinal cohort of MS patients, and on an individual level, scores may vary significantly from expected disease trajectory. The tool has been available for more than a decade and is being taught extensively as a way to characterize disease severity, though in our cohort, baseline MSSS was not more powerful at predicting eventual walking speed than baseline EDSS, even taking into account other clinical factors. These results suggest caution in the use of the MSSS on an individual patient basis to guide estimations of prognosis and related treatment decisions. A larger and more diverse prospective study is warranted to replicate these findings. New models of disease course that more precisely individuate clinical trajectory, together with prospective studies incorporating magnetic resonance imaging metrics and other biomarkers, are needed to improve our ability to prognosticate in MS.
Supplemental Material
Supplemental Material for The Multiple Sclerosis Severity Score: fluctuations and prognostic ability in a longitudinal cohort of patients with MS by RH Gross, SH Sillau, AE Miller, C Farrell and SC Krieger in Multiple Sclerosis Journal—Experimental, Translational and Clinical
Conflict of Interests
The author(s) declared the following potential conflicts of interest with respect to the research, authorship, and/or publication of this article: AEM has received research support from Biogen Idec, Genzyme/Sanofi, Mallinckrodt, Novartis, Roche/Genentech, and MedDay; has consulted for Accordant Health Services (Caremark), Adamas, Biogen Idec, Celgene, Corrona, EMD Serono, Genzyme/Sanofi, Mallinckrodt, Mapi-Pharma, Novartis, and Roche/Genentech; and has served on speakers’ bureaus for Biogen Idec, Genentech/Roche, and EMD Serono. SCK reports consulting or advisory work with Acorda, Bayer, Biogen, Celgene, EMD Serono, Genentech, Genzyme, Mallinckrodt, MedDay, Novartis, Teva, and TG Therapeutics, and non-promotional speaking with Biogen. RHG, SHS, and CF have nothing to disclose.
Funding
The author(s) received no financial support for the research, authorship, and/or publication of this article.
Supplemental Material
Supplemental material for this article is available online.
References
- 1.Mowry EM, Carey RF, Blasco MR, et al. Multiple sclerosis susceptibility genes: associations with relapse severity and recovery. PLoS One 2013; 8: e75416. [DOI] [PMC free article] [PubMed] [Google Scholar]
- 2.Lucchinetti C, Bruck W, Parisi J, et al. Heterogeneity of multiple sclerosis lesions: implications for the pathogenesis of demyelination. Ann Neurol 2000, 47: 707–717. [DOI] [PubMed] [Google Scholar]
- 3.Confavreux C, Vukusic S. T. he clinical course of multiple sclerosis. Handb Clin Neurol 2014; 122: 349–353. [DOI] [PubMed] [Google Scholar]
- 4.Lublin FD, Reingold SC, Cohen JA, et al. Defining the clinical course of multiple sclerosis: the 2013 revisions. Neurology 2014; 83: 278–286. [DOI] [PMC free article] [PubMed] [Google Scholar]
- 5.Roxburgh R, Seaman SR, Masterman T, et al. Multiple Sclerosis Severity Score: using disability and disease duration to rate disease severity. Neurology 2005; 64: 1144–1151. [DOI] [PubMed] [Google Scholar]
- 6.Baranzini SE, Wang J, Gibson RA, et al. Genome-wide association analysis of susceptibility and clinical phenotypes in multiple sclerosis. Hum Mol Genet 2009; 18: 767–778. [DOI] [PMC free article] [PubMed] [Google Scholar]
- 7.Byun E, Caillier SJ, Montalban X, et al. Genome-wide pharmacogenomic analysis of the response to interferon beta therapy in multiple sclerosis. Arch Neurol 2008; 65: 337–344. [DOI] [PubMed] [Google Scholar]
- 8.Healy BC, Ali EN, Guttmann CR, et al. Smoking and disease progression in multiple sclerosis. Arch Neurol 2009; 66: 858–864. [DOI] [PMC free article] [PubMed] [Google Scholar]
- 9.Bramow S, Frischer JM, Lassmann H, et al. Demyelination versus remyelination in progressive multiple sclerosis. Brain 2010; 133: 2983–2998. [DOI] [PubMed] [Google Scholar]
- 10.Popescu V, Agosta F, Hulst HE, et al. Brain atrophy and lesion load predict long term disability in multiple sclerosis. J Neurol Neurosurg Psychiatry 2013; 84: 1082–1091. [DOI] [PubMed] [Google Scholar]
- 11.Gelfand JN, Nolan R, Schwartz DM, et al. Microcystic macular oedema in multiple sclerosis is associated with disease severity . Brain 2012; 135: 1786–1793. [DOI] [PMC free article] [PubMed] [Google Scholar]
- 12.Pachner AR, Steiner I. The Multiple Sclerosis Severity Score (MSSS) predicts disease severity over time. J Neurol Sci 2009; 278: 66–70. [DOI] [PubMed] [Google Scholar]
- 13.Cutter GR, Baier ML, Rudick RA. Development of a multiple sclerosis functional composite as a clinical trial outcome measure. Brain 1999; 122: 871–882. [DOI] [PubMed] [Google Scholar]
- 14.Kragt JJ, van der Linden FAH, Nielsen JM, et al. Clinical impact of 20% worsening on Timed 25-foot Walk and 9-hole Peg Test in multiple sclerosis. Mult Scler 2006; 12: 594–598. [DOI] [PubMed] [Google Scholar]
- 15.Katz Sand I, Krieger SC, Farrell C, et al. Diagnostic uncertainty during the transition to secondary progressive multiple sclerosis. Mult Scler 2014; 20: 1654–1657. [DOI] [PubMed] [Google Scholar]
- 16.Confavreux C, Vukusic S and, Adeleine P. Early clinical predictors and progression of irreversible disability in multiple sclerosis: an amnesic process. Brain 2003; 126: 770–782. [DOI] [PubMed] [Google Scholar]
- 17.Nilsson P, Larsson E-M, Maly-Sundgren P, et al. Predicting the outcome of optic neuritis. J Neurol 2005; 252: 396–402. [DOI] [PubMed] [Google Scholar]
- 18.Eriksson M, Andersen O and, Runmarker B. Long-term follow-up of patients with clinically isolated syndromes, relapsing-remitting and secondary progressive multiple sclerosis. Mult Scler 2003; 9: 260–274. [DOI] [PubMed] [Google Scholar]
- 19.Novotna M, Soldán MMP, Zeid NA, et al. Poor early relapse recovery affects onset of progressive disease course in multiple sclerosis. Neurology 2015; 85: 722–729. [DOI] [PMC free article] [PubMed] [Google Scholar]
- 20.Goodman AD, Brown TR, Cohen JA, et al. Sustained-release oral fampridine in multiple sclerosis: a randomized, double-blind, controlled trial. Lancet 2009; 373: 732–738. [DOI] [PubMed] [Google Scholar]
Associated Data
This section collects any data citations, data availability statements, or supplementary materials included in this article.
Supplementary Materials
Supplemental Material for The Multiple Sclerosis Severity Score: fluctuations and prognostic ability in a longitudinal cohort of patients with MS by RH Gross, SH Sillau, AE Miller, C Farrell and SC Krieger in Multiple Sclerosis Journal—Experimental, Translational and Clinical


