

Abstract
It has been estimated that 30%–50% of proteins self‐assemble to form complexes consisting of multiple copies of themselves. If there is a functional difference between different molecular weight forms and if these forms interconvert on a reasonable time scale then oligomerization could be an important metabolic control mechanism. The example given here is of apoE for which the oligomerization process is measured in minutes to hours and the monomer binds lipids while the tetramer does not. Examination of the literature reveals few reports on the rate constants that control the interconversion of different molecular weight forms. Perhaps it is time to collect such data.
Keywords: metabolism, lipid binding, kinetics
Introduction
Oligomeric proteins abound in nature. It has been estimated that 30%–50% of proteins self‐assemble to form oligomers consisting of multiple copies of themselves.1 As of 2004 and out of a total of 452 human enzymes for which the subunit composition was known, only a third were monomers. Of the remaining 311 most form homomultimers with homodimers and homotetramers as the most highly represented.2 There have been extensive discussions as to why so many oligomeric proteins exist (e.g., Refs. 1, 3, 4, 5, 6, 7, 8, 9, 10) most of which suggest that oligomerization is important for protein stability, for creating new binding sites,6 or for inducing allosteric behavior11 as well as other functions. Griffin and Gerrard6 state that “a few general principles are starting to emerge that give us a framework within which to rationalize the propensity for proteins to form oligomeric units, in terms of both specific functional advantages and generic facets of stability.” Schreiber et al. noted that protein–protein association is at the center of diverse biological processes ranging from enzyme catalysis/inhibition to regulation of immune response by cytokines7 and a recent review discusses the importance of oligomers of G‐protein coupled receptors (GPCRs).12 The most extensive discussion of the mechanism of tetramer formation has been given by Powers and Powers9 while oligomerization as a special case of the general concept of protein–protein interaction has been discussed in detail by Schreiber et al.7
Many protein oligomers, like hemoglobin, are stable and must be oligomeric to perform their specific function. Others are dynamic undergoing, at least in vitro, readily reversible oligomeric, transient interactions (i.e., Ref. 13, 14). In such cases different oligomeric forms have frequently been observed to have different metabolic functions in that, for example, one form may bind ligand differently than another. One such example is the tumor suppressor p53 for which oligomerization plays an important role in its activation.15 Indeed, that appears to be the case for at least some, perhaps many, proteins that undergo readily reversible oligomerization and may be particularly relevant for enzymatic reactions.
The question addressed here is whether the rate of the association‐dissociation process could be a metabolic control mechanism. Over the years, investigators have uncovered a plethora of metabolic control mechanisms that exist in biological systems. These include the control of enzymatic activity by allosteric effectors, substrate availability, feedback inhibition, pH, post translational modification, the rate of protein synthesis and degradation and so on. This issue was raised many years ago for enzymatic reactions16 but is applicable to non‐enzymatic systems as well.17
The current work primarily discusses non‐enzymatic reactions. Many investigators have discussed protein oligomerization, but there are few discussions of the issue of different oligomeric forms having different functions and fewer studies of the rate constants that define the oligomerization process. While many new techniques have become available to examine protein oligomerization the determination of rate constants for such systems remains mostly unexplored.
Protein concentrations in vivo are simplistically determined by the rate of synthesis and the rate of degradation. Not only are those processes themselves complex, but also protein concentrations may vary between different organelles or subcellular compartments within a given tissue. A frequent assumption is that equilibration between oligomeric species is “fast.” But “fast” is a relative term since it is dependent of the timescale of the measurement. Importantly, one can question what “fast” means in metabolic processes.
The time course of protein oligomerization
In general, we expect ligands to bind rapidly to a protein, perhaps as a diffusion controlled process. Apparent slow binding could reflect one of two possibilities: there is a slow conformational change or an association–dissociation process where only one form binds ligand. I discuss here only the case where it is known that a protein undergoes an association‐dissociation reaction from independent results and where it is suspected that different molecular weight forms differ in ligand binding. Schreiber et al. note that the observed rate constants of protein–protein interactions, which could include oligomerization of a single protein, span a wide range, from <10−3 to >103 s−1 μM−1.7 While these authors discuss methods for determining rate constants for protein–protein interactions, the determination of rate constants for oligomerization processes could be more complex.
Scheme 1 illustrates the simplest case where M = monomer and D = dimer. Here we assume that a protein undergoes a monomer‐dimer oligomerization and that only one form, the monomer (M), binds a specific ligand (L). Even for this simple case there are two possibilities: the equilibration between monomer and dimer (D) is rapid or is slow relative to the time of measurement. This distinction is important because the results are quite different and the definition of “rapid” and “slow” equilibration depends on the time over which the reaction is measured. Most association‐dissociation process probably can be considered to be slow. For apoE, discussed later, equilibration between oligomeric forms is on the order of minutes to hours.
Scheme 1.
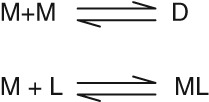
Monomer‐dimer mechanism.
Rapid equilibration
If the association–dissociation process is truly in rapid equilibrium, the system will behave as if it is a single species. For this condition, the rate constants for the monomer–dimer equilibrium (or any monomer‐multiple oligomerization) need to be quite large, perhaps close to a diffusion controlled limit. Under these conditions, oligomerization would not represent a control mechanism,
Slow equilibration
From examples in the literature, it appears that protein oligomerization can be quite slow. For Scheme 1 we arbitrarily assumed that k1 = 0.001 s−1 μM−1 and k−1 = 0.002 s−1 yielding a dissociation constant of 2 μM. We also assume that only the monomer binds ligand. A saturating ligand concentration added at time zero is 10 μM and the ligand is assumed to bind rapidly using k1 = 10 s−1 μM−1 and k−1 = 1 s−1 giving a dissociation constant of 0.1 μM. In practice, the high concentration of a stock solution might be expected to be oligomeric (dimeric in this example) at zero time and slowly dissociate resulting in both monomer and dimer in solution. In this example the final concentrations of monomer and dimer would be 0.3 and 0.047 μM, respectively. Thus, ligand binding will be dependent on when the ligand is added.
Figure 1 shows the time course of ligand binding with and without preincubation.
Figure 1.
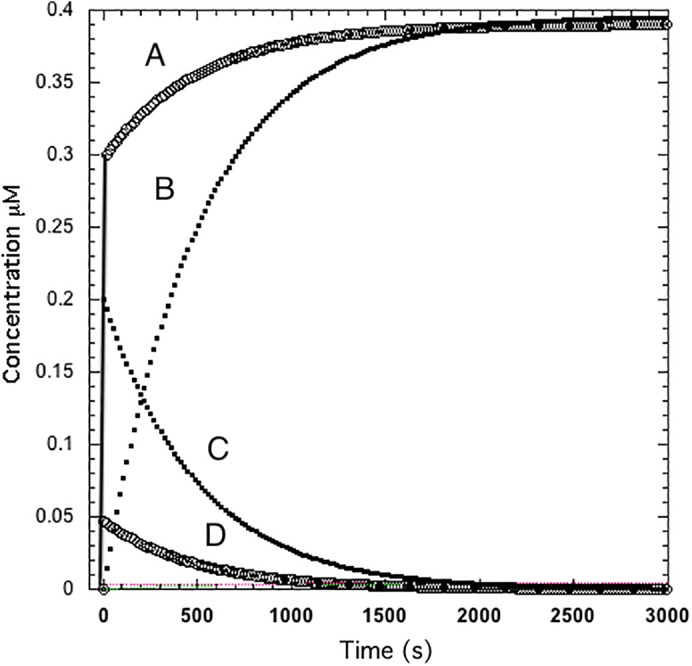
Ligand binding kinetics for a monomer‐dimer system assuming that only the monomer binds ligand with (A, D) and without (B, C) preincubation. Protein concentrations: No preincubation, dimer = 0.2 μM with no monomer present. With preincubation (at equilibrium after 2000 s) the monomer concentration = 0.3 μM and the dimer concentration = 0.047 μM. The vertical line at zero time is the fast phase of ML formation after preincubation. The rate constants for monomer or dimer association and dissociation are k1 = 0.001 s−1 μM−1 and k−1 = 0.002 s−1, respectively, resulting in a dissociation constant of 2 μM. A saturating ligand concentration 10 μM was used with k1 = 10 s−1 μM−1 and k−1 = 1 s−1 resulting in a dissociation constant of 0.1 μM so that ligand binding is not rate limiting. Simulations performed using KinTek Explorer.28, 29
Pre‐equilibration allows both monomer and dimer to exist at the time ligand is added. Consequently, the time course of ligand binding is biphasic, the first phase being rapid ligand binding to the monomer and the second phase being the conversion of the dimer to the monomer as would be expected for a slow equilibration between oligomeric forms. While the parameters used in this example are arbitrary they are indicative of the fact that the time course of ligand binding as a function of ligand concentration can be complex. The point here is not to investigate many possibilities but to point out the role of the oligomerization process in defining the time course of ligand binding. A more complex case, with respect to apoE, is discussed later.
Methodologies for the Determination of Rate Constants
Whether a protein oligomerizes or not is relatively easy to determine. Various methods include analytical ultracentrifugation, light scattering and size exclusion as a function of protein concentration. The determination of rate constants for a non‐enzymatic oligomerization process is, admittedly, more difficult than that for hetero protein–protein interactions. While a monomer–dimer process is easier to characterize than a monomer–dimer–tetramer process methods do exist and determination depends both on the time scale of the process and the ability to perform experiments at protein concentrations defined by the equilibrium constant(s).
For systems involving tetramers the determination can be made somewhat simpler using the assumption that oligomer formation essentially always proceeds as a monomer–dimer–tetramer process, preferably by a single pathway.9 In their study of apoE, which forms tetramers, Garai and Frieden used a variety of methods including FCS, intermolecular FRET, sedimentation velocity and acrylamide quenching of tryptophan fluorescence.18 Rajagopapan et al. used FCS to describe the slow oligomerization kinetics of the tumor suppressor p53.15 Morris et al.19 have reviewed the literature dealing with protein aggregation and many of the techniques listed may be applicable to simpler oligomerization processes. Processes on the order of seconds or minutes might be expected to be the most relevant for metabolic control. However, some slower examples do exist. Zhao et al., for example, used a kinetic analysis of sedimentation velocity to determine rate constants for the slow dimerization of BirA, the central protein of the Escherichia coli biotin regulatory system with k on = 2 × 10⁻⁵ s−1 μM−1 and k off = 2.7 × 10⁻⁴ s−1.20 However, these and other determined rate constants should always be considered as apparent rate constants that ignore issues of, for example, conformational fluctuations within a monomer, that may affect oligomerization.
For faster processes, determination of rate constants can be more complicated. In general, fluctuation methods can be used. Kanno and Levitus note several publications using FCS and provide a mathematical treatment to use.21 However, it must be clear that the attachment of a fluorescent probe does not, in itself, affect the oligomerization properties.
The application to apolipoprotein E (apoE): Small molecule and lipid binding
Because there are so few data in the literature concerning the determination of rate constants for oligomer association or dissociation, we have chosen to use the data for apoE that were determined by Garai and Frieden.18 The following paragraphs provide information on this protein.
In humans, there are major three isoforms of apolipoprotein E called apoE2, apoE3, and apoE4. The monomeric molecular weight is 34.2 kDa (299 aa). In vitro, apoE, at 25°C and concentrations below 10 μM, forms oligomers,22 primarily tetramers. Rate and equilibrium constants have been determined by Garai and Frieden.18 All the apoE isoforms appear to have similar behavior in that formation of monomer from the tetramer appears to be slow with half times on the order of many minutes.
The sequence difference between isoforms is a single amino acid substitution: apoE4 has arginine at positions 112 and 158, apoE3 has a cysteine at position 112 and apoE2 has cysteines at both positions112 and 158. Yet functionally, these isoforms are quite different. ApoE4 is the major risk for the development of late onset Alzheimer's disease while apoE3 appears to be benign in this regard. ApoE2, on the other hand, is associated with a greater risk for early vascular disease and the genetic disorder type III hyperlipoproteinemia. This latter isoform binds poorly to cell surface receptors compared with either apoE3 or apoE4.23
Figure 2 shows a time course for equilibration of the molecular weight forms using data from the article of Garai and Frieden as shown in Scheme 2.18 All three isoforms yielded similar apparent rate constants for the oligomerization process. The values used here are detailed in Scheme 2.
Figure 2.
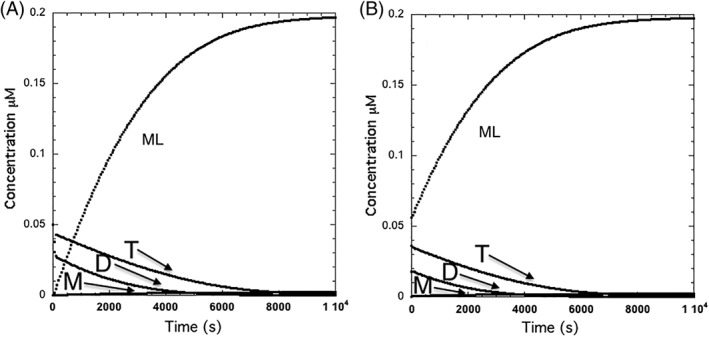
Ligand binding kinetics for a monomer(M)–dimer(D)–tetramer(T) system. Rate constants, shown in Scheme 2 are for apoE as determined by Garai and Frieden.18 The figure shows the differences between starting the ligand binding at zero time (A) or after 3600 s to allow the tetramer to equilibrate between oligomeric forms (B). The assumption is that only monomer binds ligand. Note that the time course of monomer binding is similar in both cases since it is primarily defined by the dissociation of the dimer to monomer. The initial concentration of tetrameric apoE was 0.05 μM. Simulations performed using KinTek Explorer.28, 29
Scheme 2.
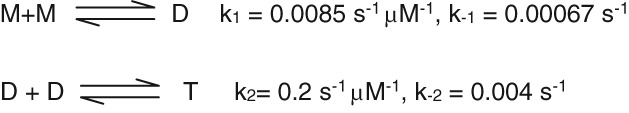
Monomer‐dimer‐tetramer mechanism.
In this scheme, apoE diluted from a stock solution is assumed to be all tetramer and equal to 0.05 μM. After 1 h, the endpoints are determined to be [M] = 0.043 μM, [D] = 0.023 μM and [T] = 0.027 μM where M, D, and T represent monomer, dimer, and tetramer, respectively.
Figure 2 presents two cases where only monomer binds ligand: (A) starting ligand binding without preincubation of the protein or (B) allowing the protein to come to equilibrium between the oligomeric forms prior to adding ligand. In both cases an apparent rate constant for ligand binding is due to dissociation of the dimer to monomer and would be approximately 0.00032 s−1 but the extent of the slow change is different and would be protein concentration dependent.
Lipid binding to the apoE
Only the monomer binds lipid.22, 24, 25 This conclusion is based on a number of experimental techniques including the observation that the time course of an observed turbidity change was essentially the same as the dissociation of protein to monomer.24 In 2017, Frieden et al.26 proposed a mechanism for lipid binding to apoE monomer that involves the separation of the N‐and C‐terminal domains allowing the protein to spread on the surface of the vesicle. It remains unclear how the long time course of dissociation, and therefore presence of the apoE monomer, may affect lipid binding in vivo.
Small molecule binding
A control mechanism for an oligomerizing protein arises from the possibility that different molecular weight forms have different functions such as the ability to bind ligand. For a monomer–dimer–tetramer system many possibilities might exist: a ligand could bind to all three species, only to monomer or to dimer or to tetramer. Using, for example, a fluorescently labeled protein that reports on ligand binding, it may be possible to analyze the time course of ligand binding to determine to what species binds ligand. Under conditions where ligand binds preferentially to one oligomeric form relative to another the time courses can be quite different allowing one, in theory, to determine which isoform binds ligand. This time course could be mistaken for a slow conformational change but the difference would be detected by allowing the protein to equilibrate to mixtures of different molecular weight forms prior to adding ligand. Complications abound. For example, the ligand could affect the distribution of oligomeric forms or the method chosen should not change the rate constants for the association–dissociation process.
Application to enzymes
The examples above can be applied to enzymatic reactions. Hysteresis in enzyme reactions is reflected by time dependent changes in the time course of an enzymatic reaction independent of substrate depletion or product accumulation.27 Such effects could be attributed to substrate induced conformational changes but might easily be due to changes in the degree of oligomerization occurring on dilution, in vitro, of the enzyme from a high concentration stock solution to the enzymatic assay conditions. Generally this possibility has not been considered.
Discussion
The behavior of apoE is certainly not unique. As noted earlier, many enzymes and non‐enzymatic proteins undergo oligomerization. There are, as discussed in the Introduction, many explanations for this characteristic that but it is rarely, if ever, suggested that it has a metabolic control function.
In terms of determining the rate constants for oligomerization, apoE again is not unique. Although not extensively studied, there are other examples of oligomerization being a slow process.7 These slow processes could be critically important in regulating function.
In terms of different oligomeric forms having different activities, the data are not as clear because so few studies have examined this issue. But from a teleological point of view, it makes sense. Thus, it is a way of using the same protein to perform more than one function without making isoforms of the same protein. And, it is an enormously efficient way to control metabolic processes. As noted earlier there are many ways to control metabolic processes. And while protein–protein interactions are important, oligomerization is hardly mentioned. Perhaps because there is an implicit (and unwarranted) assumption that all oligomeric forms are equally functional. However, all that is necessary for oligomeric forms to have different functions is that the subunits of the oligomer block or expose regions necessary for that specific function. Equally of interest is that cellular organelles may contain different concentrations of the same protein with oligomerization leading to different behavior.
It must be noted that time courses observed for isolated systems in vitro may be quite different from what happens in vivo, a caveat that holds true for all in vitro studies. Such a consideration should not, however, negate the possibility, or even the probability, that the time courses of oligomerization processes can be a mechanism of metabolic control.
Conclusion
The number of proteins (including enzymes) that exhibit readily reversible oligomerization is striking and, as noted above, there is a plethora of metabolic control mechanisms. Do we need another one? A reason for having a single protein that exhibits different functional properties as a consequence of reversible oligomerization is that it is extremely efficient in terms of energy utilization. More importantly, the time course of any oligomerization process where the oligomers are functionally different can define or direct given metabolic pathways. While this may not be a new concept it remains hardly examined. It is time to remedy that deficiency. It is axiomatic to say that kinetics define the life processes and that a system that exists only at equilibrium will not survive.
Grant sponsor: NIH NIA; Grant number: RF1 AG0044331
References
- 1. Levy ED, Teichmann S (2013) Structural, evolutionary, and assembly principles of protein oligomerization. Prog Mol Biol Transl Sci 117:25–51. [DOI] [PubMed] [Google Scholar]
- 2. Marianayagam NJ, Sunde M, Matthews JM (2004) The power of two: protein dimerization in biology. Trends Biochem Sci 29:618–625. [DOI] [PubMed] [Google Scholar]
- 3. Darnall DW, Klotz IM (1975) Subunit constitution of proteins: a table. Arch Biochem Biophys 166:651–682. [DOI] [PubMed] [Google Scholar]
- 4. Goodsell DS, Olson AJ (2000) Structural symmetry and protein function. Annu Rev Biophys Biomol Struct 29:105–153. [DOI] [PubMed] [Google Scholar]
- 5. Ali MH, Imperiali B (2005) Protein oligomerization: how and why. Bioorg Med Chem 13:5013–5020. [DOI] [PubMed] [Google Scholar]
- 6. Griffin MD, Gerrard JA (2012) The relationship between oligomeric state and protein function. Adv Exp Med Biol 747:74–90. [DOI] [PubMed] [Google Scholar]
- 7. Schreiber G, Haran G, Zhou HX (2009) Fundamental aspects of protein‐protein association kinetics. Chem Rev 109:839–860. [DOI] [PMC free article] [PubMed] [Google Scholar]
- 8. Selwood T, Jaffe EK (2012) Dynamic dissociating homo‐oligomers and the control of protein function. Arch Biochem Biophys 519:131–143. [DOI] [PMC free article] [PubMed] [Google Scholar]
- 9. Powers ET, Powers DL (2003) A perspective on mechanisms of protein tetramer formation. Biophys J 85:3587–3599. [DOI] [PMC free article] [PubMed] [Google Scholar]
- 10. Fatmi MQ, Chang CE (2010) The role of oligomerization and cooperative regulation in protein function: the case of tryptophan synthase. PLoS Comput Biol 6:e1000994. [DOI] [PMC free article] [PubMed] [Google Scholar]
- 11. Monod J, Wyman J, Changeux JP (1965) On the nature of allosteric transitions: a plausible model. J Mol Biol 12:88–118. [DOI] [PubMed] [Google Scholar]
- 12. Farran B (2017) An update on the physiological and therapeutic relevance of GPCR oligomers. Pharmacol Res 117:303–327. [DOI] [PubMed] [Google Scholar]
- 13. Acuner Ozbabacan SE, Engin HB, Gursoy A, Keskin O (2011) Transient protein‐protein interactions. Protein Eng Des Sel 24:635–648. [DOI] [PubMed] [Google Scholar]
- 14. Nooren IM, Thornton JM (2003) Structural characterisation and functional significance of transient protein‐protein interactions. J Mol Biol 325:991–1018. [DOI] [PubMed] [Google Scholar]
- 15. Rajagopalan S, Huang F, Fersht AR (2011) Single‐molecule characterization of oligomerization kinetics and equilibria of the tumor suppressor p53. Nucleic Acids Res 39:2294–2303. [DOI] [PMC free article] [PubMed] [Google Scholar]
- 16. Frieden C (1971) Protein‐protein interaction and enzymatic activity. Annu Rev Biochem 40:653–696. [DOI] [PubMed] [Google Scholar]
- 17. Mercadante D, Melton LD, Norris GE, Loo TS, Williams MA, Dobson RC, Jameson GB (2012) Bovine beta‐lactoglobulin is dimeric under imitative physiological conditions: dissociation equilibrium and rate constants over the pH range of 2.5‐7.5. Biophys J 103:303–312. [DOI] [PMC free article] [PubMed] [Google Scholar]
- 18. Garai K, Frieden C (2010) The association‐dissociation behavior of the ApoE proteins: kinetic and equilibrium studies. Biochemistry 49:9533–9541. [DOI] [PMC free article] [PubMed] [Google Scholar]
- 19. Morris AM, Watzky MA, Finke RG (2009) Protein aggregation kinetics, mechanism, and curve‐fitting: a review of the literature. Biochim Biophys Acta 1794:375–397. [DOI] [PubMed] [Google Scholar]
- 20. Zhao H, Beckett D (2008) Kinetic partitioning between alternative protein‐protein interactions controls a transcriptional switch. J Mol Biol 380:223–236. [DOI] [PMC free article] [PubMed] [Google Scholar]
- 21. Kanno DM, Levitus M (2014) Protein oligomerization equilibria and kinetics investigated by fluorescence correlation spectroscopy: a mathematical treatment. J Phys Chem B 118:12404–12415. [DOI] [PubMed] [Google Scholar]
- 22. Perugini MA, Schuck P, Howlett GJ (2000) Self‐association of human apolipoprotein E3 and E4 in the presence and absence of phospholipid. J Biol Chem 275:36758–36765. [DOI] [PubMed] [Google Scholar]
- 23. Weisgraber KH, Innerarity TL, Mahley RW (1982) Abnormal lipoprotein receptor‐binding activity of the human E apoprotein due to cysteine‐arginine interchange at a single site. J Biol Chem 257:2518–2521. [PubMed] [Google Scholar]
- 24. Garai K, Baban B, Frieden C (2011) Dissociation of apolipoprotein E oligomers to monomer is required for high‐affinity binding to phospholipid vesicles. Biochemistry 50:2550–2558. [DOI] [PMC free article] [PubMed] [Google Scholar]
- 25. Fabilane CS, Nguyen PN, Hernandez RV, Nirudodhi S, Duong M, Maier CS, Narayanaswami V (2016) Mechanism of lipid binding of human apolipoprotein E3 by hydrogen/deuterium exchange/mass spectrometry and fluorescence polarization. Protein Pept Lett 23:404–413. [DOI] [PMC free article] [PubMed] [Google Scholar]
- 26. Frieden C, Wang H, Ho CMW (2017) A mechanism for lipid binding to apoE and the role of intrinsically disordered regions coupled to domain‐domain interactions. Proc Natl Acad Sci U S A 114:6292–6297. [DOI] [PMC free article] [PubMed] [Google Scholar]
- 27. Frieden C (1970) Kinetic aspects of regulation of metabolic processes. The hysteretic enzyme concept. J Biol Chem 245:5788–5799. [PubMed] [Google Scholar]
- 28. Johnson KA, Simpson ZB, Blom T (2009) FitSpace explorer: an algorithm to evaluate multidimensional parameter space in fitting kinetic data. Anal Biochem 387:30–41. [DOI] [PubMed] [Google Scholar]
- 29. Johnson KA, Simpson ZB, Blom T (2009) Global kinetic explorer: a new computer program for dynamic simulation and fitting of kinetic data. Anal Biochem 387:20–29. [DOI] [PubMed] [Google Scholar]