

Abstract
Highly flexible proteins present a special challenge for structure determination because they are multi-structured yet not disordered, so their conformational ensembles are essential for understanding function. Because spectroscopic measurements of multiple conformational populations often provide sparse data, experiment selection is a limiting factor in conformational refinement. A molecular simulations- and information-theory based approach to select which experiments best refine conformational ensembles has been developed. This approach was tested on three flexible proteins. For proteins where a clear mechanistic hypothesis exists, experiments that test this hypothesis were systematically identified. When available data did not yield such mechanistic hypotheses, experiments that significantly outperform structure-guided approaches in conformational refinement were identified. This approach offers a particular advantage when refining challenging, underdetermined protein conformational ensembles.
Keywords: conformational ensembles, EPR spectroscopy, molecular dynamics, mutual information, protein structures
Heterogeneous conformational ensembles play critical roles in molecular recognition and cellular regulation,[1] yet high-resolution structure determination has typically required reducing these ensembles to only a few states. Since the full equilibrium ensemble is often key to understanding biochemical function, other experimental techniques have been developed to probe the full ensemble distribution rather than either a few low-energy states or an equilibrium average.[2] However, these experiments measure only a small number of atomic degrees of freedom:[3] for instance, double electron–electron resonance (DEER) and single-molecule Förster resonance energy transfer (smFRET) spectroscopy, which utilize pairs of labeled amino acids to obtain distance distributions, typically provide data for ≈ 10 measurements per system. Thus, experiment selection is currently the limiting factor in how much information can be obtained on an ensemble.
Prior quantitative approaches to experiment selection have relied on pre-existing high-resolution structural and kinetic models. Recent studies have shown, retrospectively, that leveraging either Markov State Models[4] or normal modes calculated from elastic network models[5] can select good labels for DEER experiments. However, for systems where traditional structural or kinetic models are incomplete or fundamentally underdetermined due to conformational flexibility, it remains challenging to determine which pairs of residues should be chosen for labeling. We have therefore developed a general, information-theoretic formalism to select optimal spectroscopic experiments. We summarize the theory and show the application of this method to three conformationally heterogeneous bacterial proteins.
An optimal set of spectroscopic experiments has two properties: each experiment yields the maximum amount of information on the conformational ensemble and minimally redundant information with other experiments in the set to avoid wasting labeling and measurement effort (Figure 1). The maximum-relevance, minimum redundancy (mRMR) algorithm exactly satisfies these criteria.[6a,b] To select N spectroscopic experiments, we maximize the mutual information (MI) between the set of spectroscopic observables {Oi} and the conformation C:
| (1) |
where C is the set of n(n–1)/2 pairwise distance variables. We simultaneously minimize the pairwise MI between spectroscopic variables Oi and Oj (Figure 1):
| (2) |
where I(X, Y) is the mutual information between random variables X and Y:
| (3) |
This method is particularly useful because it identifies, by design, those observables that are maximally underdetermined in a structural ensemble. These underdetermined observables are precisely those that would be especially challenging for traditional structure determination.
Figure 1.
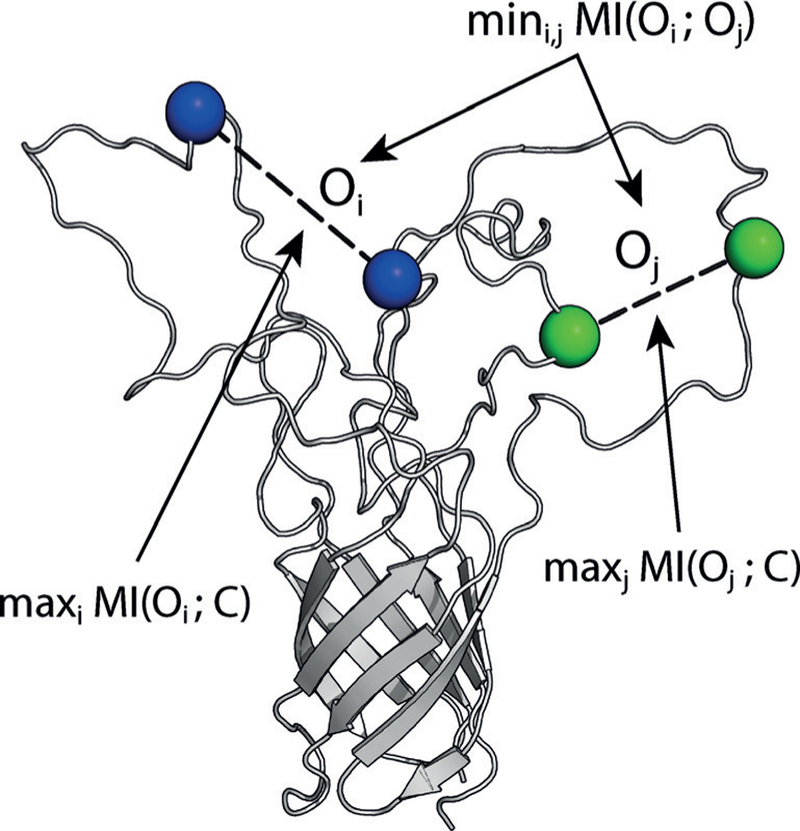
The maximum-relevancy, minimum-redundancy (mRMR) method applied to spectroscopic observables {Oi}. The optimal set of spectroscopic experiments that report on variables {Oi} are maximally informative of the conformation C and minimally redundant with each other. Informativeness and redudancy are quantified via mutual information (MI).
In our study, we make two approximations: we use deliberately undersampled estimates of the protein conformational ensemble to select labels for further refinement, and we approximate the spectroscopic variable Oi as the Cα−Cα pairwise distance distribution between labeled residues. We make the first approximation to demonstrate the strong advantage of our method for heterogenous ensembles: by identifying underdetermined degrees of freedom we can improve an incomplete estimate of the conformational ensemble rather than requiring a well-sampled starting model. The second approximation is an implementation rather than theoretical concern and we will discuss how it can be removed. The success of the mRMR method and these approximations is demonstrated below on a set of flexible bacterial outer membrane proteins.
Beta-barrel membrane proteins are excellent candidates for the mRMR approach because many contain flexible regions that are difficult to characterize experimentally, yet have regions of secondary structure that make spectroscopic experiments tractable.[7] We have performed molecular dynamics (MD) simulations on three bacterial outer membrane proteins and applied the mRMR algorithm to select optimal DEER experiments. We have chosen FhuA, an E. coli iron transporter,[8] OprG, a pseudomonal small-molecule transporter,[9] and Opa60, a neisserial virulence-associated protein that binds cell-surface proteins, but does not function as a transporter.[10] The FhuA conformational ensemble has been characterized via DEER experiments guided by pre-existing mechanistic hypotheses that relate conformational changes of the Ton box domain to ligand recognition;[11] it is thus a good test system for determining whether the mRMR algorithm identifies similar labels to those identified by spectroscopists. OprG, a more challenging system, has been studied using a combination of NMR and mutational experiments,[7c] but the mechanisms by which transport is regulated remain unknown. Finally, Opa60 is a particularly challenging system since it displays substantial, experimentally underdetermined conformational flexibility that controls its binding mechanism.[7b] We have therefore studied this final system prospectively: choosing a set of residue–residue pairs using the mRMR algorithm, measuring them with DEER, incorporating the experimental data into MD simulation, and evaluating this ensemble versus one refined with spectroscopist-selected pairs (SSP). Simulations alone lack the fidelity to reliably predict structural ensembles of flexible proteins, but can serve as a good platform for hybrid refinement, combining physical information with experimental data.
For each protein, we generated initial estimates of the conformational ensembles using ensemble MD simulations that were deliberately undersampled at 2 μs per protein. We used the mRMR algorithm on these data to select sets of pairwise distances that optimally report on undersampled regions of phase space (Figure 2).
Figure 2.
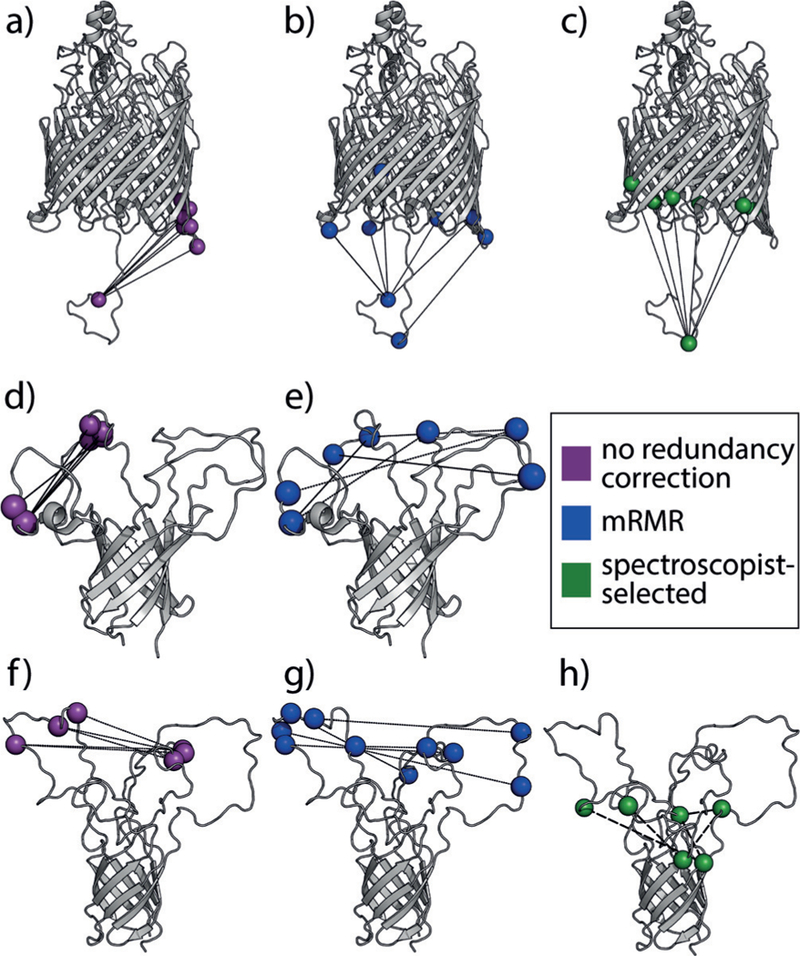
Capture of highly informative, minimally redundant residues on three bacterial outer membrane proteins with mRMR. Selection via mutual information alone yields informative, but redundant, pairs (magenta). Selection via mRMR (blue) removes this redundancy. These residues are better distributed across the structures of all three bacterial proteins than the top-ranking MI pairs or ones selected by spectroscopists according to current practice in the field (green). a–c, d–e, and f–h show residues selected for FhuA, OprG, and Opa60, respectively.
In the case of FhuA, spectroscopists selected label pairs near the N-terminal domain, which is conformationally heterogeneous and regulates transport, and the periplasmic side of the beta-barrel using a standard triangulation strategy (Figure 2c).[11] Selection via mRMR identifies similar residues (Figure 2b), with the addition of one pair spanning just the N-terminal domain. Label pairs not corrected for redundancy also specifically identify distances between the N-terminal domain and one side of the barrel as most informative (Figure 2a). DEER analysis independently identified this side of the barrel as interacting with the N-terminal domain. These two findings on FhuA, a relatively well-understood transport protein, show that the mRMR method can select label pairs that best reflect spectroscopic understanding and yield insight into conformational heterogeneity.
Our method provides even greater potential benefit when less is known about the transport mechanism, as in the case of OprG, and may help test claims of loop involvement in OprG transport. Both the mechanism and the substrates for OprG transport are unclear: OprG may transport small, hydrophobic compounds via a lateral gating mechanism or small amino acids via the barrel channel; OprG crystal structures support the former hypothesis,[12] while recent NMR and mutational studies suggest the latter.[7c] Non-transporting mutants that have been studied by NMR spectroscopy have generally more ordered loops, and one loop has especially restricted motion, suggesting it may be critical to transport. Interestingly, this loop participates in all five informative OprG residue-residue pairs (Figure 2d) and in three of the five top-scoring mRMR pairs (Figure 2e). Thus, mRMR analysis yields label pairs that reflect existing mechanistic hypotheses and, most importantly, identify experiments to test these hypotheses.
As a robust test of mRMR-based label selection, we prospectively tested its ability to select DEER experiments and refine the conformational ensemble of Opa60, the most challenging protein in our evaluation set. DEER data were acquired using label pairs selected via both mRMR and traditional structure-based selection, and we assessed the relative utility of each method in refining the ensemble. The long, flexible loops of Opa60 are both critical for function[7a,b] and challenging for previous DEER pair selection methods. In contrast to FhuA or OprG, no structural or functional data provide strong guidance on which residues are responsible for function, in this case receptor engagement. Prior hybrid NMR-MD refinement of the apo conformational ensemble did not provide sufficient insight into the binding mechanism. Normal-mode approaches developed by Zheng and Brooks have been applied to identify informative, non-redundant label sets for DEER that differentiate pairs of structures when such structural data exist,[5, 13] but this is not the case for Opa60. Furthermore, normal-mode calculations from an Opa60 elastic network model do not correlate with flexibility measured via NMR relaxation timescales (Supporting Information, Figure S1). Thus, spectroscopists must choose from more than 5000 possible inter-loop pairs. We show below that the mRMR selection method radically improves structural refinement compared to standard spectroscopic practices for systems that were previously intractable.
We prospectively tested mRMR pair selection by refining the Opa60 conformational ensemble[14] using two independently identified label sets: one selected using the mRMR algorithm and the other independently chosen by spectroscopists. The top five scoring mRMR pairs span multiple combinations of inter-loop distances (Figure 2g), and the top ten pairs capture all possible combinations of the loops (Supporting Information, Table S1). By contrast, the top ten pairs identified using maximum relevancy alone span a single loop–loop pair. Although the maximum-relevancy pairs define the most variable loop, they lose important information about the other loop (Figure 2f). The spectroscopist-selected pairs are primarily short barrel-loop distances because the length of the loops permits distances too long to be measured via DEER, so spectroscopic best practice is to select a more conservative set of pairs. However, this aside, the chance of manually selecting a loop-loop pair within the top 25 % of those identified via mRMR is only 7 %, showing a strong advantage for the systematic selection methods developed here.
Because Opa60 is so conformationally flexible, approximating the label–label distance distributions as Cα–Cα distributions introduces little error relative to the backbone motions of the protein. However, label flexibility becomes increasingly important to label selection as protein flexibility decreases, and explicit labels may be added as follows. First, unrestrained simulations of the wild-type protein may be used to calculate initial mRMR estimates. Explicit labels are introduced for each top-ranked residue-residue pair, and one additional simulation is performed per pair. The mRMR scores are recalculated for each simulation to determine the effects of label side-chain conformation on the final mRMR rankings. A “forward model” can be used for the spectroscopic observable, such as the predicted DEER spectrum,[13b] using the explicit-label simulations.
To assess the quality of mRMR-guided versus structure-guided refinement, we estimated the Opa60 conformational ensemble using DEER data on pairs selected via each approach. We then compared the resulting ensembles using two independent metrics that we developed to quantitatively evaluate “quality of refinement.” As a first metric, we measured how well each refined ensemble predicts DEER data held back from refinement as a test set. Refinement using mRMR-selected label pairs yielded significantly better agreement with the test DEER data: seven of eight test distributions are better captured by the mRMR-guided ensemble than the structure-guided ensemble (Figure 3).
Figure 3.
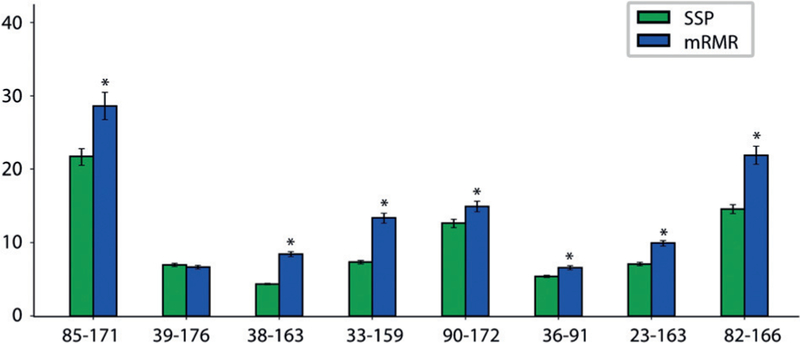
mRMR-guided refinement to predict test DEER distributions better than structure-guided refinement. Quality of refinement was evaluated by ability to predict additional 8 residue–residue pairs measured using DEER. Conformational ensembles refined using mRMR-selected pairs predict these DEER distributions significantly better than ones refined using spectroscopist-selected pairs (SSP) in 7 of 8 cases, quantified as inverse Jensen-Shannon divergence. Three of these DEER pairs were used for a second round of mRMR refinement; the resulting conformational ensemble out-performs both first round ensembles in predicting the five pairs not used for refinement. Error bars show 90 % CI from 1000 bootstrap samples; * denotes p < 0.01 via two-tailed t-tests.
We also analyzed the dimensionality of the conformational ensembles obtained from refinement using structured-guided versus mRMR-guided DEER data. Given sufficient sampling, a better-refined conformational ensemble will have lower dimensionality, approaching the “true” ensemble in the lower limit. We therefore developed a quantitative measure for the dimensionality of a conformational ensemble (see Methods in the Supplementary Information).
Because residue–residue distances yield an overcomplete basis set, we lumped together highly related distance variables at different thresholds of relatedness (ε) and calculated the number of independent distance variables required to describe the ensemble at each ε. At every ε tested, refinement with mRMR-selected DEER data yielded a conformational ensemble of lower dimensionality than with spectroscopist-selected DEER data (Figure 4 A). This indicates that DEER data from mRMR-selected pairs refine the conformational ensemble more efficiently than data from pairs selected according to the current state-of-the-art methods.
Figure 4.
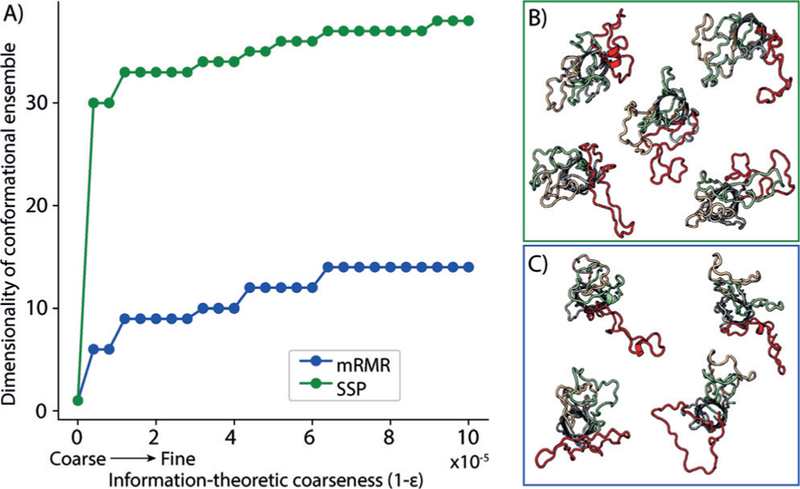
mRMR-guided refinement to produce ensembles of lower dimensionality than structure-guided refinement. a) The dimensionality of the conformational ensemble (the number of independent distance variables), is plotted at each information theoretic resolution ε. Ensembles refined using mRMR-selected pairs are of lower dimensionality than those refined using SSPs by 20–25. b) Structures identified by cluster analysis of inter-loop contacts are also shown for each ensemble. mRMR refinement yields conformations in which a single loop extends from the base of the barrel while the two remaining loops interact. SSP refinement yields conformations with no well-defined loop–loop interaction patterns.
mRMR pair-selection also produces strikingly more informative structural results than spectroscopist-guided selection. We determined the major loop conformations in each ensemble by clustering loop–loop contact maps. After one iteration, mRMR-guided refinement yields four clusters, all of which show one loop protruding laterally and two loops closely interacting (Figure 4C). In contrast to mRMR-guided refinement, refinement using spectroscopist-selected pairs yields a larger number of structural clusters with poorly resolved loop conformations (Figure 4B) that also poorly predict additional DEER measurements (Figure 3). The loop conformations resolved by mRMR-guided refinement further yield a structural hypothesis for receptor recognition whereby either the two contacting loops or the one splayed loop is primarily responsible for receptor binding.
These tests demonstrate that mRMR provides a robust approach to spectroscopic label selection, particularly for flexible proteins where structural estimates are more challenging and the difference in data quality between optimally selected labels and poorly selected labels is greater. When strong mechanistic hypotheses have guided prior DEER experiments, mRMR yields label pairs that would test these hypotheses. For proteins such as Opa60 where mechanistic understanding is insufficient to guide experiment selection, we show via prospective testing that mRMR selection outperforms unaided spectroscopists. Therefore, we believe that mRMR will be of general use in guiding spectroscopic experiment selection for DEER and for other label-based methods, such as smFRET and paramagnetic resonance enhancement. The method can also be extended to differentiate mechanistic hypotheses rather than conformations. For systems like OprG where two mechanistic hypotheses exist, mRMR could be used to identify which spectroscopic variables optimally distinguish conformational features specific to one mechanism or the other. Conformational flexibility and heterogeneity are some of the most challenging and exciting frontiers in understanding protein structure, and mRMR will increase the ability of these experimental methods to efficiently refine such conformational ensembles.
Supplementary Material
Acknowledgements
The authors thank D. Cafiso, G. Cortina, T. Caldwell, and L. Tamm for helpful discussions. Computational resources were provided by XSEDE Comet at SDSC [MCB150128] and SNIC via the Center for Parallel Computation at KTH. This work was supported by NIGMS grants R01GM087828 to L.C. and R01GM115790 to P.M.K., a Wallenberg Academy Fellowship to P.M.K., and an award from the Jeffress Trust.
Footnotes
Conflict of interest
The authors declare no conflict of interest.
Supporting information and the ORCID identification number(s) for the author(s) of this article can be found under: https://doi.org/10.1002/anie.201810462.
Contributor Information
Jennifer M. Hays, Departments of Biomedical Engineering and Molecular Physiology, University of Virginia
Marissa K. Kieber, Department of Chemistry, University of Virginia
Jason Z. Li, Department of Chemistry, University of Virginia
Ji In Han, Department of Chemistry, University of Virginia.
Linda Columbus, Department of Chemistry, University of Virginia.
Peter M. Kasson, Departments of Biomedical Engineering and Molecular Physiology, University of Virginia, Science for Life Laboratory, Program in Molecular Biophysics, Uppsala University.
References
- [1].a) Boehr DD, Nussinov R, Wright PE, Nat. Chem. Biol 2009, 5, 789–796; [DOI] [PMC free article] [PubMed] [Google Scholar]; b) Jimenez R, Salazar G, Yin J, Joo T, Romesberg FE, Proc. Natl. Acad. Sci. USA 2004, 101, 3803–3808; [DOI] [PMC free article] [PubMed] [Google Scholar]; c) Willcox BE, Gao GF, Wyer JR, Ladbury JE, Bell JI, Jakobsen BK, van der Merwe PA, Immunity 1999, 10, 357–365. [DOI] [PubMed] [Google Scholar]
- [2].a) Bernadó P, Mylonas E, Petoukhov MV, Blackledge M, Svergun DI, J. Am. Chem. Soc 2007, 129, 5656–5664; [DOI] [PubMed] [Google Scholar]; b) Wei G, Xi W, Nussinov R, Ma B, Chem. Rev 2016, 116, 6516–6551; [DOI] [PMC free article] [PubMed] [Google Scholar]; c) Levin EJ, Kondrashov DA, Wesenberg GE, Phillips GN Jr., Structure 2007, 15, 1040–1052; [DOI] [PMC free article] [PubMed] [Google Scholar]; d) Bonvin AM, Brunger AT, J. Mol. Biol 1995, 250, 80–93. [DOI] [PubMed] [Google Scholar]
- [3].a) Jeschke G, Proteins Struct. Funct. Bioinf 2016, 84, 544–560; [DOI] [PubMed] [Google Scholar]; b) Ward R, Zoltner M, Beer L, El Mkami H, Henderson IR, Palmer T, Norman DG, Structure 2009, 17, 1187–1194; [DOI] [PubMed] [Google Scholar]; c) Rao JN, Jao CC, Hegde BG, Langen R, Ulmer TS, J. Am. Chem. Soc 2010, 132, 8657–8668; [DOI] [PMC free article] [PubMed] [Google Scholar]; d) Hirst SJ, Alexander N, McHaourab HS, Meiler J, J. Struct. Biol 2011, 173, 506–514. [DOI] [PMC free article] [PubMed] [Google Scholar]
- [4].Mittal S, Shukla D, J. Phys. Chem. B 2017, 121, 9761. [DOI] [PubMed] [Google Scholar]
- [5].Jeschke G, Chem J. Theory Comput 2012, 8, 3854–3863. [DOI] [PubMed] [Google Scholar]
- [6].a) Peng H, Long F, Ding C, IEEE Trans. Pattern Anal. Mach. Intell 2005, 27, 1226–1238; [DOI] [PubMed] [Google Scholar]; b) Ding C, Peng H, J. Bioinform. Comput. Biol 2005, 3, 185–205. [DOI] [PubMed] [Google Scholar]
- [7].a) Martin JN, Ball LM, Solomon TL, Dewald AH, Criss AK, Columbus L, Biochemistry 2016, 55, 4286–4294; [DOI] [PMC free article] [PubMed] [Google Scholar]; b) Fox DA, Larsson P, Lo RH, Kroncke BM, Kasson PM, Columbus L, J. Am. Chem. Soc 2014, 136, 9938–9946; [DOI] [PMC free article] [PubMed] [Google Scholar]; c) Kucharska I, Seelheim P, Edrington T, Liang B, Tamm LK, Structure 2015, 23, 2234–2245; [DOI] [PMC free article] [PubMed] [Google Scholar]; d) Pautsch A, Schulz GE, Nat. Struct. Biol 1998, 5, 1013–1017; [DOI] [PubMed] [Google Scholar]; e) Arora A, Abildgaard F, Bushweller JH, Tamm LK, Nat. Struct. Biol 2001, 8, 334–338. [DOI] [PubMed] [Google Scholar]
- [8].Moeck GS, Coulton JW, Postle K, J. Biol. Chem 1997, 272, 28391–28397. [DOI] [PubMed] [Google Scholar]
- [9].Hancock RE, Brinkman FS, Annu. Rev. Microbiol 2002, 56, 17–38. [DOI] [PubMed] [Google Scholar]
- [10].McCaw SE, Liao EH, Gray-Owen SD, Infect. Immun 2004, 72, 2742–2752. [DOI] [PMC free article] [PubMed] [Google Scholar]
- [11].Sarver JL, Zhang M, Liu L, Nyenhuis D, Cafiso DS, Biochemistry 2018, 57, 1045–1053. [DOI] [PMC free article] [PubMed] [Google Scholar]
- [12].a) Touw DS, Patel DR, van den Berg B, PLoS One 2010, 5, e15016; [DOI] [PMC free article] [PubMed] [Google Scholar]; b) Bos MP, Kao D, Hogan DM, Grant CC, Belland RJ, Infect. Immun 2002, 70, 1715–1723; [DOI] [PMC free article] [PubMed] [Google Scholar]; c) Virji M, Evans D, Hadfield A, Grunert F, Teixeira AM, Watt SM, Mol. Microbiol 1999, 34, 538–551. [DOI] [PubMed] [Google Scholar]
- [13].a) Zheng W, Brooks BR, Biophys. J 2005, 88, 3109–3117; [DOI] [PMC free article] [PubMed] [Google Scholar]; b) Jeschke G, Protein Sci 2017, 27, 76–85. [DOI] [PMC free article] [PubMed] [Google Scholar]
- [14].a) Roux B, Islam SM, J. Phys. Chem. B 2013, 117, 4733–4739; [DOI] [PMC free article] [PubMed] [Google Scholar]; b) Islam SM, Roux B, J. Phys. Chem. B 2015, 119, 3901–3911. [DOI] [PMC free article] [PubMed] [Google Scholar]
Associated Data
This section collects any data citations, data availability statements, or supplementary materials included in this article.