

SUMMARY
Interaction domains in Drosophila chromosomes form by segregation of active and inactive chromatin in the absence of CTCF loops, but the role of transcription versus other architectural proteins in chromatin organization is unclear. Here, we find that positioning of RNAPII via transcription elongation is essential in the formation of gene loops, which in turn interact to form compartmental domains. Inhibition of transcription elongation or depletion of cohesin decreases gene looping and formation of active compartmental domains. In contrast, depletion of condensin II, which also localizes to active chromatin, causes increased gene looping, formation of compartmental domains, and stronger intra-chromosomal compartmental interactions. Condensin II has a similar role in maintaining inter-chromosomal interactions responsible for pairing between homologous chromosomes, whereas inhibition of transcription elongation or cohesin depletion has little effect on homolog pairing. The results suggest distinct roles for cohesin and condensin II in the establishment of 3D nuclear organization in Drosophila.
In Brief
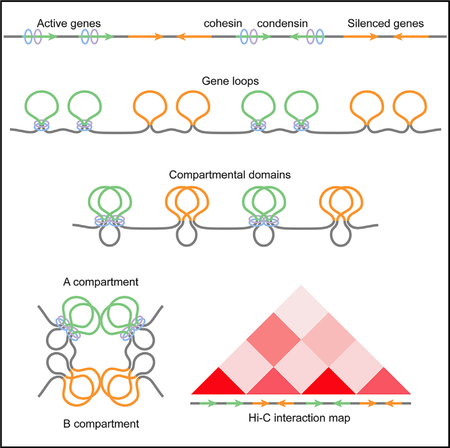
Using Hi-C analyses, Rowley et al. show that Drosophila genes form loops between the TSS and TTS, which in turn interact to form compartmental domains. Cohesin and condensin act in opposite ways on the formation of gene loops and domains.
Graphical Abstract
INTRODUCTION
Inter- and intra-chromosomal interactions among DNA-bound proteins establish patterns of chromatin organization detectable by Hi-C (Rowley and Corces, 2018). The original low-resolution genome-wide Hi-C maps described the segregation of active and inactive chromatin into A and B compartments (Lieberman-Aiden et al., 2009). Later, higher-resolution maps identified domains characterized by preferential intra- versus inter-domain contacts. Interaction domains have been described in different organisms and are commonly referred to as topologically associating domains (TADs) (Dixon et al., 2012; Hou et al., 2012; Nora et al., 2012; Sexton et al., 2012). In addition to these features, intense point-to-point loops have been detected by high-resolution Hi-C in mammals (Rao et al., 2014). The anchors of these loops are enriched in CTCF and cohesin, and predominantly contain CTCF motifs in convergent orientation (Guo et al., 2015; Rao et al., 2014; Tang et al., 2015).
CTCF loops are an important component of chromatin organization in vertebrates, yet plants and invertebrates either lack a homolog or CTCF does not appear to form stable loops (Dong et al., 2017; Rowley et al., 2017). Instead, chromosomal domains in these organisms, including Drosophila, correspond to the transcriptional state of specific sequences in the genome. Borders between these domains form at discontinuities between active and inactive regions containing proteins and histone modifications characteristic of their transcriptional state. This pattern of 3D organization is similar to that observed in mammals after depletion of CTCF or Rad21 and has been studied in detail in Drosophila, where analyses of high-resolution Hi-C data show that chromatin is predominately organized by the fine-scale segregation of active and inactive chromatin into A and B compartmental domains (Rowley et al., 2017). Indeed, transcriptional state alone can be used to computationally simulate the experimental Hi-C interaction pattern at 1-kb resolution with great accuracy (Rowley et al., 2017). In further support for a role of transcription or factors associated with the transcriptional state of genes in chromatin organization, inhibition of transcription initiation and subsequent degradation of RNA polymerase II (RNAPII) using triptolide disrupts Drosophila compartmental domains and their interactions (Hug et al., 2017; Rowley et al., 2017). Interestingly, the extent of disruption of 3D organization correlates with the levels of RNAPII after triptolide treatment (Hug et al., 2017; Rowley et al., 2017). Drosophila Hi-C maps also show a few hundred punctate signals corresponding to specific point-to-point interactions, but these loops are not associated with CTCF. Instead, the loop anchors are enriched for developmental enhancers, Pc, and Rad21 (Cubeñas-Potts et al., 2017; Eagen et al., 2017; Ogiyama et al., 2018; Rowley et al., 2017). It is unclear whether these Pc loops are formed by cohesin-mediated loop extrusion as it has been proposed for CTCF loops in mammals.
In addition to inter- and intra-chromosomal interactions, Drosophila chromosomes participate in extensive pairing with their homologs. Pairing between homologs is responsible for the transvection phenomenon, which involves interactions between enhancers and promoters of genes located in two homologous chromosomes (Geyer et al., 1990; Lim et al., 2018). Analysis of the extent of this pairing typically makes use of fluorescence in situ hybridization (FISH) probes hundreds of kilobases long, making it difficult to determine whether pairing occurs at discrete loci or in large regions (Joyce et al., 2012; Williams et al., 2007). Several proteins have been shown to affect homolog pairing including condensin II, the levels of which are regulated by the SCFSlimb ubiquitin ligase (Joyce et al., 2012; Nguyen et al., 2015). Depletion of Slimb increases levels of condensin II and decreases homolog pairing, while depletion of condensin II increases homolog pairing, suggesting that condensin II antagonizes chromosome pairing. While the role of condensin II in this aspect of nuclear organization is well known, its relationship to other aspects of chromosome organization is largely unexplored.
Here, we examine the contribution of condensin II, cohesin, and the distribution of RNAPII to the establishment of various features of Drosophila 3D chromatin organization. Furthermore, analysis of homologous pairing interactions using Hi-C data suggests that pairing occurs at discrete loci with an average length of 6.4 kb enriched for architectural proteins. The results highlight the importance and distinct roles of RNAPII or other components of the transcription complex, cohesin, and condensin II in the establishment of nuclear organization.
RESULTS
Genes Form Small Interaction Domains That Correlate with the Presence of RNAPII in Gene Bodies
We have previously shown that contacts between the transcription start site (TSS) and the transcription termination site (TTS) of Drosophila active genes result in the formation of gene loops. Interactions between sequences located inside the loop give rise to mini-domains (Rowley et al., 2017). These mini-domains correlate with gene expression, but it is unclear whether they depend on actual transcription. To gain insights into the mechanisms by which gene loops and their associated mini-domains are established, we examined the correlation between their formation and the degree of transcription elongation. To this end, we first calculated a pausing index based on the relative RNAPII chromatin immunoprecipitation sequencing (ChIP-seq) signal at TSSs compared to gene bodies (Zeitlinger et al., 2007) (Figure 1A). We confirmed that this index accurately detects pausing levels using information of nascent transcription from global run-on sequencing (GRO-seq) experiments (Kwak et al., 2013) (Figure S1A). We grouped genes containing RNAPII into three categories: paused, intermediate, and elongating (Figure 1B, left). We also classified genes without RNAPII in the gene body or at the TSS as a fourth category (Figure 1B, right). To examine interactions between the TSS and TTS of genes with different pausing indexes, we used Hi-C data with approximately 1 billion mapped reads in Kc167 cells that provide 250-bp resolution (Rowley et al., 2017). The results show an enrichment of interactions within the bodies of elongating genes, that is, intra-genic interactions, and these interactions decrease with the increase in pausing index (Figure 1C). To test whether these interactions are random or are mediated by RNAPII or other components of the transcription complex as it travels the gene body, we performed HiChIP for RNAPII using an antibody for RPB1 (Table S1). We combined these data with previously published RNAPII chromatin interaction analysis by paired-end tag sequencing (ChIA-PET) data (Rowley et al., 2017) and examined interactions at genes categorized by the pausing index as above. Metaplots of RNAPII HiChIP signal at 250-bp resolution show high contact frequencies between the TSSs and TTSs, and within the body, of elongating genes, and the frequency of these contacts correlates with the amount of pausing (Figure 1D). Paused genes display weak intragenic contacts, yet the frequency of interactions is higher than in genes without RNAPII (Figure 1D). These results suggest that sequences in elongating genes undergo frequent contacts mediated by RNAPII, since these interactions can be identified using RNAPII HiChIP. For example, the Diap1 gene contains high levels of RNAPII within the gene body indicative of transcription elongation (Figure 1E, bottom tracks). This gene shows frequent interactions within the gene body in RNAPII HiChIP (Figure 1E) and Hi-C data (Figure S1B). We compared the two datasets at elongating genes and found that RNAPII HiChIP enriches for interactions within elongating genes with respect to Hi-C (Figure S1C). We then used these data to estimate the relative frequency of intra-genic interactions by calling significant interactions from the RNAPII HiChIP data (see STAR Methods). First, we determined how many genes contained at least one significant intra-genic interaction, that is, where both anchors reside within the gene, and found that more elongating genes have intra-genic interactions than paused genes (Figure S1D). This analysis found that a large proportion of elongating genes contain at least one intra-genic interaction. We then asked whether elongating genes have a higher number of intra-genic interactions per gene compared to other gene categories by measuring the number of significant intra-genic interactions within each gene normalized by the total possible intra-genic bins. The results show that elongating genes form more intra-genic interactions per gene (Figure 1F). These observations indicate that transcription elongation or the presence of RNAPII in gene bodies correlates with a tendency to form intra-genic interactions.
Figure 1. Pausing Index Correlates with Frequency of Intra-genic Interactions.

(A) RNAPII ChIP-seq signal on genes ranked by pausing index.
(B) Left: histogram showing the pausing index cutoffs used to categorize elongating, mid, and paused genes. Right: RNAPII ChIP-seq signal on genes classified as “no RNAPII.”
(C) Metaplot of distance-normalized median Hi-C signal within genes categorized by the pausing index. Interactions within scaled genes as well as that same scaled distance upstream and downstream of the gene are shown.
(D) Metaplot of distance-normalized median RNAPII HiChIP signal within genes categorized by the pausing index. Interactions within scaled genes as well as that same scaled distance upstream and downstream of the gene are shown.
(E) RNAPII HiChIP signal at the elongating Diap1 gene showing intra-genic signal. RNAPII ChIP-seq signal is also shown.
(F) Significant RNAPII HiChIP interactions as a fraction of the total possible bin-to-bin (250-bp) interactions in paused (purple), mid (yellow), or elongating (blue) genes.
(G) Metaplot of differential Hi-C signal for samples treated with flavopiridol (FLV) compared to control (CTL) within elongating genes. Interactions within scaled genes as well as that same scaled distance upstream and downstream of the gene are shown. The average GRO-seq signal is shown above.
See also Figure S1 and Tables S1 and S2.
We used flavopiridol to inhibit transcription elongation without loss of RNAPII at TSSs. This can be seen by comparing ChIP-seq signal for RNAPII along genes in control and flavopiridol-treated cells (Figure S1E). To examine the effect of flavopiridol-induced RNAPII pausing on intra-gene interactions, we performed Hi-C after flavopiridol treatment and combined our data with a previously published dataset (Li et al., 2015). This tripled the number of Hi-C contacts in the dataset (Table S2), thereby providing sufficient resolution to examine intra-genic interactions by metaplot analysis. We found that genes undergoing elongation in the control show decreased intra-genic interactions after flavopiridol treatment (Figure 1G). Interestingly, the decrease in Hi-C signal was strongest for interactions extending from near the TSS to the TTS of genes (Figure 1G). This decrease occurs despite retention of RNAPII ChIP-seq signal at TSSs of these genes (Figure S1E), indicating that intra-genic interactions, sometimes referred to as gene loops or crumples (Chowdhary et al., 2017; O’Sullivan et al., 2004), are not solely mediated by RNAPII at TSSs but are dependent on either transcription elongation itself or on the presence of RNAPII within gene bodies, which is lost after flavopiridol treatment. We note that the Hi-C signal is also decreased outside of scaled genes after flavopiridol treatment, especially downstream of the gene. This is likely due to inefficient transcription termination, which is consistent with enriched GRO-seq signal downstream of genes (Figure 1G).
Compartmental Interactions Depend on RNAPII in Gene Bodies
Since transcription elongation, or the distribution of components of the transcription complex along gene bodies, is important for intra-genic interactions, we asked whether these factors could also play a role in the establishment of other features of 3D chromatin organization. We have previously shown that the Drosophila genome is organized into small compartmental domains formed by the segregation of active and inactive chromatin (Rowley et al., 2017). Analysis of Hi-C data suggests that interactions between active compartmental domains, that is, A-A interactions, appear much stronger than interactions between inactive compartmental domains, that is, B-B interactions (Figure 2A). This is more easily seen in distance normalized Hi-C heatmaps, where the signal at each site is divided by the average signal at the corresponding distance (Figure 2B). We confirmed this observation at a genome-wide level by obtaining metaplots of inter-compartmental domain interactions (Figure 2C). This indicates that A-A compartmental domain interactions are a predominant feature of high-resolution Hi-C heatmaps in Drosophila.
Figure 2. Elongating RNAPII Promotes A-A Compartmental Interactions.

(A) Example locus showing stronger Hi-C signal corresponding to A-A interactions versus B-B interactions.
(B) Knight-Ruiz (KR) normalized Hi-C heatmaps. Left: Hi-C signal normalized by the distance decay. Right: zoomed-in region of A-A and B-B interactions normalized by the distance decay. Tracks of Cap-H2, Rad21, and RNAPII ChIP-seq are shown. The eigenvector at 1-kb resolution depicting A (positive) and B (negative) compartments is also shown.
(C) Metaplot of distance-normalized Hi-C signal in 1-kb bins corresponding to compartmental interactions.
(D) Distribution of significant RNAPII HiChIP interactions where at least one anchor overlaps a TSS (TSS-TSS or TSS-Gene Body) or where both anchors overlap only gene bodies (Gene-Gene Body). Interactions that do not overlap genes on either anchor are shown as Other.
(E) Correlation between RNAPII ChIP-seq signal (x axis) and the eigenvector at 1-kb resolution (y axis). Pearson R = 0.59.
(F) Profiles of the compartmental eigenvector across scaled genes and that same scaled distance upstream and downstream. Genes with no RNAPII (black) and those divided into 10 categories based on the pausing index (rainbow) are shown.
(G) Profiles showing the difference in the compartmental eigenvector obtained from Hi-C after flavopiridol treatment (FLV) compared to the control (CTL) across elongating (solid line) and paused (dashed line) genes categorized in Figure 1A.
(H) Metaplot of differential Hi-C signal for samples treated with flavopiridol (FLV) compared to the control (CTL). Interactions within and between scaled A and B compartments are shown.
Because Drosophila A compartmental domains are enriched for RNAPII (Figure 2A, see tracks on top of Hi-C heatmap), we tested whether RNAPII HiChIP data are enriched for these interactions. We detect A-A compartmental interactions by RNAPII HiChIP at example loci (Figure S2A) and find enrichment in A versus B compartmental domains in RNAPII HiChIP compared to Hi-C (Figure S2B). We then examined the distribution of significantly called RNAPII HiChIP interactions and found that they occur either inside active compartmental domains, that is, intra-A, or between two distinct active compartmental domains, that is, inter-A (Figure S2C). RNAPII is highly enriched at TSSs of paused and elongating genes and in the bodies of elongating genes (Figure 1A); thus, we tested whether A-A interactions occur between TSSs or if they also incorporate gene bodies. We found that while many of the RNAPII HiChIP A-A interactions have at least one 250-bp anchor at the TSS, a large proportion of interactions occurs solely between gene bodies (Figure 2D). To further examine the composition of A-A interactions, we examined the frequency of overlap with each gene category. We found the TSSs of paused, mid, and elongating genes have an equal probability of forming A-A interactions (Figure S2D, red). However, gene bodies of elongating genes are more likely to form A-A interactions than the bodies of paused genes (Figure S2D, yellow and purple). This indicates that the presence of RNAPII, whether at paused TSSs or in gene bodies, correlates with the formation of A-A compartmental interactions. To examine this more closely, we calculated the Hi-C A/B compartmental signal at 1-kb resolution as determined by positive or negative eigenvector, respectively (see STAR Methods). We then compared the eigenvector to RNAPII signal in each 1-kb bin and found a correlation between A/B compartmental signal and RNAPII genome-wide (Figure 2E). This indicates that levels of RNAPII occupancy correlate with formation of A or B compartments. To test whether the amount of RNAPII within gene bodies correlates with compartmental signal, we created 11 equal categories of genes based on the pausing index (Figure S2E) and then plotted the median Hi-C A/B compartmental signal from the eigenvector across genes. Genes without RNAPII at the TSS or in the gene body have negative eigenvector signal corresponding to their presence in B compartments (Figure 2E, black). Meanwhile, elongating genes that have RNAPII throughout the gene body have positive eigenvector signal both at the TSS and throughout the gene body indicative of complete incorporation into A compartments (Figure 2E, red). Interestingly, paused genes that have RNAPII only at the TSS have positive eigenvector at the TSS and negative eigenvector throughout the gene body indicative of incorporation of only the TSS into A compartments (Figure 2F). These results show compartmentalization of the genome at an unprecedented scale, such that the TSSs of paused genes associate with A compartments, while their bodies, which lack RNAPII, associate with B compartments.
Due to the correlation between the bodies of elongating genes and A-A compartmental interactions, we tested whether RNAPII within gene bodies is important for A-A interactions by comparing Hi-C data between control and flavopiridol-treated cells. First, we plotted the difference in the eigenvector on paused and elongating genes and found that, while paused genes show no change, elongating genes have decreased eigenvector signal, indicating a movement away from A compartments (Figures 2G and S2F). We then examined what happens to compartments in general using a metaplot analysis of inter-compartmental interactions. We found overall decreased A-A interactions after inhibition of transcription elongation (Figure 2H). This reflects the decrease in A-A compartmental interactions seen when comparing Hi-C heatmaps at individual loci (Figure S2G). Altogether, these data indicate that RNAPII within gene bodies is important for active compartment interactions.
Transcription Elongation versus RNAPII in Gene Bodies in Mediating Chromatin Organization
Although we find a correlation between intra-genic interactions, inter-compartmental domain interactions, and transcription elongation, it is unclear whether these organizational features result from the presence of RNAPII within the gene body or arise due to the transcription elongation process. If the transcription elongation process is the defining factor in gene loop formation, we reasoned that the interaction frequency should be constant throughout elongating genes. However, if the presence of RNAPII is important, then the interaction frequency should correspond to distinct local levels of RNAPII within the gene body. We identified genomic regions located between the TSS and TTS of transcribed genes that have elevated RNAPII ChIP-seq signal compared to the rest of the gene body excluding 500 bp near the TSS and the TTS (Figure 3A, black). We then plotted the Hi-C interaction signal between the TSS and the rest of the gene via virtual 4C in 250-bp bins and found that interactions are highest at the summit of internal RNAPII peaks (Figure 3A, blue). We obtained similar results with RNAPII HiChIP (Figure S3A). Thus, sub-genic RNAPII signal correlates with interaction signal. Flv treatment results in inhibition of transcription elongation and a decrease of RNAPII signal within gene bodies; therefore, we tested whether changes in intra-genic interactions correlate with either widespread changes distributed across the gene or to more localized changes coinciding with changes to sub-genic RNAPII sites of enrichment. We plotted the average difference in interaction signal across genes in 250-bp bins and found that the largest interaction differences coincide with the largest sub-genic RNAPII differences (Figure S3B). This suggests that RNAPII occupancy, rather than transcription elongation, is the determinant of intragenic interaction frequency.
Figure 3. RNAPII versus Transcription Elongation in Chromatin Organization.

(A) Average distance-normalized Hi-C signal between the TSS and gene body (blue), and RNAPII ChIP-seq signal (black), across the gene portion between the TSS, internal RNAPII peak, and the TTS.
(B) Hi-C from mouse sperm showing the overlap of RNAPIISer2ph ChIP-seq signal (top track) and A compartments (green).
(C) Metaplot of distance-normalized average Hi-C signal within genes categorized as having low (left) or high (right) RNAPIISer2ph ChIP-seq signal. See also Figure S3.
To further address the question of whether the process of transcription elongation or the presence of RNAPII are responsible for intragenic interactions, we examined published Hi-C data from mouse sperm (Jung et al., 2017). Mouse sperm do not actively transcribe yet retain RNAPIISer2ph binding at thousands of genes (Y.H. Jung, personal communication; GSE116857) and display clear A and B compartments by Hi-C (Figure 3B). By comparing RNAPIISer2ph ChIP-seq data in mouse sperm to compartment calls at 25-kb resolution, we found that 95% of RNAPIISer2ph peaks are found in A compartmental domains (Figures 3B and S3C). We then categorized genes by levels of RNAPIISer2ph (Figure S3D) and plotted the average intra-genic interaction signal for each category. Genes with low levels of RNAPIISer2ph display weak interaction signal (Figure 3C, left). However, genes with high levels of RNAPIISer2ph display strong intra-genic interactions (Figure 3C, right). Indeed, the levels of RNAPIISer2ph in genes correlate with the intra-genic interaction frequency (Figure S3E). Therefore, sperm genes are not transcribed but display clear intra-genic interactions and compartments, suggesting that these interactions are most likely mediated by RNAPII or other components of the transcription complex.
Cohesin and RNAPII Maintain Chromatin Organization in Genes and Active Compartments
In mammalian cells, cohesin depletion has a large effect on chromatin organization (Rao et al., 2017; Schwarzer et al., 2017; Wutz et al., 2017). We thus asked whether cohesin plays a role in chromatin organization in Drosophila by performing HiChIP for Rad21 and identifying significant interactions (Table S3). We examined Rad21 interactions and found that 77% of contacts mediated by Rad21 occur between anchors containing both Rad21 and RNAPII, rather than Rad21 alone (Figure 4A). Furthermore, the presence of RNAPII at Rad21 interaction anchors is higher than expected from genome-wide overlap of RNAPII and Rad21 ChIP-seq peaks (Figure 4A). Since we saw an enrichment of RNAPII at Rad21 interaction anchors, we examined whether we could detect Rad21 interactions in the RNAPII HiChIP data. We performed a metaplot analysis of significantly called Rad21 interactions and did indeed find an enrichment of RNAPII HiChIP signal at Rad21 anchors (Figure 4B). These results indicate that cohesin interactions often coincide with RNAPII interactions.
Figure 4. Cohesin Mediates Chromatin Organization in Transcriptionally Active Regions.

(A) Left: percentage of Rad21 ChIP-seq peaks that overlap (blue) or do not overlap (green) with RNAPII peaks. Right: percentage of Rad21 ChIP-seq peaks on significant interaction anchors that overlap (blue) or do not overlap (green) with RNAPII peaks.
(B) Metaplot of HiChIP signal for Rad21 (left) or RNAPII (right) on Rad21 significant interaction anchors. Signal score (APA) is calculated based on Hi-C strength of the center pixel versus the background (a 3 × 3 grid in the top right corner).
(C) Rad21 ChIP-seq signal in the bodies of genes categorized by the pausing index. To exclude TSS signal, only the portion of the gene body between +500 bp and the TTS was considered.
(D) Metaplot showing the difference between Rad21 HiChIP and Hi-C signals in elongating genes. Interactions within scaled genes as well as within that same scaled distance upstream and downstream of the gene are shown.
(E) Metaplot of differential Hi-C signal for samples after depletion of Rad21 (Rad21 KD) compared to the control (CTL) in elongating genes. Interactions within scaled genes as well as within that same scaled distance upstream and downstream of the gene are shown.
(F) Metaplot of differential Hi-C signal for samples after depletion of Rad21 (Rad21 KD) compared to the control (CTL). Interactions within and between scaled A and B compartments are shown.
Elongating genes have a high degree of intra-genic interactions that are reduced upon depletion of RNAPII from gene bodies via inhibition of transcription elongation. Because of the high overlap between Rad21 interactions and RNAPII, we next asked whether intra-genic interactions are dependent on cohesin. First, we plotted Rad21 ChIP-seq signal on genes and found that the bodies of elongating genes show higher Rad21 ChIP-seq signal than paused genes (Figures 4C and S4A). We then tested whether intra-genic interactions are enriched in Rad21 Hi-ChIP data (Table S3). Indeed, the level of intra-genic interactions in Rad21 HiChIP signal corresponds to the elongation status of genes (Figure S4B). Furthermore, Rad21 HiChIP enriches for intra-genic interactions more when compared to Hi-C (Figure 4D). To test whether intra-genic interactions depend on cohesin, we examined the effect of Rad21 knockdown (KD) (Figure S4C) on interactions at elongating genes using Hi-C. We found a decrease in intra-genic Hi-C signal in Rad21 KD compared to the control (Figure 4E), which was similar to what we saw when inhibiting transcription elongation (Figure 1F). These results suggest that intra-genic interactions depend on both elongating RNAPII and cohesin.
To further characterize the effects of cohesin depletion on chromatin organization, we examined the distribution of cohesin interactions identified by HiChIP. We found enrichment of cohesin interactions inside and between A compartmental domains (Figure S4D). We also found that Rad21 HiChIP shows enrichment of signal for A-A interactions compared to Hi-C (Figure S4E), which is consistent with Rad21 occupying transcriptionally active regions. Since we saw a decrease in intra-genic interactions within genes undergoing elongation in Rad21 KD cells, we examined how depletion of this protein affects interactions between active compartmental domains. We tested whether the A-A interaction frequency depends on cohesin by comparing Hi-C after RAD21 KD to the control and found a decrease in A-A interactions in cells depleted of Rad21 (Figure 4F). These results contrast with those obtained in mammalian cells, where depletion of cohesin results in more nuanced changes to compartmental organization (Rao et al., 2017; Schwarzer et al., 2017; Wutz et al., 2017).
Altogether, these observations suggest that gene loops and A-A inter-compartmental interactions in Drosophila depend on both cohesin and RNAPII. Transcription has been proposed to influence cohesin distribution in yeast and mammals, and thus may influence 3D chromatin organization by pushing cohesin (Busslinger et al., 2017; Davidson et al., 2016; Ocampo-Hafalla et al., 2016). We tested this hypothesis by performing ChIP-seq for Rad21 after flavopiridol treatment for 3 h as was done for the Hi-C experiments. We found no apparent change to cohesin enrichment in gene bodies after this treatment (Figure S4F). It has also been suggested that cohesin may help RNAPII transition from a paused to elongating state in Drosophila (Schaaf et al., 2013). We tested whether cohesin may affect the distribution of RNAPII by performing ChIP-seq for RNAPII in control and Rad21 KD cells. As previously shown (Schaaf et al., 2013), we found a slight increase of RNAPII at TSSs after Rad21 KD, but these effects were small (Figure S4G). Therefore, the loss of intragenic interactions cannot be attributed to changes to RNAPII distribution via cohesin. Because depletion of RNAPII and depletion of cohesin each affect chromatin organization without an obvious effect on each other, we conclude that cohesin and RNAPII independently contribute to chromatin organization.
Condensin II Inhibits Chromatin Interactions in Genes and Active Compartments
Condensin II has a similar ring structure as cohesin, and there is evidence that this complex is also important for proper chromatin organization, although most studies in mammals have focused on its role during mitosis. We used ChIP-seq to examine the location of Cap-H2, a subunit of condensin II, and found extensive co-localization of this protein with RNAPII (Figures 5A and S5A). We also find that Cap-H2 is enriched in the bodies of genes undergoing transcription elongation as is the case for cohesin (Figure 5B). We examined the relative distribution of cohesin and condensin II using Rad21 and Cap-H2 ChIP-seq data, and found extensive enrichment of Cap-H2 at Rad21 sites (Figure S5B). Given the overlap in the localization of these two proteins, we decided to examine the role of condensin II in 3D chromatin organization. We first examined intra-genic interactions using Hi-C after Cap-H2 knockdown (Figure S5C) (Li et al., 2015). Despite the correlation between Cap-H2 and Rad21 genome distribution, depletion of Cap-H2 results in an increase in intra-genic interactions, which is opposite to the effect seen by depletion of Rad21 (Figure 5C). We note that this increase was highest within genes. Levels of condensin II are regulated by the SCF/Slimb ubiquitin ligase, which promotes degradation of Cap-H2 (Figure S5C) (Joyce et al., 2016). We performed Hi-C after Slimb knockdown to test whether elevated levels of Cap-H2 have the opposite effect of Cap-H2 depletion on chromatin organization (Table S4). Differential metaplot analysis of elongating genes shows decreased intra-genic interactions after Slimb knockdown (Figure 5D), the opposite effect to Cap-H2 knockdown. Together with the effects of Cap-H2 knockdown, these results suggest that condensin II binds to active genes and inhibits intra-genic interactions. Because we detected enrichment of Cap-H2 inside elongating genes, we examined whether the inhibition of transcription elongation or the depletion of Cap-H2 affected each other. We performed ChIP-seq for Cap-H2 in control and flavopiridol-treated cells and found no change in Cap-H2 signal within gene bodies (Figure S5D). We also performed ChIP-seq for RNAPII after Cap-H2 knockdown and found no change in its intragenic distribution (Figure S5E). These results suggest that transcription elongation and Cap-H2 act independently of each other in the establishment of gene loops.
Figure 5. Condensin II Inhibits Chromatin Organization in Transcriptionally Active Regions.

(A) Percentage of Cap-H2 ChIP-seq peaks that overlap (blue) or do not overlap (green) RNAPII peaks.
(B) Cap-H2 ChIP-seq signal in the bodies of genes categorized by the pausing index. To exclude TSS signal, only the portion of the gene body between +500 bp and the TTS was considered.
(C) Metaplot of differential Hi-C signal for samples obtained after depletion of Cap-H2 (Cap-H2 KD) compared to the control (CTL) in elongating genes. Interactions within scaled genes as well as with that same scaled distance upstream and downstream of the gene are shown.
(D) Metaplot of differential Hi-C signal for samples obtained after depletion of Slimb (Slimb KD) compared to the control (CTL) in elongating genes. Interactions within scaled genes as well as with that same scaled distance upstream and downstream of the gene are shown.
(E) Metaplot of differential Hi-C signal for samples obtained after depletion of Cap-H2 (Cap-H2 KD) compared to the control (CTL). Interactions within and between scaled A and B compartments are shown.
(F) Metaplot of differential Hi-C signal for samples obtained after depletion of Slimb (Slimb KD) compared to the control (CTL). Interactions within and between scaled A and B compartments are shown.
We next tested whether condensin II plays a role in compartmental interactions. We found that 95% of Cap-H2 peaks occur inside A compartmental domains, which is consistent with the enrichment of this protein at RNAPII bound loci (Figure S5F). Metaplot analysis of compartmental interactions found that Cap-H2 knockdown results in increased A-A interactions (Figure 5E). In agreement with this finding, Slimb knockdown has the opposite, yet more modest effect (Figure 5F). Because Cap-H2 is highly enriched in A compartmental domains, these results suggest that condensin II inhibits interactions in active chromatin, where it is present. On the other hand, increasing the levels of Cap-H2 by knocking down Slimb results in a decrease in interactions between A compartmental domains (Figure 5F). Altogether, these observations suggest that the role of Cap-H2 in 3D chromatin organization counteracts that of cohesin and transcription elongation. An example of this is shown in Figure S5G, where each A compartmental domain displays increased interactions with every other A compartmental domain after Cap-H2 knockdown (Figure S5G, left). In contrast, interactions between A compartmental domains are decreased after Rad21 knockdown (Figure S5G, right).
Pc Loops Are Independent of Transcription Elongation, Cohesin, and Condensin II
In mammalian cells, Hi-C maps show thousands of intense punctate signal representing CTCF/cohesin loops (Rao et al., 2014). The loss of Rad21 or CTCF results in the demise of these loops (Nora et al., 2017; Rao et al., 2017; Schwarzer et al., 2017; Wutz et al., 2017). Intense punctate signal can also be observed in Drosophila Hi-C data, and 458 loops corresponding to this signal have been identified (Cubeñas-Potts et al., 2017). These loops correspond to interactions between anchors enriched in several architectural proteins and Pc but lacking CTCF, and these anchors are not present at domain borders (Cubeñas-Potts et al., 2017; Eagen et al., 2017; Ogiyama et al., 2018; Rowley et al., 2017). However, similar to CTCF loops in mammals, Drosophila loop anchors are enriched in Rad21 (Cubeñas-Potts et al., 2017), suggesting that these loops could be formed by cohesin-mediated extrusion (Figure 6A). We thus asked whether cohesin is required for the establishment of these loops by examining Hi-C obtained in cells knocked down for Rad21. Metaplot analysis of these loops shows no difference in intensity after Rad21 KD, indicating that their formation is not dependent on cohesin (Figure 6B, top right). Because we found that transcription elongation was important for other features of chromatin organization, we asked whether Pc loops are affected by flavopiridol treatment. Pc loops were not decreased after inhibiting transcription elongation, indicating that they are formed independent of this process (Figure 6B, bottom left). Condensin has been shown to extrude loops in vitro (Ganji et al., 2018). However, condensin II is not found at these loop anchors (see Figure 6A for an example) (Cubeñas-Potts et al., 2017). We nevertheless tested whether condensin II depletion in Cap-H2 KD cells affects the formation of these loops but found no difference with respect to control cells (Figure 6B, bottom right). These results suggest that Pc loops form independently of the major candidate molecules that could perform loop extrusion.
Figure 6. Pc Loops Are Independent of Transcription, Cohesin, and Condensin II.

(A) Hi-C heatmap showing a strong loop identified using Hi-C computational unbiased peak search (HiCCUPS; arrowhead). Cap-H2, Rad21, RNAPII, and Pc ChIP-seq tracks are shown. The eigenvector showing A and B compartmental domains is also shown.
(B) Metaplot of Hi-C signal in control WT compared to Rad21 knockdown (Rad21 KD), cells treated with flavopiridol (FLV), and Cap-H2 knockdown (Cap-H2 KD). Signal score (APA) is calculated based on Hi-C strength of the center pixel versus the background (a 3 × 3 grid in the top right corner).
Homolog Pairing Is Distinct from Long-Range Intrachromosomal Interactions
Homologous chromosomes are closely paired in Drosophila cells. This close pairing is responsible for the phenomenon of inter-allelic complementation known as transvection (Fukaya and Levine, 2017), which has been explained by the ability of enhancers in one chromosome to activate transcription from a promoter located in the other paired homolog (Geyer et al., 1990). One well-studied function of condensin II in Drosophila is its ability to partially inhibit pairing between homologous chromosomes in interphase (Hartl et al., 2008; Smith et al., 2013; Wallace et al., 2015). Interactions between homologs have traditionally been studied by FISH, which uses probes that recognize hundreds of kilobases or even multi-megabases of sequence, thereby limiting resolution (Joyce et al., 2012; Wallace et al., 2015). Results from this type of experiments have not been able to conclude if homolog pairing takes place continuously throughout the length of the chromosomes or at specific sites bound by distinct proteins. To examine homologous chromosome pairing at high resolution, we developed a pipeline to detect homolog pairing interactions using Hi-C data. In Hi-C, paired-end reads that map to the same DpnII restriction fragment represent a mixture of two distinct ligation types: self-circularization within a single fragment of DNA, or ligation between homologous chromosomes due to chromosome pairing (Figure 7A). Based on the orientation of paired reads with respect to each other, we filtered out all possible self-circularization events. This approach also filters reads where interactions between homologs are indiscernible from self-circularization (Figure 7A). Using this dataset, we created profiles of chromosome pairing between homologous regions across the genome (Figure 7B). We refer to data derived by this method as hd-pairing (Hi-C-derived pairing).
Figure 7. Homolog Pairing Occurs at Small Discrete Loci Enriched in Architectural Proteins.

(A) Schematic outline of different types of Hi-C reads and identification of those that detect interactions between homologous chromosomes.
(B) Example showing the hd-pairing profile around the 16E1 locus, which has also been studied by FISH to identify pairing regions. A and B compartmental domains are denoted by green and purple boxes, respectively.
(C) Pairing signal in cytogenetic bands 8C8, 16E1, and 28B1 as detected by FISH (Williams et al., 2007) (green) compared to hd-pairing detected by Hi-C (blue).
(D) hd-pairing signal in A (green) compared to B (purple) compartmental domains. *p < 0.01, Wilcoxon rank sum test.
(E) Effects of Cap-H2 depletion (Cap-H2 KD) on pairing in A (green) or B (purple) compartmental domains. *p < 0.01, Wilcoxon rank sum test. Dashed line indicates zero, that is, no change.
(F) Profile of hd-pairing at Cap-H2 peaks (solid lines) or random sites (dashes) in the control (teal), after depletion of Cap-H2 (orange), or depletion of Slimb (purple).
(G) Profile of hd-pairing at architectural protein binding sites (APBSs) containing different numbers of proteins (1–4, blue; 5–8, orange; 8–12, purple; R13, red).
(H) Odds ratio of hd-pairing peaks (y axis) overlapping APBSs occupied by different numbers of architectural proteins (x axis). See also Figure S6.
Because Hi-C was performed on unsynchronized Kc167 cells that reside mainly in G2 (Williams et al., 2007), this method might detect pairing between homologs as well as pairing between sister chromatids. To test this possibility, we examined hd-pairing signal using Hi-C data obtained in unsynchronized and G1 S2 cells (Wang et al., 2018). hd-pairing is similar between G1 and unsynchronized cells at example loci (Figure S6A). Additionally, we compared hd-pairing signal in 1-kb bins genome-wide and observed a high correlation between G1 and unsynchronized cells (Pearson R = 0.86). Furthermore, differential peak calling using MAnorm (Shao et al., 2012) found 99.6% of peaks were common to both datasets (Figure S6B). This indicates that hd-pairing signal detects homolog pairing and not sister chromatid pairing. This could indicate that sister chromatid pairing does not occur at discrete sites, resulting in no sister chromatid specific peaks in hd-pairing data. Alternatively, because the mechanism of pairing may be similar between homologs and sister chromatids, it is possible that both types of pairing occur at the same sites (Senaratne et al., 2016). In this scenario, sister chromatid and homolog pairing would be indistinguishable by our method. To further confirm that hd-pairing detects interactions between homologs, we examined known loci where pairing has been measured by FISH (Williams et al., 2007) corresponding to cytobands 16E1, 8C8, 44F1, and 28B1 and calculated the pairing within these regions as the average hd-pairing signal across DpnII bins. The hd-pairing signal between these loci matches the ranking of pairing signal reported by FISH but provides more dynamic range between loci (Figure 7C).
Visual inspection of hd-pairing data in 1-kb bins shows distinct peaks of high-frequency pairing (Figure 7B). Using MACS2, we identified 14,727 peaks in Kc167 cells (q < 1e–10) with an average size of 6.4 kb and an average distance of 2.9 kb between peaks (Figure S6C). The finding of specific peaks spaced a few kilobases apart, rather than signal of uniform frequency, supports a “button”-type model of chromosome pairing. Results from FISH experiments have previously shown that euchromatin engages more frequently in homolog pairing than heterochromatin (Williams et al., 2007). We therefore tested whether hd sites of chromosome pairing are enriched in active regions of the genome. Indeed, boxplots of hd-pairing frequency in A and B compartmental domains indicate slightly higher chromosome pairing in active regions present in A compartmental domains (Figure 7D). Since the average size of hd peaks is 6.4 kb and the average sizes of A and B compartmental domains in Drosophila are 25 and 63 kb, respectively, these results suggest that pairing “buttons” are smaller than A and B compartmental domains (Figure 7B).
Because Cap-H2 affects transvection in Drosophila, we next evaluated the role of Cap-H2 on pairing interactions at high resolution. We utilized the pipeline described in Figure 7A to identify hd-pairing reads from Hi-C performed in Cap-H2 knockdown Kc167 cells. Cap-H2 is known to at least partially inhibit pairing between homologous chromosomes (Joyce et al., 2016), yet Cap-H2 is only present in A compartmental domains, where hd-pairing is slightly higher than in other regions of the genome (Figure 7D). This suggests that Cap-H2 may bind to hd-paired regions to mediate a limited degree of unpairing. We examined hd-pairing after Cap-H2 knockdown and found a general increase of hd-pairing signal in A compartmental domains (Figure 7E). This confirms that Cap-H2 either inhibits pairing or may actively unpair active chromatin in the regions where it is bound in the genome. To more precisely examine the effect of Cap-H2 on homologous chromosome pairing, we plotted the average profile of hd-pairing reads around the summit of Cap-H2 binding sites. The resulting profiles indicate that hd-pairing at Cap-H2 binding sites is higher than random regions (Figure 7F, solid line compared to dashed line). Interestingly, hd-pairing signal dips at the Cap-H2 summit, which could suggest partial inhibition by Cap-H2. We then plotted hd-pairing reads obtained from Hi-C after Cap-H2 or Slimb knockdown and found that Cap-H2 depletion results in increased hd-pairing (Figures 7F and S6D), whereas depletion of Slimb, which causes an increase in Cap-H2, results in decreased hd-pairing (Figures 7F and S6E). These changes in pairing occur in the ~2-kb region surrounding Cap-H2 peaks, providing further support to the finding that pairing buttons are very short regions of the genome, and that changes after Cap-H2 depletion occur directly at Cap-H2 binding sites.
It is possible that interactions between homologous chromosomes are regulated by similar mechanisms that regulate long-range intra-chromosomal interactions. For instance, we found that Cap-H2 localizes to active compartmental domains where it inhibits intra-chromosomal interactions as well as interactions between homologous chromosomes. We therefore used Hi-C from Kc167 cells depleted of Rad21 or treated with flavopiridol to inhibit transcription elongation to examine whether hd-pairing is affected under either of these conditions. We calculated the approximate number of 1-kb bins with decreased or increased hd-pairing signal and found that the effects of Rad21 depletion and inhibition of transcription by flavopiridol are comparatively minor (Figures S6D and S6E). This is consistent with analyses of homolog pairing after Rad21 depletion using FISH at specific loci (Joyce et al., 2012; Senaratne et al., 2016). These results suggest that Rad21 and RNAPII do not play a major role in homolog pairing.
It was recently found that transvection and the stability of pairing between homologous chromosomes depends on the presence of architectural proteins (Lim et al., 2018). We tested these observations by plotting hd-pairing signal across architectural protein binding sites and found that higher pairing signal coincides with the presence of more architectural proteins, that is, higher architectural protein binding site (APBS) occupancy (Figure 7G) (Van Bortle et al., 2014). However, some of these architectural proteins may bind to pairing sites to mediate unpairing, as is the case for Cap-H2. To further test the correlation between the presence of architectural proteins and hd-pairing sites, we overlapped hd-pairing peaks with ChIP-seq peaks for 18 different architectural proteins and created an odds ratio that describes this overlap compared to the overlap with random ATAC-seq peaks. Results from this analysis confirm that higher APBS occupancy coincides with a higher overlap between architectural protein and hd-pairing peaks (Figure 7H). To test whether any single or pairs of architectural proteins could account for pairing, we compared the hd-pairing odds ratios for each protein as well as for each pair of proteins. Results suggest that no one single architectural protein of the 18 tested can explain pairing (Figure S6E, diagonal). Additionally, pairing is generally slightly more likely when two architectural proteins are bound than just one. IBF1 and IBF2 showed the highest overlap with pairing sites; however, no single or double combination of architectural proteins was particularly high (Figure S6F). Interestingly, Su(Hw), Mod(mdg4), L(3)MBT, and CP190 overlap less with hd-pairing peaks than expected by chance, but this depletion of hd-pairing is not seen when found in combination with any other architectural protein, indicating that multiple architectural proteins promote pairing (Figure S6F). Overall, these results suggest that loci where architectural proteins cluster in the genome may represent the buttons responsible for the maintenance of pairing between homologous chromosomes in Drosophila.
DISCUSSION
Results presented here support a model of chromatin organization where RNAPII and cohesin promote interactions within genes to create small gene domains. Interactions between adjacent gene domains result in the formation of active compartmental domains, and interactions among these domains give rise to the characteristic plaid pattern of Hi-C heatmaps often referred to as the A compartment. The frequency of interactions within and between genes and A compartmental domains correlates with the amount of RNAPII and cohesin, which co-localize extensively in the genome. Because of this, the allocation of a specific sequence to the A compartment should not be done in absolute terms. Rather, sequences in the A compartment have different positive eigenvector values that correlate with the amount of RNAPII and cohesin. Contiguous sequences lacking RNAPII and cohesin have a negative eigenvector value and form B compartmental domains. Interactions among B compartmental domains in Drosophila are more infrequent compared to those among A compartmental domains, that is, the plaid pattern of Hi-C heatmaps in Drosophila arises in large part due to interactions between A compartments. However, sequences within B compartmental domains interact as frequently as those located in A domains. These interactions may arise as a consequence of proteins present in silenced genes. Alternatively, or in addition, interactions within B compartmental domains may result from interactions between adjacent A domains, which enclose B domains within loops similar to those formed by CTCF/cohesin in vertebrates. This is supported by results showing that inhibition of transcription initiation with triptolide or using the heat shock response, which result in the loss of A compartmental domains, also result in decreased interaction frequencies within B domains (Rowley et al., 2017).
Our findings suggest that, whereas interaction frequency of sequences in active genes correlates with transcription elongation, it is likely that the presence of RNAPII, or other components of the transcription/elongation complexes, is a better candidate to explain the correlation between transcription and 3D organization. Inhibition of transcription results in dramatic changes to chromatin domains in Drosophila (Hug et al., 2017; Li et al., 2015; Rowley et al., 2017), yet transcription inhibition was reported to have little effect in mammalian embryonic nuclei (Du et al., 2017; Ke et al., 2017). We speculate that transcription inhibition studies in mammalian cells could be affected by the prevalence of CTCF loop domains. These loops may tether chromatin together such that inhibition of transcription for short periods of time is insufficient to disrupt chromatin organization. Meanwhile, in organisms that lack CTCF loops, such as Drosophila and prokaryotes, the larger effect of transcription inhibition may be due to the lack of point-to-point chromatin tethering by CTCF loops. It would be interesting to analyze whether absence of transcription or depletion of RNAPII with inhibitors such as triptolide have a stronger effect in cells depleted of CTCF.
Previous results have shown a role for condensin II in chromatin structure during interphase (Cobbe et al., 2006). Condensin II colocalizes extensively with Drosophila architectural proteins (Van Bortle et al., 2014), but in spite of the similar distribution, some observations suggest a distinct role for Cap-H2 in chromatin biology with respect to other architectural proteins. For example, all architectural proteins, including Rad21, are re-distributed during the heat shock response and they accumulate at enhancer sequences. However, the amount of enhancer-bound Cap-H2 and the number of occupied enhancers decreases after temperature stress (Li et al., 2015). These observations may be explained by the opposing roles that condensin II and cohesin play in mediating intra-chromosomal interactions. Condensin II is present in active chromatin but it antagonizes the formation of gene domains and A compartmental domains, and condensin II depletion results in an increase to long-range A-A compartmental interactions. These results are in line with recent observations indicating that chromosome volume, as detected by Oligopaint, increases in Cap-H2 knockdown Drosophila cells (Rosin et al., 2018). The mechanisms by which these two SMC motors play opposing role in chromatin interactions is unclear. Presumably, their function in chromatin 3D organization is related to their ability to extrude loops, as was proposed for cohesin in mammals. Condensin has also been shown to extrude loops in vitro (Ganji et al., 2018), and it would be interesting to understand whether its role, opposite to that of cohesin, is based on different potential extrusion mechanisms between these two complexes. Thus, condensin II could antagonize cohesin interactions by directly inhibiting these same interactions or by promoting different interactions.
Drosophila chromosomes participate in extensive homologous chromosome pairing, but the details of the mechanisms underlying this phenomenon are not well understood (Joyce et al., 2016). Analysis of Hi-C data support a button model of pairing, where the buttons are short pairing sites likely corresponding to binding sites for specific proteins, rather than large domains. These pairing sites are enriched in architectural proteins, including Rad21 and Cap-H2. Although depletion of Rad21 only has no effect on pairing, it is possible that some architectural proteins may promote pairing while others act as anti-pairers, as is the case for Cap-H2. The general antagonistic role of condensin II in the establishment of interactions between homologs as well as short- and long-range intra-chromosomal contacts suggests common mechanisms responsible for these apparently different phenomena.
STAR★METHODS
CONTACT FOR REAGENT AND RESOURCE SHARING
Further information and requests for resources and reagents should be directed to and will be fulfilled by the Lead Contact, Victor Corces (vgcorces@gmail.com; phone, 404-727-4250; fax, 404-727-2880).
EXPERIMENTAL MODEL AND SUBJECT DETAILS
Cell Lines
Kc167 cells derived from a Drosophila melanogaster female embryo at the dorsal closure stage were obtained from the Drosophila Genomics Resource Center. Cells were grown at 25°C in Hyclone SFX insect culture media (GE Healthcare).
Animals
Sperm data were obtained from Jung et al. (2017) and Y.H. Jung (personal communication; GSE116857). Mice were maintained and handled in accordance with the Institutional Animal Care and Use policies at Emory University. Mice were housed in standard cages on a 12: 12 h light: dark cycle and given ad lib access to food and water. Healthy 8-week old CD1 mice (Charles River Labs) not involved in previous procedures were used for sperm isolation. No genotyping was performed.
METHOD DETAILS
Isolation of mouse sperm
To obtain mature sperm, the cauda epididymis was dissected from 8–10-week-old CD1 mice (Charles River Labs) after euthanasia via CO2 asphyxiation. To eliminate blood vessels and fat, the cauda epididymis was rinsed and deposited in Donners medium, punctured with a needle, and the sperm were allowed to swim out for 10–15 min. Sperm suspension was transferred to a tube, pelleted, and rinsed in PBS twice.
RNAi and Transcription Inhibition
RNAi and western analyses were performed exactly as described, using primers for Cap-H2 and Rad21 previously reported (Li et al., 2015) and primers for Slimb as described before (Nguyen et al., 2015). Inhibition of transcription elongation was done by treating Kc167 cells with 1 mM flavopiridol for 3 h (Li et al., 2015).
ChIP-seq
ChIP-seq libraries for RNAPII before and after Rad21 or Cap-H2 knockdown, as well as Cap-H2 and Rad21 with and without flavopiridol treatment were prepared in Kc167 cells as described (Cubeñas-Potts et al., 2017). Reads were mapped to the Drosophila genome (dm6) and duplicates were removed. Replicates were processed and inspected individual and the combined. When examining peaks in the control, combined published datasets were used, but when examining differences between conditions only those prepared together were compared to reduce technical biases. Peaks were identified using MACS2 (Zhang et al., 2008). APBS occupancy i.e., clustering of architectural proteins at specific genomic sites for Mod(mg4), Chromator, Z4, Fs(1)h-L, Su(Hw), L(3) MBT, Nup98, Cap-H2, CP190, CTCF, Rad21, BEAF-32, DREF, ZIPIC, TFIIIC, PITA, IBF1, and IBF2 were identified as described (Rowley et al., 2017). ChIP-seq profiles across genes were generated by dividing each gene into 20 equally sized bins and counting the number of reads in each bin normalized by signal obtained by ChIP-seq for IgG. The pausing index was calculated as described (Zeitlinger et al., 2007) and independently validated using RNAPII ChIP-seq and GRO-seq data (Core et al., 2014; Li et al., 2015). Internal RNAPII sites were identified by taking the maximum RNAPII/IgG signal in 250 bp bins internal to genes and that were at least 500 bp from the TSS and TTS.
Hi-C and HiChIP
Hi-C and HiChIP libraries were prepared as described (Cubeñas-Potts et al., 2017; Rowley et al., 2017) and processed using the juicer pipeline (Durand et al., 2016a). RNAPII HiChIP data was combined with published RNAPII ChIA-PET data in Kc167 cells to obtain higher resolution (Rowley et al., 2017). Scaled metaplots of intra-genic interactions were created using KR where possible or VC_SQRT normalized reads (Rao et al., 2014) calculated by juicer (Durand et al., 2016a), dumped at 250 bp resolution, and divided by the distance decay. For scaled genic bins that encompassed multiple 250 bp dumped bins, the average signal in each 250 bp bin was used to calculate the intensity within the scaled bin. The median signal of intensities across all genes was then plotted. Similarly, metaplots of compartmental interactions (A-A, A-B, B-B, or B-A) were plotted by scaling closest compartments to 10 bins and calculating the average intensity of 1 kb resolved Hi-C data within each bin. The median signal across all compartments was then plotted.
RNAPII and Rad21 HiChIP significant interactions were calculated at 250 bp resolution using Chicago (Cairns et al., 2016) and filtered for a q-value < 0.05. The number of interactions within genes (Figure 1E) was computed as the fraction of total possible bins calculated with . Differences between HiChIP and Hi-C or between treated and control Hi-C datasets were computed using the subtraction of distance and read normalized signal. Differential metaplots used the sum of this difference.
In order to estimate A and B compartmental association, we calculated the eigenvector from the Pearson correlation matrix of Hi-C data at 1 kb resolution. We initially use KR or VC_SQRT normalized reads, which have been shown to be very similar (Rao et al., 2014), and divide these by an expected distribution based on the distance decay. Due to computational limitations and in consideration of the small size of compartments previously identified in Drosophila, each chromosome was read into a distance normalized matrix in 5.25 Mb sized chunks which is a matrix size that holds ~250 different compartmental domains (Rowley et al., 2017). Rows and columns with more than 98% of bins having zero reads were removed to eliminate repetitive regions. The entire matrix was than globally transformed by z-score estimation and the Pearson correlation was calculated. We noticed that despite distance normalization, the correlation matrix was heavily biased toward short-range interactions, therefore we calculated z-scores at each distance. This decreased the range of correlation values at the diagonal and increase the range of correlation values at long distances (compartmental interactions). We then used this distance-normalized correlation matrix to calculate the eigenvector. To ensure that compartment calling functioned properly, the eigenvector was visually inspected to ensure it matched the compartment pattern seen by eye and compared to previous compartment calling at 10 kb resolution using the eigenvector (Rowley et al., 2017). In addition, the eigenvector was compared to compartment calling that used HiChIP data for H3K27ac and H3K27me3 (Rowley et al., 2017). Published compartments were used for mouse sperm Hi-C data.
hd-pairing
hd-pairing reads were obtained by reprocessing Hi-C fastq files. Left end (R1) and right end (R2) reads from paired-end sequencing were mapped to the dm6 Drosophila genome separately using bowtie (Langmead et al., 2009). R1 and R2 reads were then joined and only those mapping to the same DPNII fragment were kept. These were further filtered to eliminate self-ligated fragments based on strand information as depicted in Figure 7A. Separately, unmapped reads with a ligation motif present inside the read were also processed. These were kept when the mapped portion on either side of the ligation motif overlapped each other. This kept reads where the sequenced portion dictated that they came from homologous chromosomes. PCR duplicates were then removed. To ensure that enrichment in hd-pairing was not affected by any potential digestion or ligation preferences in Hi-C, we compared the hd-pairing signal to the Hi-C coverage normalization vector in 1 kb bins. We found no correlation between hd-pairing signal and the Hi-C coverage vector (Pearson R = −0.08) indicating that enrichment at hd-pairing sites is not due to potential accessibility biases in Hi-C.
hd-pairing signal within sequences matching mappable non-repetitive FISH probes (Williams et al., 2007) or within compartmental domains (Rowley et al., 2017) was calculated by the sum of signal divided by the number of DPNII fragments within the region. Profiles of pairing were calculated using ngsplot (Shen et al., 2014). hd-pairing peaks were identified by placing reads in 1 kb bins and using MACS2 with DPNII locations as a background control with broad calling a band-width of 1000 and post filtering for a q-value of less than 1e−10. The odds-ratio was calculated using the standard formula (a/c)/(b/d) where a = APBSs overlapping with hd-pairing peaks, b = APBSs not overlapping with hd-pairing peaks, c = ATAC-seq peaks overlapping with hd-pairing peaks, d = ATAC-seq peaks not overlapping with hd-pairing peaks. ATAC-seq in Kc167 cells was published previously (Rowley et al., 2017).
QUANTIFICATION AND STATISTICAL ANALYSIS
Hi-C and HiChIP data represent the signal obtained from a population of cells, n = 20 million or n = 100 million respectively. Mapping statistics for Hi-C and HiChIP data were generated using Juicer (Durand et al., 2016a) and are displayed in Tables S1–S4. Metaplots of Hi-C or HiChIP data represent the median signal in each bin surrounding a central point or the median signal across bins scaled for features of non-uniform sizes, e.g., genes. Central point enrichment in Hi-C or HiChIP metaplots, termed the APA score (Rao et al., 2014), was calculated by dividing the signal in the center bin by the average signal across a 3×3 square in the upper right corner. The results of this test are labeled in the figures where applicable.
Profiles of sequencing data across genomic loci represent the average or median signal as described on each figure and were generated using ngs.plot (Shen et al., 2014) or by using custom scripts. Correlations were evaluated using a Pearson correlation test and are displayed in the figures and in the figure legends. Overlaps of architectural proteins with hd-pairing sites were evaluated by an odds ratio using custom scripts.
Boxplots were generated in R and the center line represents the median, the box represents the interquartile range (IQR) of quartiles Q1-Q3, and lower and upper whiskers represent the Q1 – 1.5*IQR or Q3 + 1.5*IQR. Significant differences were evaluated by the Wilcoxon Rank Sum test in R, the results of which are described in the figure legends.
DATA AND SOFTWARE AVAILABILITY
The accession numbers of the ChIP-seq, Hi-C, and HiChIP data reported in this paper are GEO: GSE116857, GSE118756.
Supplementary Material
KEY RESOURCES TABLE
Highlights.
Intra-gene interactions cause the formation of gene domains that establish A compartments
RNAPII and cohesin promote, but condensin inhibits, formation of gene domains
Pairing between homologs occurs at ~6-kb buttons enriched in architectural proteins
Condensin II antagonizes homolog pairing, whereas RNAPII and cohesin have no effect
ACKNOWLEDGMENTS
We would like to thank the HudsonAlpha Institute for Biotechnology Genomic Services Lab for their help with Illumina sequencing. This work was supported by NIH Pathway to Independence Award K99/R00 GM127671 (M.J.R.) and U.S. Public Health Service Award (R01) GM035463 (V.G.C.) from the NIH. The content is solely the responsibility of the authors and does not necessarily represent the official views of the NIH.
Footnotes
SUPPLEMENTAL INFORMATION
Supplemental Information can be found with this article online at https://doi.org/10.1016/j.celrep.2019.01.116.
DECLARATION OF INTERESTS
The authors declare no competing interests.
REFERENCES
- Brownlee CW, Klebba JE, Buster DW, and Rogers GC (2011). The protein phosphatase 2A regulatory subunit Twins stabilizes Plk4 to induce centriole amplification. J. Cell Biol 195, 231–243. [DOI] [PMC free article] [PubMed] [Google Scholar]
- Busslinger GA, Stocsits RR, van der Lelij P, Axelsson E, Tedeschi A, Galjart N, and Peters J-M (2017). Cohesin is positioned in mammalian genomes by transcription, CTCF and Wapl. Nature 544, 503–507. [DOI] [PMC free article] [PubMed] [Google Scholar]
- Cairns J, Freire-Pritchett P, Wingett SW, Várnai C, Dimond A, Plagnol V, Zerbino D, Schoenfelder S, Javierre B-M, Osborne C, et al. (2016). CHiCAGO: robust detection of DNA looping interactions in capture Hi-C data. Genome Biol 17, 127. [DOI] [PMC free article] [PubMed] [Google Scholar]
- Chowdhary S, Kainth AS, and Gross DS (2017). Heat shock protein genes undergo dynamic alteration in their three-dimensional structure and genome organization in response to thermal stress. Mol. Cell. Biol 37, e00292–17. [DOI] [PMC free article] [PubMed] [Google Scholar]
- Cobbe N, Savvidou E, and Heck MMS (2006). Diverse mitotic and interphase functions of condensins in Drosophila. Genetics 172, 991–1008. [DOI] [PMC free article] [PubMed] [Google Scholar]
- Core LJ, Martins AL, Danko CG, Waters CT, Siepel A, and Lis JT (2014). Analysis of nascent RNA identifies a unified architecture of initiation regions at mammalian promoters and enhancers. Nat. Genet 46, 1311–1320. [DOI] [PMC free article] [PubMed] [Google Scholar]
- Cubeñas-Potts C, Rowley MJ, Lyu X, Li G, Lei EP, and Corces VG (2017). Different enhancer classes in Drosophila bind distinct architectural proteins and mediate unique chromatin interactions and 3D architecture. Nucleic Acids Res 45, 1714–1730. [DOI] [PMC free article] [PubMed] [Google Scholar]
- Davidson IF, Goetz D, Zaczek MP, Molodtsov MI, Huis In ‘t Veld PJ, Weissmann F, Litos G, Cisneros DA, Ocampo-Hafalla M, Ladurner R, et al. (2016). Rapid movement and transcriptional re-localization of human cohesin on DNA. EMBO J 35, 2671–2685. [DOI] [PMC free article] [PubMed] [Google Scholar]
- Dixon JR, Selvaraj S, Yue F, Kim A, Li Y, Shen Y, Hu M, Liu JS, and Ren B (2012). Topological domains in mammalian genomes identified by analysis of chromatin interactions. Nature 485, 376–380. [DOI] [PMC free article] [PubMed] [Google Scholar]
- Dong P, Tu X, Chu P-Y, Lü P, Zhu N, Grierson D, Du B, Li P, and Zhong S (2017). 3D chromatin architecture of large plant genomes determined by local A/B compartments. Mol. Plant 10, 1497–1509. [DOI] [PubMed] [Google Scholar]
- Du Z, Zheng H, Huang B, Ma R, Wu J, Zhang X, He J, Xiang Y, Wang Q, Li Y, et al. (2017). Allelic reprogramming of 3D chromatin architecture during early mammalian development. Nature 547, 232–235. [DOI] [PubMed] [Google Scholar]
- Durand NC, Shamim MS, Machol I, Rao SSP, Huntley MH, Lander ES, and Aiden EL (2016a). Juicer provides a one-click system for analyzing loop-resolution Hi-C experiments. Cell Syst 3, 95–98. [DOI] [PMC free article] [PubMed] [Google Scholar]
- Durand NC, Robinson JT, Shamim MS, Machol I, Mesirov JP, Lander ES, and Aiden EL (2016b). Juicebox provides a visualization system for Hi-C contact maps with unlimited zoom. Cell Syst 3, 99–101. [DOI] [PMC free article] [PubMed] [Google Scholar]
- Eagen KP, Aiden EL, and Kornberg RD (2017). Polycomb-mediated chromatin loops revealed by a subkilobase-resolution chromatin interaction map. Proc. Natl. Acad. Sci. USA 114, 8764–8769. [DOI] [PMC free article] [PubMed] [Google Scholar]
- Fukaya T, and Levine M (2017). Transvection. Curr. Biol 27, R1047–R1049. [DOI] [PMC free article] [PubMed] [Google Scholar]
- Ganji M, Shaltiel IA, Bisht S, Kim E, Kalichava A, Haering CH, and Dekker C (2018). Real-time imaging of DNA loop extrusion by condensin. Science 360, 102–105. [DOI] [PMC free article] [PubMed] [Google Scholar]
- Geyer PK, Green MM, and Corces VG (1990). Tissue-specific transcriptional enhancers may act in trans on the gene located in the homologous chromosome: the molecular basis of transvection in Drosophila. EMBO J 9, 2247–2256. [DOI] [PMC free article] [PubMed] [Google Scholar]
- Guo Y, Xu Q, Canzio D, Shou J, Li J, Gorkin DU, Jung I, Wu H, Zhai Y, Tang Y, et al. (2015). CRISPR inversion of CTCF sites alters genome topology and enhancer/promoter function. Cell 162, 900–910. [DOI] [PMC free article] [PubMed] [Google Scholar]
- Hartl TA, Smith HF, and Bosco G (2008). Chromosome alignment and transvection are antagonized by condensin II. Science 322, 1384–1387. [DOI] [PubMed] [Google Scholar]
- Hou C, Li L, Qin ZS, and Corces VG (2012). Gene density, transcription, and insulators contribute to the partition of the Drosophila genome into physical domains. Mol. Cell 48, 471–484. [DOI] [PMC free article] [PubMed] [Google Scholar]
- Hug CB, Grimaldi AG, Kruse K, and Vaquerizas JM (2017). Chromatin architecture emerges during zygotic genome activation independent of transcription. Cell 169, 216–228.e19. [DOI] [PubMed] [Google Scholar]
- Joyce EF, Williams BR, Xie T, and Wu CT (2012). Identification of genes that promote or antagonize somatic homolog pairing using a high-throughput FISH-based screen. PLoS Genet 8, e1002667. [DOI] [PMC free article] [PubMed] [Google Scholar]
- Joyce EF, Erceg J, and Wu CT (2016). Pairing and anti-pairing: a balancing act in the diploid genome. Curr. Opin. Genet. Dev 37, 119–128. [DOI] [PMC free article] [PubMed] [Google Scholar]
- Jung YH, Sauria MEG, Lyu X, Cheema MS, Ausio J, Taylor J, and Corces VG (2017). Chromatin states in mouse sperm correlate with embryonic and adult regulatory landscapes. Cell Rep 18, 1366–1382. [DOI] [PMC free article] [PubMed] [Google Scholar]
- Ke Y, Xu Y, Chen X, Feng S, Liu Z, Sun Y, Yao X, Li F, Zhu W, Gao L, et al. (2017). 3D chromatin structures of mature gametes and structural reprogramming during mammalian embryogenesis. Cell 170, 367–381.e20. [DOI] [PubMed] [Google Scholar]
- Kwak H, Fuda NJ, Core LJ, and Lis JT (2013). Precise maps of RNA polymerase reveal how promoters direct initiation and pausing. Science 339, 950–953. [DOI] [PMC free article] [PubMed] [Google Scholar]
- Langmead B, Trapnell C, Pop M, and Salzberg SL (2009). Ultrafast and memory-efficient alignment of short DNA sequences to the human genome. Genome Biol 10, R25. [DOI] [PMC free article] [PubMed] [Google Scholar]
- Li L, Lyu X, Hou C, Takenaka N, Nguyen HQ, Ong C-T, Cubeñas-Potts C, Hu M, Lei EP, Bosco G, et al. (2015). Widespread rearrangement of 3D chromatin organization underlies polycomb-mediated stress-induced silencing. Mol. Cell 58, 216–231. [DOI] [PMC free article] [PubMed] [Google Scholar]
- Lieberman-Aiden E, van Berkum NL, Williams L, Imakaev M, Ragoczy T, Telling A, Amit I, Lajoie BR, Sabo PJ, Dorschner MO, et al. (2009). Comprehensive mapping of long-range interactions reveals folding principles of the human genome. Science 326, 289–293. [DOI] [PMC free article] [PubMed] [Google Scholar]
- Lim B, Heist T, Levine M, and Fukaya T (2018). Visualization of transvection in living Drosophila embryos. Mol. Cell 70, 287–296.e6. [DOI] [PMC free article] [PubMed] [Google Scholar]
- Nguyen HQ, Nye J, Buster DW, Klebba JE, Rogers GC, and Bosco G (2015). Drosophila casein kinase I alpha regulates homolog pairing and genome organization by modulating condensin II subunit Cap-H2 levels. PLoS Genet 11, e1005014. [DOI] [PMC free article] [PubMed] [Google Scholar]
- Nora EP, Lajoie BR, Schulz EG, Giorgetti L, Okamoto I, Servant N, Piolot T, van Berkum NL, Meisig J, Sedat J, et al. (2012). Spatial partitioning of the regulatory landscape of the X-inactivation centre. Nature 485, 381–385. [DOI] [PMC free article] [PubMed] [Google Scholar]
- Nora EP, Goloborodko A, Valton A-L, Gibcus JH, Uebersohn A, Abdennur N, Dekker J, Mirny LA, and Bruneau BG (2017). Targeted degradation of CTCF decouples local insulation of chromosome domains from genomic compartmentalization. Cell 169, 930–944.e22. [DOI] [PMC free article] [PubMed] [Google Scholar]
- O’Sullivan JM, Tan-Wong SM, Morillon A, Lee B, Coles J, Mellor J, and Proudfoot NJ (2004). Gene loops juxtapose promoters and terminators in yeast. Nat. Genet 36, 1014–1018. [DOI] [PubMed] [Google Scholar]
- Ocampo-Hafalla M, Muñoz S, Samora CP, and Uhlmann F (2016). Evidence for cohesin sliding along budding yeast chromosomes. Open Biol 6, 150178. [DOI] [PMC free article] [PubMed] [Google Scholar]
- Ogiyama Y, Schuettengruber B, Papadopoulos GL, Chang J-M, and Cavalli G (2018). Polycomb-dependent chromatin looping contributes to gene silencing during Drosophila development. Mol. Cell 71, 73–88.e5. [DOI] [PubMed] [Google Scholar]
- Rao SSP, Huntley MH, Durand NC, Stamenova EK, Bochkov ID, Robinson JT, Sanborn AL, Machol I, Omer AD, Lander ES, and Aiden EL (2014). A 3D map of the human genome at kilobase resolution reveals principles of chromatin looping. Cell 159, 1665–1680. [DOI] [PMC free article] [PubMed] [Google Scholar]
- Rao SSP, Huang S-C, Glenn St Hilaire B, Engreitz JM, Perez EM, Kieffer-Kwon K-R, Sanborn AL, Johnstone SE, Bascom GD, Bochkov ID, et al. (2017). Cohesin loss eliminates all loop domains. Cell 171, 305–320.e24. [DOI] [PMC free article] [PubMed] [Google Scholar]
- Rosin LF, Nguyen SC, and Joyce EF (2018). Condensin II drives large-scale folding and spatial partitioning of interphase chromosomes in Drosophila nuclei. PLoS Genet 14, e1007393. [DOI] [PMC free article] [PubMed] [Google Scholar]
- Rowley MJ, and Corces VG (2018). Organizational principles of 3D genome architecture. Nat. Rev. Genet 19, 789–800. [DOI] [PMC free article] [PubMed] [Google Scholar]
- Rowley MJ, Nichols MH, Lyu X, Ando-Kuri M, Rivera ISM, Hermetz K, Wang P, Ruan Y, and Corces VG (2017). Evolutionarily conserved principles predict 3D chromatin organization. Mol. Cell 67, 837–852.e7. [DOI] [PMC free article] [PubMed] [Google Scholar]
- Schaaf CA, Kwak H, Koenig A, Misulovin Z, Gohara DW, Watson A, Zhou Y, Lis JT, and Dorsett D (2013). Genome-wide control of RNA polymerase II activity by cohesin. PLoS Genet 9, e1003382. [DOI] [PMC free article] [PubMed] [Google Scholar]
- Schwarzer W, Abdennur N, Goloborodko A, Pekowska A, Fudenberg G, Loe-Mie Y, Fonseca NA, Huber W, H Haering C, Mirny L, and Spitz F (2017). Two independent modes of chromatin organization revealed by cohesin removal. Nature 551, 51–56. [DOI] [PMC free article] [PubMed] [Google Scholar]
- Senaratne TN, Joyce EF, Nguyen SC, and Wu CT (2016). Investigating the interplay between sister chromatid cohesion and homolog pairing in Drosophila nuclei. PLoS Genet 12, e1006169. [DOI] [PMC free article] [PubMed] [Google Scholar]
- Sexton T, Yaffe E, Kenigsberg E, Bantignies F, Leblanc B, Hoichman M, Parrinello H, Tanay A, and Cavalli G (2012). Three-dimensional folding and functional organization principles of the Drosophila genome. Cell 148, 458–472. [DOI] [PubMed] [Google Scholar]
- Shao Z, Zhang Y, Yuan GC, Orkin SH, and Waxman DJ (2012). MAnorm: a robust model for quantitative comparison of ChIP-Seq data sets. Genome Biol 13, R16. [DOI] [PMC free article] [PubMed] [Google Scholar]
- Shen L, Shao N, Liu X, and Nestler E (2014). ngs.plot: quick mining and visualization of next-generation sequencing data by integrating genomic databases. BMC Genomics 15, 284. [DOI] [PMC free article] [PubMed] [Google Scholar]
- Smith HF, Roberts MA, Nguyen HQ, Peterson M, Hartl TA, Wang X-J, Klebba JE, Rogers GC, and Bosco G (2013). Maintenance of interphase chromosome compaction and homolog pairing in Drosophila is regulated by the condensin cap-h2 and its partner Mrg15. Genetics 195, 127–146. [DOI] [PMC free article] [PubMed] [Google Scholar]
- Tang Z, Luo OJ, Li X, Zheng M, Zhu JJ, Szalaj P, Trzaskoma P, Magalska A, Wlodarczyk J, Ruszczycki B, et al. (2015). CTCF-mediated human 3D genome architecture reveals chromatin topology for transcription. Cell 163, 1611–1627. [DOI] [PMC free article] [PubMed] [Google Scholar]
- Van Bortle K, Nichols MH, Li L, Ong C-T, Takenaka N, Qin ZS, and Corces VG (2014). Insulator function and topological domain border strength scale with architectural protein occupancy. Genome Biol 15, R82. [DOI] [PMC free article] [PubMed] [Google Scholar]
- Wallace HA, Klebba JE, Kusch T, Rogers GC, and Bosco G (2015). Condensin II regulates interphase chromatin organization through the Mrg-binding motif of Cap-H2. G35 (Bethesda), pp. 803–817. [DOI] [PMC free article] [PubMed] [Google Scholar]
- Wang Q, Sun Q, Czajkowsky DM, and Shao Z (2018). Sub-kb Hi-C in D. melanogaster reveals conserved characteristics of TADs between insect and mammalian cells. Nat. Commun 9, 188. [DOI] [PMC free article] [PubMed] [Google Scholar]
- Williams BR, Bateman JR, Novikov ND, and Wu C-T (2007). Disruption of topoisomerase II perturbs pairing in Drosophila cell culture. Genetics 177, 31–46. [DOI] [PMC free article] [PubMed] [Google Scholar]
- Wutz G, Várnai C, Nagasaka K, Cisneros DA, Stocsits RR, Tang W, Schoenfelder S, Jessberger G, Muhar M, Hossain MJ, et al. (2017). Topologically associating domains and chromatin loops depend on cohesin and are regulated by CTCF, WAPL, and PDS5 proteins. EMBO J 36, 3573–3599. [DOI] [PMC free article] [PubMed] [Google Scholar]
- Yang J, Sung E, Donlin-Asp PG, and Corces VG (2013). A subset of Drosophila Myc sites remain associated with mitotic chromosomes colocalized with insulator proteins. Nat. Commun 4, 1464. [DOI] [PMC free article] [PubMed] [Google Scholar]
- Zeitlinger J, Stark A, Kellis M, Hong J-W, Nechaev S, Adelman K, Levine M, and Young RA (2007). RNA polymerase stalling at developmental control genes in the Drosophila melanogaster embryo. Nat. Genet 39, 1512–1516. [DOI] [PMC free article] [PubMed] [Google Scholar]
- Zhang Y, Liu T, Meyer CA, Eeckhoute J, Johnson DS, Bernstein BE, Nusbaum C, Myers RM, Brown M, Li W, and Liu XS (2008). Model-based analysis of ChIP-seq (MACS). Genome Biol 9, R137. [DOI] [PMC free article] [PubMed] [Google Scholar]
Associated Data
This section collects any data citations, data availability statements, or supplementary materials included in this article.
Supplementary Materials
Data Availability Statement
The accession numbers of the ChIP-seq, Hi-C, and HiChIP data reported in this paper are GEO: GSE116857, GSE118756.