Abstract
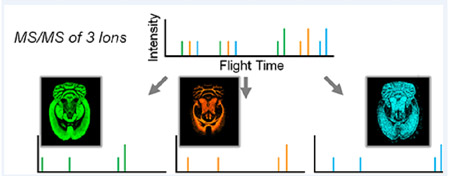
Tandem mass spectrometry (MS/MS) is often used to identify lipids in matrix-assisted laser desorption/ionization imaging mass spectrometry (MALDI IMS) workflows. The molecular specificity afforded by MS/MS is crucial on MALDI time-of-flight (TOF) platforms that generally lack high resolution accurate mass measurement capabilities. Unfortunately, imaging MS/MS workflows generally only monitor a single precursor ion over the imaged area, limiting the throughput of this methodology. Herein, we demonstrate that multiple TOF/TOF events performed in each laser shot can be used to improve the throughput of imaging MS/MS. This is shown to enable the simultaneous identification of multiple phosphatidylcholine lipids in rat brain tissue. Uniquely, the separation in time achieved for the precursor ions in the TOF-1 region of the instrument is maintained for the fragment ions as they are analyzed in TOF-2, allowing for the differentiation of fragment ions of the exact same m/z derived from different precursor ions (e.g., the m/z 163 fragment ion from precursor ion m/z 772.5 is easily distinguished from the m/z 163 fragment ion from precursor ion m/z 826.5). This multiplexed imaging MS/MS approach allows for the acquisition of complete fragment ion spectra for multiple precursor ions per laser shot.
Keywords: Multiplexed, MS/MS, lipid, MALDI, imaging mass spectrometry
Graphical Abstract
INTRODUCTION
Matrix-assisted laser desorption/ionization imaging mass spectrometry (MALDI IMS)1 has frequently been used to study lipid distributions in many different types of biological tissues.2 The various classes of polar head groups, different fatty acyl group lengths, and positions of double bonds in glycerophospholipids result in immense chemical diversity, making molecular specificity and accurate identification crucial in lipid IMS experiments.3-4 In the low molecular mass region of the mass spectrum, analyses are complicated by excess matrix signals and ions from other endogenous compounds in the sample.5 In an IMS experiment, these potentially interfering species can result in a cumulative image made up of several ions, resulting in an inaccurate picture of the molecular distribution of a given ion of interest.
Several different experimental approaches have been employed to alleviate this complexity. Nominally isobaric compounds can be differentiated using a high mass resolving power instrument platform (e.g., Fourier transform ion cyclotron resonance [FT-ICR] and Orbitrap mass spectrometers).6-8 The high mass resolution capabilities of these platforms ensure that nominally isobaric compounds are differentiated from one another based on their mass defects. High mass resolution, coupled with accurate mass measurements, allows for the determination of the empirical chemical formula of an ion of interest with a high level of confidence. In lipid analysis, these measurements can provide for the identification of the class of lipid as well as the total carbon and double bond content (TC:DB) of the fatty acid tails. However, for isomeric compounds, high resolution accurate mass measurements do not provide a sufficient level of molecular specificity. In these instances, ion mobility (IM)9-14 and tandem mass spectrometry (MS/MS or MSn)15-21 approaches have been successfully employed. These gas phase fractionation approaches also serve to improve sensitivity through the elimination of chemical noise. In IMS experiments, MS/MS methodologies have been successfully employed on several trap-based instrument platforms, including linear ion trap (LIT) and LIT-Orbitrap instruments. However, MS/MS methods on trap-based instruments require lengthier acquisition times, decreasing throughput. Beam-type MS/MS instruments, whereby the ion beam is transmitted through a collision cell without trapping, are inherently faster (e.g., triple quadrupole [QqQ]15, 19 and TOF/TOF setups21-23), but have not been used as extensively in IMS experiments. Imaging MS/MS workflows can also provide for the structural identification of the analyte of interest, though the throughput of these types of experiments is typically very low. In most instances, Imaging MS/MS analyses only examine a single transition. Multiplexed imaging MS/MS methods that sequentially analyze multiple precursor ions have been reported.18, 24-26 In these experiments, a single pixel is subdivided into several spots (e.g., a two-by-two array). These spots are then used to perform MS and MS/MS analyses within each pixel (e.g., one MS scan and three MS/MS scans). Performing a spiral-type scan at each pixel allows for multiplexed MS/MS imaging, albeit at the cost of spatial resolution (viz. a two-by-two array doubles the effective diameter of each pixel). Multiplexed trap-based MS/MS methods that analyze multiple precursor ions in a single scan have been reported in quantitative proteomics experiments and have been applied to quantitative IMS analyses.27-29 However, common fragment ions between the multiple precursor ions (i.e., fragment ions with the same m/z derived from different precursor ions) are unable to be differentiated during ion trap mass analysis. This can lead to inaccurate molecular images and inaccurate chemical identifications.
Recently, we have reported methodologies for performing multiple MS/MS events in a single laser shot on a MALDI TOF/TOF platform.30-31 Unique to a TOF/TOF setup, fragment ions of the exact same m/z that are derived from different precursor ions can be resolved from one another. This is due to the separation in time of the precursor ions in the TOF-1 region of the instrument and is similar in principle to a precursor ion scan typically performed on QqQ platforms, where the separation of precursor ions is performed via a scan of the first resolving quadrupole (Q1) while the third quadrupole (Q3) remains fixed on the fragment ion of interest. In contrast to a triple quadrupole instrument, the TOF/TOF platform acquires an entire fragment ion spectrum for each selected precursor ion in every laser shot. The ability to resolve isomeric fragment ions is highly advantageous when analyzing multiple precursor ions with similar chemical structures and fragmentation behaviors (e.g., a series of phosphatidylcholine [PC] lipids). In imaging analysis, the ability to analyze multiple precursor ions in each laser shot improves MS/MS throughput, enabling molecular specificity and identification without sacrificing spatial resolution. Herein, we demonstrate the utility of this TOF/TOF methodology for the positive ion mode lipid IMS analysis of rat brain tissue.
EXPERIMENTAL
Materials and Sample Preparation
2,5-dihydroxybenoic acid (DHB) was purchased from Sigma Aldrich (St. Louis, MO). Methanol and ethanol were purchased from Fisher Scientific (Waltham, MA). Water (18 MΩ) water was obtained from a Milli-Q water purification system (Millipore, Billerica, MA). Rat brain was purchased from Pel-Freez Biologicals (Rogers, AR). Transverse sections of flash-frozen rat brain tissue were cut at 10 μm thickness using a cryostat (CryoStar NX70 Cryostat (Thermo Scientific, Waltham, MA) and thaw mounted onto indium tin oxide (ITO) coated glass slides. A custom-built sublimation apparatus was used to apply a DHB matrix layer (120°C at <70 mTorr for 7 mins).32
Mass Spectrometry
All experiments were performed on a MALDI TOF/TOF mass spectrometer (300 Tandem, SimulTOF Systems, Sudbury, MA) operated in positive ion MS reflectron mode at 8 kV as well as positive ion MS/MS mode at 4 kV.21 This system is capable of performing multiple TOF/TOF events in a single laser shot as described and demonstrated previously.30-31 This instrument is equipped with a 349 nm, diode-pumped, frequency-tripled Nd:YLF laser capable of laser repetition rates up to 5 kHz (Spectra-Physics, Santa Clara, CA). The data were acquired in typewriter mode via continuous raster sampling using a 1 kHz laser repetition rate, a 1 mm/s stage velocity, 100 hardware averages and a 100 μm vertical step size, resulting in 100 μm by 100 μm pixel sizes.15,20,33-34 Instrument control and data acquisition were performed using the SimulTOF Controller and data analysis was performed using the SimulTOF Viewer (SimulTOF Systems, Sudbury, MA). External calibration was performed in both MS and MS/MS mode using hand-spotted mixture of peptide standards.
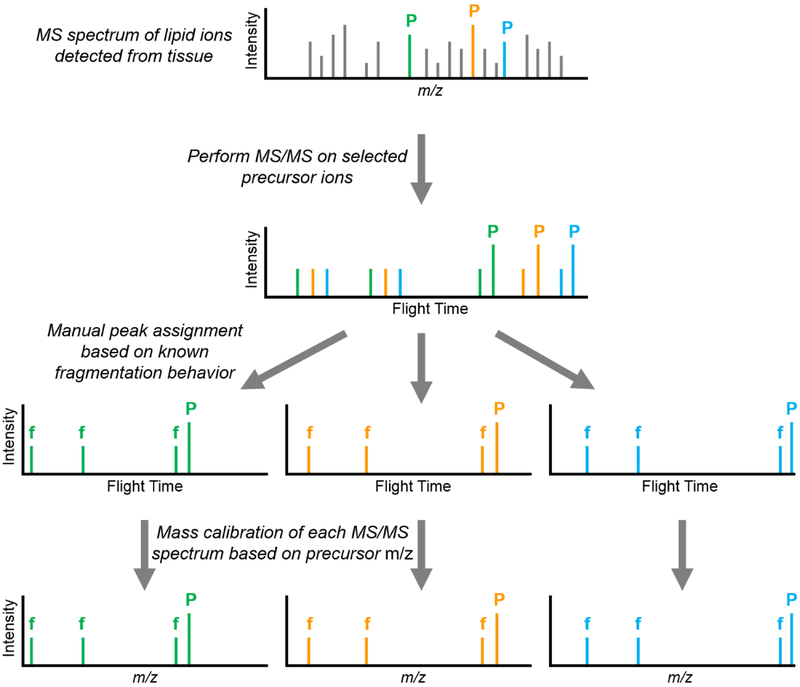
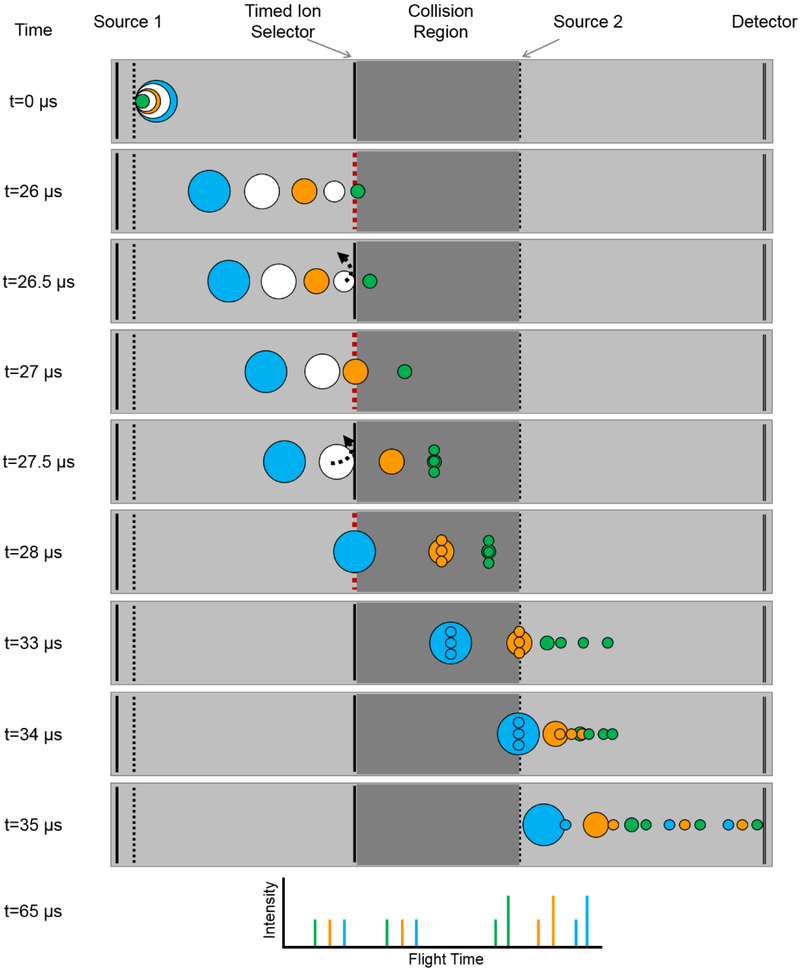
The methodology for individually selecting and reaccelerating multiple precursor ions in a single laser shot for MS/MS analysis has been described previously (Figure 1).31, 35-36 Briefly, ions are first extracted from the source region of the instrument using pulsed extraction and separated in the first field-free (TOF-1) region of the instrument. A precision timed ion selector (TIS) is used to sequentially isolate multiple precursor ions of increasing m/z. This is achieved by ‘opening’ and ‘closing’ the TIS multiple times within the same laser shot, thereby permitting the transmission of multiple discrete m/z windows. Following isolation, ions traverse a collision cell before being reaccelerated to 2 kV in the second source region. As with the TIS, the second source voltage is ramped multiple times within the same laser shot to reaccelerate ions from precursor ions of increasing m/z. Product and residual precursor ions then enter the second field-free (TOF-2) region of the instrument, passing through a two-stage ion mirror before reaching the detector (High Mass Bi-Polar TOF detector, Photonis, Sturbridge, MA). The ability to discretely isolate and reaccelerate multiple ions of similar m/z is limited by the ion transit times through the devices as well as the rise times, fall times, and pulse lengths of the relevant power supplies. Consequently, precursor ions must differ by ~6-7% in m/z to be successfully isolated and reaccelerated via this approach. Fragment ions in the resulting multiplexed MS/MS spectrum are assigned to the proper precursor ions by matching the recorded flight times of the fragment ions to a library of known MS/MS spectra that have been previously acquired. Fragmentation can be performed using either post-source decay (PSD) or high energy collision induced dissociation (CID); experiments herein utilized PSD for fragmentation.37-38 PSD relies on internal energy acquired by precursor ions in the source (from gas-phase collisions, laser irradiation, thermal mechanisms, etc.) to induce fragmentation during ion transit in TOF-1 prior to arrival at source 2.
Figure 1:
The multiplexed MS/MS workflow starts by selecting multiple ions of interest for MS/MS analysis from the MS spectrum (selected parent ions labeled as ‘P’). Each of these ions is individually isolated and fragmented. Comparing the flight times of the fragment ions (labeled as ‘f’) in the resulting multiplexed MS/MS spectrum against a library of known MS/MS spectra allows for the assignment of fragment ions to the proper precursor ion. Each of the resulting MS/MS spectra can then be calibrated based on the precursor m/z value.
Lipids were identified by searching fragment ion spectra against the LIPID MAPS (Lipidomics Gateway,www.lipidmaps.org) and METLIN Metabolite (http://metlin.scripps.edu) databases. MS/MS cleavage sites were confirmed using ChemBioDrawUltra 14.0 (CambridgeSoft Corporation, PerkinElmer Inc., Waltham, MA).
RESULTS
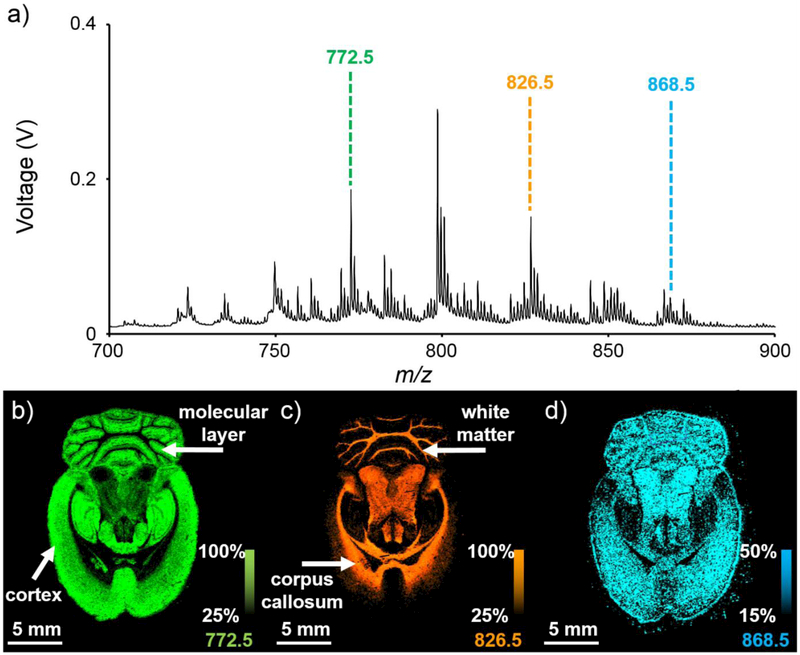
Positive ion mode lipid IMS analysis of a rat brain tissue section results in many lipid signals (Figure 2). These signals allow clear visualization of many brain substructures, including the cortex, corpus callosum, white matter, and molecular layer.39 The relatively low mass accuracy of a MALDI TOF mass spectrometer (compared to FT and Q-TOF instruments) decreases the confidence with which lipid identifications can be made based solely on accurate mass measurements. Additionally, the lower mass resolving power of TOF instruments can result in overlapping mass spectral peaks, such as nominally isobaric compounds from different lipid classes (e.g., phosphatidylethanolamines and phosphatidylserines) and ion types (e.g., [M+H]+, [M+Na]+, [M+K]+) as well as isomeric lipids [e.g., PC(18:1/18:1) vs. PC(18:0/18:2)].2 These overlapping species can each have distinct spatial distributions, meaning that the spatial distribution of the single unresolved peak in the mass spectrum is actually a combination of each of these spatial distributions. The overlapping chemical species obscuring a potential signal of interest represent chemical noise in these experiments. For example, in the rat brain IMS experiment shown in Figure 2, the spatial distribution of m/z 868.5 (Figure 2d) is more uniform in comparison to the spatial distributions of m/z 772.5 (Figure 2b) and m/z 826.5 (Figure 2c). This could be because there are several unresolved signals present at nominal m/z 868.
Figure 2:
100-μm spatial resolution positive ion mode lipid IMS analysis of a transverse section of a rat brain: (a) The average mass spectrum for a selected region of the tissue shows many lipid signals. Plotting of the spatial distributions for (b) m/z 772.5, (c) m/z 826.5, and (d) m/z 868.5 allows for the visualization of many different brain substructures. Ion images are displayed using total ion current (TIC) normalization and are plotted as ±0.45 Da.
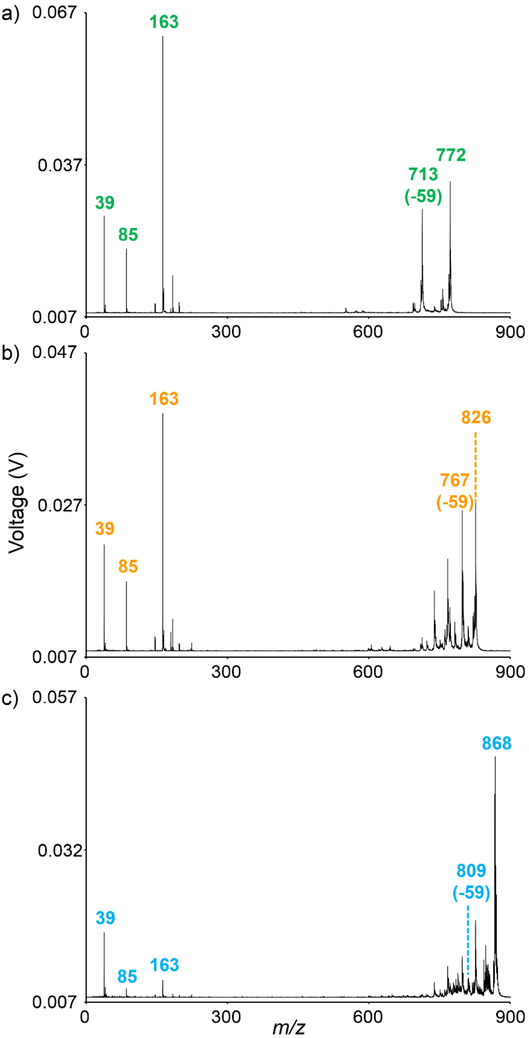
In instances where accurate mass measurements are either insufficient or impractical for analyte identification, tandem mass spectrometry can be employed. MS/MS analyses of the lipids shown in the ion images of Figure 2 allow for the identification of these species as [PC(32:0)+K]+, [PC(36:1)+K]+, and [PC(40:8)+K]+, respectively (Figure 3). As these species are all potassiated phosphatidylcholines, their fragmentation behaviors are nearly identical. In positive ion mode, these lipids fragment to give diagnostic ions for the phosphocholine headgroup.4, 40 For example, cleavage of the C-O bond in the choline headgroup results in a fragment ion at m/z 86 (see structure inset of Figure 4). Additionally, metal cationization induces several characteristic fragmentation pathways. For example, the neutral loss of 59 Da represents a loss of (CH3)3N (trimethyl amine) from the phosphocholine headgroup. Sequential cleavage of the C-O bond at the sn-3 position results in a potassiated fragment ion at m/z 163. The presence of free potassium ions at m/z 39 confirms the [M+K]+ ion types for these PC lipids. In trap-based MS/MS analyses of chemical species which dissociate similarly, such as the PC lipids shown above in Figure 2, common fragment ions will appear at the exact same m/z and cannot be differentiated. Additionally, the low mass cut-off of trap-based MS/MS platforms may preclude the detection of low mass fragment ions that are readily detected on TOF/TOF platforms, such as the free potassium ion detected here.
Figure 3:
MS/MS analyses of (a) m/z 772.5, (b) m/z 826.5, and (c) m/z 868.5 allows for the identification of these lipids as [PC(32:0)+K]+, [PC(36:1)+K]+, and [PC(40:8)+K]+, respectively. MALDI TOF/TOF fragmentation was performed using PSD. Displayed mass spectra represent averages of ~20,000 MALDI laser shots acquired from rat brain tissue.
Figure 4:
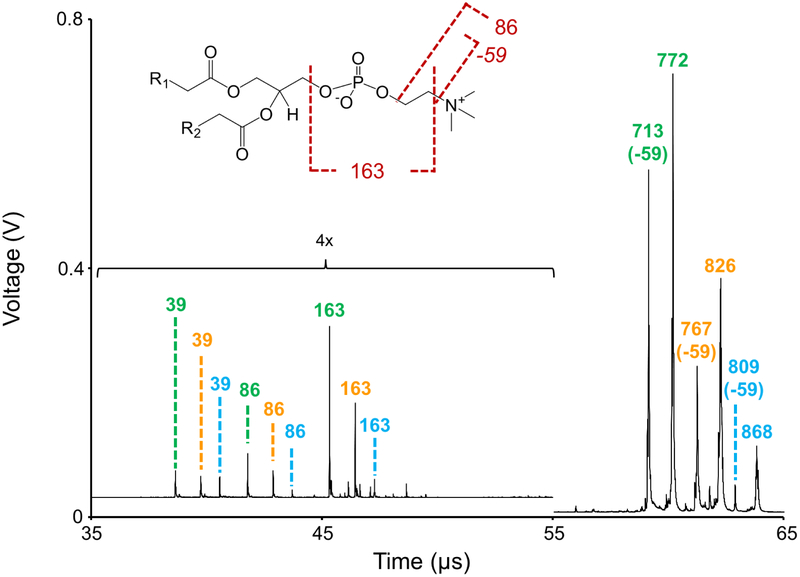
Multiplexed MS/MS spectrum of m/z 772.5, m/z 826.5, and m/z 868.5. This mass spectrum represents an average of ~30,000 MALDI laser shots acquired from rat brain tissue. Structure inset shows common phosphocholine cleavages in positive ion mode for a metal cationized ion type.
Recently, we have shown that multiple discrete MS/MS events can be performed in each laser shot on a MALDI TOF/TOF mass spectrometer.30-31 Uniquely, separation of precursor ions in the TOF-1 region of the instrument prior to reacceleration at Source 2 (for MS/MS analysis) results in fragmentation of precursor ions at different time points during the time-of-flight scan. This translates into different detector arrival times for fragment ions of the exact same m/z derived from different precursor ions (i.e., the separation in time for the precursor ions achieved in TOF-1 is maintained for the fragment ions as they are analyzed in TOF-2). Fragment ions in the multiplexed MS/MS spectrum are assigned to precursor ions by matching the arrival times of the fragment ions to previously acquired MS/MS spectra. Alternatively, the spatial distribution of the fragment ions can be used in some cases to assign fragment ions to the proper precursor ions (vide infra). We have applied this multiplexed TOF/TOF methodology to the identification of the three PC lipids shown in Figure 3 (Figure 4). For this analysis, the TIS software value was set for a difference of 15 (TISB delay = 1892, TISB delay end = 1907). This results in pulse widths of 356 ns, 367 ns, and 376 ns for the TIS isolation events for m/z 772.5, m/z 826.5, and m/z 868.5, respectively (see Figure 5 for a depiction of this pulsing sequence). In practice, this corresponds to ~3 Da isolation widths. The Source 2 pulse end slope was set to 1.004, resulting in ~145 ns, ~149 ns, and ~153 ns TOF-2 reacceleration pulse widths for m/z 772.5, m/z 826.5, and m/z 868.5, respectively. These short reacceleration pulse widths offer an extra degree of precursor ion selectivity in addition to the TIS isolation. The same fragment ion species observed in the single MS/MS experiments shown in Figure 3 are also observed in the multiplexed MS/MS experiment shown in Figure 4. Uniquely, the fragment ions common to each precursor ions (m/z 39, m/z 86, and m/z 163) are separated from another. Even though these fragment ions have the exact same molecular mass, they arrive at the detector at different time points during the time-of-flight scan because the precursor ions were reaccelerated into TOF-2 at different time points during the scan.
Figure 5:
Scheme showing the individual selection and reacceleration of three distinct precursor ions in a single laser shot. (t = 0 to 26 μs) Ions are first extracted from the Source 1 region of the instrument and separated according to m/z in TOF-1. (t = 26 to 28 μs) The TIS is repeatedly pulsed open to sequentially admit ions of interest of increasing m/z (represented by green, orange, and blue circles) into the collision cell, while preventing other ions (represented by white circles) from entering. The mass selected precursor ions are fragmented as they traverse the collision cell. (t = 33 to 65 μs) Each precursor ion is reaccelerated at Source 2 into the TOF-2 region of the instrument, where precursor and fragment ions are mass analyzed before reaching the detector and observed in the resulting spectrum. Note: fragment ions are shown here to arise from CID whereas actual experiments employed PSD. The reflectron in the TOF-2 region has been omitted for simplicity. Instrument dimensions, ion intensities, and fragment ion sizes are not shown to scale.
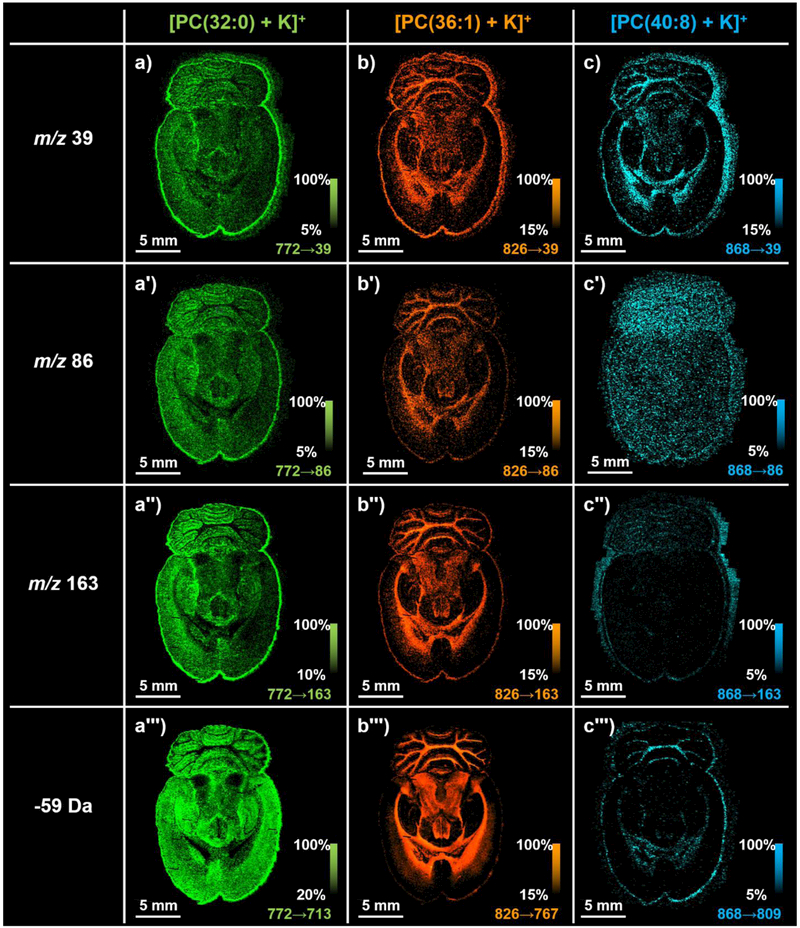
The separation of the common fragment ions for [PC(32:0)+K]+, [PC(36:1)+K]+, and [PC(40:8)+K]+ enables the discrete visualization of each fragment ion for each precursor ion (Figure 6). As expected, the spatial distribution is conserved for fragment ions from the same precursor ion. For example, the spatial distributions of fragment ions from [PC(36:1)+K]+, m/z 39 (Figure 6b), m/z 86 (Figure 6b′), m/z 163 (Figure 6b″), and m/z 767 (Figure 6b‴), are all very similar, showing elevated intensity in brain substructures such as the corpus callosum and in the white matter of the cerebellum. Importantly, the spatial distributions of fragment ions from the same precursor ion generally match the spatial distribution of the original precursor ion. For example, the fragment ion images in Figure 6b-6b‴ for [PC(36:1)+K]+ show the same spatial distributions as m/z 826.5 shown in Figure 2c.
Figure 6:
100-μm spatial resolution positive ion mode multiplexed MS/MS lipid IMS analysis of a serial tissue section to that shown in Figure 2. Fragment ion images for (a-a‴) [PC(32:0)+K]+, (b-b‴) [PC(36:1)+K]+, and (c-c‴) [PC(40:8)+K]+ show similar spatial distributions compared to that of the parent ion. Nomenclature: no prime symbol signifies an ion image for m/z 39, a single prime symbol signifies an ion image for m/z 86, a double prime symbol signifies an ion image for m/z 163, and a triple prime symbol signifies an ion image for a neutral loss of 59 Da from the parent ion. Ion images are plotted as ±1 Da.
While MS/MS can improve sensitivity by eliminating chemical noise, the precursor ion signal is often spread between several fragment ion channels, which can dilute the overall signal and diminish sensitivity (see Supplemental Figure 1 for a multiplexed MS/MS spectrum from a single pixel). This is evident for fragment ions m/z 39 (Figure 6a), m/z 86 (Figure 6a′), and m/z 163 (Figure 6a″) from [PC(32:0)+K]+ as well as m/z 86 from [PC(40:8)+K]+ (Figure 6c′). The intensities of these ions are relatively low, which result in ion images with less dynamic range that appear relatively noisy and of poor quality. The accumulation of some fragment ion intensity near the edges of the tissue could be evident due to this lower dynamic range, analyte delocalization during sample preparation, or differences in fragmentation efficiency due to sample inhomogeneity.41
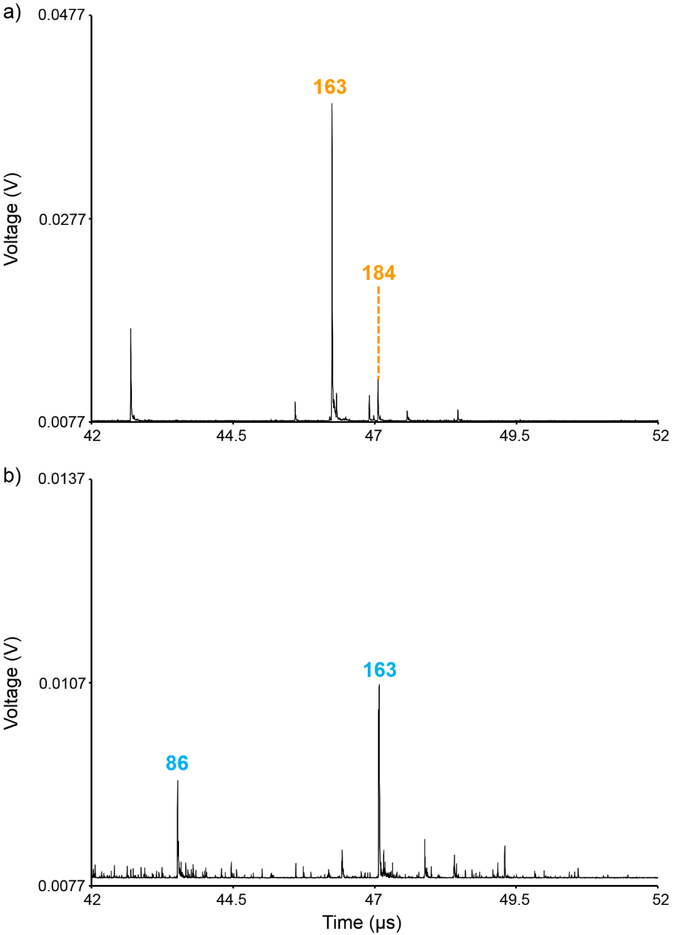
Although TOF/TOF multiplexed MS/MS analyses can allow of the separation of common fragment ions, fragment ion peaks can still overlap with one another if their detector arrival times happen to coincide with one another. The likelihood of this peak overlap increases as the number of precursor ions, and thus the number of fragment ions, increases. For example, m/z 163 from [PC(40:8)+K]+ partially overlaps with m/z 184 that is derived from the precursor ion window of [PC(36:1)+K]+ (Figure 7). The m/z 184 ion is a diagnostic fragment ion for the PC headgroup class and is favored for protonated ion types. This ion is likely from a protonated PC precursor ion that is isobaric and co-isolated with [PC(36:1)+K]+, thus constituting a channel of chemical noise for m/z 163 from [PC(40:8)+K]+. The ion image for this m/z 163 fragment ion thus actually reflects the combined spatial distribution of two ions, resulting in an ion image that is less distinct than the m/z 39 fragment ion (Figure 6c). These overlapping fragment ions could potentially be separated from one another by changing the acceleration voltages in order to alter the detector arrival times for these ions. Fragment ions are also observed at the m/z 184 from precursor ion window of [PC(32:0)+K]+ and m/z 826 from the precursor ion window of [PC(40:8)+K]+ (Supplemental Figure 2). These fragment ions are also both derived from isobaric precursor ions that are co-isolated with the potassiated PC ions. The presence of these fragment ions and their differential spatial localization compared to fragment ions derived from the potassiated PC precursor ions highlights the utility of MS/MS imaging for separating isobaric precursor ions.
Figure 7:
Time domain MS/MS spectra for precursor ions (a) [PC(36:1)+K]+ and (b) [PC(40:8)+K]+ show that m/z 184 from a protonated PC isobaric and co-isolated with [PC(36:1)+K]+ overlaps in detector arrival time with m/z 163 from [PC(40:8)+K]+. Displayed spectra are zoomed-in regions of Figure 3b and 3c, respectively.
CONCLUSIONS
Multiplexed TOF/TOF imaging mass spectrometry has been shown to enable the simultaneous identification of three potassiated phosphatidylcholine lipids in rat brain tissue. This proof-of-concept experiment demonstrates the utility of this technology for improving the throughput of MS/MS imaging experiments. Unlike other multiplexed MS/MS approaches reported to date, TOF/TOF multiplexing does not sacrifice spatial resolution and enables the separation of all fragment ions of the exact same m/z derived from precursor ions of different m/z. However, fragment ions may still overlap if their detector arrival times happen to coincide with one another. This likelihood of fragment ion overlap increases as the number of multiplexed windows increases, especially when considering the number of lipid ions that may be present using the current 2-3 Da precursor ion isolation/reacceleration windows. Additionally, the instrumental limitation that precursor ions selected for multiplexed MS/MS analysis must differ by ~6-7% restricts the number of ions that can be analyzed, especially when considering the high density of lipids between m/z 600 and m/z 1500. Nonetheless, multiplexed MS/MS imaging experiments offers the ability to accurately and sensitively plot the spatial distribution of chemical species by ensuring a high level of molecular specificity.
Supplementary Material
Highlights:
Multiple TOF/TOF events performed in each laser shot are shown to enable the simultaneous identification of multiple phosphatidylcholine lipids in rat brain tissue.
The separation in time achieved for the precursor ions in the TOF-1 region of the instrument is maintained for the fragment ions as they are analyzed in TOF-2, allowing for the differentiation of fragment ions of the exact same m/z derived from different precursor ions.
Multiplexed imaging MS/MS approach allows for the acquisition of complete fragment ion spectra for multiple precursor ions per laser shot.
ACKNOWLEDGEMENTS
The authors acknowledge Marvin Vestal, Kevin Hayden, and George Mills at SimulTOF Systems for their support. This work was sponsored by the National Institutes of Health/National Institute of General Medical Sciences under Award 5P41 GM103391-05. B.M.P. was supported by the National Institutes of Health/National Institute of Diabetes and Digestive and Kidney Diseases under Award F32 FDK105841A.
Footnotes
Publisher's Disclaimer: This is a PDF file of an unedited manuscript that has been accepted for publication. As a service to our customers we are providing this early version of the manuscript. The manuscript will undergo copyediting, typesetting, and review of the resulting proof before it is published in its final citable form. Please note that during the production process errors may be discovered which could affect the content, and all legal disclaimers that apply to the journal pertain.
REFERENCES
- 1.Caprioli RM; Farmer TB; Gile J, Molecular imaging of biological samples: localization of peptides and proteins using MALDI-TOF MS. Anal. Chem. 1997, 69, 4751–4760. [DOI] [PubMed] [Google Scholar]
- 2.Zemski Berry KAH, Joseph A; Barkley, Robert A.; Spraggins, Jeffery M.; Caprioli, Richard M.; Murphy, Robert C., MALDI imaging of lipid biochemistry in tissues by mass spectrometry. Chem. Rev. 2011, 111 (10), 6491–6512. [DOI] [PMC free article] [PubMed] [Google Scholar]
- 3.van Meer G; Voelker DR; Feigenson GW, Membrane lipids: where they are and how they behave. Nat. Rev. Mol. Cell Biol. 2008, 9 (2), 112–124. [DOI] [PMC free article] [PubMed] [Google Scholar]
- 4.Murphy RC; Axelsen PH, Mass spectrometric analysis of long-chain lipids. Mass Spectrom. Rev. 2011, 30 (4), 579–599. [DOI] [PMC free article] [PubMed] [Google Scholar]
- 5.Duncan MW; Matanovic G; Cerpa-Poljak A, Quantitative analysis of low molecular weight compounds of biological interest by matrix-assisted laser desorption ionization. Rapid Commun. Mass Spectrom. 1993, 7, 1090–1094. [DOI] [PubMed] [Google Scholar]
- 6.Cornett DS; Frappier SL; Caprioli RM, MALDI-FTICR imaging mass spectrometry of drugs and metabolites in tissue. Anal. Chem. 2008, 80 (14), 5648–5653. [DOI] [PMC free article] [PubMed] [Google Scholar]
- 7.Koestler M; Kirsch D; Hester A; Leisner A; Guenther S; Spengler B, A high resolution scanning microprobe matrix-assisted laser desorption/ionization ion source for imaging analysis on an ion trap/Fourier transform ion cyclotron resonance mass spectrometer. Rapid Commun. Mass Spectrom. 2008, 22 (20), 3275–3285. [DOI] [PubMed] [Google Scholar]
- 8.Castellino S; Groseclose MR; Wagner D, MALDI imaging mass spectrometry: bridging biology and chemistry in drug development. Bioanalysis 2011, 3 (21), 2427–2441. [DOI] [PubMed] [Google Scholar]
- 9.Jackson SN; Ugarov M; Egan T; Post JD; Langlais D; Schultz JA; Woods AS, MALDI-ion mobility-TOFMS imaging of lipids in rat brain tissue. J. Mass Spectrom. 2007, 42 (8), 1093–1098. [DOI] [PMC free article] [PubMed] [Google Scholar]
- 10.McLean JA; Ridenour WB; Caprioli RM, Profiling and imaging of tissues by imaging ion mobility-mass spectrometry. J. Mass Spectrom. 2007, 42 (8), 1099–1105. [DOI] [PubMed] [Google Scholar]
- 11.Trim PJ; Henson CM; Avery JL; McEwen A; Snel MF; Claude E; Marshall PS; West A; Princivalle AP; Clench MR, Matrix-assisted laser desorption/ionization-ion mobility separation-mass spectrometry imaging of vinblastine in whole body tissue sections. Anal. Chem. 2008, 80 (22), 8628–8634. [DOI] [PubMed] [Google Scholar]
- 12.Matusch A; Fenn LS; Depboylu C; Klietz M; Strohmer S; McLean JA; Becker JS, Combined elemental and biomolecular mass spectrometry imaging for probing the inventory of tissue at a micrometer scale. Anal. Chem. 2012, 84 (7), 3170–3178. [DOI] [PMC free article] [PubMed] [Google Scholar]
- 13.Jackson SN; Barbacci D; Egan T; Lewis EK; Schultz JA; Woods AS, MALDI-ion mobility mass spectrometry of lipids in negative ion mode. Analytical Methods 2014, 6 (14), 5001–5007. [DOI] [PMC free article] [PubMed] [Google Scholar]
- 14.Sans M; Feider CL; Eberlin LS, Advances in mass spectrometry imaging coupled to ion mobility spectrometry for enhanced imaging of biological tissues. Curr. Opin. Chem. Biol. 2018, 42, 138–146. [DOI] [PMC free article] [PubMed] [Google Scholar]
- 15.Hopfgartner G; Varesio E; Stoeckli M, Matrix-assisted laser desorption/ionization mass spectrometric imaging of complete rat sections using a triple quadrupole linear ion trap. Rapid communications in mass spectrometry : RCM 2009, 23 (6), 733–736. [DOI] [PubMed] [Google Scholar]
- 16.Landgraf RR; Prieto Conaway MC; Garrett TJ; Stacpoole PW; Yost RA, Imaging of lipids in spinal cord using intermediate pressure matrix-assisted laser desorption-linear ion trap/Orbitrap MS. Anal. Chem. 2009, 81 (20), 8488–8495. [DOI] [PMC free article] [PubMed] [Google Scholar]
- 17.Murphy RC; Hankin JA; Barkley RM, Imaging of lipid species by MALDI mass spectrometry. J. Lipid Res. 2009, 50, S317–S322. [DOI] [PMC free article] [PubMed] [Google Scholar]
- 18.Perdian DC; Lee YJ, Imaging MS methodology for more chemical information in less data acquisition time utilizing a hybrid linear ion trap-orbitrap mass spectrometer. Anal. Chem. 2010, 82 (22), 9393–9400. [DOI] [PubMed] [Google Scholar]
- 19.Prideaux B; Dartois V; Staab D; Weiner D; Goh A; Via L; Barry C; Stoeckli M, High-sensitivity MALDI-MRM-MS imaging of moxifloxacin distribution in tuberculosis-infected rabbit lungs and granulomatous lesions. Anal. Chem. 2011, 83 (6), 2112–2118. [DOI] [PMC free article] [PubMed] [Google Scholar]
- 20.Lanekoff I; Burnum-Johnson K; Thomas M; Short J; Carson JP; Cha J; Dey SK; Yang P; Prieto Conaway MC; Laskin J, High-speed tandem mass spectrometric in situ imaging by nanospray desorption electrospray ionization mass spectrometry. Anal. Chem. 2013, 85 (20), 9596–9603. [DOI] [PMC free article] [PubMed] [Google Scholar]
- 21.Prentice BM; Chumbly CW; Caprioli RM, High-speed MALDI TOF/TOF imaging mass spectrometry using continuous raster sampling. J. Mass Spectrom. 2015, 50 (4), 703–710. [DOI] [PMC free article] [PubMed] [Google Scholar]
- 22.Debois D; Bertrand V; Quinton L; De Pauw-Gillet M-C; De Pauw E, MALDI-in source decay applied to mass spectrometry imaging: a new tool for protein identification. Anal. Chem. 2010, 82 (10), 4036–4045. [DOI] [PubMed] [Google Scholar]
- 23.Nilsson A; Fehniger TE; Gustavsson L; Andersson M; Kenne K; Marko-Varga G; Andre PE, Fine mapping the spatial distribution and concentration of unlabeled drugs within tissue micro-compartments using imaging mass spectrometry. PLoS One 2010, 5 (7), e11411. [DOI] [PMC free article] [PubMed] [Google Scholar]
- 24.Korte AR; Lee YJ, Multiplex mass spectrometric imaging with polarity switching for concurrent acquisition of positive and negative ion images. J. Am. Soc. Mass Spectrom. 2013, 24 (6), 949–955. [DOI] [PubMed] [Google Scholar]
- 25.Yagnik GB; Korte AR; Lee YJ, Multiplex mass spectrometry imaging for latent fingerprints. J. Mass Spectrom. 2013, 48 (1), 100–104. [DOI] [PubMed] [Google Scholar]
- 26.Feenstra AD; Hansen RL; Lee YJ, Multi-matrix, dual polarity, tandem mass spectrometry imaging strategy applied to a germinated maize seed: toward mass spectrometry imaging of an untargeted metabolome. Analyst 2015, 140 (21), 7293–7304. [DOI] [PubMed] [Google Scholar]
- 27.Reich RF Quantitative imaging of cocaine and its metabolites in brain tissue by matrix-assisted laser desorption/ionization linear ion trap tandem mass spectrometry. University of Florida; 2010. [Google Scholar]
- 28.McAlister GC; Nusinow DP; Jedrychowski MP; Wuhr M; Huttlin EL; Erickson BK; Rad R; Haas W; Gygi SP, MultiNotch MS3 enables accurate, sensitive, and multiplexed detection of differential expression across cancer cell line proteomes. Anal. Chem. 2014, 86 (14), 7150–7158. [DOI] [PMC free article] [PubMed] [Google Scholar]
- 29.Erickson BK; Jedrychowski MP; McAlister GC; Everley RA; Kunz R; Gygi SP, Evaluating Multiplexed Quantitative Phosphopeptide Analysis on a Hybrid Quadrupole Mass Filter/Linear Ion Trap/Orbitrap Mass Spectrometer. Anal. Chem. 2015, 87 (2), 1241–1249. [DOI] [PMC free article] [PubMed] [Google Scholar]
- 30.Prentice BM; Chumbley CW; Caprioli RM, Absolute Quantification of Rifampicin by MALDI Imaging Mass Spectrometry Using Multiple TOF/TOF Events in a Single Laser Shot. J. Am. Soc. Mass Spectrom. 2017, 28 (1), 136–144. [DOI] [PMC free article] [PubMed] [Google Scholar]
- 31.Prentice BM; Chumbley CW; Hachey BC; Norris JL; Caprioli RM, Multiple Time-of-Flight/Time-of-Flight Events in a Single Laser Shot for Improved Matrix-Assisted Laser Desorption/Ionization Tandem Mass Spectrometry Quantification. Anal. Chem. 2016, 88 (19), 9780–9788. [DOI] [PMC free article] [PubMed] [Google Scholar]
- 32.Hankin JA; Barkley RM; Murphy RC, Sublimation as a method of matrix application for mass spectrometric imaging. J. Am. Soc. Mass Spectrom. 2007, 18 (9), 1646–1652. [DOI] [PMC free article] [PubMed] [Google Scholar]
- 33.Spraggins JM; Caprioli RM, High-speed MALDI-TOF imaging mass spectrometry: rapid ion image acquisition and considerations for next generation instrumentation. J. Am. Soc. Mass Spectrom. 2011, 22 (6), 1022–1031. [DOI] [PMC free article] [PubMed] [Google Scholar]
- 34.Simmons DA, Improved MALDI-MS imaging performance using continuous laser rastering. Applied Biosystems Technical Note 2008, 1–5. [Google Scholar]
- 35.Vestal ML TOF-TOF with high resolution precursor selection and multiplexed MS-MS. US: Patent 7,838,824 B2, 2010.
- 36.Vestal ML Tandem time-of-flight mass spectrometry with simultaneous space and velocity focusing. Patent 8847155, 2014.
- 37.Spengler B, Post-source decay analysis in matrix-assister laser desorption/ionization mass spectrometry of biomolecules. J. Mass Spectrom. 1997, 32, 1019–1036. [Google Scholar]
- 38.Kaufmann R; Chaurand P; Kirsch D; Spengler B, Post-source decay and delayed extraction in matrix-assisted laser desorption/ionization-reflectron time-of-flight mass spectrometry. Are there trade-offs? Rapid Commun. Mass Spectrom. 1996, 10 (10), 1199–1208. [DOI] [PubMed] [Google Scholar]
- 39.Ma Y; Smith D; Hof PR; Foerster B; Hamilton S; Blackband SJ; Yu M; Benveniste H, In vivo 3D digital atlas database of the adult C57BL/6J mouse brain by magnetic resonance microscopy. Frontiers in Neuroanatomy 2008, 2. [DOI] [PMC free article] [PubMed] [Google Scholar]
- 40.Hsu FF; Turk J, Electrospray ionization/tandem quadrupole mass spectrometric studies on phosphatidylcholines: The fragmentation processes. J. Am. Soc. Mass Spectrom. 2003, 14 (4), 352–363. [DOI] [PubMed] [Google Scholar]
- 41.Hamm G; Bonnel D; Legouffe R; Pamelard F; Delbos J-M; Bouzom F; Stauber J, Quantitative mass spectrometry imaging of propranolol and olanzapine using tissue extinction calculation as normalization factor. Journal of Proteomics 2012, 75 (16), 4952–4961. [DOI] [PubMed] [Google Scholar]
Associated Data
This section collects any data citations, data availability statements, or supplementary materials included in this article.


