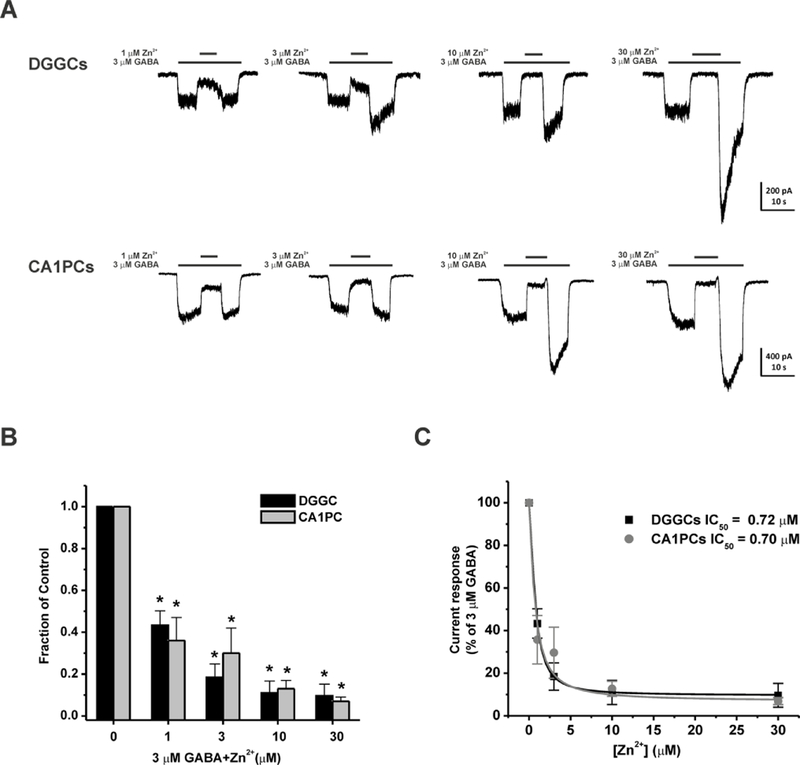
Fig. 1.
Zn2+ blockade of GABA-gated currents is concentration-dependent in dissociated DGGCs and CA1PCs. (A) Representative whole-cell GABAergic current recording from DGGCs and CA1PCs. Zn2+ (1–30 μM) inhibited GABA currents in a concentration-dependent fashion. (B) Fractional block of currents by Zn2+ (1–30 μM). (C) Inhibitory concentration response curves of DGGCs and CA1PCs by Zn2+. DGGCs IC50 = 0.72 μM; CA1PCs IC50 = 0.70 μM. *p<0.05 vs. control. Each bar represents mean ± SEM (n = 4–6 cells per group).

