Abstract
Topic:
Optical coherence tomography (OCT) is a non-invasive tool to measure specific retinal layers in the eye. The relationship of retinal spectral domain-OCT (SD-OCT) measurements with Alzheimer’s Disease (AD) and mild cognitive impairment (MCI) remains unclear. Hence, we conducted a systematic review and meta-analysis to examine the SD-OCT measurements in AD and MCI.
Clinical Relevance:
Current methods of diagnosing early AD are expensive and invasive. Retinal measurements of SD-OCT, which are non-invasive, technically simple and inexpensive, are potential biomarkers of AD.
Methods:
We conducted a literature search in PubMed and EMBASE to identify studies published before 31 December 2017 which assessed the associations between AD, MCI and measurements of SD-OCT: ganglion cell-inner plexiform layer (GC-IPL), ganglion cell complex (GCC), macular volume and choroidal thickness, in addition to retinal nerve fibre layer (RNFL) and macular thickness. We used a random-effect model to examine these relationships. We also conducted meta-regression, and assessed heterogeneity, publication bias and study quality.
Results:
We identified 30 eligible studies, involving 1257 AD subjects, 305 MCI subjects and 1460 controls; all of which were cross-sectional studies. In terms of the macular structure, AD subjects had significant differences in GC-IPL thickness (standardized mean difference [SMD], −0.46; 95% confidence interval [CI], −0.80 to −0.11; I2 = 71%), GCC thickness (SMD, −0.84; 95% CI, −1.10 to −0.57; I2 = 0%), macular volume (SMD, −0.58; 95% CI, −1.03 to −0.14; I2 = 80%) and macular thickness of all inner and outer sectors (SMD ranged −0.52 to −0.74; all p<0.001) when compared to controls. Peripapillary RNFL thickness (SMD, −0.67; 95% CI, −0.95 to −0.38; I2 = 89%) and choroidal thickness (SMD ranged −0.88 to - 1.03; all p<0.001) were also thinner in AD.
Conclusion:
Our results confirmed the associations between retinal measurements of SD-OCT, and AD, highlighting the potential utility of SD-OCT measurements as biomarkers of AD.
Introduction
Alzheimer’s Disease (AD) is the most common cause of dementia, which is a major medical and public health challenge globally.1 Although its pathological changes occur decades before the onset of dementia, AD is typically diagnosed late in the disease course when extensive and irreversible neurodegeneration and vascular damages have already occurred.2–4 Hence, there is currently great interest in discovering new biomarkers that can identify individuals suffered from earlier stages of AD, which are more likely to benefit from any effective treatments.2–4 In the past decade, huge advances have been made in the disease-specific biomarkers based on detection of amyloid-β, tau or neurodegeneration.5–9 These biomarkers not only enable diagnosing AD during live in the stage of dementia, but also earlier in the prodromal stages including mild cognitive impairment (MCI). However, these biomarkers mainly rely on positron emission tomography (PET) imaging or testing of cerebrospinal fluid (CSF), and are not applicable as population-wide screening tools which should be non-invasive, technically simple, and inexpensive.10
The retina has long been considered as a “window” to study disorders in the central nervous system (CNS), as it is an extension of the brain embryologically, anatomically and physiologically.11–15 Extensive loss of retinal ganglion cells (RGCs) and their axons has been reported by histopathologic studies in eyes from AD subjects and AD animal models.16–20 Hence, optical coherence tomography (OCT), which is non-invasive and offers high-resolution images of the retinal structure including neuronal layers, has become an appealing candidate for studying the neurodegenerative changes in AD.21,22 Thus far, studies have repeatedly reported retinal changes in AD using OCT imaging, such as thinning of the retinal nerve fibre layer (RNFL).21,23–31 Although several reviews and meta-analyses attempted to integrate these findings and derive a conclusion,32–36 the associations between AD and retinal changes measured using OCT remain inconclusive.
First, previous reviews and meta-analyses included measurements from both spectral-domain OCT (SD-OCT) and time-domain OCT (TD-OCT), which are not interchangeable.37‘38 TD-OCT is an older generation of OCT and acquires an individual A-scan by moving the reference arm of the interferometer, leading to longer data acquisition time and larger measurement variability. In contrast, SD-OCT, which is the second generation of OCT, measures the retina with a spectrometer in the detection arm of the interferometer and converts the signals into depth information by Fourier transformation.39,40 When compared to TD-OCT, SD-OCT provides better scan resolution (~5 μm for SD-OCT vs 10 μm for TD-OCT), higher sensitivity (150-fold improvement), faster scan speed, and improved signal-to-noise ratio.41–45 SD-OCT can also segment individual retinal layers more accurately and with greater details. Any injuries that manifest as a distortion of the normal retinal architecture can be more easily detected with SD-OCT than with TD-OCT.46–54 den Haan and his colleagues have already demonstrated the discrepancy of peripapillary RNFL thickness between TD-OCT and SD-OCT in their recent meta-analysis.35
Second, previous meta-analyses only assessed the differences of RNFL thickness and macular thickness in AD. Improved resolution of SD-OCT has now enabled assessment of additional retinal neuronal layers at the macula, which could not be reliably identified and demarcated previously using TD-OCT. Among these layers, thinning of the macular ganglion cell-inner plexiform layer (GC-IPL), macular ganglion cell complex (GCC) (consisting of RNFL and GC-IPL) and macular volume has been associated with AD.55–71 Since the macula contains more than 50% of total RGCs whose the size of cell bodies is 10 to 20 times the diameter of their axons, thinning of the macular GC-IPL could be more sensitive to AD pathology than RNFL thinning.56 Also, the GC-IPL thickness is less influenced by individual variation when compared to RNFL thickness.53
In view of these limitations in the previous meta-analyses, we conducted a systematic review and meta-analysis to evaluate the differences of SD-OCT measurements in AD and MCI. We only included studies using SD-OCT and comprehensively examined a wide spectrum of SD-OCT measurements in relation to AD and MCI. Our data suggested that the retinal and choroidal layers measured by SD-OCT are significantly thinner in AD and, to a lesser extent, in MCI.
METHODS
Eligibility criteria
We conducted a systemic review and meta-analysis to assess the differences of SD-OCT measurements in AD and MCI, according to the Meta-analysis Of Observational Studies in Epidemiology (MOOSE) guideline.72 For inclusion in the meta-analysis a study must meet the following criteria: (1) an original human study with case-control, cross-sectional or prospective design; (2) the study recruited subjects with AD, MCI or “cognitive impairment, no dementia” (CIND), in addition to controls; (3) SD- OCT was used and the measurements were reported as mean and standard deviation (or standard error) for each study group; and (4) AD, MCI and CIND subjects were diagnosed according to established diagnostic systems (e.g. DSM-III, DSM-IV, NINDS-ADRDA, Petersen Criteria). Although the definitions of “MCI” and “CIND” are not identical, we included studies recruiting either MCI or CIND subjects as both MCI and CIND encompass the intermediate state between normal elderly cognition and dementia, and indicate an increased risk of dementia.73 We excluded records not related to AD and OCT, studies using TD-OCT, conference abstracts, letters to the editor, non-English records, animal studies, reviews and case studies. We also excluded any studies with low quality using the QUADAS-2 tool, such as studies that diagnosed AD or MCI using unestablished diagnostic criteria, and studies with inappropriate statistical analysis.
Search methods
Two independent reviewers (CVT and SZ) conducted a literature search in PubMed and Excerpta Medica Database (EMBASE) using a hierarchical search strategy. We used the medical subject headings (MeSH) for the PubMed query. We first searched for “Optical Coherence Tomography”, “Tomography, Optical Coherence [MeSH Terms]” and “Spectral Domain”. Then, the search results were refined using one of the following keywords: “Dementia [MeSH Terms]”, “Dementia”, “Alzheimer’s Disease [MeSH Terms]”, “Alzheimer”, “Neurobehavioral Manifestations [MeSH Terms]”, “Cognitive Dysfunction [MeSH Terms]”, “Cognitive Dysfunction”, “Cognitive Impairment”, and “Cognitive Decline”. The literature search was limited to full-text manuscripts written in English and published in peer-reviewed journals before 31 December 2017. The list of the detailed search strategy is provided in Table 1 (available at www.aaojournal.org). To reduce the chance of missing relevant articles, we also manually searched the reference lists of all primary articles and review articles.
Table 1:
Detailed Search Strategy: Two independent reviewers (CVT and SZ) conducted a literature search in PubMed and Excerpta Medica Database (EMBASE) using a hierarchical search strategy. Medical subject headings (MeSH) were used for the PubMed query. The literature search was limited to full-text manuscripts written in English and published in peer-reviewed journals before 31 December 2017.
| PubMed |
|---|
| Search Items | Results |
|---|---|
| “tomography, optical coherence”[MeSH Terms] AND “dementia”[MeSH Terms] | 58 |
| “tomography, optical coherence”[MeSH Terms] AND “cognitive dysfunction”[MeSH Terms] | 10 |
| “tomography, optical coherence”[MeSH Terms] AND “neurobehavioral manifestations”[MeSH Terms] | 35 |
| “tomography, optical coherence”[MeSH Terms] AND “alzheimer disease”[MeSH Terms] | 48 |
| (“tomography, optical
coherence”[MeSH Terms] OR (“tomography”[All Fields]
AND “optical”[All Fields] AND
“coherence”[All Fields]) OR “optical coherence
tomography”[All Fields] OR (“optical”[All Fields]
AND “coherence”[All Fields] AND “tomography”[All Fields])) AND (“dementia”[MeSH Terms] OR “dementia”[All Fields]) |
93 |
| (“tomography, optical
coherence”[MeSH Terms] OR (“tomography”[All Fields]
AND “optical”[All Fields] AND
“coherence”[All Fields]) OR “optical coherence
tomography”[All Fields] OR (“optical”[All Fields]
AND “coherence”[All Fields] AND
“tomography”[All Fields])) AND (“alzheimer
disease”[MeSH Terms] OR (“alzheimer”[All Fields]
AND “disease”[All Fields]) OR “alzheimer disease”[All Fields] OR “alzheimer”[All Fields]) |
76 |
| (“tomography, optical
coherence”[MeSH Terms] OR (“tomography”[All Fields]
AND “optical”[All Fields] AND
“coherence”[All Fields]) OR “optical coherence
tomography”[All Fields] OR (“optical”[All Fields]
AND “coherence”[All Fields] AND
“tomography”[All Fields])) AND (“cognitive
dysfunction”[MeSH Terms] OR (“cognitive”[All
Fields] AND “dysfunction”[All Fields]) OR
“cognitive dysfunction”[All Fields] OR
(“cognitive”[All Fields] AND
“impairment”[All Fields]) OR “cognitive impairment”[All Fields]) |
62 |
| (“tomography, optical
coherence”[MeSH Terms] OR (“tomography”[All Fields]
AND “optical”[All Fields] AND
“coherence”[All Fields]) OR “optical coherence
tomography”[All Fields] OR (“optical”[All Fields]
AND “coherence”[All Fields] AND
“tomography”[All Fields])) AND (“cognitive
dysfunction”[MeSH Terms] OR (“cognitive”[All
Fields] AND “dysfunction”[All Fields]) OR
“cognitive dysfunction”[All Fields] OR
(“cognitive”[All Fields] AND “decline”[All
Fields]) OR “cognitive decline”[All Fields]) |
34 |
| (Spectral[All Fields] AND (“protein
domains”[MeSH Terms] OR (“protein”[All Fields] AND
“domains”[All Fields]) OR “protein domains”[All Fields] OR “domain”[All Fields])) AND (“dementia”[MeSH Terms] OR “dementia”[All Fields]) |
50 |
| (Spectral[All Fields] AND (“protein
domains”[MeSH Terms] OR (“protein”[All Fields] AND
“domains”[All Fields]) OR “protein
domains”[All Fields] OR “domain”[All Fields])) AND
(“alzheimer disease”[MeSH Terms] OR
(“alzheimer”[All Fields] AND “disease”[All Fields]) OR “alzheimer disease”[All Fields] OR “alzheimer”[All Fields]) |
36 |
| (Spectral[All Fields] AND (“protein
domains”[MeSH Terms] OR (“protein”[All Fields] AND
“domains”[All Fields]) OR “protein
domains”[All Fields] OR “domain”[All Fields])) AND
(“cognitive dysfunction”[MeSH Terms] OR
(“cognitive”[All Fields] AND
“dysfunction”[All Fields]) OR “cognitive
dysfunction”[All Fields] OR
(“cognitive”[All Fields] AND “impairment”[All Fields]) OR “cognitive impairment”[All Fields]) |
25 |
| (Spectral[All Fields] AND (“protein
domains”[MeSH Terms] OR (“protein”[All Fields] AND
“domains”[All Fields]) OR “protein
domains”[All Fields] OR “domain”[All Fields])) AND
(“cognitive dysfunction”[MeSH Terms] OR
(“cognitive”[All Fields] AND
“dysfunction”[All Fields]) OR “cognitive
dysfunction”[All Fields] OR
(“cognitive”[All Fields] AND “decline”[All Fields]) OR “cognitive decline”[All Fields]) |
20 |
| Total: | 547 |
| Excerpta Medica Database (EMBASE) |
|---|
| Search Items | Results |
|---|---|
| (Optical Coherence Tomography and Dementia).af. | 130 |
| (Optical Coherence Tomography and Alzheimer).af. | 235 |
| (Optical Coherence Tomography and Cognitive Dysfunction).af. | 12 |
| (Optical Coherence Tomography and Cognitive Impairment).af. | 112 |
| (Optical Coherence Tomography and Cognitive Decline).af. | 29 |
| (Spectral Domain and Dementia).af. | 47 |
| (Spectral Domain and Alzheimer).af. | 79 |
| (Spectral Domain and Cognitive Dysfunction).af. | 4 |
| (Spectral Domain and Cognitive Impairment).af. | 34 |
| (Spectral Domain and Cognitive Decline).af. | 15 |
| Total: | 697 |
Study selection and risk of bias assessment
After removing duplicated records, we adopted a three-phase selection process because of the limited specificity of the computerized literature search. In the first phase, two reviewers (CVT and SZ) independently screened the titles and abstracts to identify articles relevant to either AD or SD-OCT. Studies not related to AD and OCT were excluded at this stage. In the second phase, the same reviewers evaluated the full-texts of the remaining studies to assess the study design and the publication type. We excluded studies with a study design that did not meet the inclusion criteria or violate any of the exclusion criteria (e.g. studies that used TD-OCT for the measurement or did not assess SD-OCT measurements in subjects with AD, MCI, or CIND). We also excluded conference abstracts, letters to the editor, non- English records, animal studies, reviews and case studies by full-text evaluation. Lastly, we assessed the methodological quality of the remaining studies with the QUADAS-2 tool to exclude studies with low quality (if any). The QUADAS-2 tool is an evidence-based quality assessment tool for systematic reviews of diagnostic accuracy studies.74 It assesses the risk of bias and concerns regarding applicability in four domains including patient selection, index test, reference standard, and flow and timing. We also assessed the quality of reporting OCT measurements with reference to the Advised Protocol for OCT Study Terminology and Elements (APOSTEL) recommendations.75 In the whole study selection process, four disagreements between the two reviewers were resolved by discussions with a senior reviewer (CYC).
Data collection
Two reviewers (CVT and SZ) independently extracted data into a customized database. Extracted information included authors and title of the study, publication year, method of eye selection (i.e. selection of one eye or both eyes of each subject for analysis), OCT model, details of each study population including sample size (e.g. number of subjects and number of eyes), mean age, proportion of males, mean score of the mini-mental state examination (MMSE),76 and the outcome variables of SD- OCT measurements (in mean and SD). The SD-OCT measurements extracted included the average values and, if any, the value of each sub-sector of the measured area. We also recorded the exclusion status (i.e. excluded vs not excluded) of age-related macular degeneration, severe hypertension and severe diabetes mellitus, which are potential confounders of SD-OCT measurements. We did not include measurements of peripapillary GC-IPL and macular RNFL because cell bodies of RGCs are mainly located at the macular region while the peripapillary region has the highest concentration of RGC axons that are exiting the retina. We extracted all reported data from published articles and did not contact the authors for missing information. We converted standard errors to standard deviations and calculated the average values of multiple sub-sectors using the built-in calculator of RevMan (version 5.3; Cochrane Collaboration, Oxford, United Kingdom).
Data synthesis and analysis
We used Stata (StataCorp, Texas; version 14.0) for assessment of publication bias and metaregression, and Revman (version 5.3; Cochrane Collaboration, Oxford, United Kingdom) for other statistical analyses. We used means and standard deviations to assess the standard mean difference (SMD) and the weighted mean difference (WMD), with respective 95% confidence interval (CI). All metaanalyses adopted random-effect models. We assessed heterogeneity by the Higgins I2 test. We also assessed potential publication bias using funnel plots with the log OR of each study on the x-axis plotted against its standard error in the y-axis, as well as by the Egger’s Tests.77
We performed random-effects meta-regression using Stata to assess the impact of study characteristics and potential confounders on the effect sizes, using SMDs as the outcome variables. The explanatory variables included mean MMSE scores, the mean age differences between study groups, the method of eye selection (i.e. single-eye dataset vs paired-eyes dataset), types of OCT model, the proportion of males in each study group, and exclusion status of age-related macular degeneration, severe hypertension and severe diabetes mellitus. The residual between-study variance was estimated using the restricted maximum likelihood method.
In addition, we performed subgroup analyses according to the types of OCT model and the method eye selection (i.e. single-eye or paired-eyes dataset). Since the study by Golzan et al. did not provide information on the eye selection,78 it was not included in the latter subgroup analysis. We also performed a subgroup analysis which only included studies without missing information.
RESULTS
Figure 1 summarizes the selection process for the 30 studies included in the meta-analysis. The initial literature search identified 1244 articles (697 articles in EMBASE and 547 articles in PubMed), of which 801 duplicates were excluded. In the first phase of the study selection, the remaining 443 records were screened based on their titles and abstracts, and 284 studies not related to AD and SD-OCT were excluded. We then reviewed the full text of the remaining 159 studies in the second phase, and 129 more studies were excluded, including 10 studies using TD-OCT.79–88 The study by Castejon et al. was not included in the meta-analysis as it did not report sectorial macular thicknesses.89 In addition, although Bayhan et al.55 and Pillai et al.60 measured thickness of the outer retina and metrics related to the optic disc (cup-disc ratio, cup volume, disc area and rim area) respectively, the number of studies was not sufficient to conduct meta-analyses.
Figure 1:
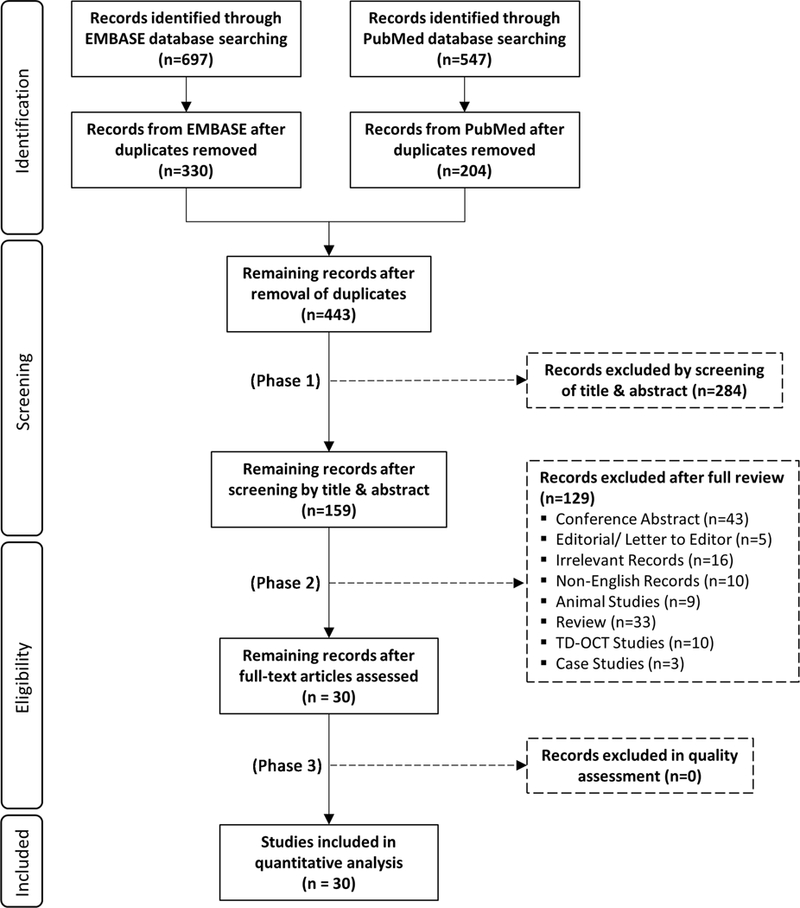
PRISMA flowchart of study inclusion
Finally, we identified 30 studies for the meta-analysis (Table 2; available at www.aaojournal.org); 6 measured macular GC-IPL thicknesses, 56‘58‘60‘64‘66‘70 10 measured macular thickness,57‘59‘61‘62‘64–66‘69‘71‘90 24 measured peripapillary RNFL thickness,56‘57‘60–69‘71‘78‘91–100 4 measured macular GCC thickness, 55,59,66,67 7 measured macular volume, 60‘61‘63‘64‘68‘70‘71 and 5 measured choroidal thickness.55‘69‘90‘101‘102 All studies were cross-sectional and there were no prospective studies published before 31 December 2017. The mean ages of AD, MCI and control groups did not differ significantly in all studies. The mean MMSE score of the control group ranged from 27.4 to 29.78, while that of the MCI group ranged from 23.1 to 27.4 and that of the AD group ranged from 14.1 to 23.3. However, 15 studies did not report the mean MMSE scores.56‘57‘60–62‘64‘65‘67‘78‘91‘92‘94–96‘102 With an exception of the study by Golzan et al.,78 all other studies excluded subjects with a history of glaucoma. While most studies selected either eye of each subject for the statistical analysis (i.e. a single-eye dataset), 8 studies analyzed the OCT measurements of both eyes.60‘66‘68‘69‘90‘96–98 Regarding the OCT models, 13 studies used the Cirrus HD-OCT,56–58‘60–62‘64‘68‘7l’90‘9l’95‘98 10 studies used the Heidelberg Spectralis,59‘65‘69‘70‘92‘93‘96‘99‘101‘102 3 studies used the Topcon 3D-OCT,63‘66‘97 and 4 studies used other OCT models, including Optovue RTVue-100, Nidek Co. SD- OCT and OPKO-OTI.55‘67‘78‘94
Table 2:
Summary of the Included Studies
| Studies | No. of Subjects | Eye | Mean MMSE score ± SD | Mean Age ± SD | OCT Model | Macular GC-IPL | Macular Thickness | Macular Volume | pRNFL | mGCC | Choroidal Thickness |
|---|---|---|---|---|---|---|---|---|---|---|---|
| Bambo 2015 91 | 56 ADs | S | 16.56 ± NR | 74.0 ± 8.1 | C | NR | NR | NR | R | NR | NR |
| 56 Controls | NR | 76.4 ± 8.4 | |||||||||
| Bayhan 2015 55 | 31 ADs | S | 17.38 ± 4.93 | 75.8 ± 6.5 | O | NR | NR | NR | NR | R [j] | R |
| 30 Controls | 29.30 ± 0.70 | 74.9 ± 7.6 | |||||||||
| Bulut 2016 90 | 41 ADs | B | 19.39 ± 18 | 73.34 ± 7.0 | C | NR | R | NR | NR | NR | R [k] |
| 38 MCIs | 24.84 ± 0.9 | 71.68 ± 7.4 | |||||||||
| 44 Controls | 27.64 ± 1.2 | 70.65 ± 7.5 | |||||||||
| Cheung 2015 56 | 100 ADs [a] | S | NR | 73.5 ± 6.23 | C | R | NR | NR | R | NR | NR |
| 41 MCIs [a] | NR | 70.4 ± 10.20 | |||||||||
| 123 Controls | NR | 65.7 ± 3.77 | |||||||||
| Choi 2016 64 | 42 ADs [b] | S | 14.1 ± 5.5 | 76.8 ± 8.70 | C | R | R [i] | R | R | NR | NR |
| 26 MCIs [b] | 23.1 ± 4.6 | 74.7 ± 7.80 | |||||||||
| 66 Controls [b] | NR | 73.8 ± 7.50 | |||||||||
| Cunha 2016 66 | 24 ADs [c] | B | 17.02 ± 5.20 | 74.80 ± 6.25 | T | R | R | NR | R | R | NR |
| 24 Controls [c] | 29.08 ± 1.62 | 72.25 ± 7.31 | |||||||||
| Cunha 2017 65 | 50 ADs | S | NR | 73.1 ± 5.36 | H | NR | R | NR | R | NR | NR |
| 152 Controls | NR | 71.0 ± 4.62 | |||||||||
| Cunha 2017a 102 | 50 ADs | S | NR | 73.1 ± 5.36 | H | NR | NR | NR | NR | NR | R |
| 152 Controls | NR | 71.0 ± 4.62 | |||||||||
| Eraslen 2015 67 | 20 ADs [d] | S | NR | 73.6 ± 10.7 | O | NR | NR | NR | R | R | NR |
| 20 Controls [d] | NR | 73.3 ± 9.6 | |||||||||
| Ferrari 2017 92 | 37 ADs | S | 20.05 ± 4.84 | 70.43 ± 7.20 | H | NR | NR | NR | R | NR | NR |
| 29 MCIs | 26.62 ± 2.19 | 70.45 ± 5.51 | |||||||||
| 49 Controls | NR | 68.32 ± 6.96 | |||||||||
| Garcia-Martin 2016 93 | 150 ADs | S | 18.35 ± 3.33 | 75.33 ± NR | H | NR | NR | NR | R | NR | NR |
| 75 Controls | 29.78 ± 1.01 | 74.79 ± NR | |||||||||
| Gao 2015 68 | 25 ADs | B-M | 19.24 ± 0.64 | 74.72 ± 1.39 | C | NR | NR | R | R | NR | NR |
| 26 MCIs | 25.77 ± 0.35 | 73.42 ± 1.54 | |||||||||
| 21 Controls | 28.57 ± 0.25 | 72.05 ± 1.02 | |||||||||
| Gharbiya 2014 69 | 21 ADs | B | 22.2 ± 1.7 | 73.1 ± 6.9 | H | NR | R [i] | NR | R | NR | R |
| 21 Controls | 28.2 ± 1.5 | 70.3 ± 7.3 | |||||||||
| Golzan 2017 78 | 28 ADs | NR | NR | 70 ± 9 | O | NR | NR | NR | R | NR | NR |
| 50 Controls | NR | 79 ± 5 | |||||||||
| Gunes 2014 94 | 40 ADs | S | 21.9 ± 2.13 | 75.02 ± 6.34 | O | NR | NR | NR | R | NR | NR |
| 40 Controls | NR | 74.15 ± 5.76 | |||||||||
| Kirbas 2013 95 | 40 ADs | S | NR | 69.3 ± 4.9 | C | NR | NR | NR | R | NR | NR |
| 40 Controls | NR | 68.9 ± 5.1 | |||||||||
| Knoll 2016 70 | 17 MCIs [d] | S | 27 ± 3.72 | 74 ± NR | H | R | NR | R | R | NR | NR |
| 17 Controls [d] | 29 ± 0.70 | 74 ± NR | |||||||||
| Kromer 2014 96 | 22 ADs [e] | B-M | 22.59 ± 5.47 | 75.9 ± 6.1 | H | NR | NR | NR | R | NR | NR |
| 22 Controls [e] | NR | 64.0 ± 8.2 | |||||||||
| Kwon 2017 71 | 30 ADs | S | 17.2 ± 4.29 | 73.60 ± 3.67 | C | NR | R | R | R | NR | NR |
| 30 MCIs | 24.17 ± 3.26 | 72.17 ± 4.98 | |||||||||
| 30 Controls | 27.47 ± 1.20 | 70.93 ± 4.68 | |||||||||
| Larrosa 2014 57 | 151 ADs | S | 18.31 ± 3.28 | 75.29 ± NR | H & C [g] | NR | R | NR | R | NR | NR |
| 61 Controls | NR | 74.87 ± NR | |||||||||
| Liu 2016 58 | 47 ADs [f] | S | 16.6 ± 5.20 | 75.2 ± 7.80 | C | R | NR | NR | NR | NR | NR |
| 68 CINDs [f] | 25.2 ± 3.30 | 69.7 ± 8.20 | |||||||||
| 65 Controls [f] | 27.4 ± 2.00 | 67.3 ± 6.20 | |||||||||
| Marziani 2013 59 | 21 ADs | S | 19.9 ± 3.1 | 79.3 ± 5.7 | H & O [h] | NR | R | NR | NR | R | NR |
| 21 Controls | 27.9 ± 1.3 | 77.0 ± 4.2 | |||||||||
| Moreno-Ramos 2013 97 | 10 ADs | B-M | 16.4 ± 1.4 | 73.0 ± 6.5 | T | NR | NR | NR | R | NR | NR |
| 10 Controls | 29.2 ± 0.8 | 70.2 ± 5.5 | |||||||||
| Oktem 2015 98 | 35 ADs | B-M | 18 ± NR | 75.4 ± 6.9 | C | NR | NR | NR | R | NR | NR |
| 35 MCIs | 28 ± NR | 74.1 ± 6.3 | |||||||||
| 35 Controls | 29 ± NR | 70.2 ± 8.0 | |||||||||
| Pillai 2016 60 | 21 ADs | B-M | NR | 65.8 ± 11.1 | C | R | NR | R | R | NR | NR |
| 21 MCIs | NR | 68.2 ± 6.7 | |||||||||
| 34 Controls | NR | 65.1 ± 8.3 | |||||||||
| Polo 2014 61 | 75 ADs | S | 15.96 ± 7.3 | 74.15 ± 9.15 | H & C [g] | NR | R | R | R | NR | NR |
| 75 Controls | NR | 73.98 ± 9.05 | |||||||||
| Polo 2017 62 | 24 ADs | S | 15.54 ± 7.1 | 74.2 ± 8.88 | C | NR | R | NR | R | NR | NR |
| 24 Controls | NR | 72.94 ± 7.40 | |||||||||
| Salobrar-Garcia 2015 63 | 23 ADs | S | 23.3 ± 3.1 | 79.3 ± 4.60 | T | NR | NR | R | R | NR | NR |
| 28 Controls | 28.2 ± 1.9 | 72.3 ± 5.10 | |||||||||
| Trebbastoni 2016 99 | 36 ADs | S | 22.7 ± NR | 72 ± 7.3 | H | NR | NR | NR | R | NR | NR |
| 36 Controls | 28.6 ± NR | 71.7 ± 6.0 | |||||||||
| Trebbastoni 2017 101 | 39 ADs | S | 22.5 ± 2.1 | 71.1 ± 7.2 | H | NR | NR | NR | NR | NR | R |
| 39 Controls | 28.6 ± 1.4 | 70.8 ± 6.7 | |||||||||
| Total: | 6 | 10 | 7 | 24 | 4 | 5 | |||||
Of these, only 99 AD subjects and 41 MCI subjects had measurements of GC-IPL thickness, whereas only 92 AD subjects and 40 MCI subjects had measurements of RNFL thickness.
The study categorized the study subjects according to the clinical dementia rating (CDR) severity. For the meta-analysis, we included the 30 subjects with CDR ≥ 1, all of which were also diagnosed as AD, and the 66 subjects with CDR = 0, all of which were considered as controls. The study did not report the SD-OCT measurements of the MCI subjects.
The study analyzed a total of 93 eyes, including 45 eyes from 24 AD subjects and 48 eyes from 24 controls.
The study reported SD-OCT measurements of both eyes independently. For simplicity, we selected measurements from the left eyes for the meta-analysis.
The study analyzed 42 eyes from 22 patients with mild to moderate AD and 42 eyes from 22 age- and sex-matched healthy controls.
The study excluded a total of 56 subjects, including18 controls, 18 CIND subjects and 20 AD subjects from the analysis of GC-IPL thickness
We selected SD-OCT measurements measured using Cirrus HD-OCT for the meta-analysis
We selected SD-OCT measurements measured using Heidelberg Spectralis for the meta-analysis
The study only reported macular thickness at the fovea
The study only reported the GCC thickness of the superior and inferior sector of the macula
The study reported choroidal thickness in seven locations: at the fovea; at 500, 1500, and 3000 microns temporal to the fovea; and at 500, 1500, and 3000 microns nasal to the fovea
Abbreviations:
R= Reported; NR = Not Reported; MMSE = Mini-Mental State Examination; OCT = Optical Coherence Tomography; GC-IPL = Ganglion cell-inner plexiform layer; pRNFL = Peripapillary retinal nerve fibre layer; mGCC = Macular ganglion cell complex, which consists of RNFL and GC-IPL; SD = Standard deviation. Subjects: AD = Alzheimer’s Disease; MCI = Mild cognitive impairment; CIND = cognitive impairment with no dementia;
Eye: S= Measurements of either single eye from each subject were selected; B-M: Means of SD-OCT measurements of both eyes were used for analysis; B: SD- OCT measurements of both eyes were considered independently in the analysis
OCT Model: C= Cirrus HD-OCT; H = Heidelberg Spectralis; T = Topcon 3D OCT; O = others, including Optovue RTVue-100, OPKO-OTI, Nidek Co
Macular Ganglion Cell-Inner Plexiform Layer (GC-IPL) Thickness
6 studies examined the macular GC-IPL thickness in 201 AD patients (222 eyes), 129 MCI patients (129 eyes) and 311 controls (335 eyes).56‘58‘60‘64‘66‘70 The thickness of the ganglion cell layer (GCL) was reported together with that of the inner plexiform layer (IPL) as the GC-IPL thickness because the boundary between GCL and IPL is detectable only in the nearest foveal region due to similar reflectivity.59 When compared to controls, AD patients had significantly thinner average GC-IPL thickness (SMD, −0.46; 95% CI, −0.80 to −0.11; p=0.01; I2 = 71%), which corresponded to an absolute decrease of 3.66μm (95% CI, −6.49 - −0.83; p=0.01) (Figure 2; available at www.aaojournal.org) (Table 3). The GC-IPL thinning occurred in most sub-sectors of the macula, except the superotemporal sector: superior (SMD, −0.41; 95% CI, −0.71 to −0.10; p=0.009), superonasal (SMD, −0.51; 95% CI, −0.94 to −0.09; p=0.02), inferonasal (SMD, −0.47; 95% CI, −0.81 to −0.13; p=0.006), inferior (SMD, −0.64; 95% CI, −1.23 to −0.05; p=0.03), inferotemporal (SMD, −0.49; 95% CI, −0.86 to −0.13; p=0.008) (Figure 3; available at www.aaojournal.org).
Figure 2: Difference in the novel SD-OCT measurements between subjects with Alzheimer’s Disease (AD) and controls.
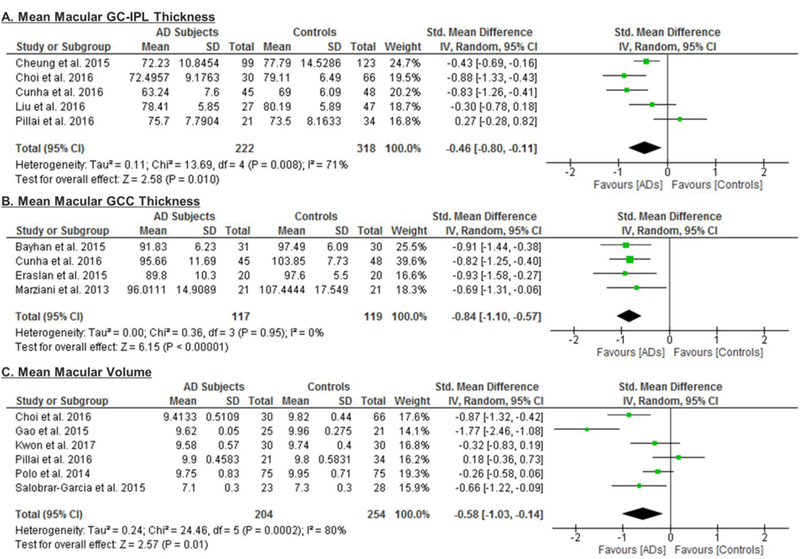
The meta-analyses were conducted with a random-effects model and unadjusted results were reported. The size of the squares denotes the weight attributed to each article, and the horizontal lines represent the 95% confidence intervals (CI). The diamonds represent the standardized mean differences with the width showing the 95% CI. Abbreviations: AD = Alzheimer’s Disease; GC-IPL = Ganglion cell-inner plexiform layer; GCC = Ganglion cell complex.
Table 3: Differences of SD-OCT measurements between AD and controls.
We used means and standard deviations to assess the standard mean difference (SMD) and the weighted mean difference (WMD), with respective 95% confidence intervals (CIs). Heterogeneity of the included studies was assessed using standardized mean differences. Random-effects models were used in all analyses. p-values marked in bold indicate significance on the 95% confidence limit.
| Variables | Overall Effect | Heterogeneity | Egger’s | ||||
|---|---|---|---|---|---|---|---|
| SMD (95% CI) | p value | WMD (95% CI) | p value | I2, % | Q (P) | ||
| Macular GC-IPL | |||||||
| Mean | −0.46 [−0.80, −0.11] | 0.01 | −3.66 [−6.49, −0.83] | 0.01 | 71% | 0.008 | 0.794 |
| Superior | −0.41 [−0.71, −0.10] | 0.009 | −5.23 [−8.29, −2.18] | 0.0008 | 36% | 0.21 | − |
| Superonasal | −0.51 [−0.94, −0.09] | 0.02 | −6.05 [−9.06 - −3.04] | <0.0001 | 63% | 0.10 | − |
| Inferonasal | −0.47 [−0.81, −0.13] | 0.006 | −5.64 [−8.36 - −2.92] | <0.0001 | 46% | 0.17 | − |
| Inferior | −0.64 [−1.23, −0.05] | 0.03 | −7.42 [−10.63 - −4.21] | <0.00001 | 80% | 0.02 | − |
| Inferotemporal | −0.49 [−0.86, −0.13] | 0.008 | −5.46 [−8.05 - −2.88] | <0.0001 | 52% | 0.15 | − |
| Superotemporal | −0.46 [−0.96, +0.04] | 0.07 | −4.80 [−7.68 - −1.92] | 0.001 | 73% | 0.05 | − |
| Macular GCC | |||||||
| Mean | −0.84 [−1.10, −0.57] | <0.00001 | −7.04 [−9.20, −4.88] | <0.00001 | 0% | 0.95 | 0.98 |
| Macular Volume | −0.58 [−1.03, −0.14] | 0.01 | −0.23 [−0.35, −0.10] | 0.0003 | 80% | 0.0002 | 0.571 |
| Choroidal Thickness | |||||||
| Sub-foveal | −1.03 [−1.31, −0.74] | <0.00001 | −64.60 [−86.37, −42.83] | <0.00001 | 59% | 0.05 | 0.616 |
| 1.5mm nasal | −0.89 [−1.18, −0.61] | <0.00001 | −53.92 [−77.17, −30.67] | <0.00001 | 43% | 0.16 | 0.073 |
| 1.5mm inferior | −0.88 [−1.14, −0.63] | <0.00001 | −58.62 [−81.11, −36.14] | <0.00001 | 29% | 0.24 | 0.96 |
| 1.5mm temporal | −0.57 [−1.31, 0.17] | 0.13 | −28.75 [−65.13, 7.62] | 0.12 | 91% | <0.00001 | 0.632 |
| 1.5mm superior | −0.92 [−1.14, −0.71] | <0.00001 | −55.15 [−74.82, −35.48] | 0.0003 | 0% | 0.47 | 0.041 |
| Peripapillary RNFL | |||||||
| Mean | −0.67 [−0.95, −0.38] | <0.00001 | −5.99 [−8.89, −3.09] | <0.0001 | 89% | <0.00001 | 0.020 |
| Superior | −0.97 [−1.39, −0.55] | <0.00001 | −15.33 [−25.15, −5.51] | 0.002 | 94% | <0.00001 | − |
| Nasal | −0.26 [−0.43, −0.09] | 0.003 | −3.14 [−5.20, −1.07] | 0.004 | 66% | <0.0001 | − |
| Inferior | −0.40 [−0.64, −0.16] | 0.001 | −7.04 [−11.51, −2.57] | 0.001 | 83% | <0.00001 | − |
| Temporal | −0.32 [−0.52, −0.13] | 0.001 | −3.58 [−5.40, −1.77] | <0.0001 | 74% | <0.00001 | − |
| Macular Thickness | |||||||
| Fovea | −0.18 [−0.36, 0.00] | 0.06 | −4.38 [−8.95, 0.18] | 0.06 | 58% | 0.01 | 0.867 |
| Inner Superior | −0.62 [−0.86, −0.38] | <0.00001 | −12.85 [−17.55, −8.14] | <0.00001 | 65% | 0.005 | 0.193 |
| Inner Nasal | −0.55 [−0.82, −0.29] | <0.0001 | −10.45 [−15.55, −5.36] | 0.0002 | 72% | 0.0007 | 0.227 |
| Inner Inferior | −0.74 [−1.07, −0.41] | <0.0001 | −14.56 [−21.03, −8.09] | <0.00001 | 81% | <0.00001 | 0.495 |
| Inner Temporal | −0.58 [−0.81, −0.35] | <0.00001 | −10.84 [−14.93, −6.74] | <0.00001 | 63% | 0.008 | 0.19 |
| Outer Superior | −0.65 [−0.91, −0.40] | <0.00001 | −11.59 [−16.23, −6.96] | <0.00001 | 69% | 0.002 | 0.586 |
| Outer Nasal | −0.70 [−1.04, −0.36] | <0.0001 | −12.59 [−19.15, −6.02] | 0.0002 | 83% | <0.00001 | 0.205 |
| Outer Inferior | −0.52 [−0.74, −0.30] | <0.00001 | −9.71 [−14.11, −5.30] | <0.00001 | 60% | 0.02 | 0.845 |
| Outer Temporal | −0.57 [−0.75, −0.39] | <0.00001 | −10.24 [−13.40, −7.08] | <0.00001 | 39% | 0.12 | 0.385 |
Abbreviations:
AD = Subjects with Alzheimer’s Disease; C = Controls; SMD = Standardized mean difference; WMD = Weighted mean difference; GC-IPL = Ganglion cell-inner plexiform layer thickness; GCC = Ganglion cell complex thickness; RNFL = Retinal nerve fibre layer thickness
Figure 3: Difference in the sectorial macular GC-IPL thicknesses between subjects with Alzheimer’s Disease (AD) and controls.
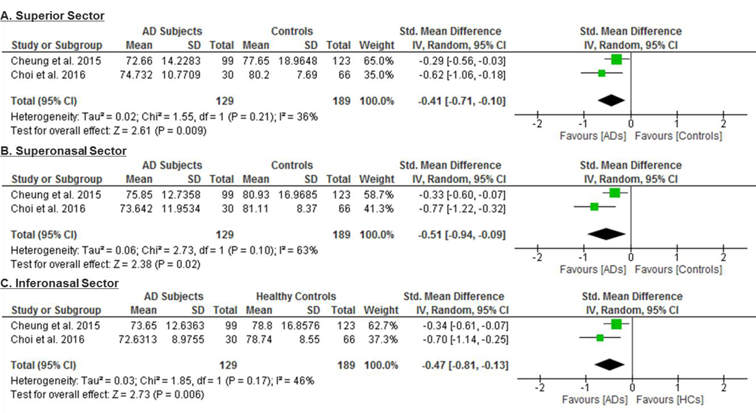
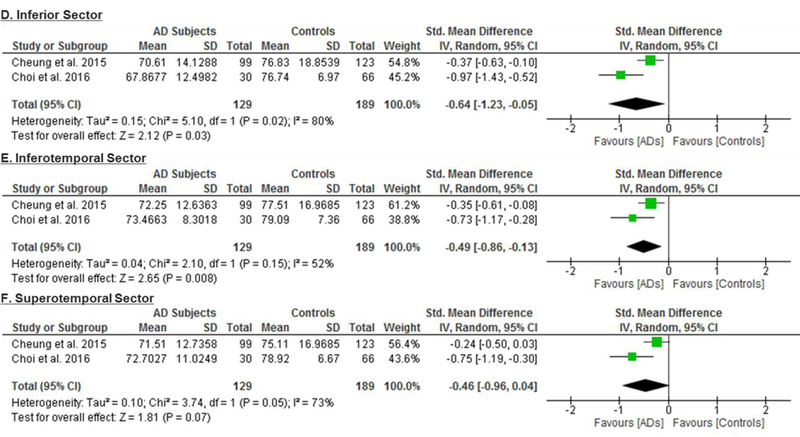
The meta-analyses were conducted with a random-effects model and unadjusted results were reported. The size of the squares denotes the weight attributed to each article, and the horizontal lines represent the 95% confidence intervals (CI). The diamonds represent the summary mean differences with the width showing the 95% CI. Abbreviation: AD = Alzheimer’s Disease; GC-IPL= ganglion cell-inner plexiform layer.
Of these 6 studies, 4 also measured the macular GC-IPL thickness in subjects with either MCI or CIND.56,58,60,70 Our analysis showed that GC-IPL was generally thinner in subjects with either MCI or CIND, although the WMD only attained a borderline statistical significance (SMD: p = 0.17, WMD: p=0.05) (Figure 4; available at www.aaojournal.org) (Table 4). However, in a subgroup analysis including studies with single-eye dataset, the difference of GC-IPL thickness in subjects with either MCI or CIND became statistically significant (SMD, −0.95; 95%CI, −1.79 to −0.10; p=0.03) (Figure 5; available at www.aaojournal.org) (Table 5; available at www.aaojournal.org). We did not include the study by Choi et al. in this analysis because their study did not report the GC-IPL thickness of the MCI subjects.64
Figure 4: Difference in the novel SD-OCT measurements between subjects with mild cognitive impairment (MCI) or cognitive impairment with no dementia (CIND) and controls.
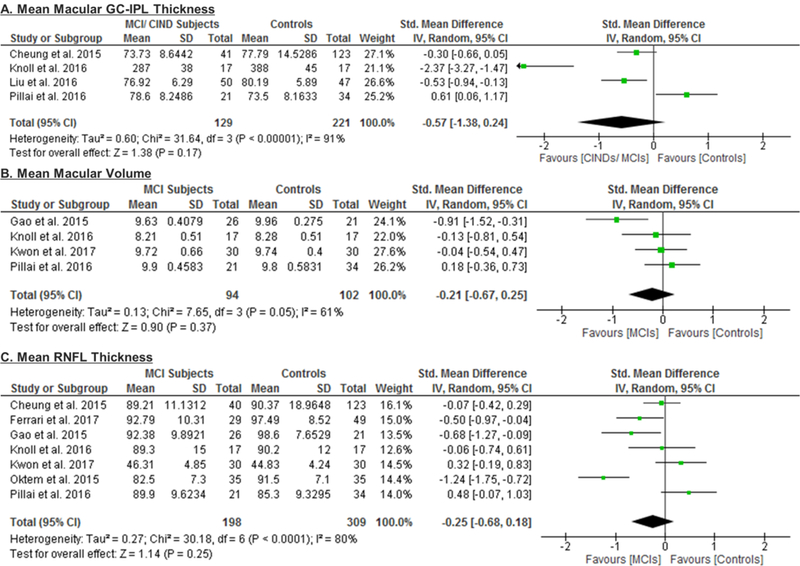
The meta-analyses were conducted with a random-effects model and unadjusted results were reported. The size of the squares denotes the weight attributed to each article, and the horizontal lines represent the 95% confidence intervals (CI). The diamonds represent the standardized mean differences with the width showing the 95% CI. Abbreviations: MCI = Mild cognitive impairment; CIND = cognitive impairment with no dementia.
Table 4: Differences of SD-OCT measurements between MCIs/ CINDs and controls.
We used means and standard deviations to assess the standard mean difference (SMD) and the weighted mean difference (WMD), with respective 95% confidence intervals (CIs). Heterogeneity of the included studies was assessed using standardized mean differences. Random-effects models were used in all analyses. p-values marked in bold indicate significance on the 95% confidence limit.
| Variable | Overall Effect | Heterogeneity | Egger’s | ||||
|---|---|---|---|---|---|---|---|
| SMD (95% CI) | p value | WMD (95% CI) | p value | I2 % | Q (P) | ||
| Macular GC-IPL | |||||||
| Mean | −0.57 [−1.38, 0.24] | 0.17 | −10.19 [−20.42, 0.05] | 0.05 | 91% | <0.00001 | 0.549 |
| Macular Volume | −0.21 [−0.67, 0.25] | 0.37 | −0.10 [−0.31, 0.11] | 0.36 | 61% | 0.05 | 0.571 |
| Peripapillary RNFL | |||||||
| Mean | −0.25 [−0.68, 0.18] | 0.25 | −2.39 [−6.34, 1.57] | 0.24 | 80% | <0.0001 | 0.867 |
| Superior | −0.10 [−0.34, 0.15] | 0.44 | −1.98 [−6.43, 2.47] | 0.38 | 15% | 0.32 | - |
| Nasal | 0.32 [−0.24, 0.88] | 0.26 | 2.64 [1.80, 3.49] | <0.00001 | 85% | <0.0001 | - |
| Inferior | 0.12 [−0.17, 0.41] | 0.42 | 2.13 [−3.04, 7.30] | 0.42 | 37% | 0.18 | - |
| Temporal | 0.24 [−0.66, 1.14] | 0.60 | −0.51 [−5.52, 4.50] | 0.84 | 94% | <0.00001 | - |
Abbreviations:
MCI = Mild Cognitive Impairment; CIND = Cognitive impairment with no dementia; C = Control; SMD = Standardized mean difference; WMD = Weighted mean difference; GC-IPL = Ganglion cell-inner plexiform layer thickness; RNFL = Retinal nerve fibre layer thickness
Figure 5: Subgroup analyses comparing Studies with Single-Eye Dataset and Studies with Paired- Eyes Dataset.
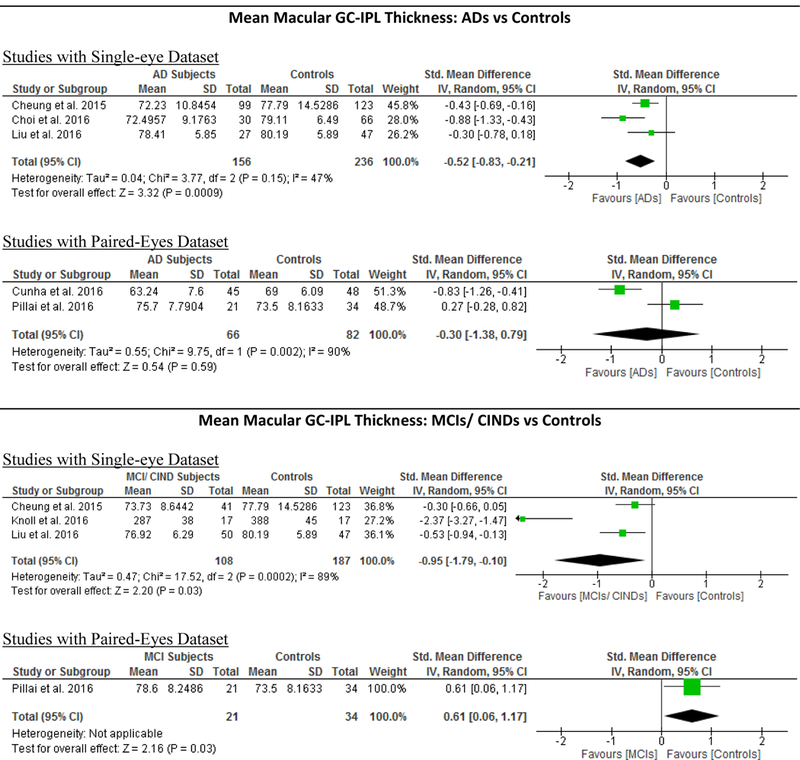
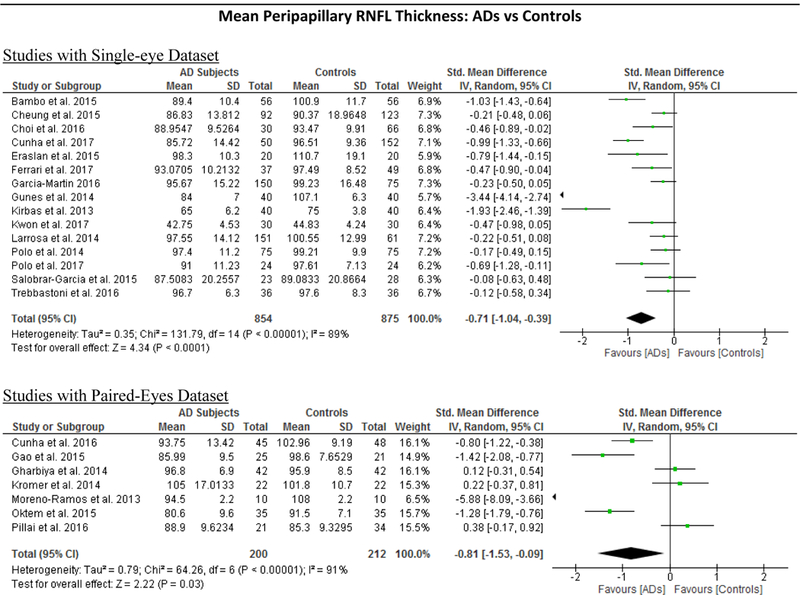
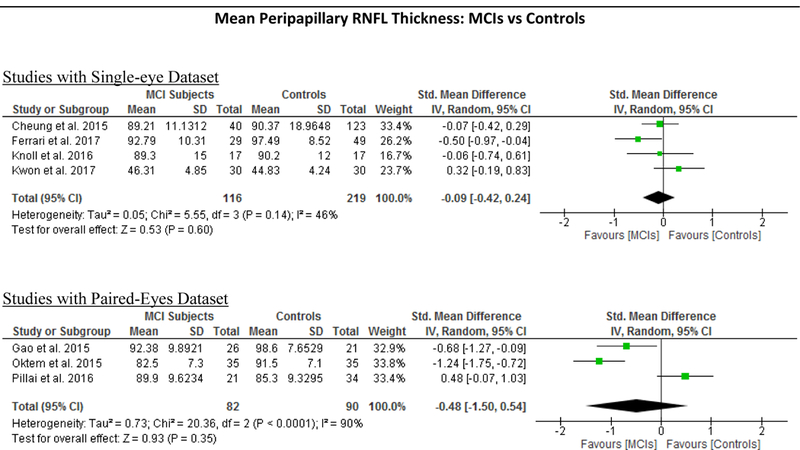
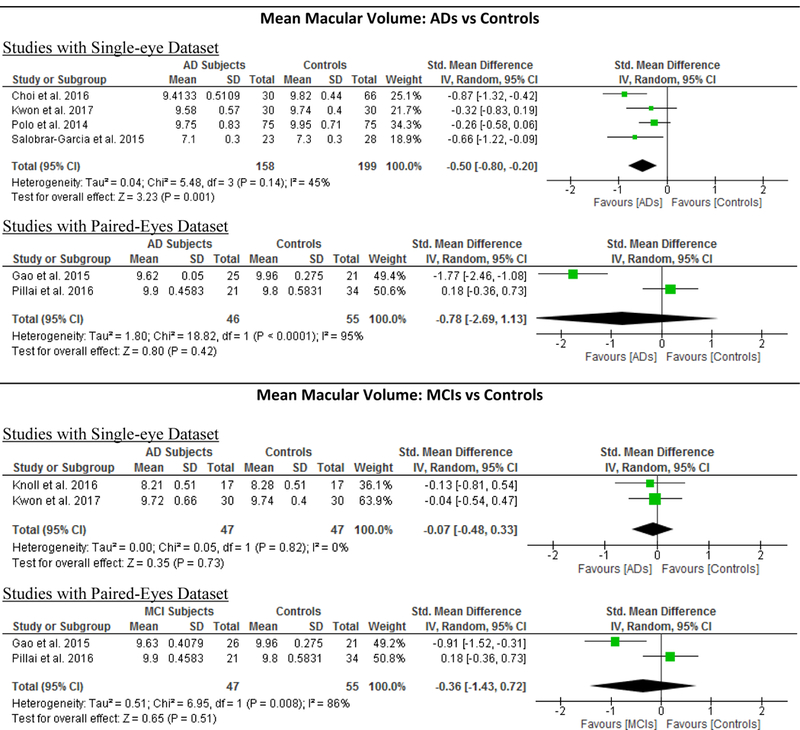
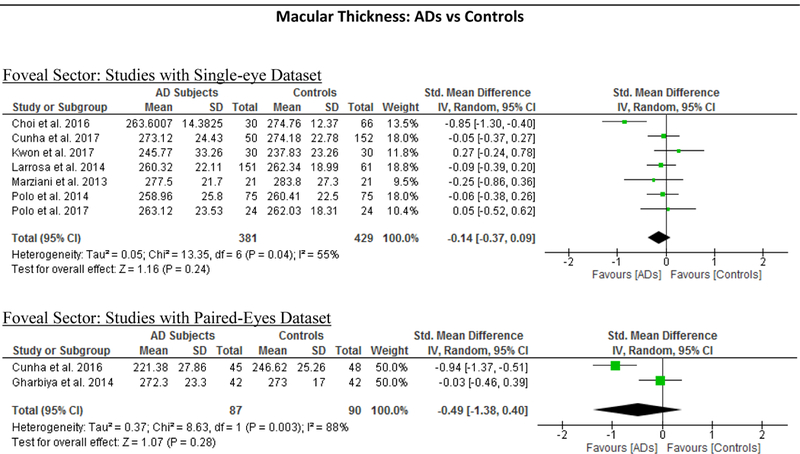
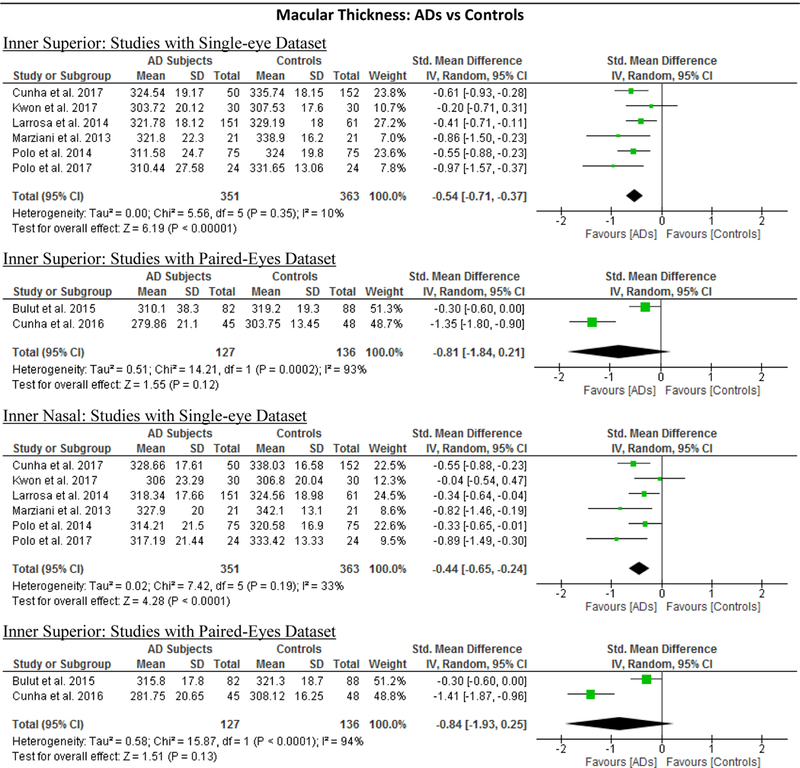
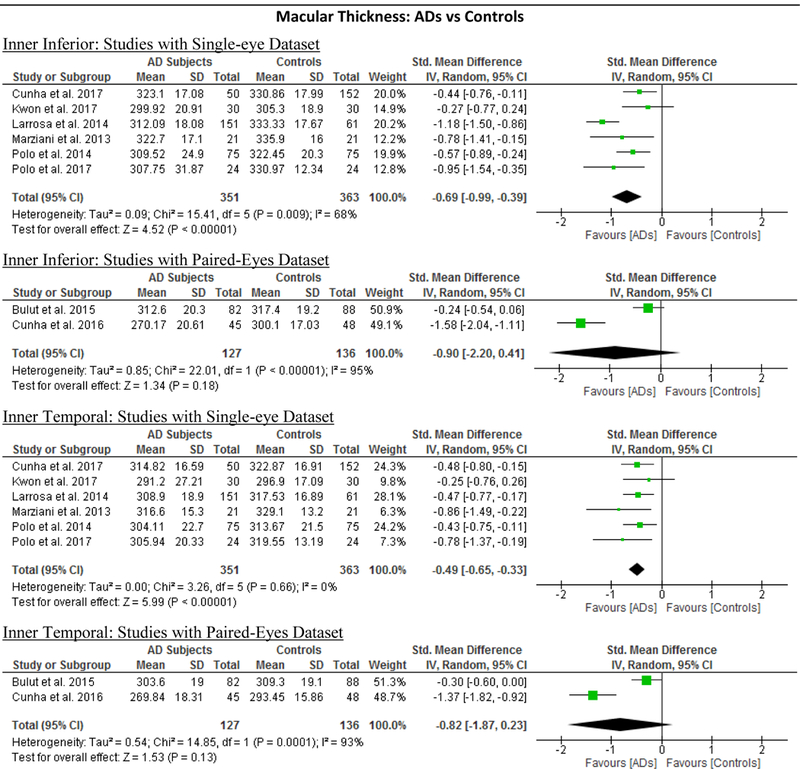
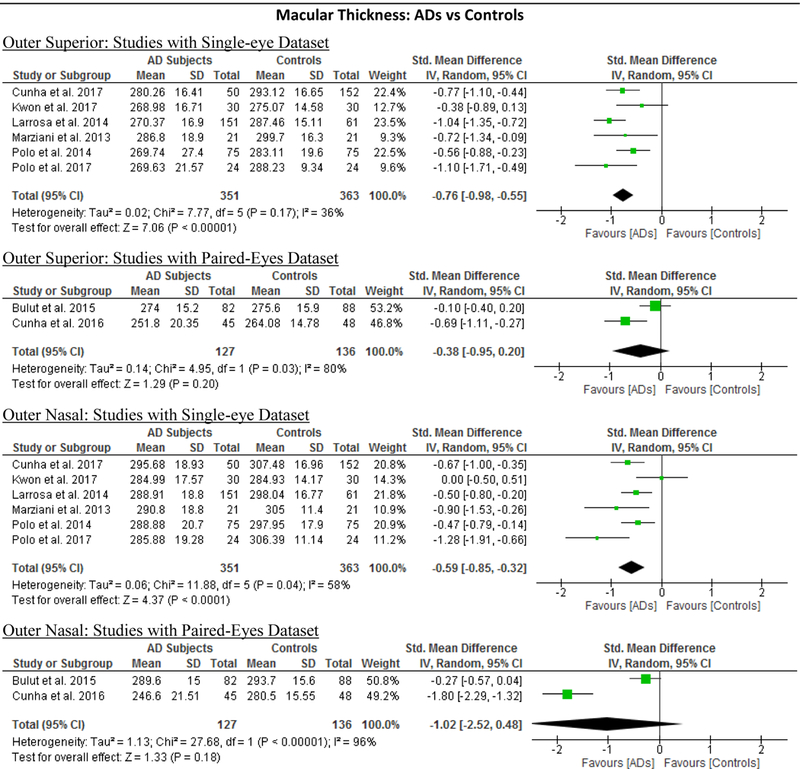
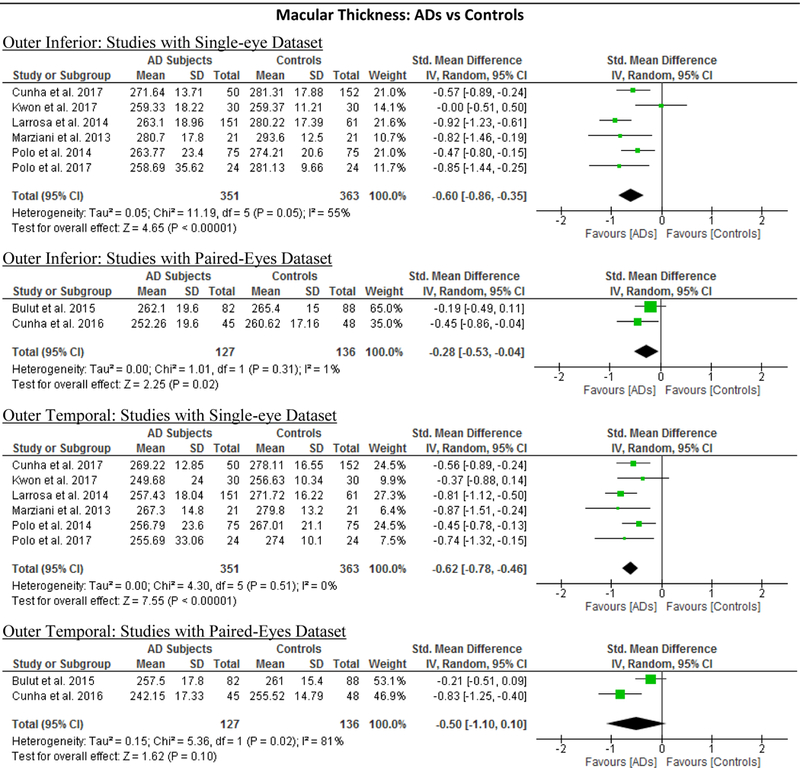
Studies with single-eye dataset selected SD-OCT measurements of either eye of each study subject, while studies with paired-eyes dataset selected SD-OCT measurements of both eyes of each study subject. The size of the squares denotes the weight attributed to each article, and the horizontal lines represent the 95% confidence intervals. The diamonds represent the standardized mean differences with the width showing the 95% CI. The meta-analyses were conducted with a random-effects model and unadjusted results were reported. Abbreviation: AD = Alzheimer’s Disease; MCI = Mild Cognitive Impairment; CIND = Cognitive impairment with no dementia; HC = Healthy controls; GC-IPL = Ganglion cell-inner plexiform layer; RNFL = Retinal nerve fibre layer.
Table 5:
Results of Meta-Regression Analysis: We performed random-effects meta-regression to assess the impact of study characteristics and potential confounders on the effect sizes of SD-OCT measurements, using SMD as the outcome variable. We assessed 8 studies comparing macular thickness between AD and controls, 23 studies comparing RNFL thickness between AD and controls and 7 studies comparing RNFL thickness between MCI and controls. The number of studies of other SD-OCT measurements were not sufficient for performing a meta-regression. p-values marked in bold indicate significance on the 95% confidence limit.
| Method (Single vs Paired Eyes) | Mean MMSE Score Differences | Age Differences | OCT Models | Exclusion of AMD | Exclusion of Severe Hypertension | Exclusion of Severe Diabetes | ||||||||
|---|---|---|---|---|---|---|---|---|---|---|---|---|---|---|
| β coefficient | p value | β coefficient | p value | β coefficient | p value | β coefficient | p value | β coefficient | p value | β coefficient | p value | β coefficient | p value | |
|
Macular Thickness (AD vs Controls) |
||||||||||||||
| Inner Superior | 0.1998 | 0.551 | 0.1559 | 0.454 | −0.0362 | 0.807 | 0.3889 | 0.016 | 0.021 | 0.891 | 0.0999 | 0.551 | 0.00595 | 0.969 |
| Inner Nasal | −0.338 | 0.371 | 0.1627 | 0.498 | −0.8523 | 0.615 | −0.457 | 0.009 | −0.06342 | 0.72 | 0.169 | 0.371 | 0.0652 | 0.704 |
| Inner Inferior | −0.171 | 0.693 | 0.2288 | 0.318 | 0.0959 | 0.609 | −0.339 | 0.183 | −0.126 | 0.51 | 0.08599 | 0.693 | 0.102 | 0.588 |
| Inner Temporal | −0.257 | 0.425 | 0.165 | 0.418 | −0.0596 | 0.676 | −0.383 | 0.016 | 0.0461 | 0.758 | 0.128 | 0.425 | 0.0326 | 0.825 |
| Outer Superior | 0.408 | 0.138 | 0.0882 | 0.451 | 0.1565 | 0.218 | −0.064 | 0.741 | −0.178 | 0.185 | −0.204 | 0.138 | −0.011 | 0.935 |
| Outer Nasal | −0.376 | 0.467 | 0.237 | 0.444 | −0.044 | 0.848 | −0.577 | 0.029 | −0.00095 | 0.997 | 0.188 | 0.465 | 0.0723 | 0.753 |
| Outer Inferior | 0.304 | 0.246 | −0.023 | 0.866 | 0.16 | 0.142 | −0.03 | 0.867 | −0.174 | 0.134 | −0.152 | 0.246 | 0.0135 | 0.916 |
| Outer Temporal | 0.158 | 0.475 | 0.07577 | 0.572 | 0.0599 | 0.541 | −0.16 | 0.27 | −0.067 | 0.517 | −0.079 | 0.475 | 0.00831 | 0.938 |
|
RNFL Thickness (AD vs Controls) |
||||||||||||||
| Mean | −0.155 | 0.628 | 0.27 | 0.148 | 0.0904 | 0.252 | −0.228 | 0.337 | 0.133 | 0.602 | −0.244 | 0.239 | 0.137 | 0.546 |
|
RNFL Thickness (MCI vs Controls) |
||||||||||||||
| Mean | −0.118 | 0.732 | 0.0331 | 0.921 | −0.098 | 0.481 | −0.038 | 0.93 | 0.0326 | 0.923 | 0.36 | 0.585 | 0.259 | 0.294 |
Abbreviations: AD = Alzheimer’s Disease; MCI = Mild cognitive impairment; OCT = Optical coherence tomography; MMSE = Mini–Mental State Examination
Macular ganglion cell complex (GCC) thickness
The macular GCC thickness was examined in 4 studies recruiting 96 AD patients (117 eyes) and 95 healthy controls (119 eyes).55,59,66,67 Macular GCC was significantly thinner in AD patients when compared to controls (SMD, −0.84; 95% CI, −1.10 to −0.57; p<0.001), which corresponded to an absolute decrease of 7.04 (95%CI, −9.20 to −4.88; p<0.001) (Figure 2; available at www.aaojournal.org) (Table 3). However, no studies examined the GCC thickness in subjects with either MCI or CIND.
Macular Volume
7 studies examined the macular volume in 204 AD patients (204 eyes), 94 MCI (94 eyes) and 271 controls (271 eyes).60‘61‘63‘64‘68‘70‘71 When compared to controls, AD subjects had a significantly smaller macular volume (SMD, −0.58; 95%CI, −1.03 to −0.14; p=0.01) (Figure 2; available at www.aaojournal.org) (Table 3). However, the macular volume was not statistically different between MCI subjects and controls (Table 4).
Choroidal Thickness
5 studies consisting of 203 AD patients (244 eyes) and 307 controls (351 eyes) assessed the choroidal thickness.55‘69‘90‘101‘102 When compared to controls, choroidal thickness was significantly thinner in AD, in terms of the sub-foveal region (SMD, −1.03; 95% CI, −1.31 to −0.74; p<0.001), the region 1.5mm nasal to fovea (SMD, −0.89; 95% CI, −1.18 to −0.61; p<0.001), the region 1.5mm inferior to fovea (SMD, −0.88; 95% CI, −1.14 to −0.63; p<0.001) and the region 1.5mm superior to fovea (SMD, −0.92; 95% CI, −1.14 to −0.71; p<0.001) (Figure 6; available at www.aaojournal.org) (Table 3).
Figure 6: Difference in the choroidal thicknesses between subjects with Alzheimer’s Disease (AD) and controls.
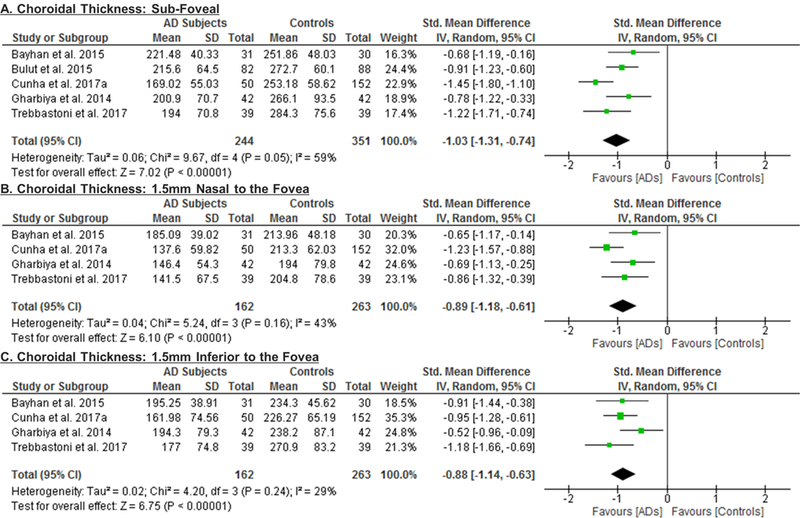
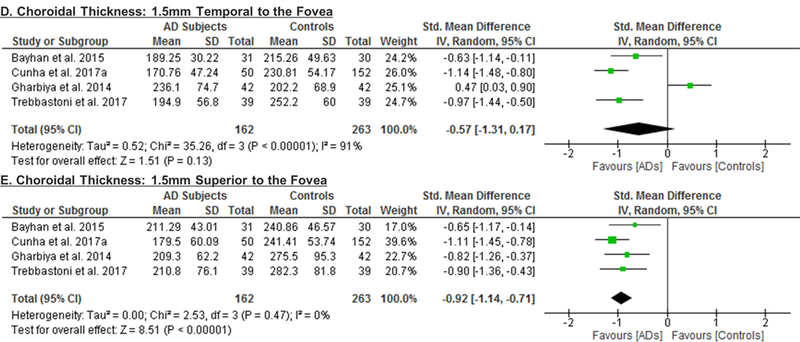
The meta-analyses were conducted with a random-effects model and unadjusted results were reported. The size of the squares denotes the weight attributed to each article, and the horizontal lines represent the 95% confidence intervals (CI). The diamonds represent the standardized mean differences with the width showing the 95% CI. Abbreviation: AD = Alzheimer’s Disease.
Macular Thickness
10 studies studied the macular thickness in 467 AD patients (550 eyes) and 518 controls (607 eyes). 57‘59‘61‘62‘64–66‘69‘71‘90 AD patients showed significant thinning of the macular thickness in all inner and outer sectors of the macula (SMD ranged −0.52 to −0.74 and WMD ranged −9.71 μm to 14.56 μm, all p<0.001) (Figure 7; available at www.aaojournal.org) (Table 3). The inner inferior sector exhibited the greatest magnitude of thinning (WMD, −14.56 μm; 95% CI, −21.03 to −8.09; p<0.001). We did not compare the macular thickness between MCI patients and controls because only two studies were eligible.71,90
Figure 7: Difference in the macular thickness between subjects with Alzheimer’s Disease (AD) and controls.
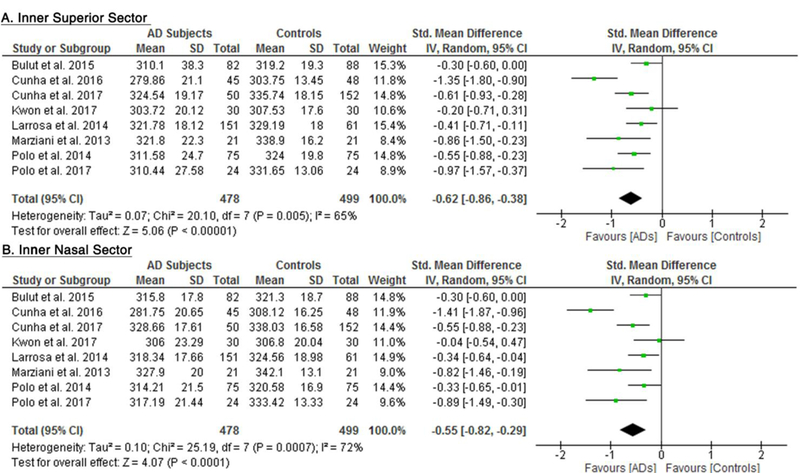
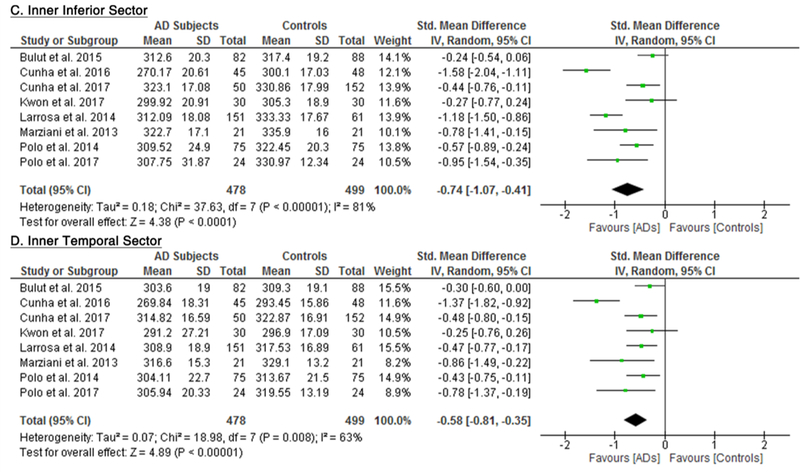
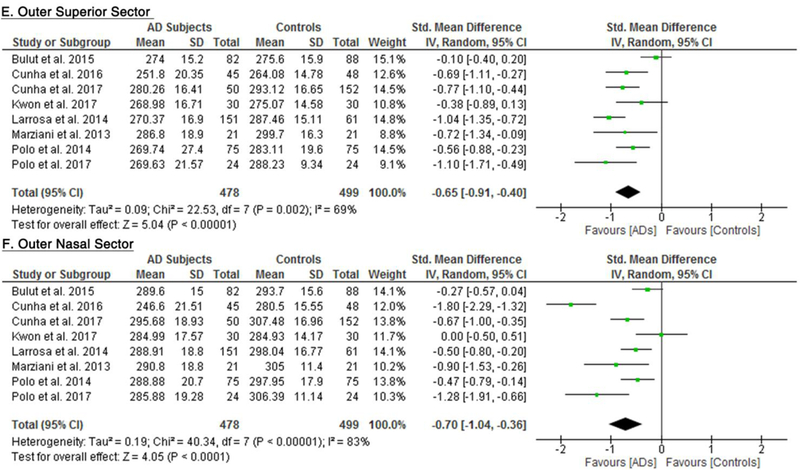
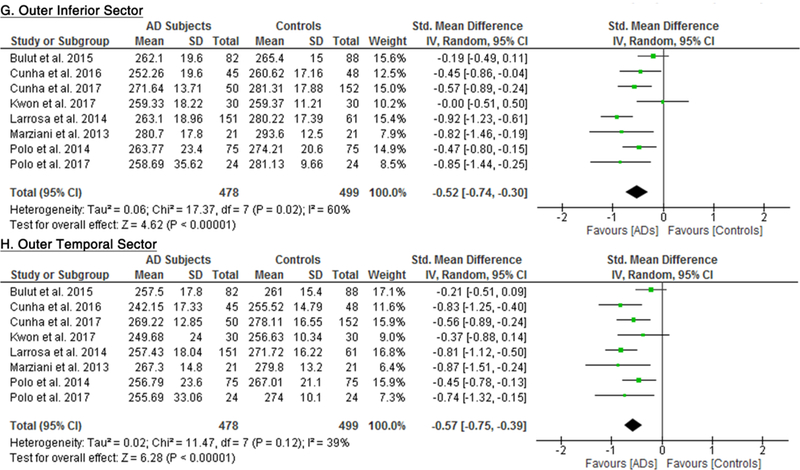
The meta-analyses were conducted with a random-effects model and unadjusted results were reported. The size of the squares denotes the weight attributed to each article, and the horizontal lines represent the 95% confidence intervals (CI). The diamonds represent the standardized mean differences with the width showing the 95% CI. Abbreviation: AD = Alzheimer’s Disease.
RNFL Thickness
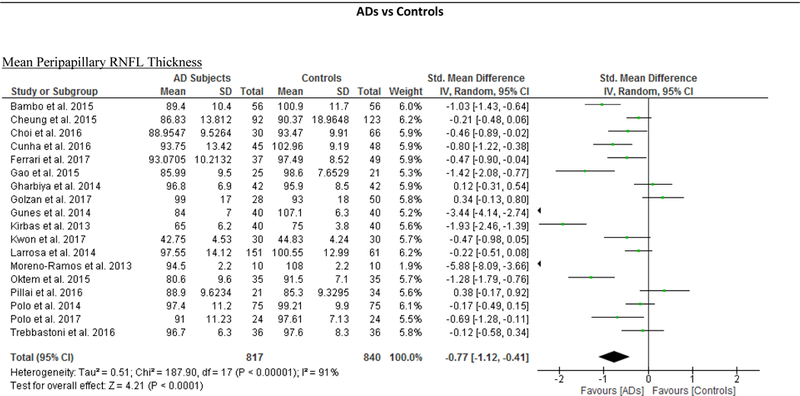
We identified a total of 24 studies which measured the RNFL thickness using SD-OCT in 1061 AD patients (1082 eyes), 198 MCI patients (198 eyes) and 1130 controls (1154 eyes).56,57,60–69,71,78,91–100 There was a significant reduction in the mean RNFL thickness in AD patients compared with controls (SMD, −0.67; 95% CI, −0.95 to −0.38; p<0.001), which corresponded to an absolute decrease of 5.99 (95% CI, −8.89 to −3.09; p<0.001) (Figure 8; available at www.aaojournal.org) (Table 3). Subsequent analyses revealed that all quadrants were significantly thinner in AD patients, of which the superior quadrant demonstrated the most significant reduction (SMD, −0.97; 95% CI, −1.39 to −0.55; p<0.001; WMD, −15.μm; 95% CI, −25.15 to −5.51 μm; p=0.002) (Figure 9; available at www.aaojournal.org) (Table 3). The study by Marziani et al.59 measured the RNFL thickness at the macula and was excluded from this analysis.
Figure 8: Difference in the mean peripapillary RNFL thickness between subjects with Alzheimer’s Disease (AD) and controls.
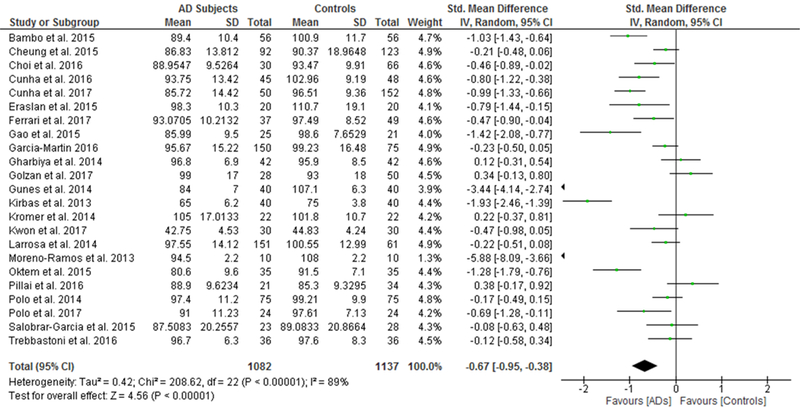
The meta-analyses were conducted with a random-effects model and unadjusted results were reported. The size of the squares denotes the weight attributed to each article, and the horizontal lines represent the 95% confidence intervals (CI). The diamonds represent the standardized mean differences with the width showing the 95% CI. Abbreviation: AD = Alzheimer’s Disease; RNFL = Retinal nerve fibre layer.
Figure 9: Difference in the sectorial peripapillary RNFL thicknesses between subjects with AD and controls.
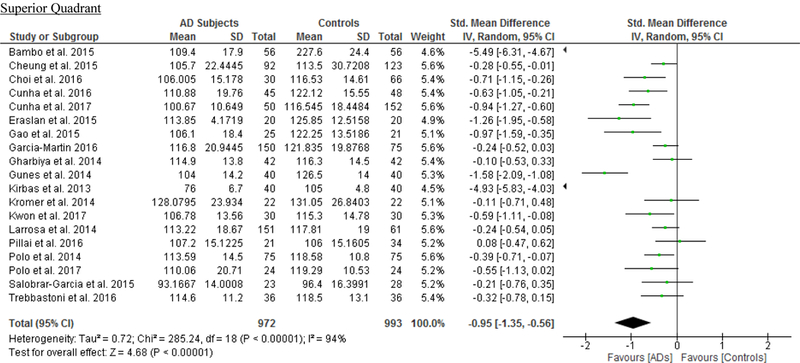
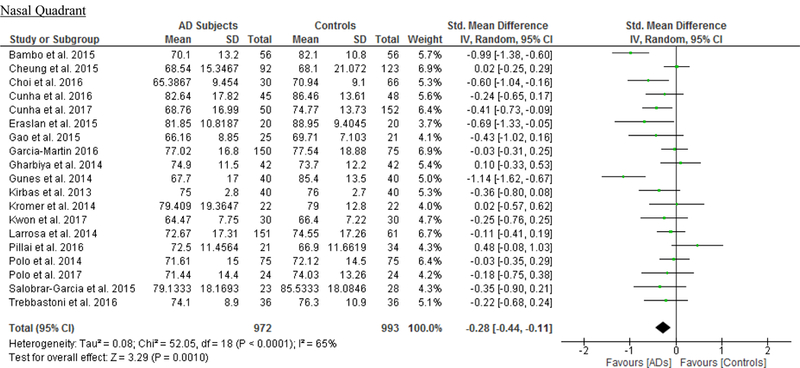
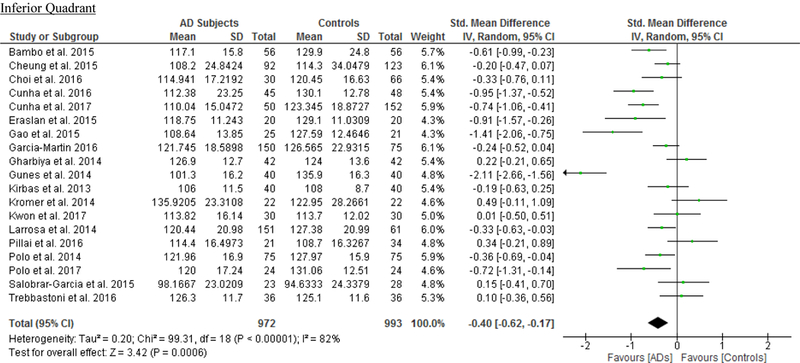
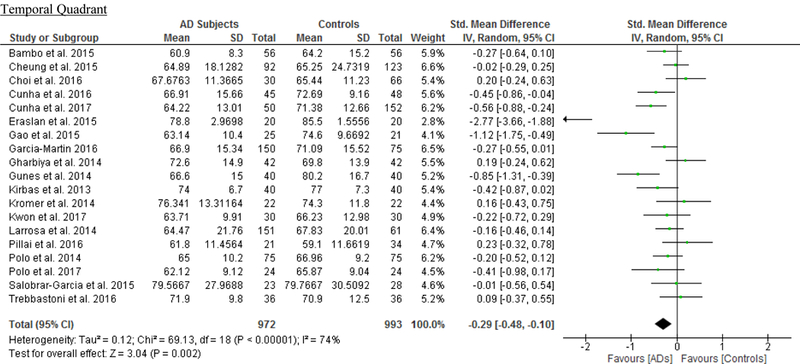
The meta-analyses were conducted with a random-effects model and unadjusted results were reported. The size of the squares denotes the weight attributed to each article, and the horizontal lines represent the 95% confidence intervals (CI). The diamonds represent the standardized mean differences with the width showing the 95% CI. Abbreviations: AD = Alzheimer’s Disease; RNFL = Retinal nerve fibre layer.
In addition, we also analyzed 6 studies which examined the difference of the RNFL thickness between MCI patients and controls. The results revealed a trend of RNFL thinning in MCI patients, yet the magnitude was not statistically significant (Figure 4; available at www.aaojournal.org) (Table 4).
Meta-Regression
We performed meta-regression on 8 studies comparing macular thickness between AD and controls, 23 studies comparing RNFL thickness between AD and controls and 7 studies comparing RNFL thickness between MCI and controls (Table 5; available at www.aaojournal.org). The number of studies regarding other SD-OCT measurements was not sufficient for meta-regression. Our results showed that there were significant associations between the type of OCT model and the effect sizes of the macular thickness differences between AD and controls, which can explain 70% to 100% of variance of the outcome: the inner superior sector (β, 0.3889; p = 0.016; r2, 99.32%), the inner nasal sector (β, −0.457; p = 0.009; r2, 100%), the inner temporal sector (β, −0.383; p = 0.016; r2, 91.62%), and the outer nasal sector (β, −0.577, p = 0.029; r2, 70.61%). However, mean MMSE score, mean age difference between study groups, method of eye selection (i.e. single-eye vs paired-eyes dataset), proportion of males in each study group, and exclusion status of age-related macular degeneration, severe hypertension and severe diabetes mellitus had no significant impact (p > 0.05) on the effect sizes of the differences of macular thickness and RNFL thickness in AD, and the difference of RNFL thickness in MCI.
Subgroup Analysis
We performed a subgroup analysis to compare the effect sizes between studies with a single-eye dataset (i.e. selected measurements of either eye of each subject for the analysis) and studies with a paired-eyes dataset (i.e. selected measurements of both eyes of each subject for the analysis) (Figure 10; available at www.aaojournal.org) (Table 6; available at www.aaojoumal.org). We observed that the differences of macular GC-IPL thickness, macular thickness of most sectors and macular volume in AD, and the difference of macular GC-IPL thickness in MCI were only statistically significant (p<0.05) among studies with a single-eye dataset, but not studies with a paired-eyes dataset.
Figure 10: Subgroup Analyses according to the method of eye selection.
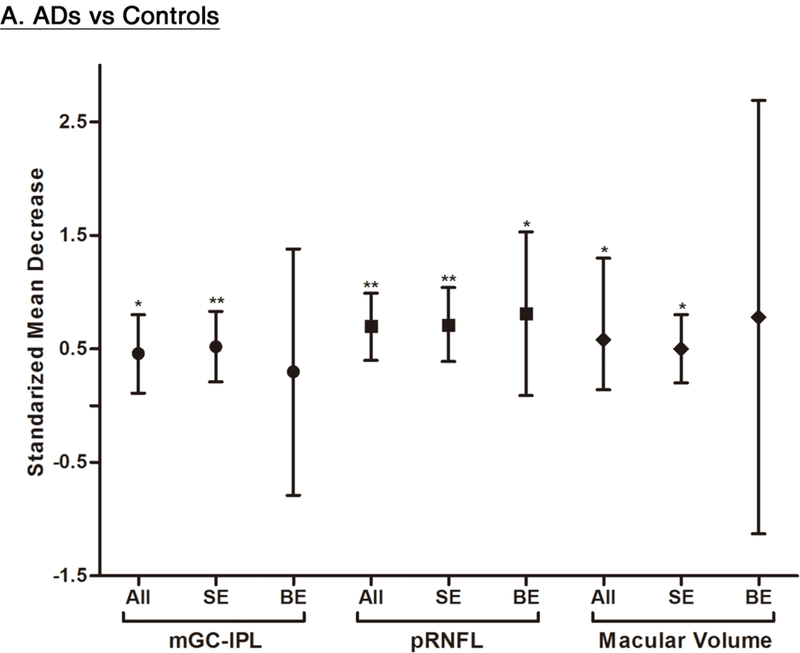
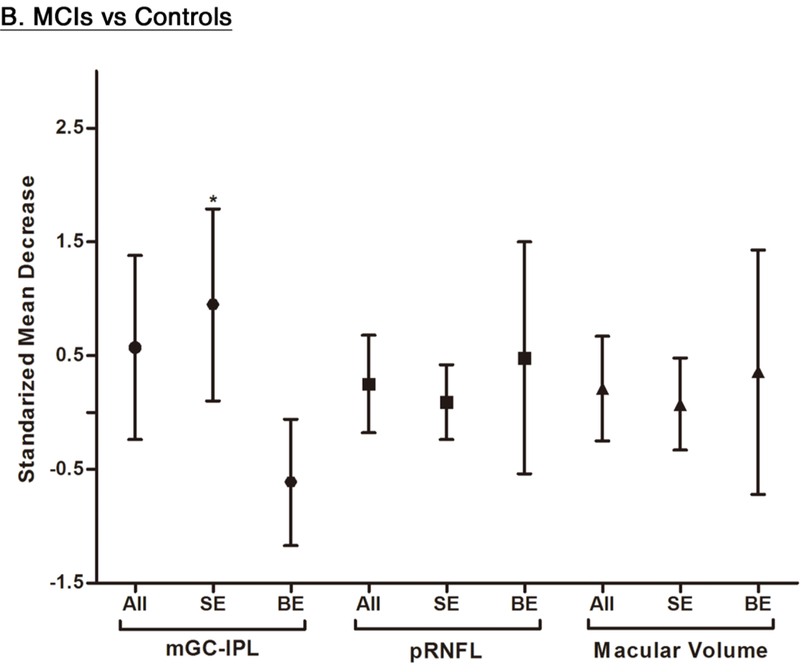
This figure illustrated the results of the subgroup analyses that included studies with single-eye dataset and studies with paired-eyes dataset, respectively. The bars represent the 95% confidence intervals of the standardized mean decreases. Significant group differences with p < 0.05 and p < 0.001 are labelled as “*” and “**” respectively. Abbreviations: SE = Single-eyes dataset; BE = Both-eyes/ paired-eyes dataset; ** = p<0.05; * = p<0.001
Table 6: Sub-Group Analyses based on the Method of Eye Selection.
Studies with single-eye dataset selected SD-OCT measurements from either eye of each study subject, while studies with paired-eyes dataset selected SD-OCT measurements from both eyes of each study subject.
| All Eligible Studies | Studies with Single-Eye Dataset | Studies with Paired-Eyes Dataset | ||||
|---|---|---|---|---|---|---|
| SMD [95% CI] | WMD [95% CI] | SMD [95% CI] | WMD [95% CI] | SMD [95% CI] | WMD [95% CI] | |
| Mean GC-IPL | ||||||
| AD vs Controls | −0.46 [−0.80, −0.11] * | −3.66 [−6.49, −0.83] * | −0.52 [−0.83, −0.21] ** | −4.48 [−7.50, −1.45] * | −0.30 [−1.38, 0.79] | −1.96 [−9.75, 5.84] |
| MCI vs Controls | −0.57 [−1.38, 0.24] | −10.19 [−20.42, 0.05] | −0.95 [−1.79, −0.10] * | −18.49 [−32.05, −4.92] * | 0.61 [0.06, 1.17] | 5.10 [0.63, 9.57] |
| Mean RNFL | ||||||
| AD vs Controls | −0.70 [−0.99, −0.40] ** | −6.24 [−9.21, −3.26] ** | −0.71 [−1.04, −0.39] ** | −6.70 [−10.26, −3.14] ** | −0.81 [−1.53, −0.09] * | −5.81 [−11.55, −0.07] * |
| MCI vs Controls | −0.25 [−0.68, 0.18] | −2.39 [−6.34, 1.57] | −0.09 [−0.42, 0.24] | −0.97 [−4.17, 2.22] | −0.48 [−1.50, 0.54] | −3.70 [−11.63, 4.23] |
| Macular Volume | ||||||
| AD vs Controls | −0.58 [−1.03, −0.14] * | −0.23 [−0.35, −0.10] ** | −0.50 [−0.80, −0.20] * | −0.24 [−0.35, −0.14] ** | −0.78 [−2.69, 1.13] | −0.14 [−0.57, 0.29] |
| MCI vs Controls | −0.21 [−0.67, 0.25] | −0.10 [−0.31, 0.11] | −0.07 [−0.48, 0.33] | −0.04 [−0.25, 0.18] | −0.36 [−1.43, 0.72] | −0.13 [−0.55, 0.29] |
|
Macular Thickness (AD vs Controls) |
||||||
| Foveal | −0.18 [−0.36, 0.00] | −4.38 [−8.95, 0.18] | −0.14 [−0.37, 0.09] | −3.01 [−7.31, 1.29] | −0.49 [−1.38, 0.40] | −12.75 [−36.80, 11.29] |
| Inner Superior | −0.62 [−0.86, −0.38] ** | −12.85 [−17.55, −8.14] ** | −0.54 [−0.71, −0.37] ** | −10.92 [−14.92, −6.92] ** | −0.81 [−1.84, 0.21] | −16.78 [−31.26, −2.30] * |
| Inner Nasal | −0.55 [−0.82, −0.29] ** | −10.45 [−15.55, −5.36] ** | −0.44 [−0.65, −0.24] ** | −8.35 [−11.77, −4.92] ** | −0.84 [−1.93, 0.25] | −15.76 [−36.21, 4.69] |
| Inner Inferior | −0.74 [−1.07, −0.41] ** | −14.56 [−21.03, −8.09] ** | −0.69 [−0.99, −0.39] ** | −13.65 [−19.53, −7.78] ** | −0.90 [−2.20, 0.41] | −17.24 [−41.87, 7.39] |
| Inner Temporal | −0.58 [−0.81, −0.35] ** | −10.84 [−14.93, −6.74] ** | −0.49 [−0.65, −0.33] ** | −9.28 [−12.12, −6.44] ** | −0.82 [−1.87, 0.23] | −14.54 [−32.09, 3.01] |
| Outer Superior | −0.65 [−0.91, −0.40] ** | −11.59 [−16.23, −6.96] ** | −0.76 [−0.98, −0.55] ** | −13.82 [−17.10, −10.53] ** | −0.38 [−0.95, 0.20] | −6.56 [−17.00, 3.88] |
| Outer Nasal | −0.70 [−1.04, −0.36] ** | −12.59 [−19.15, −6.02] ** | −0.59 [−0.85, −0.32] ** | −10.45 [−14.99, −5.91] ** | −1.02 [−2.52, 0.48] | −18.84 [−48.04, 10.37] |
| Outer Inferior | −0.52 [−0.74, −0.30] ** | −9.71 [−14.11, −5.30] ** | −0.60 [−0.86, −0.35] ** | −11.28 [−16.53, −6.03] ** | −0.28 [−0.53, −0.04] * | −5.10 [−9.84, −0.35] * |
| Outer Temporal | −0.57 [−0.75, −0.39] ** | −10.24 [−13.40, −7.08] ** | −0.62 [−0.78, −0.46] ** | −11.16 [−13.82, −8.50] ** | −0.50 [−1.10, 0.10] | −8.20 [−17.86, 1.46] |
Abbreviations: SMD = Standardized mean difference; WMD = Weighted mean difference; GC-IPL = Ganglion cell-inner plexiform layer; RNFL = Retinal nerve fibre layer;
= p<0.05;
= p<0.001
We also performed a subgroup analysis which excluded studies requiring manual calculation (except calculation of standard deviations from standard errors) (Figure 11; available at www.aaojournal.org). 6 studies 59,63,65,67,93,96 which required manual calculations to combine sub-sectors of RNFL thickness or GCC thickness were excluded in this subgroup analysis. After the exclusion, the associations of AD with RNFL and GCC thinning remained statistically significant.
Figure 11: Sub-group analyses excluding studies requiring manual calculation.
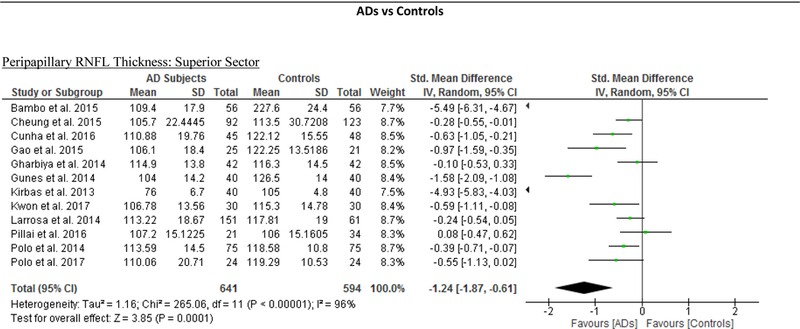
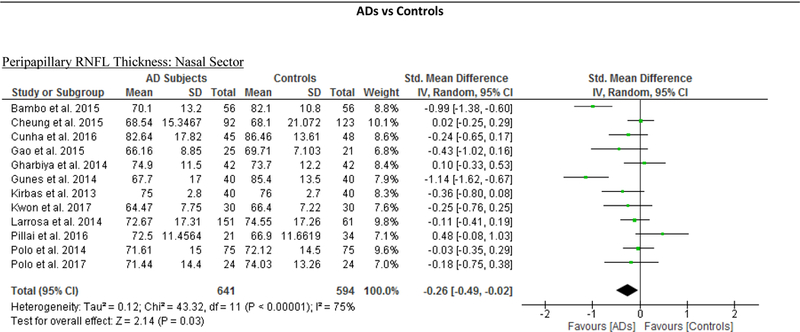
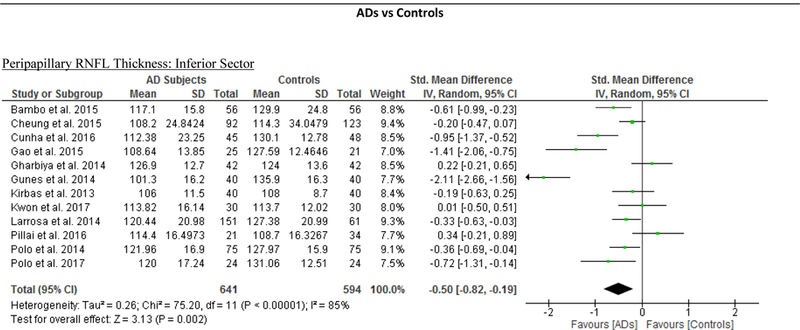
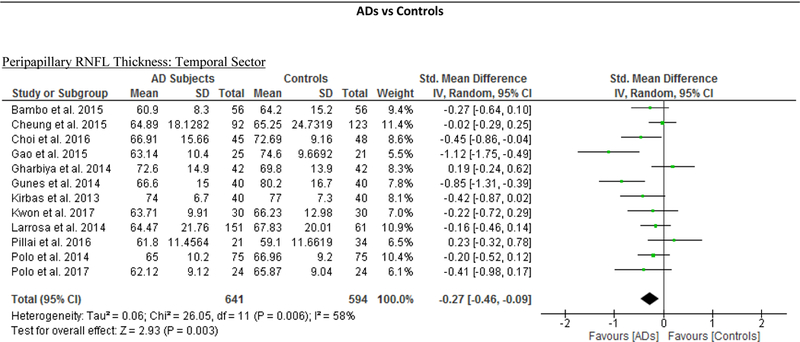

The meta-analyses were conducted with a random-effects model and unadjusted results were reported. The size of the squares denotes the weight attributed to each article, and the horizontal lines represent the 95% confidence intervals (CI). The diamonds represent the standardized mean differences with the width showing the 95% confidence intervals. Abbreviations: AD = Alzheimer’s Disease; RNFL = Retinal nerve fibre layer; GCC = Ganglion cell complex ADs vs Controls Mean Peripapillary
Since the results of meta-regression suggested that the types of OCT model had significant impacts on the effect sizes of the macular thickness difference between AD and controls, we further performed subgroup analyses according to the types of OCT model, namely Cirrus HD-OCT, Heidelberg Spectralis and Topcon 3D OCT. The reduction of macular thickness in AD remained statistically significant when compared to controls. (Figure 12; available at www.aaojournal.org)
Figure 12: Sub-group analysis of OCT models.
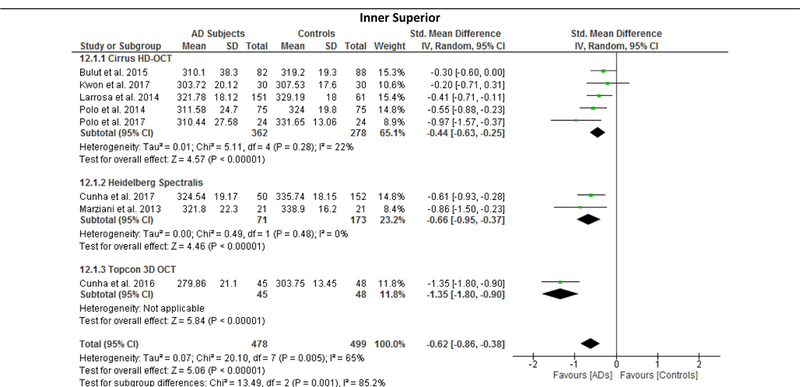
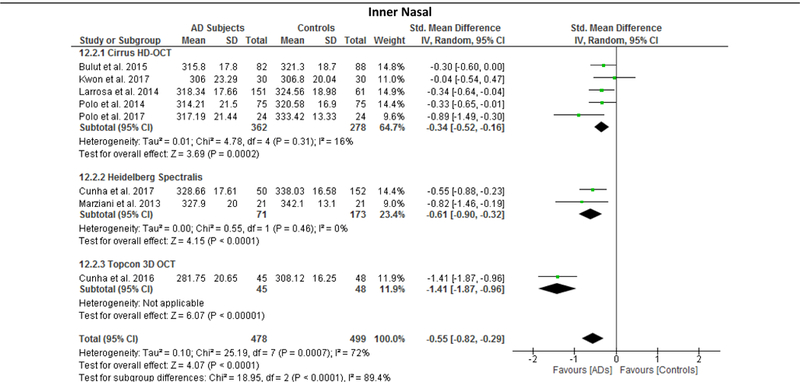
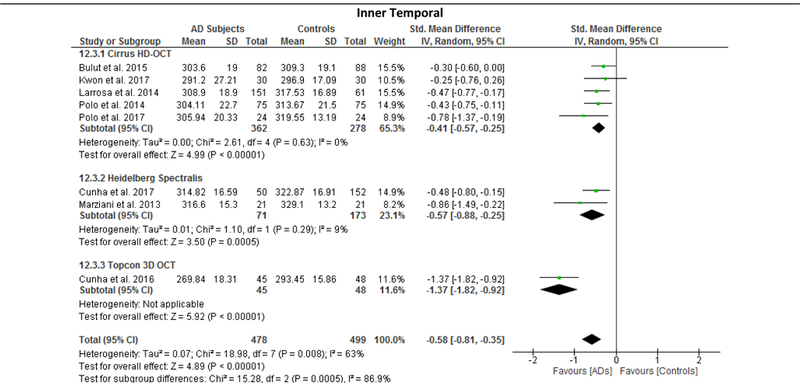
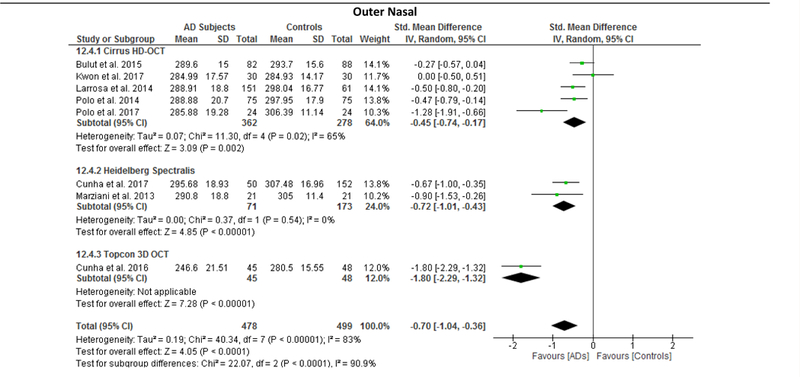
The size of the square denotes the weight attributed to each article, and the horizontal lines represent the 95% confidence intervals (CI). The diamonds represent the standardized mean differences with the width showing the 95% CI. Data were analyzed by a random-effects model and unadjusted results were reported. Abbreviations: AD = Alzheimer’s Disease; OCT = Optical coherence tomography
Publication Bias
The Egger’s tests showed that there was no publication bias in most of the analyses, except the analyses of the mean peripapillary RNFL and the choroidal thickness 1.5mm superior to the fovea.
Study Quality
We assessed the risk of bias and the applicability of the results using the QUADAS-2 tool (Table 7.1; available at www.aaojournal.org). Most of the included studies were of low risk of bias in terms of patient selection, index test and reference standard, and there were low concerns about the applicability of the results. However, four studies did not specify the diagnostic criteria used for the cognitive assessment,65,78,96,102 leading to an unclear risk of bias regarding the index test in these studies. Furthermore, a number of studies also had unclear risks of bias in terms of the flow and timing because they did not specify the interval between the OCT imaging and the diagnostic test of MCI or ad,55–70,78,90– 93,95–97,99,101,102 or did not describe whether the control subjects underwent a neurological examination to rule out the presence of cognitive impairment.59–63,65,66,68,91–93,95–98,102 We also noticed that the studies by Moreno-Ramos et al. and Knoll et al. had a small sample size (n<20).70,97
Table 7.1: Methodological Quality Rating using the QUADAS-2 Tool.
We examined the study quality using the QUADAS-2 Tool, which assesses risk of bias and applicability concern of patient selection, index test, reference standard, and flow and timing.
| Study | Risk of Bias |
Applicability Concern |
|||||
|---|---|---|---|---|---|---|---|
| Patient Selection | Index Test | Reference Standard | Flow and Timing | Patient Selection | Index Test | Reference Standard | |
| Bambo et al. 2015 | ☺ | ☺ | ☺ | ? | ☺ | ☺ | ☺ |
| Bayhan et al. 2015 | ☺ | ☺ | ☺ | ? | ☺ | ☺ | ☺ |
| Bulut et al. 2016 | ☺ | ☺ | ☺ | ? | ☺ | ☺ | ☺ |
| Cheung et al. 2015 | ☺ | ☺ | ☺ | ? | ☺ | ☺ | ☺ |
| Choi et al. 2016 | ☺ | ☺ | ☺ | ? | ☺ | ☺ | ☺ |
| Cunha et al. 2016 | ☺ | ☺ | ☺ | ? | ☺ | ☺ | ☺ |
| Cunha et al. 2017 | ☺ | ☺ | ? | ? | ☺ | ? | ☺ |
| Cunha et al. 2017a | ☺ | ☺ | ? | ? | ☺ | ? | ☺ |
| Eraslen et al. 2015 | ☺ | ☺ | ☺ | ? | ☺ | ☺ | ☺ |
| Ferrari et al. 2017 | ☺ | ☺ | ☺ | ? | ☺ | ☺ | ☺ |
| Garcia-Martin et al. 2016 | ☺ | ☺ | ☺ | ? | ☺ | ☺ | ☺ |
| Gao et al. 2015 | ☺ | ☺ | ☺ | ? | ☺ | ☺ | ☺ |
| Gharbiya et al. 2014 | ☺ | ☺ | ☺ | ? | ☺ | ☺ | ☺ |
| Golzan et al. 2017 | ☺ | ☺ | ? | ? | ☺ | ? | ☺ |
| Gunes et al. 2014 | ☺ | ☺ | ☺ | ☺ | ☺ | ☺ | ☺ |
| Kirbas et al. 2013 | ☺ | ☺ | ☺ | ? | ☺ | ☺ | ☺ |
| Knoll et al. 2016 | ☺ | ☺ | ☺ | ? | ☺ | ☺ | ☺ |
| Kromer et al. 2014 | ☺ | ☺ | ? | ? | ☺ | ? | ☺ |
| Kwon et al. 2017 | ☺ | ☺ | ☺ | ☺ | ☺ | ☺ | ☺ |
| Larrosa et al. 2014 | ☺ | ☺ | ☺ | ? | ☺ | ☺ | ☺ |
| Liu et al. 2016 | ☺ | ☺ | ☺ | ? | ☺ | ☺ | ☺ |
| Marziani et al. 2013 | ☺ | ☺ | ☺ | ? | ☺ | ☺ | ☺ |
| Moreno-Ramos et al. 2013 | ☺ | ☺ | ☺ | ? | ☺ | ☺ | ☺ |
| Oktem et al. 2015 | ☺ | ☺ | ☺ | ☺ | ☺ | ☺ | ☺ |
| Pillai et al. 2016 | ☺ | ☺ | ☺ | ? | ☺ | ☺ | ☺ |
| Polo et al. 2014 | ☺ | ☺ | ☺ | ? | ☺ | ☺ | ☺ |
| Polo et al. 2017 | ☺ | ☺ | ☺ | ? | ☺ | ☺ | ☺ |
| Salobrar-Garcia et al. 2015 | ☺ | ☺ | ☺ | ? | ☺ | ☺ | ☺ |
| Trebbastoni et al. 2016 | ☺ | ☺ | ☺ | ? | ☺ | ☺ | ☺ |
| Trebbastoni et al. 2017 | ☺ | ☺ | ☺ | ? | ☺ | ☺ | ☺ |
= Low Risk;
= High Risk;
= Unclear Risk
We also assessed the quality of reporting SD-OCT measurements with reference to the Advised Protocol for OCT Study Terminology and Elements (APOSTEL) recommendations.75 Although most of the studies provided methodological details of the SD-OCT imaging, we noticed that a number of studies did not adequately describe the acquisition setting of OCT (e.g. the room light conditions and any use of pupil dilation before examination), the process of post-acquisition data selection (e.g. the quality control criteria), and the number and criteria of post-acquisition discard (Table 7.2; available at www.aaojournal.org).
Table 7.2: Assessment of Study Quality of Reporting using the APOSTEL Recommendations.
We examined the quality of reporting with reference to the Advised Protocol for OCT Study Terminology and Elements (APOSTEL) recommendations, which provide a 9-point checklist encompassing aspects deemed relevant when reporting quantitative OCT studies.
| Study | Study Protocol | Acquisition Device | Acquisition Settings | Scanning Protocol | Funduscopic Imaging | Post-Acquisition Data Selection | Post-Acquisition Analysis | Nomenclature and Abbreviations | Statistical Approach |
|---|---|---|---|---|---|---|---|---|---|
| Bambo et al. 2015 | ☺ | ☺ | ☹ | ☺ | ☹ | ☺ | ☺ | ☺ | ☺ |
| Bayhan et al. 2015 | ☹ | ☺ | ☹ | ☺ | ☹ | ☹ | ☺ | ☺ | ☺ |
| Bulut et al. 2016 | ☺ | ☺ | ☹ | ☺ | ☹ | ☹ | ☺ | ☺ | ☺ |
| Cheung et al. 2015 | ☹ | ☺ | ☹ | ☺ | ☹ | ☺ | ☺ | ☺ | ☺ |
| Choi et al. 2016 | ☹ | ☺ | ☹ | ☺ | ☹ | ☺ | ☺ | ☺ | ☺ |
| Cunha et al. 2016 | ☺ | ☺ | ☹ | ☺ | ☹ | ☺ | ☺ | ☺ | ☺ |
| Cunha et al. 2017 | ☹ | ☺ | ☹ | ☺ | ☺ | ☹ | ☺ | ☺ | ☺ |
| Cunha et al. 2017a | ☹ | ☺ | ☹ | ☺ | ☺ | ☹ | ☺ | ☺ | ☺ |
| Eraslen et al. 2015 | ☹ | ☺ | ☹ | ☺ | ☺ | ☹ | ☺ | ☺ | ☺ |
| Ferrari et al. 2017 | ☹ | ☺ | ☹ | ☺ | ☺ | ☺ | ☺ | ☺ | ☺ |
| Garcia-Martin et al. 2016 | ☹ | ☹ | ☹ | ☹ | ☺ | ☹ | ☺ | ☺ | ☺ |
| Gao et al. 2015 | ☹ | ☹ | ☹ | ☺ | ☺ | ☹ | ☺ | ☺ | ☺ |
| Gharbiya et al. 2014 | ☹ | ☺ | ☹ | ☺ | ☺ | ☹ | ☺ | ☺ | ☺ |
| Golzan et al. 2017 | ☹ | ☹ | ☹ | ☹ | ☹ | ☹ | ☹ | ☺ | ☺ |
| Gunes et al. 2014 | ☺ | ☺ | ☹ | ☹ | ☺ | ☹ | ☹ | ☺ | ☺ |
| Kirbas et al. 2013 | ☹ | ☹ | ☹ | ☺ | ☺ | ☹ | ☺ | ☺ | ☺ |
| Knoll et al. 2016 | ☹ | ☺ | ☹ | ☹ | ☺ | ☹ | ☺ | ☺ | ☺ |
| Kromer et al. 2014 | ☹ | ☺ | ☹ | ☺ | ☺ | ☺ | ☹ | ☺ | ☺ |
| Kwon et al. 2017 | ☺ | ☺ | ☺ | ☺ | ☺ | ☹ | ☺ | ☺ | ☺ |
| Larrosa et al. 2014 | ☹ | ☺ | ☹ | ☺ | ☺ | ☺ | ☺ | ☺ | ☺ |
| Liu et al. 2016 | ☹ | ☺ | ☹ | ☺ | ☺ | ☺ | ☺ | ☺ | ☺ |
| Marziani et al. 2013 | ☹ | ☺ | ☹ | ☺ | ☺ | ☹ | ☺ | ☺ | ☺ |
| Moreno-Ramos et al. 2013 | ☹ | ☺ | ☹ | ☺ | ☺ | ☹ | ☹ | ☺ | ☺ |
| Oktem et al. 2015 | ☺ | ☺ | ☹ | ☹ | ☺ | ☹ | ☹ | ☺ | ☺ |
| Pillai et al. 2016 | ☹ | ☺ | ☹ | ☹ | ☺ | ☹ | ☹ | ☺ | ☺ |
| Polo et al. 2014 | ☺ | ☺ | ☹ | ☺ | ☺ | ☺ | ☹ | ☺ | ☺ |
| Polo et al. 2017 | ☺ | ☺ | ☹ | ☺ | ☺ | ☺ | ☹ | ☺ | ☺ |
| Salobrar-Garcia et al. 2015 | ☺ | ☺ | ☹ | ☹ | ☹ | ☺ | ☺ | ☺ | ☺ |
| Trebbastoni et al. 2016 | ☺ | ☺ | ☹ | ☺ | ☹ | ☹ | ☹ | ☺ | ☺ |
| Trebbastoni et al. 2017 | ☺ | ☺ | ☹ | ☺ | ☹ | ☹ | ☹ | ☺ | ☺ |
= Adequately Reported;
= Inadequately Reported
DISCUSSION
The improved spatial resolution of SD-OCT now allows a more detailed assessment of the neuronal layers in the retina, the most accessible part of the CNS. In this systematic review and meta-analysis, we demonstrated that there were robust associations between AD and thinner SD-OCT measurements at the macula, including GC-IPL thickness, GCC thickness, macular thickness and macular volume (Figure 13). Apart from the SD-OCT measurements at the macula, choroidal thickness and peripapillary RNFL thickness were also significantly reduced in AD (Figure 13). Although the results were inconsistent, we additionally observed a trend of GC-IPL thinning among patients with MCI or CIND. In contrast to the previous meta-analyses, our meta-analysis only included studies using SD-OCT and comprehensively assessed a spectrum of SD-OCT measurements in AD, MCI and CIND. Our findings contributed additional knowledge about the differences of SD-OCT measurements in AD and MCI, and provided further evidence to support the potential role of SD-OCT in studying neurodegenerative processes and detecting neuronal injuries in AD.
Figure 13: Differences in SD-OCT measurements between subjects with AD and controls.
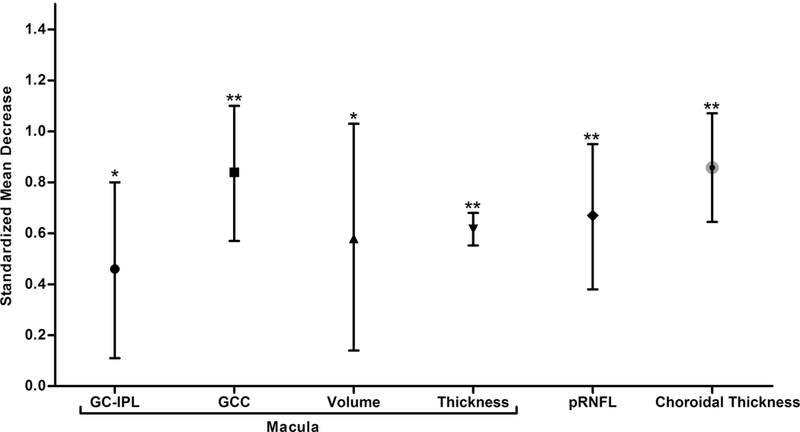
The standardized mean decreases of SD-OCT measurements in AD are shown. The bars represent the 95% confidence intervals of the standardized mean decreases. Significant group differences with p < 0.05 and p < 0.001 are labelled as “*” and “**” respectively.
Our results clearly demonstrated that SD-OCT measurements at the inner retina including macular GC-IPL thickness, macular GCC thickness, and peripapillary RNFL thickness were significantly thinner in AD patients than in controls. Notably, thinning of the GC-IPL occurred in most sub-sectors of the macula. Furthermore, macular thickness and macular volume were also significantly reduced in AD patients when compared to controls. The cell bodies and dendrites of RGCs are mainly located in the GC- IPL at the macular region, whereas the axons of RGCs converge at the RNFL of the peripapillary region and leave the retina via the optic nerve. Hence, thinner macular GC-IPL and peripapillary RNFL indicate fewer RGCs in AD. RGCs, the cells responsible for consolidating visual information and transmitting them to the brain directly via the optic nerve, share similar properties with the cerebral neurons. Fewer RGCs in AD is consistent with the hypothesis that the pathological cascade of AD affects both the cerebral neuron and the RGCs in the retina, leading to loss of RGCs over time.97 In line with this hypothesis, previous pattern electroretinogram analyses also suggested that RGCs are directly involved in Ad,79,103–106 and fewer RGCs in AD subjects may partly explain the ocular manifestation and circadian rhythm disturbances in AD.107–109 However, the cross-sectional design of all included studies did not allow us to conclude this with certainty.
Our analysis also showed that the thicknesses of macular GC-IPL and peripapillary RNFL were generally thinner in MCI patients when compared to controls. Although the magnitude failed to reach a statistical significance, most of the included studies, except the study by Pillai et al.,60 observed a significantly thinner macular GC-IPL in MCI subjects and the statistical significance was preserved in a well-adjusted model.56 The lack of statistical significance in the meta-analyses may partly be ascribed to the limited statistical power due to a small number of eligible studies. In addition, it has also been hypothesized that swelling of neurons 110 and activation of perifoveal Muller glial cells with consequent hypertrophy 111 may occur in the early stages of retinal neurodegeneration, leading to an increase in macular GC-IPL thickness that may offset the magnitude of neuronal thinning.85
In the subgroup analyses, we observed that the differences of macular GC-IPL thickness in AD and MCI were only statistically significant among studies with a single-eye dataset, but not studies with a paired-eyes dataset. In fact, these differences are likely not related to the correlation between eyes. The possible explanation to these findings is the selection bias among the studies. For instance, studies recruiting elderly subjects with generally milder cognitive impairments or less co-existent eye disease (e.g. cataracts and floaters) were more likely to successfully obtain OCT images from both eyes and, therefore, more likely to adopt paired-eyes dataset which may add potentially valuable information. Another potential source of selection bias would be related to the choice of the eye in the studies with a single-eye dataset. Non-random selection of eye (e.g. selection of the thinner retinal layer) could lead to deviation of results, compared with a paired-eyes dataset which averaged information across both eyes. In addition to the selection bias, findings may also be confounded by the heterogeneity of retinal thickness between eyes.112–115
In addition to thinner neuronal layers in the retina, we observed that the choroidal thickness measured by SD-OCT was also significantly thinner in AD. As cerebral vascular impairment is recognized as one of the earliest pathologies in AD,116,117 similar pathophysiological processes may also affect the choroidal layer, which is the vascular layer of the eye. For instance, animal studies reported that amyloid-β, which induces vascular damages in the brain,118,119 also accumulated with ageing in the choroidal vasculature.120,121
There are two possible mechanisms that may explain the differences of SD-OCT measurements in AD. The first proposed that the cerebral pathology of AD may affect the visual pathway and cause retrograde degeneration of the optic nerve,85 because AD pathologic features can be found in subcortical visual centres, including the lateral geniculate nucleus and superior colliculus.122 In agreement with this hypothesis, RGC neuronal abnormalities were also associated with non-AD dementias,97,123,124 strokes,125,126 and other neurodegenerative diseases including multiple sclerosis,127–129 neuromyelitis optica,128 and cerebral atrophy.130 Alternatively, it is also possible that AD pathology occurs simultaneously both in the brain and the retina, leading to thinning of the retinal neuronal layers. Aβ pathology including fibrillar tau, Aβ plaques and specific signs of neuroinflammation has been identified in ocular tissues of both AD subjects 131–133 and animal models of ad.131 134–139 Aβ plaques have also been shown to be neurotoxic to the retinal cells.140–142 In addition, OCT studies in AD patients showed that RNFL thinning was unrelated to changes in cortical visual evoked response, suggesting that neuronal loss in AD cannot be entirely ascribed to retrograde degeneration.88 However, there are controversies about the presence of retinal amyloid-β in AD subjects.143,144 Further experimental and post-mortem studies would allow a better understanding of the mechanism behind the retinal neuronal changes in AD.
Our meta-analysis highlighted several knowledge gaps that warrant further research efforts. First, most available studies to date are cross-sectional studies and there is a lack of prospective studies. Although our findings are consistent with the hypothesis that retinal neuronal loss occurs in parallel with the neurodegeneration in the brain, we cannot conclude this with any certainty due to the cross-sectional designs of the eligible studies. Cortical degeneration measures and other disease-specific biomarkers would have to be used in longitudinal studies recruiting subjects with preclinical AD to understand the changes of neuronal layers with the disease course of AD (e.g. whether retinal degeneration follows cortical Aβ accumulation), and to what extent the neuronal thinning is associated with disease severity. Second, only a limited number of studies have investigated the differences of SD-OCT measurements in MCI, which indicates an increased risk of developing AD.145,146 As discussed, peripapillary RNFL and macular GC-IPL were generally thinner in MCI subjects when compared to controls, but the number of studies may not be sufficient to achieve adequate statistical power. More cross-sectional studies recruiting MCI subjects are required to examine the differences of SD-OCT measurements in MCI. Third, studies with appropriate statistical analysis including receiver operating characteristic curves, the bootstrapped area under curve or false/true-positive fractions are desired to validate the clinical utility of SD-OCT measurements as surrogate biomarkers of AD.
When compared with previous meta-analyses, our meta-analysis comprehensively assessed differences of SD-OCT measurements in AD and MCI, and excluded studies using TD-OCT. However, there are several limitations of our meta-analysis. First, the heterogeneity of disease severities in different studies may affect the estimation of the true effect size. For instance, the mean MMSE score of the MCI subjects ranged from 23.1 to 28 in different studies while that of the AD subjects ranged from 14.1 to 23.3. Hence, the cognitive impairment of some MCI patients may be severe enough to be considered as early dementia, leading to overestimation of the effect sizes in the MCI group. Second, the AD group and the MCI group in the meta-analysis were not well-defined due to limited availability of clinical information and lack of disease-specific biomarkers. For instance, the memory problem in the MCI subjects may have underlying substrates other than Alzheimer’s Disease. Similarly, current clinical diagnostic criteria also routinely fail in accurately differentiating between AD and non-AD dementia, such as vascular dementia.147,148 The inclusion of subjects with non-AD dementia or non-amnestic MCI inevitably introduced variability to the outcomes. Furthermore, our analysis comparing the GC-IPL thickness between controls and subjects with either MCI or CIND should be interpreted with caution as the definitions of MCI and CIND are not identical. Third, some studies hypothesized that AD may be associated with glaucoma,149–158 visual impairment 159,160 and age-related macular degeneration,161 and exclusion of subjects with these comorbidities in many included studies may lead to falsely attenuated associations. Lastly, there were heterogeneities between studies due to variable methodologies, inclusion criteria and exclusion criteria. Notably, the results of meta-regression showed that the types of OCT model had significant impacts on the effect sizes regarding the differences of macular thickness and RNFL thickness in AD, as well as the difference of RNFL thickness in MCI. As suggested by previous studies, the disagreements between OCT models are likely due to different segmentation algorithms and measurement protocols.162,163
OCT has been a landmark discovery in ophthalmology.164 With the ability to image the layered retinal structure three-dimensionally and non-invasively within seconds, SD-OCT has been widely used as a tool to detect and manage retinal and ocular neurodegenerative diseases (e.g. glaucoma) and has the potential to be used to study the neurodegenerative processes of AD in the CNS. Our meta-analysis demonstrated that a number of SD-OCT measurements were significantly thinner in AD patients when compared to controls. The recent findings from two large-scale population-based studies, the UK Biobank Study and the Rotterdam Study, also reported that RNFL thinning indicated a significantly increased risk of developing cognitive decline and AD, respectively.165,166 Notably, the association between RNFL thinning and the higher risk of developing AD remained statistically significant in a model adjusting for cardiovascular risk factors.165 However, the effect sizes with respect to the changes of SD-OCT measurements were less vigorous when compared to biomarkers of magnetic resonance imaging (MRI), such as medial temporal lobe atrophy, 167–169 and amyloid-PET 170. Future research may explore ways of improving sensitivity and specificity of OCT measurements, such as analysis of combined SD-OCT metrics. It is possible that the true diagnostic and prognostic value of SD-OCT measurements in AD may lie in their integration with other clinical and imaging biomarkers, such as retinal vessel morphology and biomarkers of brain MRI, as a part of a multimodal approach. Advances in deep learning algorithms, a subset of artificial intelligence, have shown promises in several diseases,171–177 and may also provide an alternative approach to recognize AD-specific differences in the retinal neuronal structure.178 With the rapid advancement of artificial intelligence and retinal imaging technology, more breakthroughs in this promising fields may be expected to occur.
In summary, our results confirmed the differences of SD-OCT measurements in AD and MCI when compared to controls, highlighting the potential utility of SD-OCT measurements as biomarkers of AD. In the future, SD-OCT might potentially be used clinically as a risk indicator to stratify individuals with high risk of developing AD, who can then benefit from further investigations including amyloid PET imaging and detailed neuropsychological assessments.
ACKNOWLEDGEMENT
Financial Support:
The funding organization had no role in the design or conduct of this research
-
A.
Health and Medical Research Fund, Hong Kong (Grant Number: 04153506)
-
B.
Bright Focus Foundation (Reference Number: A2018093S)
-
C.
National Medical Research Council, Singapore (Grant Number: NMRC/CG/NUHS/2010 and NMRC/CG/013/2013)
-
D.
National Institute of Aging, U.S. (Grant Number: NIA P30 AG028716, R01AG043438 and UH2AG056925)
-
E.
E. Duke-Duke/NUS Pilot Collaborative Award, Singapore & U.S. (Grant number: N/A)
-
F.
Alzheimer’s Association, U.S. (Grant number: NIRG-13–282202)
-
G.
National Institute on Aging Grants, U.S. (Grant number: R01-AG043438, P30-AG028716, U13AG054139)
Footnotes
Conflict of Interest: None of the authors has any conflicts of interest to disclose
Meeting Presentation: Asian-Pacific Academy of Ophthalmology Congress (11 Feb 2018, Hong Kong)
Publisher's Disclaimer: This is a PDF file of an unedited manuscript that has been accepted for publication. As a service to our customers we are providing this early version of the manuscript. The manuscript will undergo copyediting, typesetting, and review of the resulting proof before it is published in its final citable form. Please note that during the production process errors may be discovered which could affect the content, and all legal disclaimers that apply to the journal pertain.
REFERENCES
- 1.Prince M, Bryce R, Albanese E, et al. The global prevalence of dementia: A systematic review and metaanalysis. Alzheimer’s Dement. 2013;9:63–75. [DOI] [PubMed] [Google Scholar]
- 2.Shaw LM, Korecka M, Clark CM, et al. Biomarkers of neurodegeneration for diagnosis and monitoring therapeutics. Nat Rev Drug Discov. 2007;6:295–303. [DOI] [PubMed] [Google Scholar]
- 3.Becker RE, Greig NH, Giacobini E. Why do so many drugs for Alzheimer’s disease fail in development? Time for new methods and new practices? JAlzheimers Dis. 2008;15:303–25. [DOI] [PMC free article] [PubMed] [Google Scholar]
- 4.Holtzman DM, Morris JC, Goate AM. Alzheimer’s disease: the challenge of the second century. Sci TranslMed. 2011;3:77sr1. [DOI] [PMC free article] [PubMed] [Google Scholar]
- 5.Khan TK, Alkon DL. Alzheimer’s Disease Cerebrospinal Fluid and Neuroimaging Biomarkers: Diagnostic Accuracy and Relationship to Drug Efficacy. J Alzheimer’s Dis. 2015;46:817–836. [DOI] [PubMed] [Google Scholar]
- 6.Blennow K, Mattsson N, Schöll M, et al. Amyloid biomarkers in Alzheimer’s disease. Trends Pharmacol Sci. 2015;36:297–309. [DOI] [PubMed] [Google Scholar]
- 7.Tu P, Fu H, Cui M. Compounds for imaging amyloid-β deposits in an Alzheimer’s brain: a patent review. Expert Opin Ther Pat. 2015;25:413–423. [DOI] [PubMed] [Google Scholar]
- 8.Klunk WE, Engler H, Nordberg A, et al. Imaging brain amyloid in Alzheimer’s disease with Pittsburgh Compound-B. Ann Neurol. 2004;55:306–319. [DOI] [PubMed] [Google Scholar]
- 9.Jack CR, Bennett DA, Blennow K, et al. A/T/N: An unbiased descriptive classification scheme for Alzheimer disease biomarkers. Neurology. 2016;87:539–547. [DOI] [PMC free article] [PubMed] [Google Scholar]
- 10.Wright CF, Hall A, Matthews FE, Brayne C. Biomarkers, dementia, and public health. In: Annals of the New York Academy of Sciences.Vol 1180; 2009:11–19. [DOI] [PubMed] [Google Scholar]
- 11.London A, BenharI, Schwartz M The retina as a window to the brain—from eye research to CNS disorders. Nat Rev Neurol. 2012;9:44–53. [DOI] [PubMed] [Google Scholar]
- 12.Vecino E, Rodriguez FD, Ruzafa N, et al. Glia-neuron interactions in the mammalian retina. Prog Retin Eye Res. 2016;51:1–40. [DOI] [PubMed] [Google Scholar]
- 13.Patton N, Aslam T, Macgillivray T, et al. Retinal vascular image analysis as a potential screening tool for cerebrovascular disease: a rationale based on homology between cerebral and retinal microvasculatures. JAnat. 2005;206:319–48. [DOI] [PMC free article] [PubMed] [Google Scholar]
- 14.Trost A, Lange S, Schroedl F, et al. Brain and Retinal Pericytes: Origin, Function and Role. Front Cell Neurosci. 2016;10:20. [DOI] [PMC free article] [PubMed] [Google Scholar]
- 15.Byerly MS, Blackshaw S. Vertebrate retina and hypothalamus development. Wiley Interdiscip Rev Syst Biol Med. 2009;1:380–389. [DOI] [PubMed] [Google Scholar]
- 16.Blanks JC, Schmidt SY, Torigoe Y, et al. Retinal pathology in Alzheimer’s disease. II. Regional neuron loss and glial changes in GCL. Neurobiol Aging. 1996;17:385–395. [DOI] [PubMed] [Google Scholar]
- 17.Blanks JC, Torigoe Y, Hinton DR, Blanks RHI. Retinal pathology in Alzheimer’s disease. I. Ganglion cell loss in foveal/parafoveal retina. Neurobiol Aging. 1996;17:377–384. [DOI] [PubMed] [Google Scholar]
- 18.Sadun AA, Borchert M, DeVita E, et al. Assessment of Visual Impairment in Patients With Alzheimer’s Disease. Am J Ophthalmol. 1987;104:113–120. [DOI] [PubMed] [Google Scholar]
- 19.Hinton DR, Sadun AA, Blanks JC, Miller CA. Optic-Nerve Degeneration in Alzheimer’s Disease. N Engl J Med. 1986;315:485–487. [DOI] [PubMed] [Google Scholar]
- 20.Williams PA, Thirgood RA, Oliphant H, et al. Retinal ganglion cell dendritic degeneration in a mouse model of Alzheimer’s disease. Neurobiol Aging. 2013;34:1799–1806. [DOI] [PubMed] [Google Scholar]
- 21.Cheung CYlui, Ikram MK, Chen C, Wong TY. Imaging retina to study dementia and stroke. Prog Retin Eye Res. 2017;57:89–107. [DOI] [PubMed] [Google Scholar]
- 22.Chan VTT, Tso THK, Tang F, et al. Using Retinal Imaging to Study Dementia. J Vis Exp. 2017;129:e56137–e56137. [DOI] [PMC free article] [PubMed] [Google Scholar]
- 23.Cheung CYL, Ong YT, Ikram MK, et al. Microvascular network alterations in the retina of patients with Alzheimer’s disease. Alzheimer’s Dement. 2014;10:135–142. [DOI] [PubMed] [Google Scholar]
- 24.Williams MA, McGowan AJ, Cardwell CR, et al. Retinal microvascular network attenuation in Alzheimer’s disease. Alzheimer’s Dement Diagnosis, Assess Dis Monit. 2015;1:229–235. [DOI] [PMC free article] [PubMed] [Google Scholar]
- 25.Williams MA, Silvestri V, Craig D, et al. The prevalence of age-related macular degeneration in Alzheimer’s disease. JAlzheimers Dis. 2014;42:909–14. [DOI] [PubMed] [Google Scholar]
- 26.Frost S, Kanagasingam Y, Sohrabi H, et al. Retinal vascular biomarkers for early detection and monitoring of Alzheimer’s disease. TranslPsychiatry. 2013;3:e233. [DOI] [PMC free article] [PubMed] [Google Scholar]
- 27.Schrijvers EMC, Buitendijk GHS, Ikram MK, et al. Retinopathy and risk of dementia: The rotterdam study. Neurology. 2012;79:365–370. [DOI] [PMC free article] [PubMed] [Google Scholar]
- 28.DeJong FJ, Schrijvers EMC, Ikram MK, et al. Retinal vascular caliber and risk of dementia: The Rotterdam Study. Neurology. 2011;76:816–821. [DOI] [PMC free article] [PubMed] [Google Scholar]
- 29.Qiu C, Cotch MF, Sigurdsson S, et al. Cerebral microbleeds, retinopathy, and dementia: The AGES- Reykjavik Study. Neurology. 2010;75:2221–2228. [DOI] [PMC free article] [PubMed] [Google Scholar]
- 30.Baker ML, Wang JJ, Rogers S, et al. Early age-related macular degeneration, cognitive function, and dementia: the Cardiovascular Health Study. Arch Ophthalmol. 2009;127:667–73. [DOI] [PMC free article] [PubMed] [Google Scholar]
- 31.Baker ML, Marino Larsen EK, Kuller LH, et al. Retinal microvascular signs, cognitive function, and dementia in older persons: the Cardiovascular Health Study. Stroke. 2007;38:2041–2047. [DOI] [PubMed] [Google Scholar]
- 32.He X-F, Liu Y-T, Peng C, et al. Optical coherence tomography assessed retinal nerve fiber layer thickness in patients with Alzheimer’s disease: a meta-analysis. Int J Ophthalmol. 2012;5:401–5. [DOI] [PMC free article] [PubMed] [Google Scholar]
- 33.Thomson KL, Yeo JM, Waddell B, et al. A systematic review and meta-analysis of retinal nerve fiber layer change in dementia, using optical coherence tomography. Alzheimer’s Dement (Amsterdam, Netherlands). 2015;1:136–43. [DOI] [PMC free article] [PubMed] [Google Scholar]
- 34.Coppola G, DiRenzo A, Ziccardi L, et al. Optical Coherence Tomography in Alzheimer’s Disease: A Meta-Analysis. PLoS One. 2015;10:e0134750. [DOI] [PMC free article] [PubMed] [Google Scholar]
- 35.denHaan J, Verbraak FD, Visser PJ, Bouwman FH. Retinal thickness in Alzheimer’s disease: A systematic review and meta-analysis. Alzheimer’s Dement (Amsterdam, Netherlands). 2017;6:162–170. [DOI] [PMC free article] [PubMed] [Google Scholar]
- 36.McGrory S, Cameron JR Pellegrini E, et al. The application of retinal fundus camera imaging in dementia: A systematic review. Alzheimer’s Dement Diagnosis, Assess Dis Monit. 2017;6:91–107. [DOI] [PMC free article] [PubMed] [Google Scholar]
- 37.Lange AP, Sadjadi R, Saeedi J, et al. Time-Domain and Spectral-Domain Optical Coherence Tomography of Retinal Nerve Fiber Layer in MS Patients and Healthy Controls. J Ophthalmol. 2012;2012:1–7. [DOI] [PMC free article] [PubMed] [Google Scholar]
- 38.Vizzeri G, Weinreb RN, Gonzalez-Garcia AO, et al. Agreement between spectral-domain and timedomain OCT for measuring RNFL thickness. Br J Ophthalmol. 2009;93:775–81. [DOI] [PMC free article] [PubMed] [Google Scholar]
- 39.Wojtkowski M, Leitgeb R, Kowalczyk A, et al. In vivo human retinal imaging by Fourier domain optical coherence tomography. JBiomed Opt. 2002;7:457. [DOI] [PubMed] [Google Scholar]
- 40.Fercher AF, Hitzenberger CK, Kamp G, El-Zaiat SY. Measurement of intraocular distances by backscattering spectral interferometry. Opt Commun. 1995;117:43–48. [Google Scholar]
- 41.Nassif NA, Cense B, Park BH, et al. In vivo high-resolution video-rate spectral-domain optical coherence tomography of the human retina and optic nerve. Opt Express. 2004;12:367. [DOI] [PubMed] [Google Scholar]
- 42.deBoer JF, Cense B, Park BH, et al. Improved signal-to-noise ratio in spectral-domain compared with time-domain optical coherence tomography. Opt Lett. 2003;28:2067. [DOI] [PubMed] [Google Scholar]
- 43.Leitgeb R, Hitzenberger C, Fercher A. Performance of fourier domain vs time domain optical coherence tomography. Opt Express. 2003; 11: 889. [DOI] [PubMed] [Google Scholar]
- 44.Chen TC, Cense B, Pierce MC, et al. Spectral domain optical coherence tomography ultra-high speed, ultra-high resolution ophthalmic imaging. Arch Ophthalmol. 2005;123:1715–1720. [DOI] [PubMed] [Google Scholar]
- 45.vanVelthoven MEJ, Faber DJ, Verbraak FD, et al. Recent developments in optical coherence tomography for imaging the retina. Prog Retin Eye Res. 2007;26:57–77. [DOI] [PubMed] [Google Scholar]
- 46.Syc SB, Warner CV, Hiremath GS, et al. Reproducibility of high-resolution optical coherence tomography in multiple sclerosis. Mult Scler J. 2010;16:829–839. [DOI] [PubMed] [Google Scholar]
- 47.Mwanza J-C, Chang RT, Budenz DL, et al. Reproducibility of peripapillary retinal nerve fiber layer thickness and optic nerve head parameters measured with cirrus HD-OCT in glaucomatous eyes. Invest Ophthalmol Vis Sci. 2010;51:5724–30. [DOI] [PMC free article] [PubMed] [Google Scholar]
- 48.Menke MN, Knecht P, Sturm V, et al. Reproducibility of Nerve Fiber Layer Thickness Measurements Using 3D Fourier-Domain OCT. Investig Opthalmology Vis Sci. 2008;49:5386. [DOI] [PubMed] [Google Scholar]
- 49.Garcia-Martin E, Pueyo V, PinillaI, et al. Fourier-Domain OCT in Multiple Sclerosis Patients: Reproducibility and Ability to Detect Retinal Nerve Fiber Layer Atrophy. Investig Opthalmology Vis Sci. 2011;52:4124. [DOI] [PubMed] [Google Scholar]
- 50.Garcia-Martin E, PinillaI, Idoipe M, et al. Intra and interoperator reproducibility of retinal nerve fibre and macular thickness measurements using Cirrus Fourier-domain OCT. Acta Ophthalmol. 2011;89:e23–e29. [DOI] [PubMed] [Google Scholar]
- 51.Cettomai D, Pulicken M, Gordon-Lipkin E, et al. Reproducibility of Optical Coherence Tomography in Multiple Sclerosis. Arch Neurol. 2008;65:853–863. [DOI] [PubMed] [Google Scholar]
- 52.Leung CKS, Yu M, Weinreb RN, et al. Retinal Nerve Fiber Layer Imaging with Spectral-Domain Optical Coherence Tomography. Ophthalmology. 2012;119:731–737. [DOI] [PubMed] [Google Scholar]
- 53.Mwanza J-C, Oakley JD, Budenz DL, et al. Macular ganglion cell-inner plexiform layer: automated detection and thickness reproducibility with spectral domain-optical coherence tomography in glaucoma.Invest Ophthalmol Vis Sci. 2011;52:8323–9. [DOI] [PMC free article] [PubMed] [Google Scholar]
- 54.DeBuc DC, Somfai GM, Ranganathan S, et al. Reliability and reproducibility of macular segmentation using a custom-built optical coherence tomography retinal image analysis software. J Biomed Opt. 2009;14:064023. [DOI] [PMC free article] [PubMed] [Google Scholar]
- 55.Bayhan HA, Aslan Bayhan S, Celikbilek A, et al. Evaluation of the chorioretinal thickness changes in Alzheimer’s disease using spectral-domain optical coherence tomography. Clin Experiment Ophthalmol. 2015;43:145–51. [DOI] [PubMed] [Google Scholar]
- 56.Cheung CY, Ong YT, Hilal S, et al. Retinal Ganglion Cell Analysis Using High-Definition Optical Coherence Tomography in Patients with Mild Cognitive Impairment and Alzheimer’s Disease. J Alzheimer’s Dis. 2015;45:45–56. [DOI] [PubMed] [Google Scholar]
- 57.Larrosa JM, Garcia-Martin E, Bambo MP, et al. Potential New Diagnostic Tool for Alzheimer’s Disease Using a Linear Discriminant Function for Fourier Domain Optical Coherence Tomography. Investig Opthalmology Vis Sci. 2014;55:3043. [DOI] [PubMed] [Google Scholar]
- 58.Liu S, Ong Y- T, Hilal S, et al. The Association Between Retinal Neuronal Layer and Brain Structure is Disrupted in Patients with Cognitive Impairment and Alzheimer’s Disease. J Alzheimer’s Dis. 2016;54:585–595. [DOI] [PubMed] [Google Scholar]
- 59.Marziani E, Pomati S, Ramolfo P, et al. Evaluation of Retinal Nerve Fiber Layer and Ganglion Cell Layer Thickness in Alzheimer’s Disease Using Spectral-Domain Optical Coherence Tomography. Investig Opthalmology Vis Sci. 2013;54:5953. [DOI] [PubMed] [Google Scholar]
- 60.Pillai JA, Berme lR, Bonner-Jackson A, et al. Retinal Nerve Fiber Layer Thinning in Alzheimer’s Disease. Am J Alzheimer’s Dis Other Dementiasr. 2016;31:430–436. [DOI] [PMC free article] [PubMed] [Google Scholar]
- 61.Polo V, Garcia-Martin E, Bambo MP, et al. Reliability and validity of Cirrus and Spectralis optical coherence tomography for detecting retinal atrophy in Alzheimer’s disease. Eye (Lond). 2014;28:680–90. [DOI] [PMC free article] [PubMed] [Google Scholar]
- 62.Polo V, Rodrigo MJ, Garcia-Martin E, et al. Visual dysfunction and its correlation with retinal changes in patients with Alzheimer’s disease. Eye. 2017;31:1034–1041. [DOI] [PMC free article] [PubMed] [Google Scholar]
- 63.Salobrar-Garcia E, HoyasI, Leal M, et al. Analysis of Retinal Peripapillary Segmentation in Early Alzheimer’s Disease Patients. BiomedRes Int. 2015;2015:1–8. [DOI] [PMC free article] [PubMed] [Google Scholar]
- 64.Choi SH, Park SJ, Kim NR. Macular Ganglion Cell -Inner Plexiform Layer Thickness Is Associated with Clinical Progression in Mild Cognitive Impairment and Alzheimers Disease. PLoS One. 2016;11:e0162202. [DOI] [PMC free article] [PubMed] [Google Scholar]
- 65.Cunha JP, Proenfa R, Dias-Santos A, et al. OCT in Alzheimer’s disease: thinning of the RNFL and superior hemiretina. Graefe’s Arch Clin Exp Ophthalmol. 2017;255:1827–1835. [DOI] [PubMed] [Google Scholar]
- 66.Cunha LP, Lopes LC, Costa-Cunha LVF, et al. Macular Thickness Measurements with Frequency Domain-OCT for Quantification of Retinal Neural Loss and its Correlation with Cognitive Impairment in Alzheimer’s Disease Mori K, ed. PLoS One. 2016;11:e0153830. [DOI] [PMC free article] [PubMed] [Google Scholar]
- 67.Eraslan M, Çerman E, Çekiç O, et al. Neurodegeneration in ocular and central nervous systems: optical coherence tomography study in normal-tension glaucoma and Alzheimer disease. Turkish J Med Sci. 2015;45:1106–14. [DOI] [PubMed] [Google Scholar]
- 68.Gao L, Liu Y, Li X, et al. Abnormal retinal nerve fiber layer thickness and macula lutea in patients with mild cognitive impairment and Alzheimer’s disease. Arch Gerontol Geriatr. 2015;60:162–167. [DOI] [PubMed] [Google Scholar]
- 69.Gharbiya M, Trebbastoni A, Parisi F, et al. Choroidal Thinning as a New Finding in Alzheimer’s Disease: Evidence from Enhanced Depth Imaging Spectral Domain Optical Coherence Tomography. J Alzheimer’s Dis. 2014;40:907–917. [DOI] [PubMed] [Google Scholar]
- 70.Knoll B, Simonett J, Volpe NJ, et al. Retinal nerve fiber layer thickness in amnestic mild cognitive impairment: Case-control study and meta-analysis. Alzheimer’s Dement (Amsterdam, Netherlands). 2016;4:85–93. [DOI] [PMC free article] [PubMed] [Google Scholar]
- 71.Kwon JY, Yang JH, Han JS, Kim DG. Analysis of the Retinal Nerve Fiber Layer Thickness in Alzheimer Disease and Mild Cognitive Impairment. Korean J Ophthalmol. 2017;31. [DOI] [PMC free article] [PubMed] [Google Scholar]
- 72.Stroup DF, Berlin JA, Morton SC, et al. Meta-analysis of observational studies in epidemiology: a proposal for reporting. Meta-analysis Of Observational Studies in Epidemiology (MOOSE) group. JAMA. 2000;283:2008–2012. [DOI] [PubMed] [Google Scholar]
- 73.Chertkow H, Nasreddine Z, Joanette Y, et al. Mild cognitive impairment and cognitive impairment, no dementia: Part A, concept and diagnosis. Alzheimers Dement. 2007;3:266–282. [DOI] [PubMed] [Google Scholar]
- 74.Whiting PF, Rutjes AWS, Westwood ME, et al. QUADAS-2: a revised tool for the quality assessment of diagnostic accuracy studies. Ann Intern Med. 2011;155:529–36. [DOI] [PubMed] [Google Scholar]
- 75.Cruz-Herranz A, Balk LJ, Oberwahrenbrock T, et al. The APOSTEL recommendations for reporting quantitative optical coherence tomography studies. Neurology. 2016;86:2303–2309. [DOI] [PMC free article] [PubMed] [Google Scholar]
- 76.Folstein MF, Folstein SE, McHugh PR. “Mini-mental state”. A practical method for grading the cognitive state of patients for the clinician. J Psychiatr Res. 1975; 12:189–198. [DOI] [PubMed] [Google Scholar]
- 77.Egger M, Smith GD, Schneider M, Minder C. Bias in meta-analysis detected by a simple, graphical test. BMJ. 1997;315. [DOI] [PMC free article] [PubMed] [Google Scholar]
- 78.Golzan SM, Goozee K, Georgevsky D, et al. Retinal vascular and structural changes are associated with amyloid burden in the elderly: Ophthalmic biomarkers of preclinical Alzheimer’s disease. Alzheimer’s Res Ther. 2017;9. [DOI] [PMC free article] [PubMed] [Google Scholar]
- 79.Parisi V, Restuccia R, Fattapposta F, et al. Morphological and functional retinal impairment in Alzheimer’s disease patients. Clin Neurophysiol. 2001;112:1860–1867. [DOI] [PubMed] [Google Scholar]
- 80.Berisha F, Feke GT, Trempe CL, et al. Retinal Abnormalities in Early Alzheimer’s Disease. Investig Opthalmology Vis Sci. 2007;48:2285. [DOI] [PubMed] [Google Scholar]
- 81.Paquet C, Boissonnot M, Roger F, et al. Abnormal retinal thickness in patients with mild cognitive impairment and Alzheimer’s disease. Neurosci Lett. 2007;420:97–99. [DOI] [PubMed] [Google Scholar]
- 82.Lu Y, Li Z, Zhang X, et al. Retinal nerve fiber layer structure abnormalities in early Alzheimer’s disease: Evidence in optical coherence tomography. Neurosci Lett. 2010;480:69–72. [DOI] [PubMed] [Google Scholar]
- 83.Kesler A, Vakhapova V, Korczyn AD, et al. Retinal thickness in patients with mild cognitive impairment and Alzheimer’s disease. Clin NeurolNeurosurg. 2011;113:523–526. [DOI] [PubMed] [Google Scholar]
- 84.Moschos MM, Markopoulos I, Chatziralli I, et al. Structural and functional impairment of the retina and optic nerve in Alzheimer’s disease. Curr Alzheimer Res. 2012;9:782–8. [DOI] [PubMed] [Google Scholar]
- 85.Ascaso FJ, Cruz N, Modrego PJ, et al. Retinal alterations in mild cognitive impairment and Alzheimer’s disease: an optical coherence tomography study. J Neurol. 2014;261:1522–1530. [DOI] [PubMed] [Google Scholar]
- 86.Liu D, Zhang L, Li Z, et al. Thinner changes of the retinal nerve fiber layer in patients with mild cognitive impairment and Alzheimer’s disease. BMC Neurol. 2015; 15:14. [DOI] [PMC free article] [PubMed] [Google Scholar]
- 87.LaMorgia C, Ross-Cisneros FN, Koronyo Y, et al. Melanopsin retinal ganglion cell loss in Alzheimer disease. Ann Neurol. 2016;79:90–109. [DOI] [PMC free article] [PubMed] [Google Scholar]
- 88.Iseri PK, Altinas Z, Tokay T, Xen Yükse lN Relationship between Cognitive Impairment and Retinal Morphological and Visual Functional Abnormalities in Alzheimer Disease. J Neuro-Ophthalmol. 2006;26:18–24. [DOI] [PubMed] [Google Scholar]
- 89.Giménez Castejón D, Dudekova M, Gómez Gallego M, Lajara Blesa J. Macular Thickness in Subjective Memory Complaints and Mild Cognitive Impairment: A Non-Invasive Biomarker. Neuroophthalmology. 2016;40:16–22. [DOI] [PMC free article] [PubMed] [Google Scholar]
- 90.Bulut M, Yaman A, Ero lMK, et al. Choroidal Thickness in Patients with Mild Cognitive Impairment and Alzheimer’s Type Dementia. J Ophthalmol. 2016;2016. [DOI] [PMC free article] [PubMed] [Google Scholar]
- 91.Bambo MP, Garcia-Martin E, Gutierrez-Ruiz F, et al. Analysis of optic disk color changes in Alzheimer’s disease: A potential new biomarker. Clin NeurolNeurosurg. 2015;132:68–73. [DOI] [PubMed] [Google Scholar]
- 92.Ferrari L, Huang S-C, Magnani G, et al. Optical Coherence Tomography Reveals Retinal Neuroaxonal Thinning in Frontotemporal Dementia as in Alzheimer’s Disease. J Alzheimer’s Dis. 2017;56:1101–1107. [DOI] [PubMed] [Google Scholar]
- 93.Garcia-Martin E, Bambo MP, Marques ML, et al. Ganglion cell layer measurements correlate with disease severity in patients with Alzheimer’s disease. Acta Ophthalmol. 2016;94:e454–e459. [DOI] [PubMed] [Google Scholar]
- 94.Güneş A, Demirci S, Tok L, et al. Evaluation of retinal nerve fiber layer thickness in Alzheimer disease using spectral-domain optical coherence tomography. Turkish J Med Sci. 2014. [PubMed] [Google Scholar]
- 95.Kirbas S, Turkyilmaz K, Anlar O, et al. Retinal Nerve Fiber Layer Thickness in Patients With Alzheimer Disease. J Neuro-ophthalmology. 2013;33:58–61. [DOI] [PubMed] [Google Scholar]
- 96.Kromer R, Serbecic N, Hausner L, et al. Detection of Retinal Nerve Fiber Layer Defects in Alzheimer’s Disease Using SD-OCT. Front psychiatry. 2014;5:22. [DOI] [PMC free article] [PubMed] [Google Scholar]
- 97.Moreno-Ramos T, Benito-León J, Villarejo A, Bermejo-Pareja F. Retinal Nerve Fiber Layer Thinning in Dementia Associated with Parkinson’s Disease, Dementia with Lewy Bodies, and Alzheimer’s Disease. J Alzheimer’s Dis. 2013;34:659–664. [DOI] [PubMed] [Google Scholar]
- 98.Oktem EO, Derle E, Kibaroglu S, et al. The relationship between the degree of cognitive impairment and retinal nerve fiber layer thickness. Neurol Sci. 2015;36:1141–1146. [DOI] [PubMed] [Google Scholar]
- 99.Trebbastoni A, D’Antonio F, Bruscolini A, et al. Retinal nerve fibre layer thickness changes in Alzheimer’s disease: Results from a 12-month prospective case series. Neurosci Lett. 2016;629:165–170. [DOI] [PubMed] [Google Scholar]
- 100.B.K, M.W, S.W, A.A.F. Structural and functional ocular manifestations of mild cognitive impairment. Investig Ophthalmol Vis Sci. 2015;56:3370. [Google Scholar]
- 101.Trebbastoni A, Marcelli M, Mallone F, et al. Attenuation of Choroidal Thickness in Patients With Alzheimer Disease. Alzheimer Dis Assoc Disord. 2017;31:128–134. [DOI] [PubMed] [Google Scholar]
- 102.Cunha JP, Proença R, Dias-Santos A, et al. Choroidal thinning: Alzheimer’s disease and aging. Alzheimer’s Dement Diagnosis, Assess Dis Monit. 2017;8:11–17. [DOI] [PMC free article] [PubMed] [Google Scholar]
- 103.Parisi V Correlation between morphological and functional retinal impairment in patients affected by ocular hypertension, glaucoma, demyelinating optic neuritis and Alzheimer’s disease. Semin Ophthalmol. 2003;18:50–57. [DOI] [PubMed] [Google Scholar]
- 104.Krasodomska K, Lubinski W, Potemkowski A, Honczarenko K. Pattern electroretinogram (PERG) and pattern visual evoked potential (PVEP) in the early stages of Alzheimer’s disease. Doc Ophthalmol. 2010;121:111–121. [DOI] [PMC free article] [PubMed] [Google Scholar]
- 105.Justino L, Kergoat MJ, Bergman H, et al. Neuroretinal function is normal in early dementia of the Alzheimer type. Neurobiol Aging. 2001;22:691–695. [DOI] [PubMed] [Google Scholar]
- 106.Trick GL, Barris MC, Bickler D, Bluth M. Abnormal pattern electroretinograms in patients with senile dementia of the alzheimer type. Ann Neurol. 1989;26:226–231. [DOI] [PubMed] [Google Scholar]
- 107.Javaid FZ, Brenton J, Guo L, Cordeiro MF. Visual and ocular manifestations of Alzheimer’s disease and their use as biomarkers for diagnosis and progression. Front Neurol. 2016;7. [DOI] [PMC free article] [PubMed] [Google Scholar]
- 108.Katz B, Rimmer S. Ophthalmologic manifestations of Alzheimer’s disease. Surv Ophthalmol. 1989;34:31–43. [DOI] [PubMed] [Google Scholar]
- 109.Hart NJ, Koronyo Y, Black KL, Koronyo-Hamaoui M. Ocular indicators of Alzheimer’s: exploring disease in the retina. Acta Neuropathol. 2016;132:767–787. [DOI] [PMC free article] [PubMed] [Google Scholar]
- 110.Fujino Y, DeLucia MW, Davies P, Dickson DW. Ballooned neurones in the limbic lobe are associated with Alzheimer type pathology and lack diagnostic specificity. Neuropathol Appl Neurobiol. 2004;30:676–682. [DOI] [PubMed] [Google Scholar]
- 111.Reichenbach A, Wurm A, Pannicke T, et al. Müller cells as players in retinal degeneration and edema. Graefe’s Arch Clin Exp Ophthalmol. 2007;245:627–636. [DOI] [PubMed] [Google Scholar]
- 112.Cameron JR, Megaw RD, Tatham AJ, et al. Lateral thinking - Interocular symmetry and asymmetry in neurovascular patterning, in health and disease. Prog Retin Eye Res. 2017;59:131–157. [DOI] [PubMed] [Google Scholar]
- 113.Huynh SC, Wang XY, Burlutsky G, Mitchell P. Symmetry of Optical Coherence Tomography Retinal Measurements in Young Children. Am J Ophthalmol. 2007;143:518–520. [DOI] [PubMed] [Google Scholar]
- 114.Hwang YH, Song M, Kim YY, et al. Interocular symmetry of retinal nerve fibre layer thickness in healthy eyes: A spectral-domain optical coherence tomographic study. Clin Exp Optom. 2014;97:550–554. [DOI] [PubMed] [Google Scholar]
- 115.Lee SY, Jeoung JW, Park KH, Kim DM. Macular ganglion cell imaging study: Interocular symmetry of ganglion cell-inner plexiform layer thickness in normal healthy eyes. Am J Ophthalmol. 2015;159:315–323.e2. [DOI] [PubMed] [Google Scholar]
- 116.Dela Torre JC. Alzheimer disease as a vascular disorder: Nosological evidence. Stroke. 2002;33:1152–1162. [DOI] [PubMed] [Google Scholar]
- 117.Bell RD, Zlokovic BV. Neurovascular mechanisms and blood-brain barrier disorder in Alzheimer’s disease. Acta Neuropathol. 2009;118:103–113. [DOI] [PMC free article] [PubMed] [Google Scholar]
- 118.Thal DR, Griffin WST, deVos RAI, Ghebremedhin E. Cerebral amyloid angiopathy and its relationship to Alzheimer’s disease. Acta Neuropathol. 2008;115:599–609. [DOI] [PubMed] [Google Scholar]
- 119.Suo Z, Humphrey J, Kundtz A, et al. Soluble Alzheimers ß-amyloid constricts the cerebral vasculature in vivo. Neurosci Lett. 1998;257:77–80. [DOI] [PubMed] [Google Scholar]
- 120.Ning A, Cui J, To E, et al. Amyloid-β Deposits Lead to Retinal Degeneration in a Mouse Model of Alzheimer Disease. Investig Opthalmology Vis Sci 2008;49:5136. [DOI] [PMC free article] [PubMed] [Google Scholar]
- 121.Kam JH, Lenassi E, Jeffery G. Viewing ageing eyes: Diverse sites of amyloid beta accumulation in the ageing mouse retina and the up-regulation of macrophages. PLoS One. 2010;5. [DOI] [PMC free article] [PubMed] [Google Scholar]
- 122.Leuba G, Saini K. Pathology of subcortical visual centres in relation to cortical degeneration in Alzheimer’s disease. Neuropathol Appl Neurobiol. 1995;21:410–422. [DOI] [PubMed] [Google Scholar]
- 123.Moschos MM, Tagaris G, MarkopoulosI, et al. Morphologic changes and functional retinal impairment in patients with Parkinson disease without visual loss. Eur J Ophthalmol. 2011;21:24–29. [DOI] [PubMed] [Google Scholar]
- 124.Garcia-Martin E, Satue M, FuertesI, et al. Ability and reproducibility of Fourier-domain optical coherence tomography to detect retinal nerve fiber layer atrophy in Parkinson’s disease. Ophthalmology. 2012;119:2161–2167. [DOI] [PubMed] [Google Scholar]
- 125.Wang D, Li Y, Wang C, et al. Localized retinal nerve fiber layer defects and stroke. Stroke. 2014;45:1651–1656. [DOI] [PubMed] [Google Scholar]
- 126.Kalesnykas G, Tuulos T, Uusitalo H, Jolkkonen J. Neurodegeneration and cellular stress in the retina and optic nerve in rat cerebral ischemia and hypoperfusion models. Neuroscience. 2008;155:937–947. [DOI] [PubMed] [Google Scholar]
- 127.Frohman EM, Fujimoto JG, Frohman TC, et al. Optical coherence tomography: a window into the mechanisms of multiple sclerosis. Mult Scler Nat Clin Pr Neurol Author Manuscr Nat Clin Pr Neurol. 2009;4:664–675. [DOI] [PMC free article] [PubMed] [Google Scholar]
- 128.Monteiro MLR, Fernandes DB, Apóstolos-Pereira SL, Callegaro D. Quantification of retinal neural loss in patients with neuromyelitis optica and multiple sclerosis with or without optic neuritis using fourier-domain optical coherence tomography. Investig Ophthalmol Vis Sci. 2012;53:3959–3966. [DOI] [PubMed] [Google Scholar]
- 129.Fisher JB, Jacobs DA, Markowitz CE, et al. Relation of visual function to retinal nerve fiber layer thickness in multiple sclerosis. Ophthalmology. 2006;113:324–332. [DOI] [PubMed] [Google Scholar]
- 130.Ong YT, Hilal S, Cheung CY, et al. Retinal neurodegeneration on optical coherence tomography and cerebral atrophy. Neurosci Lett. 2015;584:12–16. [DOI] [PubMed] [Google Scholar]
- 131.Koronyo-Hamaoui M, Koronyo Y, Ljubimov AV, et al. Identification of amyloid plaques in retinas from Alzheimer’s patients and noninvasive in vivo optical imaging of retinal plaques in a mouse model. Neuroimage. 2011. ;54 Suppl 1:S204–17. [DOI] [PMC free article] [PubMed] [Google Scholar]
- 132.Goldstein LE, Muffat JA, Cherny RA, et al. Cytosolic P-amyloid deposition and supranuclear cataracts in lenses from people with Alzheimer’s disease. Lancet. 2003;361:1258–1265. [DOI] [PubMed] [Google Scholar]
- 133.Kayabasi U, Sergott RC, Rispoli M. Retinal Examination for the Diagnosis of Alzheimer’s Disease.Int J Ophthalmic Pathol. 2014; 03. [Google Scholar]
- 134.Cohen RM, Rezai-Zadeh K, Weitz TM, et al. A transgenic Alzheimer rat with plaques, tau pathology, behavioral impairment, oligomeric aP, and frank neuronal loss. J Neurosci. 2013;33:6245–56. [DOI] [PMC free article] [PubMed] [Google Scholar]
- 135.Schon C, Hoffmann NA, Ochs SM, et al. Long-term in vivo imaging of fibrillar tau in the retina of P301S transgenic mice. PLoS One. 2012;7:e53547. [DOI] [PMC free article] [PubMed] [Google Scholar]
- 136.Liu B, Rasool S, Yang Z, et al. Amyloid-peptide vaccinations reduce {beta}-amyloid plaques but exacerbate vascular deposition and inflammation in the retina of Alzheimer’s transgenic mice. Am J Pathol. 2009;175:2099–110. [DOI] [PMC free article] [PubMed] [Google Scholar]
- 137.Perez SE, Lumayag S, Kovacs B, et al. Beta-amyloid deposition and functional impairment in the retina of the APPswe/PS 1DeltaE9 transgenic mouse model of Alzheimer’s disease. Invest Ophthalmol Vis Sci. 2009;50:793–800. [DOI] [PMC free article] [PubMed] [Google Scholar]
- 138.Ning A, Cui J, To E, et al. Amyloid-beta deposits lead to retinal degeneration in a mouse model of Alzheimer disease. Invest Ophthalmol Vis Sci. 2008;49:5136–43. [DOI] [PMC free article] [PubMed] [Google Scholar]
- 139.Koronyo Y, Biggs D, Barron E, et al. Retinal amyloid pathology and proof-of-concept imaging trial in Alzheimer’s disease. JCIInsight. 2017;2. [DOI] [PMC free article] [PubMed] [Google Scholar]
- 140.Tsuruma K, Tanaka Y, Shimazawa M, Hara H. Induction of amyloid precursor protein by the neurotoxic peptide, amyloid-beta 25–35, causes retinal ganglion cell death. JNeurochem. 2010; 113:1545–1554. [DOI] [PubMed] [Google Scholar]
- 141.Ning A, Cui J, To E, et al. Amyloid-beta deposits lead to retinal degeneration in a mouse model of Alzheimer disease. Invest Ophthalmol Vis Sci. 2008;49:5136–5143. [DOI] [PMC free article] [PubMed] [Google Scholar]
- 142.Ding J-D, Johnson LV, Herrmann R, et al. Anti-amyloid therapy protects against retinal pigmented epithelium damage and vision loss in a model of age-related macular degeneration. Proc Natl Acad Sci U S A. 2011;108:E279–87. [DOI] [PMC free article] [PubMed] [Google Scholar]
- 143.Ho CY, Troncoso JC, Knox D, et al. Beta-amyloid, phospho-tau and alpha-synuclein deposits similar to those in the brain are not identified in the eyes of Alzheimer’s and Parkinson’s disease patients. Brain Pathol. 2014;24:25–32. [DOI] [PMC free article] [PubMed] [Google Scholar]
- 144.Schön C, Hoffmann NA, Ochs SM, et al. Long-Term In Vivo Imaging of Fibrillar Tau in the Retina of P301S Transgenic Mice. PLoS One. 2012;7. [DOI] [PMC free article] [PubMed] [Google Scholar]
- 145.Petersen RC, Doody R, Kurz a, et al. Current concepts in mild cognitive impairment. Arch Neurol. 2001;58:1985–1992. [DOI] [PubMed] [Google Scholar]
- 146.Albert MS, DeKosky ST, Dickson D, et al. The diagnosis of mild cognitive impairment due to Alzheimer’s disease: Recommendations from the National Institute on Aging-Alzheimer’s Association workgroups on diagnostic guidelines for Alzheimer’s disease. Alzheimer’s Dement. 2011;7:270–279. [DOI] [PMC free article] [PubMed] [Google Scholar]
- 147.Hunter CA, Kirson NY, Desai U, et al. Medical costs of Alzheimer’s disease misdiagnosis among US Medicare beneficiaries. Alzheimer’s Dement. 2015;11:887–895. [DOI] [PubMed] [Google Scholar]
- 148.Beach TG, Monsell SE, Phillips LE, Kukull W. Accuracy of the clinical diagnosis of Alzheimer disease at National Institute on Aging Alzheimer Disease Centers, 2005–2010. JNeuropathol Exp Neurol. 2012;71:266–273. [DOI] [PMC free article] [PubMed] [Google Scholar]
- 149.Guo L, Salt TE, Luong V, et al. Targeting amyloid-beta in glaucoma treatment. Proc Natl Acad Sci USA. 2007;104:13444–13449. [DOI] [PMC free article] [PubMed] [Google Scholar]
- 150.Ghiso J a, DoudevskiI, Ritch R, Rostagno A a. Alzheimer’s disease and glaucoma: mechanistic similarities and differences. J Glaucoma. 2013;22:S36–8. [DOI] [PMC free article] [PubMed] [Google Scholar]
- 151.Bayer AU, Ferrari F, Erb C. High occurrence rate of glaucoma among patients with Alzheimer’s disease. EurNeurol. 2002;47:165–168. [DOI] [PubMed] [Google Scholar]
- 152.Ramirez AI, deHoz R, Salobrar-Garcia E, et al. The role of microglia in retinal neurodegeneration: Alzheimer’s disease, Parkinson, and glaucoma. Front Aging Neurosci. 2017;9. [DOI] [PMC free article] [PubMed] [Google Scholar]
- 153.Wostyn P, Audenaert K, DeDeyn PP. Alzheimer’s disease and glaucoma: Is there a causal relationship? Br J Ophthalmol. 2009;93:1557–1559. [DOI] [PubMed] [Google Scholar]
- 154.Wostyn P, Audenaert K, DeDeyn PP. Alzheimer’s disease: Cerebral glaucoma? Med Hypotheses. 2010;74:973–977. [DOI] [PubMed] [Google Scholar]
- 155.Gupta N, Yucel YH. Glaucoma as a neurodegenerative disease. Curr Opin Ophthalmol. 2007; 18:110–114. [DOI] [PubMed] [Google Scholar]
- 156.Liu YH, Tian T. Hypothesis of optineurin as a new common risk factor in normal-tension glaucoma and Alzheimer’s disease. Med Hypotheses. 2011;77:591–592. [DOI] [PubMed] [Google Scholar]
- 157.Wostyn P Normal-tension glaucoma and Alzheimer’s disease: Hypothesis of a possible common underlying risk factor. Med Hypotheses. 2006;67:1255–1256. [DOI] [PubMed] [Google Scholar]
- 158.Kountouras J, Zavos C, Gavalas E, et al. Normal-tension glaucoma and Alzheimer’s disease: Helicobacter pylori as a possible common underlying risk factor. Med Hypotheses. 2006;68:228–229. [DOI] [PubMed] [Google Scholar]
- 159.Mendez MF, Tomsak RL, Remler B. Disorders of the visual system in Alzheimer’s disease. JClinNeuroophthalmol. 1990;10:62–69. [PubMed] [Google Scholar]
- 160.Cronin-Golomb a, Corkin S, Rizzo JF, et al. Visual dysfunction in Alzheimer’s disease: relation to normal aging. Ann Neurol. 1991;29:41–52. [DOI] [PubMed] [Google Scholar]
- 161.Kaarniranta K, Salminen A, Haapasalo A, et al. Age-related macular degeneration (AMD): Alzheimer’s disease in the eye? J Alzheimer’s Dis. 2011;24:615–631. [DOI] [PubMed] [Google Scholar]
- 162.Kanamori A, Nakamura M, Tomioka M, et al. Agreement among three types of spectral-domain optical coherent tomography instruments in measuring parapapillary retinal nerve fibre layer thickness. Br J Ophthalmol. 2012;96:832–837. [DOI] [PubMed] [Google Scholar]
- 163.Lammer J, Scholda C, Prünte C, et al. Retinal thickness and volume measurements in diabetic macular edema: a comparison of four optical coherence tomography systems. Retina. 2011;31:48–55. [DOI] [PubMed] [Google Scholar]
- 164.Windsor MA, Sun SJJ, Frick KD, et al. Estimating Public and Patient Savings From Basic Research— A Study of Optical Coherence Tomography in Managing Antiangiogenic Therapy. Am J Ophthalmol. 2018;185:115–122. [DOI] [PMC free article] [PubMed] [Google Scholar]
- 165.Mutlu U, Colijn JM, Ikram MA, et al. Association of Retinal Neurodegeneration on Optical Coherence Tomography With Dementia. JAMA Neurol. 2018. [DOI] [PMC free article] [PubMed] [Google Scholar]
- 166.Ko F, Muthy ZA, Gallacher J, et al. Association of Retinal Nerve Fiber Layer Thinning With Current and Future Cognitive Decline. JAMA Neurol. 2018. [DOI] [PMC free article] [PubMed] [Google Scholar]
- 167.Clerx L, Visser PJ, Verhey F, Aalten P. New MRI markers for alzheimer’s disease: A meta-analysis of diffusion tensor imaging and a comparison with medial temporal lobe measurements. J Alzheimer’s Dis. 2012;29:405–429. [DOI] [PubMed] [Google Scholar]
- 168.van dePolL a, Hensel a, van derFlier WM, et al. Hippocampal atrophy on MRI in frontotemporal lobar degeneration and Alzheimer’s disease. J Neurol Neurosurg Psychiatry. 2006;77:439–42. [DOI] [PMC free article] [PubMed] [Google Scholar]
- 169.Lehmann M, Koedam EL, Barnes J, et al. Visual ratings of atrophy in MCI: Prediction of conversion and relationship with CSF biomarkers. Neurobiol Aging. 2013;34:73–82. [DOI] [PubMed] [Google Scholar]
- 170.Seo EH, Park WY, ChooI H. Structural MRI and amyloid PET imaging for prediction of conversion to alzheimer’s disease in patients with mild cognitive impairment: A meta-analysis. Psychiatry Investig. 2017;14:205–215. [DOI] [PMC free article] [PubMed] [Google Scholar]
- 171.Akkus Z, Galimzianova A, Hoogi A, et al. Deep Learning for Brain MRI Segmentation: State of the Art and Future Directions. J Digit Imaging. 2017;30:449–459. [DOI] [PMC free article] [PubMed] [Google Scholar]
- 172.Li R, Zhang W, Suk H-I, et al. Deep learning based imaging data completion for improved brain disease diagnosis. Med Image Comput Comput Assist Interv. 2014;17:305–12. [DOI] [PMC free article] [PubMed] [Google Scholar]
- 173.Lee CS, Tyring AJ, Deruyter NP, et al. Deep-learning based, automated segmentation of macular edema in optical coherence tomography. Biomed Opt Express. 2017;8:3440. [DOI] [PMC free article] [PubMed] [Google Scholar]
- 174.Gargeya R, Leng T. Automated Identification of Diabetic Retinopathy Using Deep Learning. Ophthalmology. 2017;124:962–969. [DOI] [PubMed] [Google Scholar]
- 175.Esteva A, Kuprel B, Novoa RA, et al. Dermatologist-level classification of skin cancer with deep neural networks. Nature. 2017;542:115–118. [DOI] [PMC free article] [PubMed] [Google Scholar]
- 176.Gulshan V, Peng L, Coram M, et al. Development and Validation of a Deep Learning Algorithm for Detection of Diabetic Retinopathy in Retinal Fundus Photographs. JAMA. 2016;316:2402. [DOI] [PubMed] [Google Scholar]
- 177.Ting DSW, Cheung CYL, Lim G, et al. Development and validation of a deep learning system for diabetic retinopathy and related eye diseases using retinal images from multiethnic populations with diabetes. JAMA - J Am Med Assoc. 2017;318:2211–2223. [DOI] [PMC free article] [PubMed] [Google Scholar]
- 178.Armstrong S The computer will assess you now. BMJ. 2016:i5680. [DOI] [PubMed] [Google Scholar]


