
Figure 6: Difference in the choroidal thicknesses between subjects with Alzheimer’s Disease (AD) and controls.

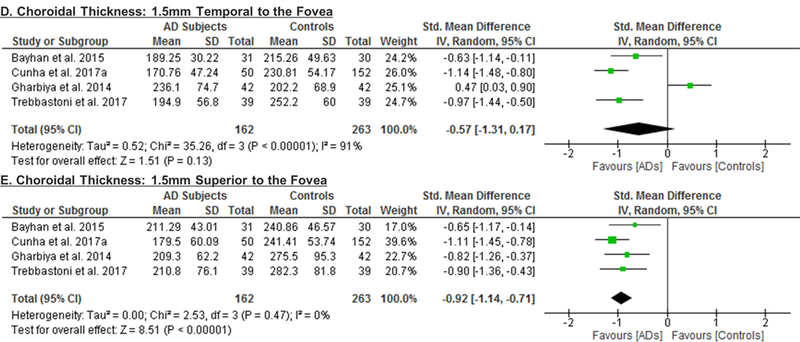
The meta-analyses were conducted with a random-effects model and unadjusted results were reported. The size of the squares denotes the weight attributed to each article, and the horizontal lines represent the 95% confidence intervals (CI). The diamonds represent the standardized mean differences with the width showing the 95% CI. Abbreviation: AD = Alzheimer’s Disease.