Abstract
WormBase (www.wormbase.org) provides the nematode research community with a centralized database for information pertaining to nematode genes and genomes. As more nematode genome sequences are becoming available and as richer data sets are published, WormBase strives to maintain updated information, displays, and services to facilitate efficient access to and understanding of the knowledge generated by the published nematode genetics literature. This chapter aims to provide an explanation of how to use basic features of WormBase, new features, and some commonly used tools and data queries. Explanations of the curated data and step-by-step instructions of how to access the data via the WormBase website and available data mining tools are provided.
Keywords: data mining, nematodes, genomics, genetics, Caenorhabditis elegans, model organism database, ontologies, user guide
1. Introduction
Since its inception in March 2000, WormBase has provided the nematode research community with an online resource for gene, genome, and other biological information about Caenorhabditis elegans and related nematodes [1,2]. WormBase offers abundant gene-centric information including gene structure models, gene homology data, gene expression data, gene-affiliated phenotypes, gene ontology annotations, and gene interactions (physical, regulatory, and genetic) as well as an anatomy ontology, a life stage ontology, human disease relevance, publication information, and C. elegans researcher information. WormBase provides its users with a number of tools including a genome browser (GBrowse and, more recently, JBrowse), BLAST/BLAT tools, an electronic PCR tool (ePCR), a genetic map browser, and a number of data mining tools including WormMine and SimpleMine.
This chapter serves as a user guide to the current version of WormBase (WS257 release, April 2017 at the time of writing) but should remain a relevant reference for years to come. Briefly, the chapter will begin by providing guidance on the basic mechanics of using the WormBase website, followed by an explanation of how to access genomic data for the multitude of nematode species now supported by WormBase, including how to use the available genome browsers. This is followed by a discussion of homology data, at the level of genomes, genes, and proteins and then an explanation of ontologies at WormBase, specifically how to use the Ontology Browser tool and how to navigate Gene Ontology data. The chapter then explores gene expression data, both small-scale and large-scale, and how to access it via gene report pages as well as via tools such as SPELL. Next is a discussion of how to access and interpret gene interaction data in WormBase, for physical, genetic, and regulatory interactions, followed by an explanation of phenotype data and where to find it. Reagents such as strains, transgenes, and RNAi clones are then reviewed followed by a discussion of integrated data views such as human disease models in nematodes and anatomy function data. After this is a review of the data mining tool WormMine, the WormBase instance of the Intermine biological data warehouse, a summary of the many data files available via the FTP site, and basic instructions for use of the WormBase RESTful API. Other available tools are then discussed, including BLAST/BLAT, the SimpleMine gene batch query tool, a new gene set enrichment analysis tool, and a description of our community annotation forms. We then close the chapter with a brief discussion of community resources, highlighting the many ways users can keep updated on WormBase and community activities.
2. The WormBase Website
The WormBase website provides quick and convenient access to the most important information for conducting research using C. elegans as a model system. The site presents a wide array of data both curated from the scientific literature and submitted to the consortium directly by users. These data range from whole genome sequences of C. elegans and a number of related nematodes and genomic-scale datasets down to the sequence of individual variations. Gene function and perturbation, expression, anatomy, phenotypes, literature, and researcher history and more are all directly accessible from a single search of the site.
2.1. The Home Page
The WormBase home page provides quick access to the most popular elements of the site, information about upcoming meetings, and quick glances of the WormBase forums. Figure 1 outlines the primary features of the WormBase home page.
Figure 1.
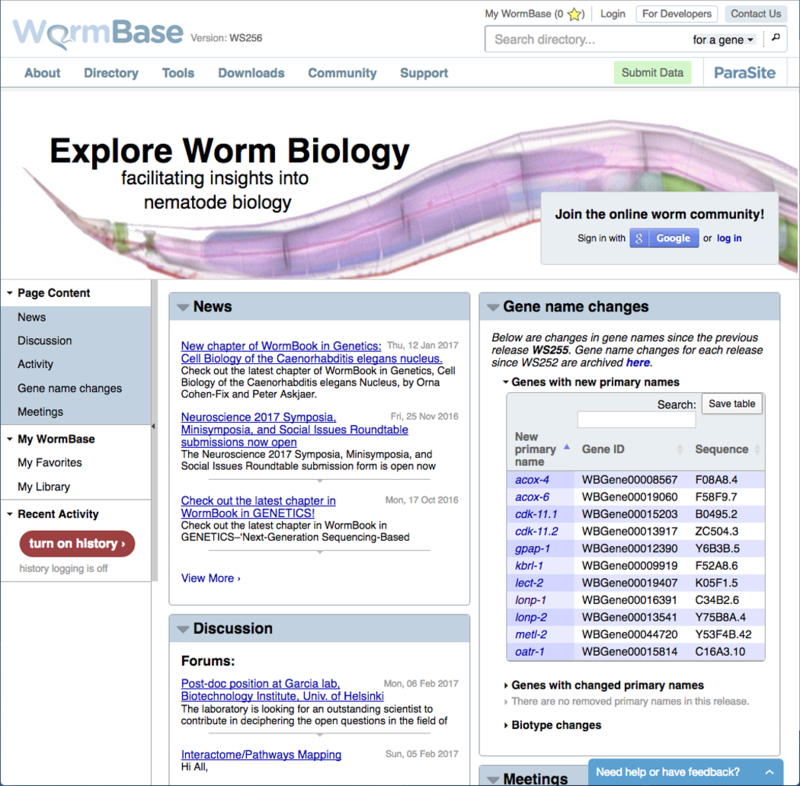
The core elements of the WormBase home page. Each page on WormBase consists of three core areas. At the top of the page is a main navigation bar. On the left hand side of the page is a page-specific navigation bar that controls the content displayed on a per-class basis. The majority of each page consists of the main view area where content specific to that page is displayed.
The home page is illustrative of the organization of all pages across the site. The main navigation bar (across the top of any WormBase page) contains a class-specific and global search field (discussed below) and a series of drop down menus. The “About” menu provides links to the WormBase mission statement and frequently asked questions (FAQs), as well as to lists of our advisory board members and staff. The “Directory” menu provides links to basic and advanced search, to the genome browser for various nematode species, to resources such as external databases and methods sites, as well as to the WormBase schema, tree display and our “Submit Data” page. The “Tools” menu provides links to our commonly used tools such as GBrowse, BLAST/BLAT, electronic PCR (ePCR) search, genetic map, SPELL, and the WormBase ontology browser as well as links to data mining and batch query tools like WormMine, SimpleMine, and a gene set enrichment analysis tool. The “Downloads” menu provides links to download genomic and protein FASTA files as well as genomic annotation (GFF) files for all available species, and a link to the WormBase FTP site. The “Community” menu links to meeting information, the worm community forum, a “Submit Data” page, and to many other resources for the C. elegans and nematode research community. The “Support” menu links to a user guide, nomenclature explanation, FAQs, how-to videos and documentation for developers.
Underneath the main navigation bar, users will find a vertical navigation bar situated on the left hand side of the screen and a main view area to the right. This left side navigation bar controls the content that is displayed on the page in self-contained panels, or “widgets”. This includes page-specific content widgets such as “Overview” and “Sequences”, and “Tools” such as aligners and model browsers.
2.2. Logging in to WormBase
WormBase allows users to log in to the site to track browsing history, save favorite objects, and create rudimentary literature libraries. To log in to the site, visit the Login link in the main navigation bar (Fig. 2). We have adopted standard practice that authenticates users with their Facebook or Google accounts. When we do this, we request access to your profile, storing only your publicly provided name and email, if they have been provided. This allows us to identify you personally on the website and nothing more. No additional information is sent to either Google or Facebook.
Figure 2.
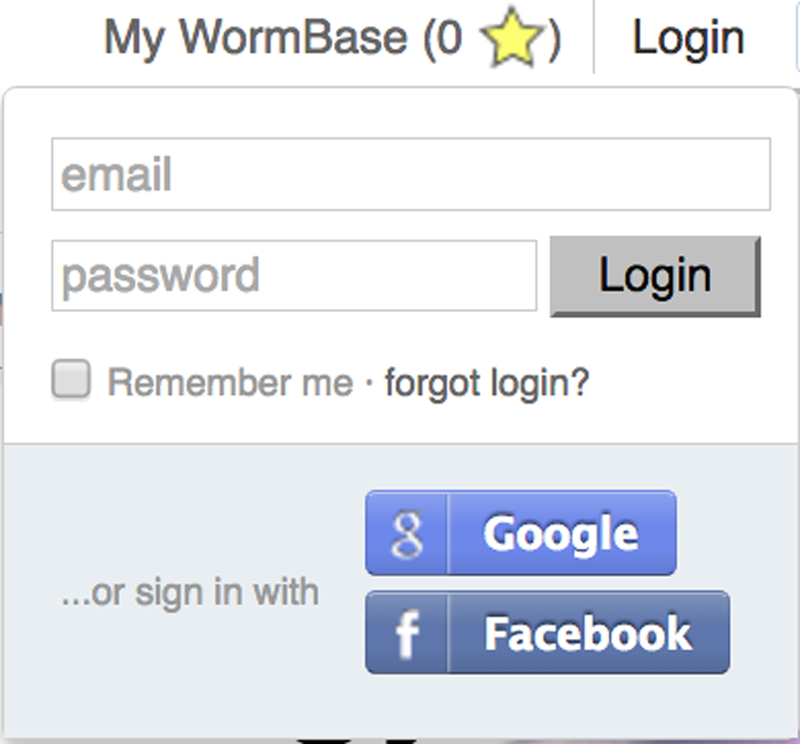
Logging in to WormBase. From the main navigation bar, click “Login”. Once you have authenticated using Google or Facebook, the navigation bar will change to read “Welcome (Your Name)” to notify you that you are logged in.
Once a user is logged in, three new features become available on the site: “My Favorites”, “My Library”, and “My History”. First, by clicking on stars shown on every report page and in various search displays (Fig. 3), users can save often-accessed objects for quick subsequent access. Favorite objects are displayed on the “My WormBase” page (Fig. 4). Second, users can “star” literature references in a manner similar to favorites — by clicking on stars next to literature titles. These favorite references will be displayed in the “My Library” section on the “My WormBase” report page (Fig. 4, bottom). The third feature, recorded browsing history, is an opt-in only feature. To enable, log-in to the site. On the home page, in the “Activity” widget, look for a button reading “Turn On History”. Once enabled you will see not only your browsing history on the site, but also items popularly saved across all users that have opted in. Your browsing history and saving preferences will also be included in this history.
Figure 3.
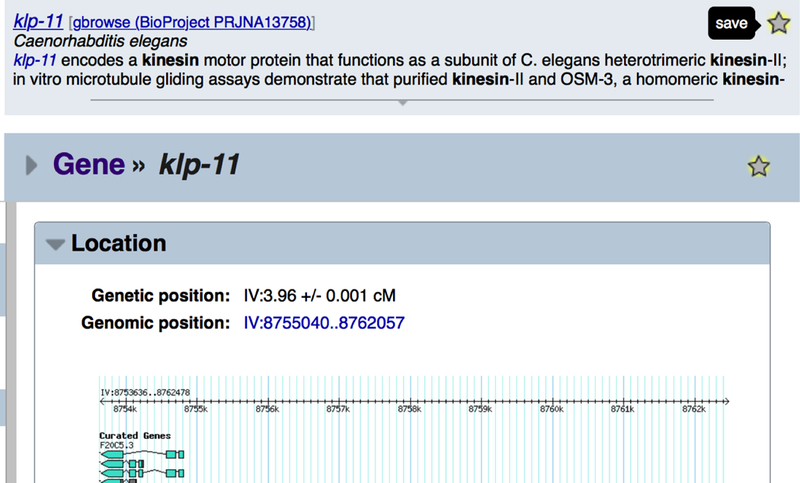
Add items to your list of favorites by clicking on stars found in search results (top) and on report pages (bottom). You can remove an item from your favorites by clicking on the highlighted star.
Figure 4.
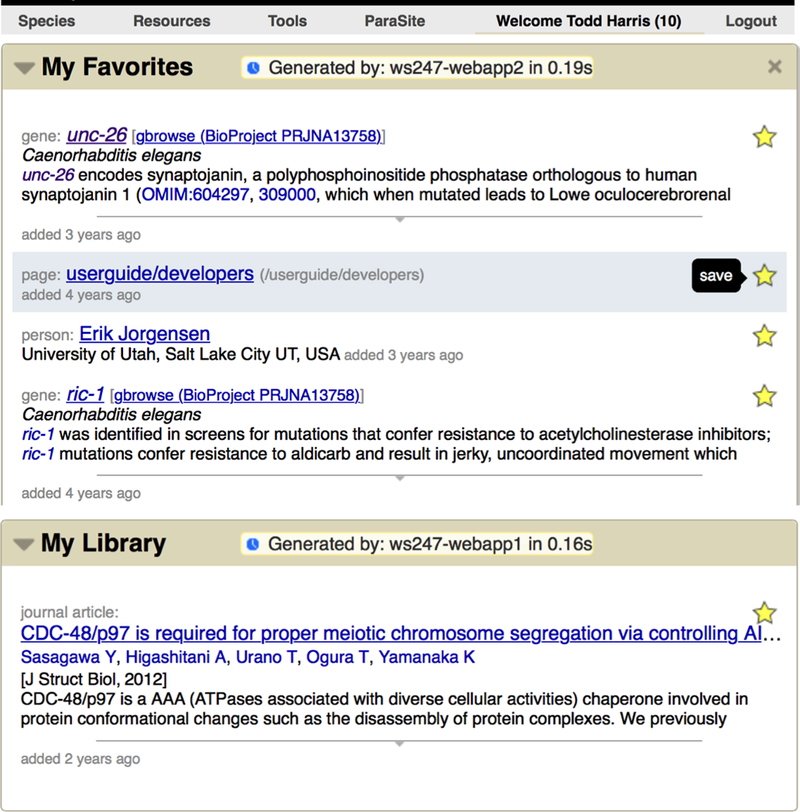
Once logged in, click on “Welcome (Your Name)” in the main navigation bar located on every page (top) to visit your profile page. From there, you will find items you have favorited (middle) and your library of saved references (bottom).
2.3. Basic Searches
Basic searches are available from the main navigation bar presented at the top right hand side across the site (Fig. 5). By default, searches are constrained to the gene class. We do this for two reasons. First, the gene report pages are informationally rich, very popular landing pages, containing a great number of crosslinks to other data types. Thus, they act as important portals into the data contained in WormBase. Second, we wish to provide suitable performance and quick access to what most users are searching for. If you would like to change this behavior, simply select the desired class from the drop down menu as shown in Figure 5. To search for additional data classes, leave the search box empty and click on the magnifying glass icon to the right and select from the list of data classes on the subsequent page.
Figure 5.
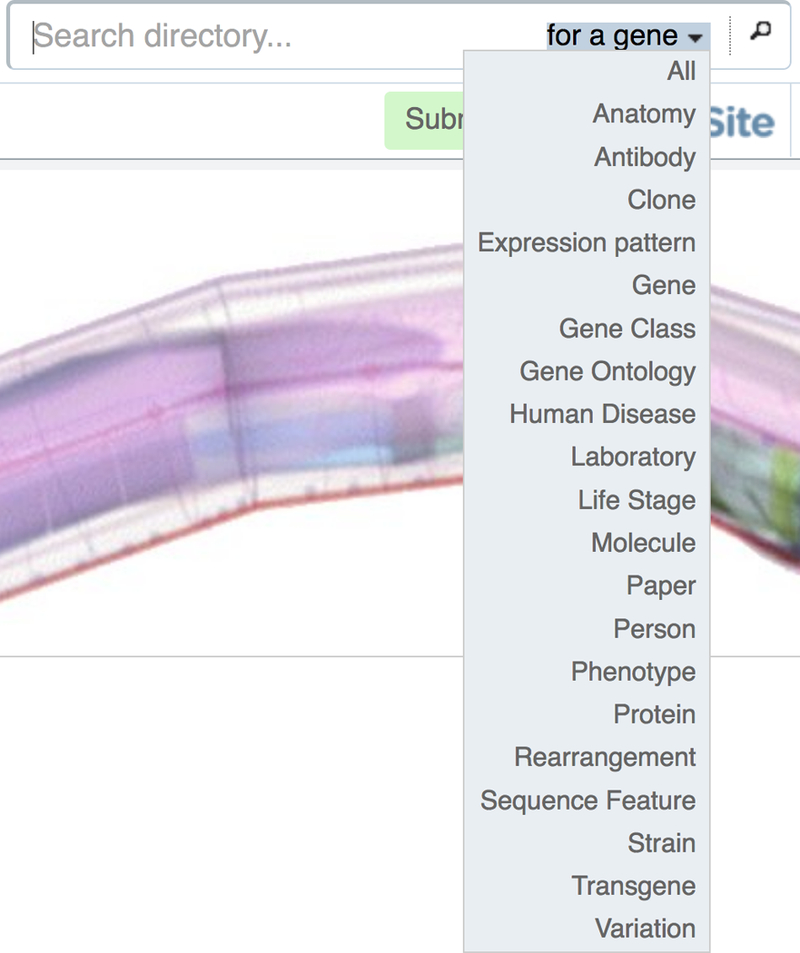
Basic and global searches of WormBase are available from the top of every page. By default, the search is constrained to genes. This can be changed by selecting from available classes via the embedded drop down menu, or by choosing “All” to search the entire database.
The search accepts a wide range of queries. Users can search for simple things like gene or sequence names (e.g. “lin-29”; “JC8.10a”), types of gene products (e.g. “kinesin”), or even related items associated with the item of interest (e.g. such as finding genes by searching with variation names of a given gene, like “e205”).
If a search returns a single hit, users will be taken directly to the report page for that item. If multiple hits are returned, a disambiguation display allows one to select from search results, to download results, or to further constrain your search by class or species through a faceted results display. In the list view of results, we present multiple options for each result. For example, searches that result in gene hits show links to the gene report page, but also directly to the genome browser view (Fig. 6).
Figure 6.

The search results disambiguation screen showing several features of note. First, on the left hand side, you will find faceted results, broken down by class and species. Second, users may download search results in a variety of formats. In the main view, search results provide quick links that are class-specific. For example, genes (as shown here) provide direct links to gene report pages or to the genome browser. Search results can be directly added to your favorites list from this display too.
2.4. Report Pages
Report pages are consistently structured across the site. On the left-hand side of the page is the vertically oriented navigation bar that controls which content is displayed. The main viewport for content is located on the right hand side. There are report pages for most data classes in WormBase, such as genes, proteins, anatomy terms, researchers, strains, transgenes, publications, and genetic variations.
2.4.1. Controlling the Display of Widgets
The left side navigation bar allows users to enable or disable specific widgets or turn on analysis tools specific to the type of data currently displayed (Fig. 7). If a widget is already open, clicking on its name in the left side navigation bar will scroll the display to the location of that widget. If it isn’t open, it will be opened and the view scrolled to that widget, providing a convenient mechanism to find content if you have many widgets open.
Figure 7.

The report page left side navigation bar. This navigation bar contains titles of available widgets that can be enabled or disabled on a per-class (e.g. gene) basis. Clicking on a widget title will open it if it isn’t already opened and scroll the view to that widget. If it is already opened, the view will scroll to that position, an easy way to find a widget if you have many open. The navigation bar is subdivided into various sections including the primary widgets at the top, “Tools” for interacting with the current data, shortcuts to “My WormBase” and your “Recent Activity” on the site.
2.4.2. Customizing Page Display
Every report page can be individually customized to suit user preferences. These preferences will persist from other pages of the same class (e.g. gene). Thus, it is possible to create a sequence-oriented view of genes, or an anatomy-oriented view of expression data. Available layouts are specified from the drop down “layout” menu at the top of the left side navigation bar (Fig. 8).
Figure 8.
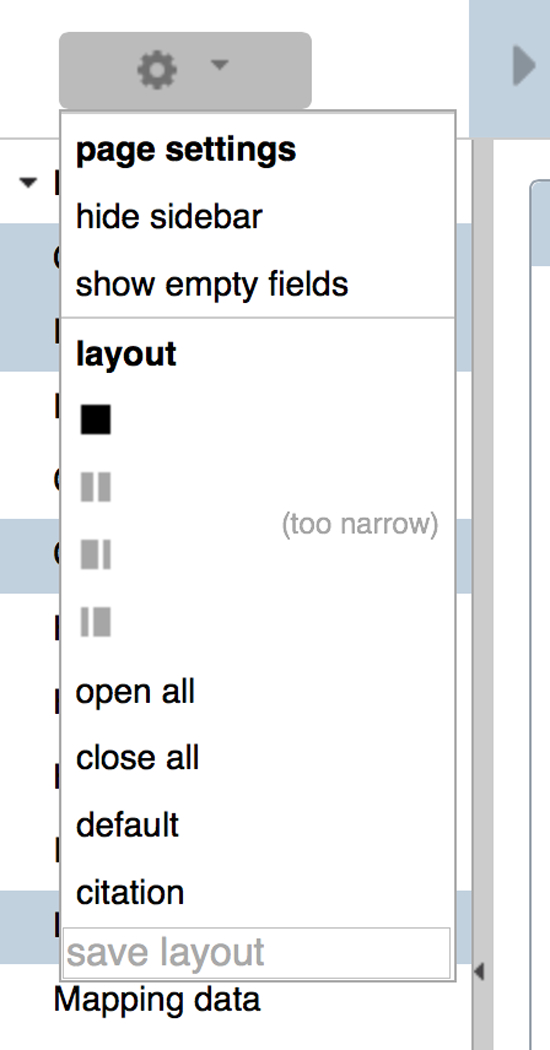
The “layout” dropdown menu provides options for controlling the appearance of the main view of a report page. Users can select, for example, a single column, two columns of even width, or two columns of varying width. This menu also provides options for quickly opening or closing all widgets.
The display of report pages can be customized in additional ways besides enabling specific widgets, for example by setting a one- or two- column layout (Fig. 9). The order of widgets can be specified by dragging-and-dropping widgets to a specific position on the page. Selections will persist from one report page to the next. Instead of enabling or disabling widgets, clicking on the disclosure triangle will collapse the widget to a single title bar, temporarily minimizing it to reduce visual clutter (Fig. 10). To dismiss a widget altogether, simply click on the “X” that appears at the upper right corner of the widget when hovering the cursor over it or click on the “X” to the left of the widget name in the left side navigation bar. The widget can be re-enabled at any time from the left side navigation bar.
Figure 9.
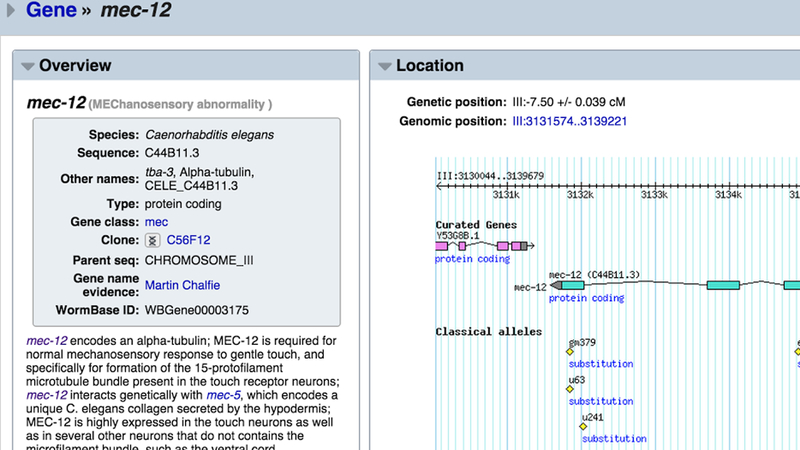
Customizing the view of a gene report page. Here, a two-column layout makes it easy to compare the “Overview” and “Location” widgets side-by-side. Preferences will be saved and used from one report page to the next.
Figure 10.
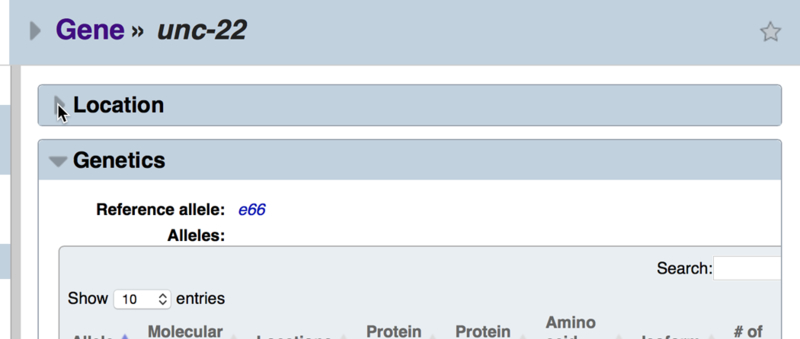
Widget contents can be collapsed to a single title bar view to quickly hide their contents. Simply click on the disclosure triangle to open or close as necessary.
2.4.3. Working with Tabular Data
Much of the data at WormBase is presented in a tabular format. We have standardized the display of tables with many features that make it easy to sort, search, and download data. For example, every table can be searched for its contents or sorted in ascending or descending order on any column (Fig. 11).
Figure 11.

Working with tables. Tables can be sorted in ascending or descending order on any column, constrained by a search, or downloaded in any number of file formats. Here, we have filtered the mec-12 alleles table by “Missense” and then sorted the table by the position of the mutation. This makes it easy to quickly see the location of variations in relation to their position in the predicted conceptually translated protein isoform as a way to find mutations that may map to specific functional domains.
3. Genomic Data
3.1. The C. elegans Reference Genome
C. elegans was the first metazoan to have its genome completely sequenced [3], and since then the genome sequence has been subject to active curation and improvement. In the early days of the project, updates were frequent and consequently a new version of the genome appeared in every WormBase release. When needing to refer to a specific version of the reference genome, it was therefore sufficient (and convenient) to use the WormBase release number that the genome was taken from (e.g. WS118). In recent years however, the reference genome has stabilized, and is updated infrequently. The same version of the reference sequence often persists for many WormBase releases. In acknowledgement of this, in 2010 WormBase began assigning official names to new versions of the reference sequence itself, distinct from WormBase release names. When we submit an updated reference sequence to the International Nucleotide Sequence Database Collaboration (INSDC) [4], care is taken to label it with this version name, such that users should be able to obtain the genome from WormBase or the INSDC and know exactly what version they are using. This has not always been the case (see Table 1).
Table 1.
Selected versions of the C.elegans reference genome
| Genome release date |
WormBase releases |
WormBase assembly name |
INSDC assembly name |
UCSC assembly name |
|---|---|---|---|---|
| Mar 2004 | WS120-WS122 | - | - | WS120 / ce2 |
| May 2005 |
WS142-WS145 | - | WS144 | - |
| Dec 2006 | WS169-WS176 | - | - | WS170 / ce4 |
| Aug 2007 | WS180-WS185 | - | - | - |
| Mar 2008 | WS189-WS193 | - | WS190 | WS190 / ce6 |
| Sep 2008 | WS194-WS196 | - | WS195 | - |
| Apr 2009 | WS202-WS214 | - | - | WS210 / ce8 |
| May 2010 |
WS215-WS234 | WBcel215 | WS215 | WS220 / ce10 |
| Nov 2012 | WS235-date | WBcel235 | WBcel235 | WBcel235 / ce11 |
The recent history of the reference genome can also be viewed at WormBase on the “Genome Assemblies” widget of the C. elegans landing page (http://www.wormbase.org/species/c_elegans#03--10).
A table with links to recent versions of the genome can be viewed in the “Genome Assemblies” widget of the C. elegans landing page (http://www.wormbase.org/species/c_elegans). The table provides a link to the file containing the reference genome sequence. Most users however obtain the genome sequence from our FTP site, which also includes a version of the sequence in which the repetitive regions have been masked (see Subheading 11.2).
3.2. Genes, CDSs, Transcripts and Proteins
WormBase annotates the reference genome with a variety of different types of feature, via a combination of analysis pipelines and data integration from both large and small scale studies. These features include sites associated with transcription (transcription initiation and termination sites, cis and trans splice sites), repetitive regions (including transposable elements), regulatory regions (enhancers, silencers, promoters, transcription-factor binding sites), and regions/sites that vary from the reference in mutant or wild isolate strains of C. elegans.
The most widely used annotations we produce are gene models, which are the exon/intron structures of transcribed regions. For protein-coding genes in particular, we initially manually annotate the coding sequence (CDS), which is the part of the transcript that is translated. Full-length transcript structures are created by software that extends the curated CDSs using alignments of transcriptome data (ESTs, cDNAs, and RNA-Seq reads), and other evidence (e.g. experimentally confirmed trans-splice sites, transcription initiation and termination sites). Identifiers are assigned to CDSs and full-length transcripts according to strict nomenclature (Fig. 12).
Figure 12.
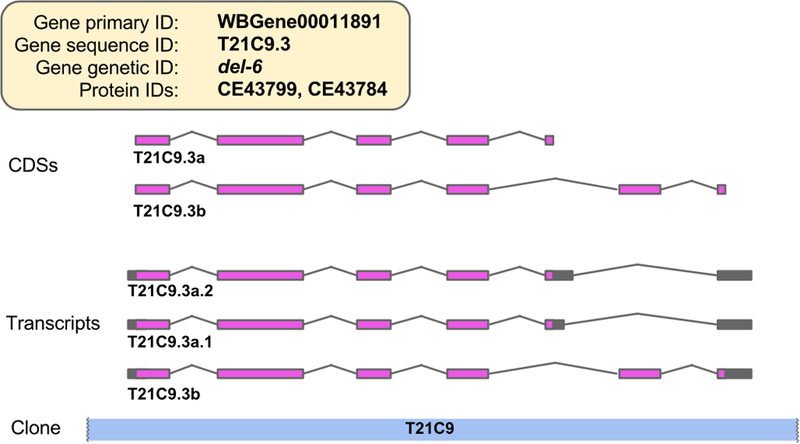
The C. elegans del-6 gene locus, showing curated CDS structures, and the predicted full-length transcript structures. The various different types of identifier associated with the gene and its transcripts are shown. Initially, a new protein-coding gene model comprises a single CDS, and that CDS is assigned a CDS sequence identifier to match the sequence identifier of the gene to which it belongs. If there is evidence for one or more additional isoforms of a CDS at a locus, then they are distinguished by giving them letters after their name. By default, the predicted full-length transcript structure is given the same sequence identifier as the curated CDS that it extends. However, if there is evidence for alternative splicing in the 5’ or 3’ untranslated region (UTR) of the transcript, then multiple full-length transcripts sharing the same CDS are created. These transcript isoforms are distinguished by the addition of a dot and numbers after the sequence name of the CDS.
The CDS, transcript, and protein sequences associated with a gene can be viewed and downloaded from the “Sequences” widget of the gene report page (Fig. 13). Obtaining sequences for many genes at once can be achieved through our FTP site (section 11.2) or via the WormBase ParaSite BioMart tool (available under the “Tools” menu).
Figure 13.
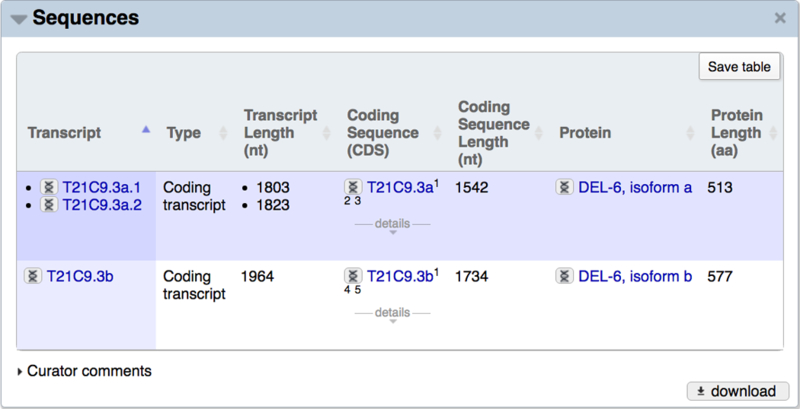
The sequences widget from the del-6 gene report page. The identifier for each CDS, transcript, and protein is hyperlinked to a page describing more information about that entity, and clicking on the double helix icon to the left of any identifier gives rise to a context-specific pop-up window showing the sequence. For example, for transcript sequences in particular, the pop-up shows spliced and unspliced sequences, with color-coding used to highlight the exonic regions.
3.3. The Genome Browser
Genome browsers at WormBase are among the most heavily used features of the web site. The older genome browser was originally designed for WormBase and later became GBrowse [5], a part of the Generic Model Organism Database project (GMOD, http://www.gmod.org/). It has reached end of life and is no longer being actively developed, so a new genome browser, JBrowse [6] has been chosen to take its place. JBrowse, also a GMOD software project, is in use at hundreds of sites worldwide. Since JBrowse is written entirely in JavaScript and is executed in the web browser rather than on a server, it provides a very fast and fluid interface for users. While GBrowse is still available at WormBase, all future genome browser development at WormBase will be devoted to JBrowse.
To access a genome browser, mouse over “Tools” and from the drop down, select either “GBrowse” or “JBrowse” from the menu. Alternatively, many report pages contain inline images of discrete genomic regions. Clicking on these will open the genome browser with the same coordinates of the image. From the genome browser, one can navigate to different regions by searching for coordinates or feature names. For example, when browsing the C. elegans genome, searching using the format chromosome:start..stop will open a view of the genome corresponding to the chromosome with a width of the start to the stop.
For users already familiar with GBrowse, the user interface of JBrowse will look familiar, with buttons for zooming and panning, as well as a search field and a menu for switching genomes (see Figs. 14A and14B). One advantage JBrowse has compared to GBrowse is the visualization of the tracks themselves: the data tracks take up the majority of the web page, optionally using the full width of the screen, giving users the option of a large work space to view their data. The WormBase instance of JBrowse provides two methods for selecting tracks. The default method is via a list of track names, organized by category, on the left side of the page. When the user initially loads this page, there are approximately 65 tracks available in C. elegans, with over 1200 more tracks in a “collapsed” set of tracks from modENCODE [7]. Since finding specific tracks in such a large set can be a daunting task, JBrowse also provides a “track selector” button to switch to a faceted track selector, where a track list is available by clicking on a tab in the upper left corner of the page and a drawer with all of the tracks available slides out from the left side of the page. In Figure 14B, the pull out tab for JBrowse track selection is shown. The tracks can be selected en masse by category or the descriptions of the tracks can be searched to help narrow down the list. When using the faceted track selector, the list of checkboxes on the left is removed, and the track data can fill the full width of the screen.
Figure 14.
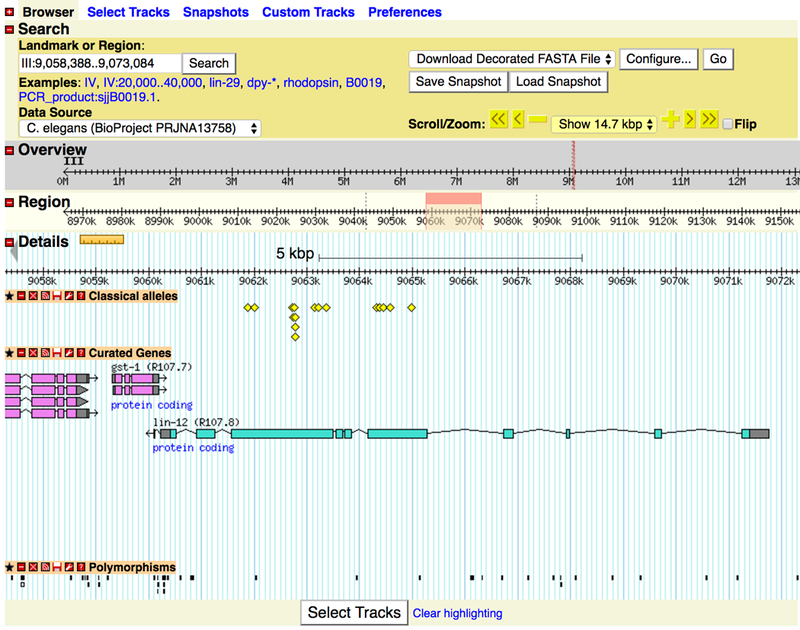
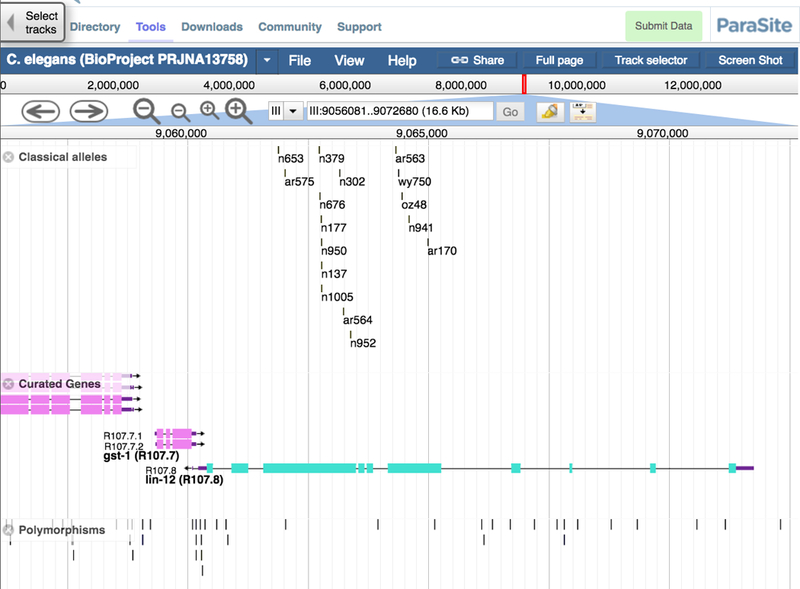
(A) The graphical user interface of GBrowse showing the “Classical alleles”, “Curated Genes” and “Polymorphism” tracks for C. elegans chromosome III (lin-12 locus) (B) The graphical user interface of the same data in JBrowse.
JBrowse allows users to incorporate their own data so that it can be visualised alongside WormBase data. Users are not required to upload their data to render it; instead, users can supply either a local file or a URL specifying the location of a remote data file, and JBrowse will render the data by processing it locally. This is made possible due to the “in browser” execution of JBrowse; all of the software to process the data and display it is included in the JavaScript that is downloaded when the user first goes to a JBrowse page.
JBrowse has the ability to make high resolution screenshots. When the “Screen Shot” button is clicked, users are presented with a dialog box that lets them modify the view that will be imaged, for instance removing navigation or track selection portions of the page, as well as letting users specify options specific for each track, like the height of the track or placement of axes for quantitative tracks. Also the type of image (png, jpeg or pdf) as well as the size and resolution can be specified.
4. Comparative Genomics
4.1. Other Nematode Genomes
WormBase contains genomic data from many nematode species beyond C. elegans (http://www.wormbase.org/species/all). The genomes of some species are deeply integrated into WormBase and treated in a similar manner to C. elegans, with manual curation of transcript structures, assignment of WormBase identifiers to genes and other sequence features, systematic tracking of changes and maintenance of a full change history. We refer to these as WormBase “core” species. Historically, the set of core species was restricted to close relatives of C. elegans. Recently however, we have also added the genomes of selected parasitic nematodes to the core set.
Outside of the core species, WormBase imports other nematode genomes from the INSDC, or from direct submission, and provides a genome browser with annotation tracks displaying data provided by the authors (either via annotations on the INSDC records themselves, or by direct GFF3 submission to WormBase). We do not curate or assign WormBase identifiers to the annotations for these non-core species, but display them exactly as submitted/published. The original authors maintain ownership of the reference sequence and annotation for these genomes. When we become aware of a new genome, or an update to a genome we already have, we endeavor to incorporate the data into WormBase as quickly as possible. Selected genomes of particular relevance to the study of C. elegans are made available via the main WormBase website. The complete set of all nematode genomes (as well as platyhelminth genomes) can be found in our sister resource, WormBase ParaSite (see other chapter in this issue).
4.2. Protein-level Homology and Domains
We align reference protein sets from a variety of organisms to both nematode protein sequences (protein-to-protein alignments) and nematode genome sequences (protein-to-genome alignments), using BLAST+ [8,9]. The protein-to-genome alignments can be visualised on the genome browser (via the “Sequence Similarity”/ “Proteins” track group), and the protein-to-protein results can be viewed in the Homology section on the protein and gene report pages of the website.
Another view of the protein similarity data is the “Protein Aligner” widget accessible from the protein report pages. This is a global multiple alignment of the protein of interest with the closest similar protein from each other species (by p-value), using MUSCLE [10]. The alignments are precalculated and colored in a way to reveal common properties conserved between the proteins.
While conserved regions of proteins can be apparent from viewing the color-coded protein alignments directly, a more sensitive fine-grained view of protein evolution can be achieved by considering that proteins comprise conserved domains. WormBase annotates each protein with its domain architecture using InterProScan [11]. This applies a number of established resources and tools for domain annotation and additionally integrates the results into higher-level InterPro domain annotations. Because each InterPro entry has associated functional annotation (both textual, and by using terms from the Gene Ontology [12]), InterPro domain analysis thus provides automatic functional annotation for gene products. Gene Ontology annotations from InterProScan can be seen on the “Gene Ontology” widget of the gene report pages, alongside manually curated annotations (see Subheading 5.2 on Gene Ontology). In addition to the InterPro annotations, we also show active site annotations imported from Pfam [13], as well as phosphorylation sites based on submitted mass-spectrometry data. Functionally-annotated clusters of related proteins made by the eggNOG project [14] are included in WormBase and shown in the “Homology Groups” section of the “Homology” widget of protein report pages.
4.3. Gene-level Homology - Orthologs and Paralogs
WormBase stores and displays orthologous and paralogous relationships between pairs of genes, integrating data from a variety of resources and methods. Orthologs and paralogs can be seen in the respective ortholog and paralog sections of the “Homology” widget on gene report pages, and can be downloaded as tables. The “Method” column of the table shows the methods and resources that defined the relationship. This is an important feature as orthology predictions are very dependent on the underlying gene/protein sequences and algorithms used. Combining the results of multiple methods provides the user with an estimate of the prediction quality (i.e. orthologies predicted by multiple methods can be seen as being more reliable). Following the “Method” link provides more information about the method, including database versions used, as well as papers and who conducted the analysis. For WormBase genes included in TreeFam [15], an interactive TreeFam tree is shown.
As part of the preparation for each release, WormBase deploys the EnsemblCompara [16] software to compute orthologs and paralogs using the current WormBase protein set, and the most complete set of nematode proteomes. This is in contrast to the other imported sources of orthology which are based on snapshots of the proteome taken at some point in the past.
5. Ontologies at WormBase
5.1. The WormBase Ontology Browser
WormBase extensively uses the C. elegans Anatomy Ontology, Human Disease Ontology, Gene Ontology, Life Stage Ontology, and Phenotype Ontology to annotate genes [17–20]. Because these ontologies consist of sets of terms that are hierarchically related to each other, it is useful and convenient to peruse them graphically. Thus, we provide three standard graphical views for each ontology: a stand-alone hierarchy browser (Fig. 15A) that allows top-down, layer-by-layer expanded viewing of the whole ontology, a graph viewer (Fig. 15B) that illustrates a focus term and its related terms in the graph form, and an inference tree viewer (Fig. 15C) which also shows focus term relationships but in a tree form.
Figure 15.
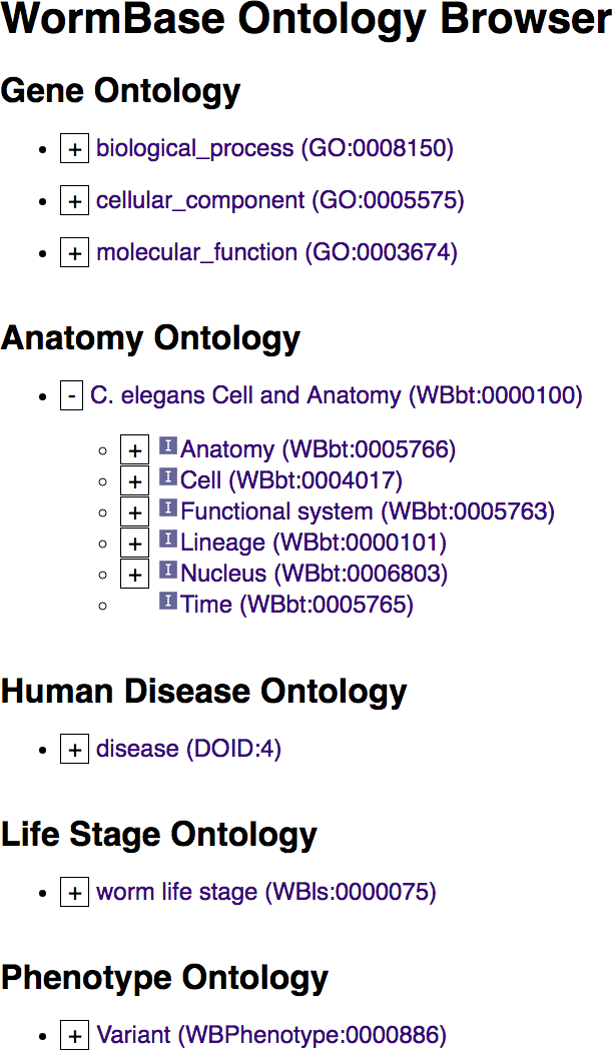

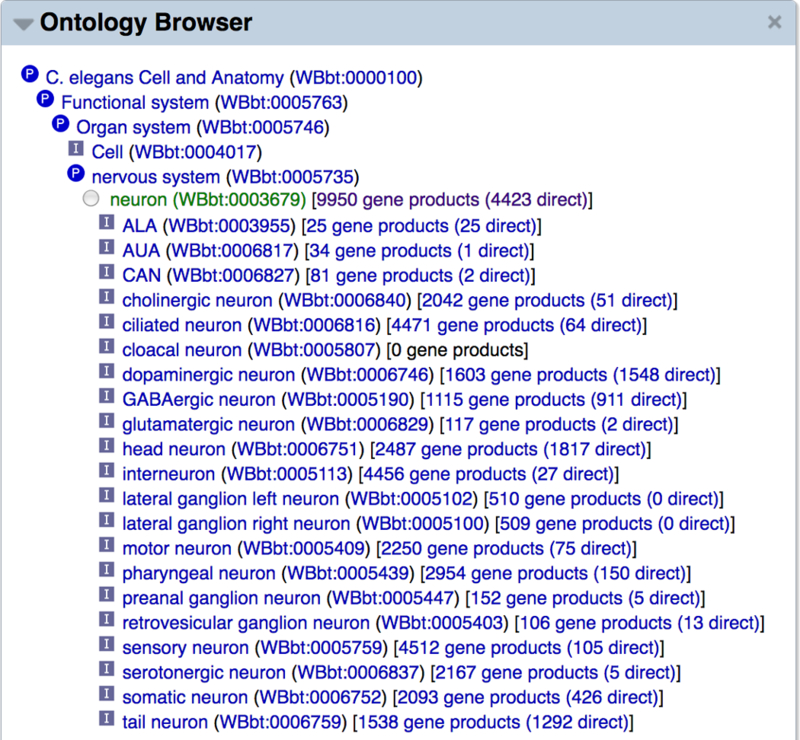
Example views of the WormBase Ontology Browser (WOBr). (A) The hierarchy browser, (B) graph view for the anatomy term “neuron”, and (C) inference tree view for the “neuron” term.
The expandable hierarchy browser (WormBase Ontology Browser or “WOBr”) is accessible as a standalone tool from the WormBase “Tools” menu, and allows root-to-leaf drill down browsing of ontologies’ directed graphs. Each term is a node and branch nodes can be toggled to expand or collapse with a click. The graph viewer is in the “Ontology Browser” widget on each ontology term page, which shows as a comprehensive ontology subgraph all relationships connecting the focus term to ontology roots. There is also an inset that provides quick access to sibling terms of the focus term. The inference tree viewer provides a summary of the focus term’s direct relationship with its “child” terms and inferable relationships with its “ancestors” via chains of transitive relationships, up the hierarchy to root terms. We use information in annotation files, combined with inferred relationships, to provide quick access to lists of genes directly, and by inference, annotated with the focus term. We further make use of the available information to provide results of “pre-canned” complex queries. For example, some users are interested in knowing what genes may be specifically expressed in a specific tissue; and it would require several simple queries and steps to combine the results to answer this question. WormBase precomputes a list of genes that may be specifically expressed in a cell or tissue and displays the results at the bottom of the “Ontology Browser” widget on the anatomy term page (for example, see the “neuron” anatomy term report page: http://www.wormbase.org/species/all/anatomy_term/WBbt:0003679#03−−10).
5.2. Gene Ontology Data at WormBase
The Gene Ontology (GO) is a controlled vocabulary designed to describe three central aspects of gene function: 1) the Biological Processes (BP) in which a gene product is involved; 2) the Molecular Function (MF) that is enabled by a gene product; and 3) the Cellular Component (CC), or subcellular location, where that function occurs [17].
In the GO, biological concepts are represented by GO “terms” that consist of a term name, textual definition describing the meaning of the term, and a unique, numerical identifier. Additional GO term information may include, for example, synonyms or free-text comments on term usage. Within the GO, terms are related to one another via specific parent-child relationships. These relations include, but are not limited to, is_a, e.g. “plasma membrane” is_a “membrane”; part_of , e.g. the “nuclear envelope” is part_of the “nucleus”; and regulates, e.g. “regulation of G1/S transition of mitotic cell cycle” regulates the “G1/S transition of mitotic cell cycle”. This formal representation of biological knowledge allows not only for a standardized view of gene function, but also for computational reasoning that forms one of the cornerstones of gene set analysis.
5.2.1. Gene Ontology Annotations in WormBase
GO annotations are associations between GO terms and WormBase genes. Although derived from a number of different curation pipelines, the basic GO annotation consists of a GO term, an evidence code indicating the type of experiment or analysis used to make the association, and a reference in which the primary data, or details about the experiment or analysis, may be found. Additional annotation fields may include evidence code-specific details, such as the interacting partner for an annotation inferred from a genetic interaction, annotation qualifiers such as “contributes_to”, which is used, for example, to describe the role of non-catalytic members of multi-subunit enzymes, and annotation extensions that provide additional contextual information such as the cell or tissue type in which a BP or MF occurs [21].
5.2.2. Annotations on Individual Gene Report Pages
On the WormBase gene report pages, GO annotations are visible under the “Gene Ontology” widget (Fig. 16). Annotations are listed in three separate tables, one for each branch of the ontology. Two display options are available. The default, “Summary view” provides a basic annotation display showing which GO terms have been associated with the gene and, if present, annotation extensions that provide specific contextual information for a term. The “Full view” (Fig. 17) additionally shows the evidence code used for the association, evidence code-specific details (also known as the “With” or “From” column), and a details menu that when opened lists the date on which the annotation was last updated, a brief citation and link for the associated reference, and the database that contributed the annotation to WormBase. A summary of the evidence codes used for GO curation at WormBase and the additional information associated with them is presented in Table 2. Table 3 lists the types of annotation extensions used for WormBase GO annotations and some examples of how they serve to qualify the respective GO term.
Figure 16.
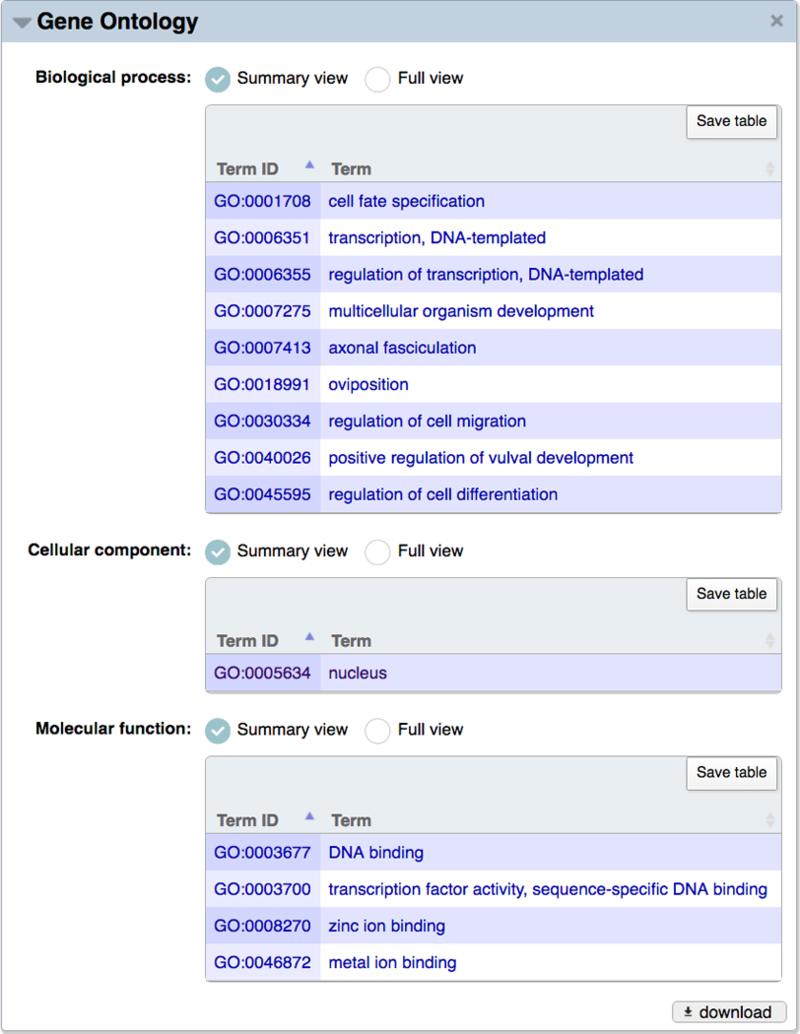
Summary view of Gene Ontology data for the lin-11 gene. The summary view displays GO IDs and term names from the three GO branches (BP, CC, and MF) annotated to lin-11. Depending upon experimental data, or the method used to create the annotation, a gene may be associated with GO terms of differing granularity, e.g. GO:0003677 DNA binding and GO:0003700, transcription factor activity, sequence-specific DNA binding.
Figure 17.
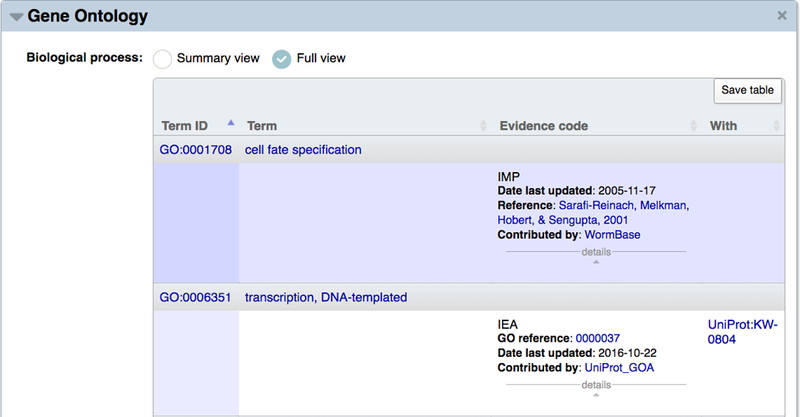
Full view of Gene Ontology data for representative BP annotations to lin-11. The full view displays GO IDs, term names, three-letter evidence codes, the date the annotation was last updated, the associated reference, contributing annotation group, and additional supporting information in the “With” column.
Table 2.
Gene Ontology evidence codes used in WormBase GO annotations
| Evidence | Three-Letter Code | Supporting Information |
|---|---|---|
| Inferred from Mutant Phenotype | IMP | Variations, RNAi Experiments, Phenotypes |
| Inferred from Genetic Interaction | IGI | Genes |
| Inferred from Physical Interaction | IPI | Genes, Proteins |
| Inferred from Direct Assay | IDA | na |
| Inferred from Sequence or Structural Similarity | ISS | Genes, Proteins |
| Inferred from Expression Pattern | IEP | na |
| Inferred from Curator | IC | GO term IDs |
| Inferred from Sequence Model | ISM | na |
| Inferred from Biological aspect of Ancestor | IBA | Panther Tree Nodes1 |
| Inferred from Key Residues | IKR | Panther Tree Nodes1 |
| Traceable Author Statement | TAS | na |
| Nontraceable Author Statement | NAS | na |
| No biological Data available | ND | na |
| Inferred from Electronic Annotation | IEA | InterPro entries2,3, UniProtKB Keywords3, UniProtKB Subcellular Localization3 |
Table 3.
Representative annotation extensions for WormBase GO annotations
| Gene | GO Term | Annotation Extension | Type of Contextual Information |
|---|---|---|---|
| mom-4 | protein serine/threonine kinase activity | has_input: lit-1 | enzymatic activity - substrate |
| atf-7 | nucleus | part_of: intestinal cell | cellular component - cell type |
| let-381 | mesodermal cell fate specification | results_in_specification_of: coelomocyte | biological process - cell type |
The GO display on gene report pages lists all GO annotations, regardless of the method used to make the association. Thus, it is not uncommon to see either redundant annotations with different supporting evidence or annotations to both parent and child GO terms listed for a single gene. As a general rule, though, automated methods for assigning GO terms result in annotations to less specific GO terms than manual methods that use published, experimental findings as supporting evidence and typically strive to annotate genes to the most granular GO term possible. A summary of the major GO annotation pipelines at WormBase is presented in Table 4 along with the associated evidence codes for each, and specific examples for the gcy-8 receptor guanylate cyclase.
Table 4.
Major GO annotation pipelines at WormBase1
| Annotation Pipeline |
Associated Evidence Codes |
Sample gcy-8 Annotation |
|---|---|---|
| Manual, literature-based | IMP, IGI, IDA, IPI, ISS, IEP, IC, ISM, ND, TAS, NAS | thermotaxis |
| Phylogenetic based on PANTHER families2 | IBA, IKR | signal transduction |
| UniProt Keyword (KW) Mappings3 | IEA | cGMP biosynthetic process |
| InterPro2GO Mappings3,4 | IEA | cyclic nucleotide biosynthetic process |
| Enzyme Commission (EC) Mappings3 | IEA | guanylate cyclase activity |
| UniProt Subcellular Localization (SL)3 | IEA | plasma membrane |
All nematode species represented in WormBase are assigned GO annotations via the InterPro2GO [24] automated annotation pipeline. This pipeline derives annotations from analysis of conserved processes, functions, and localizations associated with protein domains and families as catalogued by the InterPro database. Note, however, that manual annotations are largely limited to C. elegans with a few annotations also assigned to C. briggsae.
5.2.3. Searching and Browsing the GO and Associated Annotations
Browsing the GO is one of the best ways to learn about the variety of terms in the ontology and their relationships to one another. In WormBase, there are several entry points to find GO term information. From the search menu at the top right of each page, users can search for specific GO terms by typing the term name or unique GO identifier and then selecting “Gene Ontology” from the drop down menu. If a specific GO term name is not known, then typing a few letters for the biological concept of interest will bring up an autocomplete menu that suggests possible matches. Given the complexity of the GO, rather than trying to find an exact term match, it can be useful to select a related term and then use the ontology browser (described above) to navigate the ontology.
Selecting a term from the search menu leads users to a GO term report page. Here the “Overview” widget displays the GO term name, associated definition, branch of the ontology to which the term belongs, and its unique GO ID. Two additional widgets on the GO term page allow users to see all associations (annotations) made to that GO term and placement of the term in the ontology. Like on the gene report pages, in the “Associations” widget users can see a “Summary view” or “Full view” of the annotations associated with that GO term. Where applicable, the “Associations” widget also lists the InterPro motifs associated with specific GO terms; these mappings provide the basis for the InterPro2GO annotations noted above. The “Ontology Browser” widget allows the user to see the GO term in the overall context of the GO. Two views are presented: the inferred tree view at the top of the widget and the graph view just below the tree view.
5.2.4. Downloading GO Annotations
The most common use of GO annotations is for gene set enrichment analysis. To perform such analyses, you can use the “Gene Set Enrichment Analysis” tool available under the “Tools” menu or download the complete set of GO annotations and perform the analysis yourself. The full set of C. elegans GO annotations is available as a Gene Association File (GAF) at the GO web site under the “Downloads” menu: http://www.geneontology.org/page/download-annotations. The GAF is a 17-column, tab-separated file that contains all of the information related to a GO annotation, including GO term ID, reference, evidence, and annotation extensions, as well as metadata about the WormBase gene, such as synonyms. Full details on the format of the GAF may be found at: http://www.geneontology.org/page/go-annotation-file-gaf-format-21.
Users may also download the table view of annotations on individual gene report pages by clicking on the “Save table” button in the upper right of each GO table or by clicking on the “Download” link at the bottom of the widget and selecting one of the four available formats.
6. Gene Expression Data
WormBase strives to maintain an up-to-date collection of gene expression descriptions extracted from the literature and directly submitted by individual laboratories. Gene expression data in WormBase include conventional expression pattern analysis, e.g. reporter gene analysis, antibody staining, in situ hybridization (ISH), single molecule fluorescent in situ hybridization (smFISH), RT-PCR, qPCR, Northern blots, Western blots (what we refer to as small-scale expression data), as well as RNA-Seq, microarray, and DNA tiling array data (large-scale expression data).
Expression data in WormBase can be accessed on any gene report page by turning on the “Expression” widget in the left side navigation bar.
6.1. Navigating Small-Scale Gene Expression Data
Small scale gene expression data can be found at the top of the “Expression” widget on a gene report page. Three main tables summarize the curated expression data: i) the “Expressed in” table (Fig. 18) lists all the anatomical structures in which the gene product has been detected; ii) the “Expressed during” table lists the life stages in which the gene is expressed and iii) the “Subcellular localization” table contains the list of the subcellular components in which the gene product localizes. Note that each of these tables only appears if there is data present for the table.
Figure 18.
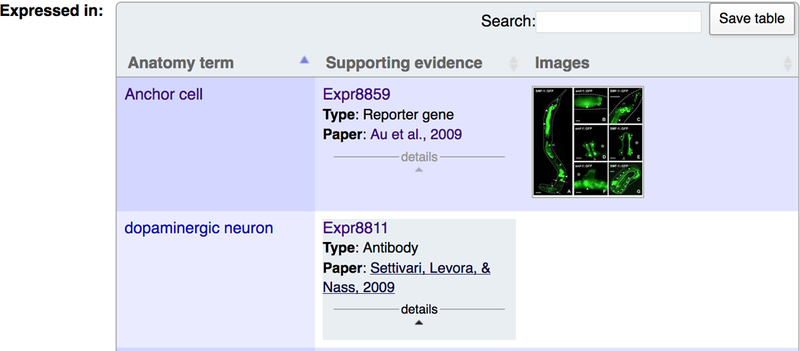
Expression data can be accessed through the “Expression” widget on the gene report page. Once the “Expression” widget has been turned on, you can access all the available expression data for the gene.
The annotation to a specific cell/tissue is always made to the most granular term of the anatomy ontology. For example, if authors describe expression in HSN neurons, the annotation is made to HSNL and HSNR. This is especially important to know if you are browsing expression data from the anatomy page in the “Associations” widget as the correct input of the search is HSNL instead of HSN.
The “Supporting evidence” column specifies the type of experiment that has been used to determine the expression. Specifically, it will list if it was a reporter fusion analysis (“Reporter gene”), an in situ hybridization experiment (“In situ”), an Immunolocalization study (“Antibody”), or if the expression is driven by a cis-regulatory element (“Cis regulatory element”). Below the experimental type, we provide a reference to the paper from which the evidence was extracted.
WormBase release WS259 contains over 12,000 expression patterns determined by reporter gene fusions, 500 in situ hybridization experiments and over 1000 experiments for localization using commercially available antibodies or antibodies generated by individual laboratories (Table 5). Additional information on the transgene or construct used to determine expression--such as reporter, backbone vector, primers, or the antibody used to determine localization--can be found on the expression pattern report page, which can be accessed by clicking the “Expr####” listed in the “Supporting evidence” column.
Table 5.
Number of expression patterns in version WS259 of WormBase grouped by detection method.
| Method | Number of Expression patterns in WS259 |
|---|---|
| Reporter Gene Fusions | 12,791 |
| Immunohistochemistry | 1,137 |
| In situ hybridization | 565 |
| RT PCR | 330 |
| Northern Blotting | 356 |
| Western blotting | 96 |
| Genome Editing | 14 |
| Cis Regulatory element | 79 |
| Total | 15,368 |
Whenever possible, pending journal copyright permissions, we incorporate high-quality annotated images of gene expression directly submitted by individual laboratories or extracted from publications. In the gene report page “Expression” widget, clicking on the “view images” icon will display a pop-up window containing the image, the figure caption, spatio-temporal information, along with a link to the WormBase page for the original publication (Fig. 19). WormBase currently contains over 13,000 curated images.
Figure 19.
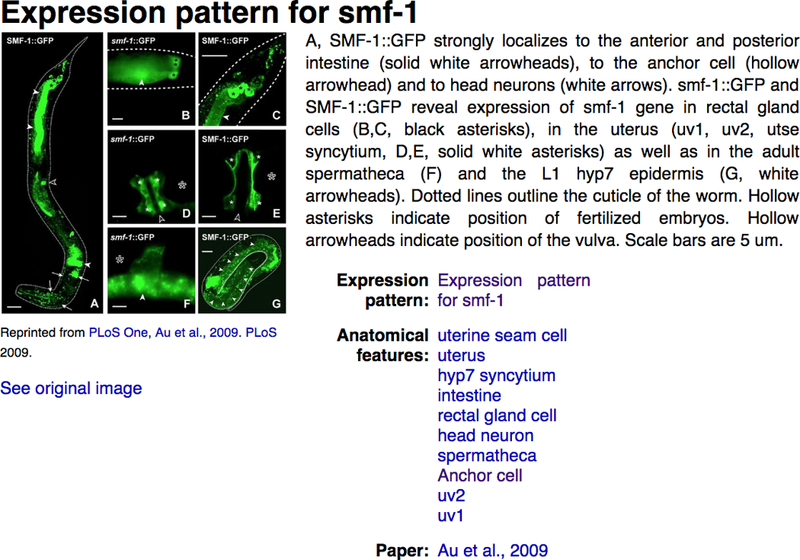
Images of gene expression. Expression images can be accessed through the ‘view image’ links in the “Expression pattern images” section of the “Expression” widget on the gene report page.
6.1.1. Accessing Gene Expression Data
Depending on the scope of your search, conventional gene expression data can be accessed in different ways:
-
1)
If you want to check the expression of a specific gene you can do so via the “Expression” widget on the gene report page.
-
2)
If you wish to see which genes are expressed in a specific cell or tissue you can access the data on the anatomy report page by turning on the “Associations” widget in the left side navigation bar (Fig. 20).
-
3)
An alternative way to find gene expression data is to use the WormBase Ontology Browser (WOBr) that provides an efficient way to browse anatomy terms and navigate the hierarchy (see Subheading 5.1). WOBr can be accessed from the anatomy report page by clicking the “Ontology Browser” widget on the left side navigation bar (Fig. 21). Next to each term you can see a number; this indicates how many genes have been directly--or indirectly--assigned to that particular anatomy term. With WOBr users can find specific anatomy terms without previous knowledge of the structure of the anatomy ontology.
-
4)
Expression data may also be browsed by using WormMine (see Subheading 11.1). WormMine is an integrated search tool of WormBase data built with the Intermine data warehouse platform and can be accessed via the WormBase homepage in the “Tools” menu. In the “Expression” tab on the WormMine homepage are listed a few pre-canned (template) queries to browse gene expression. For instance, by clicking on the “Gene → Expression Pattern” query you are redirected to a template search page where you can simply retrieve all the expression patterns described for a particular gene –and export them in a table in your favorite format. The power of WormMine though, lies in the ability to construct complex queries that can be executed on single entities or lists. By clicking the “Edit Query” button you are now redirected to the Query Builder page, where you can navigate the WormBase data model. Here you can decide which columns you want to add in your output table.
Figure 20.
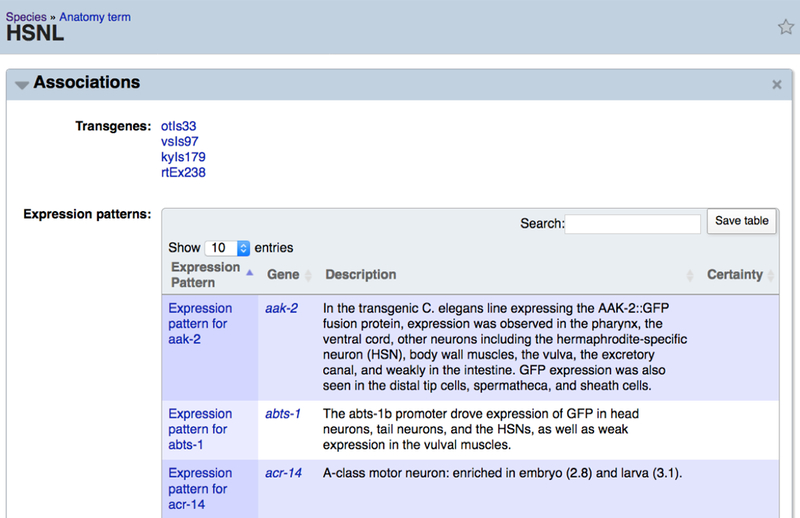
On an anatomy term report page, users can retrieve a list of genes expressed in a specific cell/tissue through the “Associations” widget.
Figure 21.
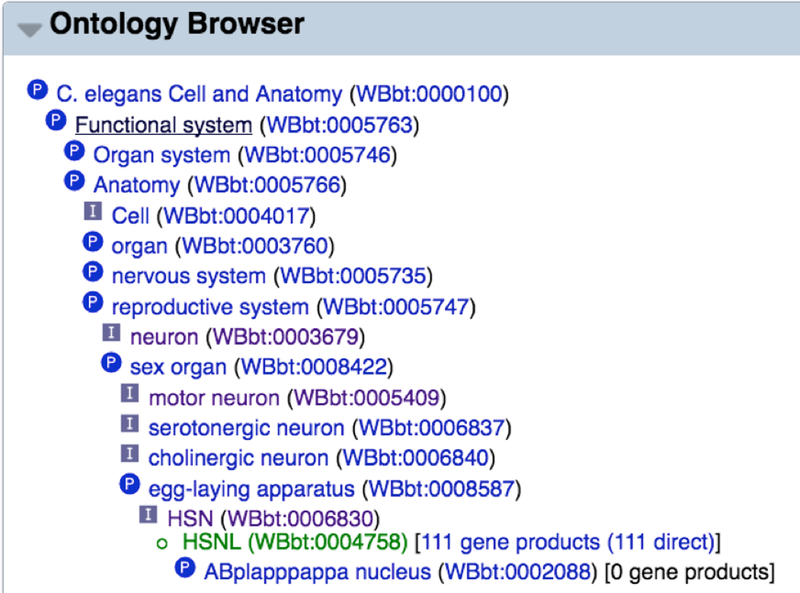
By turning on the “Ontology Browser” widget on the anatomy term report page one can access the tree-like structure of the ontology, see how many genes have been found to be expressed in that specific cell/tissue, and easily navigate through the anatomy ontology without previous deep knowledge of the anatomy.
6.1.2. Submitting Unpublished Expression Data - Micropublications
If you have unpublished expression data you can now “micropublish” it on WormBase by filling out the micropublication form (http://tazendra.caltech.edu/~azurebrd/cgi-bin/forms/expr_micropub.cgi).
The rationale behind the project is that not all data generated by publicly funded research is incorporated in the scientific literature. This information often includes high quality novel findings and is unfortunately not readily available to the scientific community. This knowledge can instead be shared with the public in the form of an open-access micropublication. Once you submit this data to WormBase, it will be reviewed by one or more experts in the field. If approved, your data will be assigned a stable digital object identifier (DOI), will be available on WormBase, and can be cited by traditional citation methods.
6.2. Navigating Large-Scale Gene Expression Data
In addition to small-scale expression data, WormBase provides a number of views of large-scale expression data, including RNA-seq data, microarray data, and expression clusters. This data is visible in the “Expression” widget on gene report pages below the small-scale expression data, on our genome browsers in special tracks, and via the SPELL tool (see Subheading 6.2.3).
6.2.1. RNA-seq Expression Data
Short-read transcript data produced from coding transcript sequences (RNA-seq data) can be used to estimate the relative expression of loci. This is done by collecting the short-read data produced under selected conditions or life-stages and counting what proportion of reads are seen that align to the locus in question in comparison to the reads that align to the genome as a whole, normalized for the length of the locus. The expression is measured in Fragments Per Kilobase of transcript per Million fragments mapped (FPKM), as reported by the Cufflinks software [25,26] and other packages.
The reads used to calculate the FPKM values come from the NCBI Sequence Read Archive (http://www.ncbi.nlm.nih.gov/Traces/sra/). Reads that originate from transcribed sequences are used but any experimental techniques that would cause biased results, such as selection for short sequences, ChIP-seq, ribosome fingerprinting and other unusual protocols are excluded. The Study ID and Experiment ID of each read library extracted from the NCBI Sequence Read Archive are noted and form part of the description used to annotate the results of the read libraries.
-
1.
modENCODE graph: FPKM expression graphs from selected modENCODE [7] libraries are displayed as bar charts (Fig. 22) in the “Expression” widget. The bar chart titled “FPKM expression data from selected modENCODE libraries” displays the expression for each of various sets of life-stages using libraries which have been manually selected as representing the baseline expression at each life-stage. In the first set, there is a time-series of measurements taken every 30 minutes during embryonic development. In the second are the “classical” life-stages with the first two “Early Embryo” and “Late Embryo” stages roughly dividing in two the time-series from the first set of data. Next are two male life stages, then expression from somatic cells in L4 and then dauer life-stages. The data has been produced from libraries made by using two different sets of protocol (“polyA+” selection and “Ribozero” selection). The data is quite variable, so to reduce the appearance of scattered points, the median value of the libraries at each stage has been calculated and is plotted as a grey bar.
-
2.
Mean and Median Values: In the table “Aggregate expression estimates” (Fig. 23) further processing of the FPKM values for genes has been done by taking all available RNA-seq data and identifying those which are a control or which have been obtained when no particular experimental condition has been described. The life stages of these control data have been simplified to reduce them to the stages: “Embryo”, “L1”, “L2”, “L3”, “L4”, “Dauer”, “Adult” and “all stages” (where the life-stage has not been specified). The mean and median values of the FPKM data in each of these classes has been calculated. In species other than C. elegans, the appropriate life-stages are used. A final, “total over all stages”, overall mean and median value for each gene has also been calculated by combining all of these control data values. These values are derived from baseline (control) expression data found in all available RNA-seq experiments and not just the selected modENCODE data that the bar chart (Fig. 22) represents. They are therefore available in species where there is no equivalent of the modENCODE data used to make the bar charts displayed in the C. elegans gene report page “Expression” widget. If these baseline expression values are required for all genes in the database, then they can be obtained from in a single file on the FTP site (Subheading 11.2).
-
3.
Box-plots of RNA-seq Study Data: Each RNA-seq study that has an identifiable reference is summarised as a set of box-plots in the “FPKM expression” section of the “Expression” widget. Clicking on the various studies in the list on the left displays a set of box-plots of the data split by the study’s independent variable (usually the life-stage) (Fig. 24). Below this is the FPKM value of every experiment in every study for those who wish to download and investigate the RNA-seq expression data for this gene in detail.
-
4.
RNA-seq Data in the Genome Browser: A number of genome browser tracks are derived from RNA-seq data. The primary aim of these tracks is to highlight areas where the gene structure may need to be corrected or the complement of transcript isoforms extended, although they can also be used as indicators of quantitative gene expression. To display these tracks in JBrowse, click on the tracks under the “Expression” section of the JBrowse track selector named “RNASeq”, “RNASeq Asymmetries”, and “RNASeq Introns” (Fig. 25).
Figure 22.
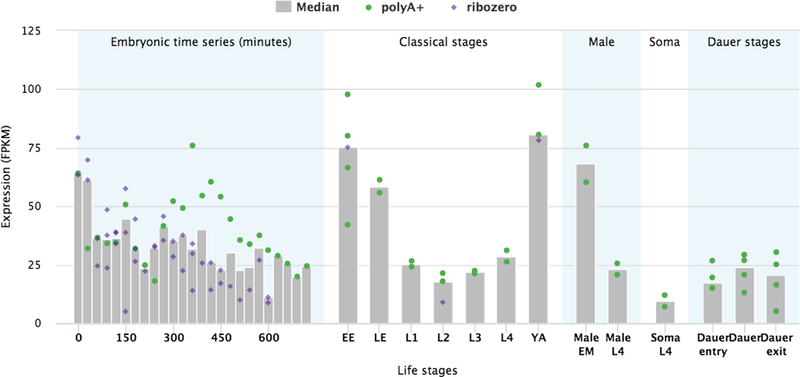
Bar-chart of the FPKM expression values of a gene during various life-stages. The values are produced from RNA-seq data of selected modENCODE libraries. The dots represent individual libraries, the grey bars indicate the median values.
Figure 23.

Mean and median of the baseline (no special experimental conditions) FPKM expression values of a gene during various life-stages.
Figure 24.
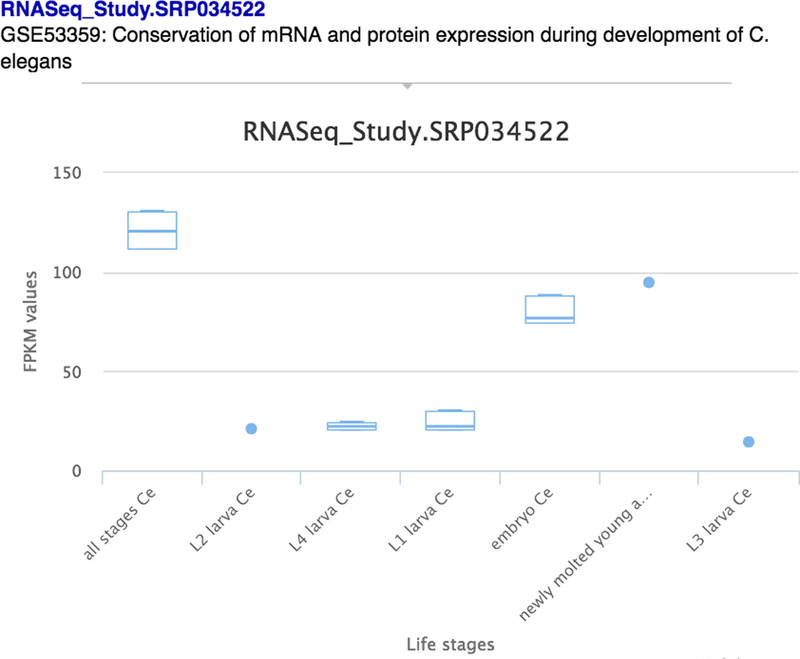
Box-plots of FPKM expression values of experiments in a study, split by the life-stages.
Figure 25.
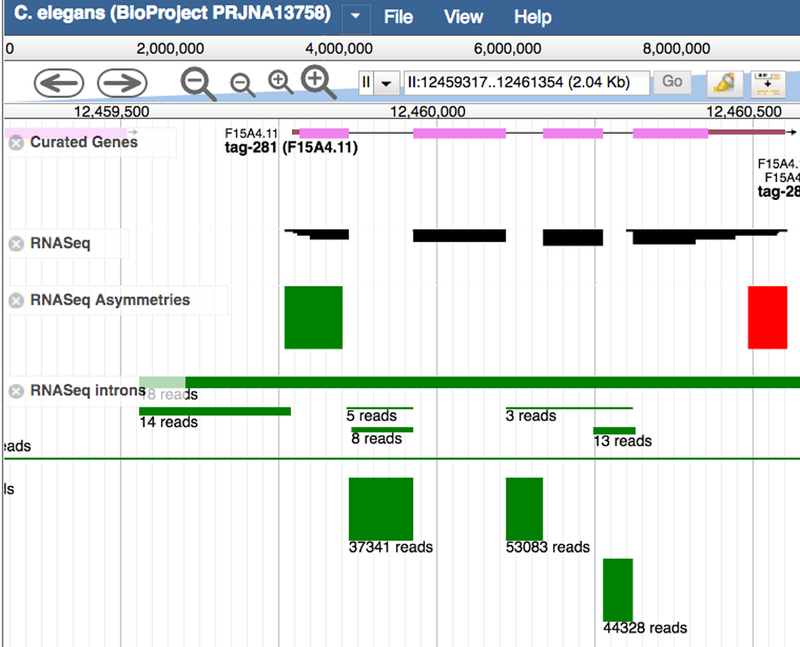
Tracks in the genome browser JBrowse showing RNA-seq information for the gene tag-281. The “RNASeq” track shows the alignment of the RNA-seq reads against the genome. The block’s height is proportional to the number of reads per library and so gives an indication of the level of expression. The “Asymmetries” track is based on a signal found by the modENCODE project where the ends of transcribed regions of the genome are often characterized by a preponderance of the aligned forward (green block) or reverse (red block) sense RNA-seq reads. The “Introns” track shows where RNA-seq reads span a region that is assumed to be an intron. The number of reads is indicated beneath the green blocks marking the introns. When two very similar genes occur near each other, reads can be aligned such that half of the read is in one gene and the other half is in the second gene, producing a spurious “intron” linking the two genes; these are artifacts and should be ignored.
6.2.2. Expression Clusters
Genomic expression studies, such as microarray and RNA-seq, have been used to detect genes that show differential expression in a mutant background, after drug treatments, during immune responses, in different body parts or during different developmental life stages. Genes that exhibit similar differential expression profiles under the same condition are assigned to an “expression cluster”. Users can access expression clusters in the “Expression cluster” section of the “Expression” widget of gene report pages (Fig. 26). Details of expression clusters can be found on “Expression Cluster” pages (reachable by clicking on the expression cluster name in the gene report page “Expression” widget), including regulation by genes, molecules or treatments, tissue or life stage specific information, and algorithms used to draw conclusions. WormBase expression clusters are generated from microarray, tiling array, RNA-Seq, proteomic analysis, quantitative PCR, and large scale quantitative reporter gene analysis.
Figure 26.
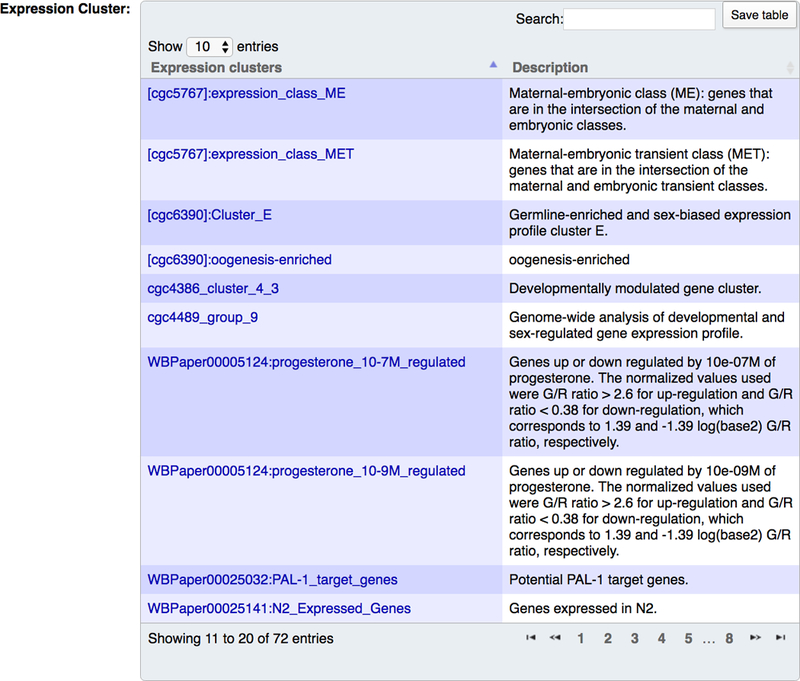
Expression clusters displayed on a gene report page. The “Expression clusters” column displays the name of the expression cluster and the “Description” column displays a brief description of the expression cluster.
6.2.3. WormBase SPELL
SPELL (Serial Pattern of Expression Levels Locator) is a search engine to display, sort and download genomic expression data. It can also be used for clustering or GO enrichment analysis. SPELL can be accessed from the WormBase “Tools” menu. WormBase collects and displays multiple types of genomic expression data: microarray, tiling array, RNA sequencing, qPCR, and mass spectrometry proteomics studies. Gene Expression Omnibus (GEO), ArrayExpress and Sequence Read Archive (SRA) are the main sources from which we obtain microarray and RNA-Seq data; while tiling array and proteomics data mostly come from direct author submission. The SPELL interface (Fig. 27) has three major functions listed on the left side menu. The “New Search” function is intended to query for clusters of genes with similar expression profiles to the query gene; it also displays biological pathways associated to the clustered genes. The “Dataset Listing” function allows users to browse and download specific datasets. The “Show Expression Levels” function gives an overview of expression levels across all experiments.
Figure 27.
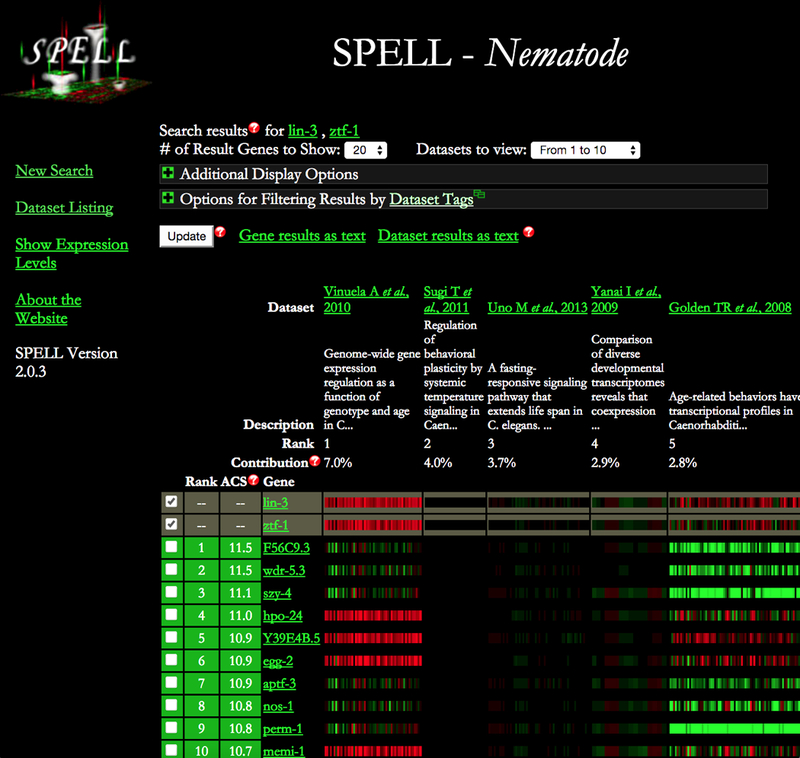
SPELL search results showing genes with similar expression profiles across all datasets. Datasets are ranked according to their relevance to the queried genes.
-
1.
Dataset Listing and Download: When using “Dataset Listing”, users may browse datasets according to biological topic, species, or experimental approach. In the WS257 release of WormBase, SPELL contained data from nine nematode species: C. elegans, C. briggsae, C.brenneri, C. remanei, C. japonica, P. pacificus, B. malayi, O. volvulus and S. ratti. Each dataset is annotated to topics according to biological pathways that have been studied. To turn on the topic filter, click on “Options for Filtering Results by Dataset Tags”. If the dataset came from GEO, the dataset IDs and platform IDs are shown and linked back to the Gene Expression Omnibus site. At the end of each dataset entry, users can click on “details” to obtain more information about the study and names of the experiments. Each dataset entry contains a link to a tab-delimited file (e.g. “WBPaper12345678.ce.mr.csv”) that contains the most up-to-date gene-centric data. Users can use the topic page to browse datasets of interest. One can also download all datasets with one click of the “Download All Datasets” option or download the original probe centric data from the “Download Other Files” option located under the SPELL title.
-
2.
Clustering and GO enrichment analysis: The “New Search” option enables identification of new genes with similar expression profiles to a queried gene across all platforms. The search result will display each gene’s expression profile across all experimental conditions in every dataset, ranked according to their relevance to the query. Users can provide a set of query genes that they believe have correlated expression. The search engine determines a relevance weight for each dataset based on how well correlated the query genes are in each dataset. Datasets in which the query genes are largely co-expressed receive a high weight, while datasets in which the query genes are not co-expressed are given a low weight. Negative correlations are treated as no correlation during score calculations. A multi-gene query, assuming the genes analyzed have good expression correlation, will generate best quality clustering results, because poor quality or irrelevant datasets will receive less weight. If only one query gene is entered, all datasets will get equal weight; users will still get clustering results. SPELL performs GO enrichment analysis on the clustering results. GO terms related to biological processes are displayed at the bottom of the result page.
7. Gene Interactions
WormBase curates four types of gene-gene interactions: physical, genetic, regulatory, and predicted. Physical interactions represent direct, physical, molecular interactions between genes and gene products and may be protein-protein interactions, protein-DNA interactions, or protein-RNA interactions. Genetic interactions represent phenotypic outcomes of double mutants (or other genetic perturbations) with respect to single mutant phenotypes and the control phenotype. Regulatory interactions represent how perturbation of one gene or gene product may affect the expression of a gene or localization of a gene product. Predicted interactions represent in silico predictions of genetic interactions between genes, based on a variety of criteria [27–29]. WormBase curates interactions between genes, sequence features (e.g. DNA binding sites, promoters, enhancers), and occasionally molecules/chemicals, for example when a drug suppresses the effect of a mutation (genetic interactions) or if a chemical induces expression of a gene (regulatory interaction), and treatment conditions, like exposure to gamma irradiation or magnetic fields.
7.1. Gene Report Page “Interactions” Widget
On a gene report page, one may find interaction data in the “Interactions” widget. The first visual element at the top of the widget is the Cytoscape network viewer, which displays a graphic summary of all interactions with a gene (Fig. 28). If there are a large number of interactions the network graph may be collapsed by default to keep the widget operating optimally. To view the graph in this case, click on “View Interaction Network”, and the Cytoscape network will load, but may require a few seconds to complete the loading process. Because of the large number of predicted interactions in WormBase and because of our priority to display interactions with experimental evidence first, predicted interactions for a gene are not displayed by default. To toggle on predicted interactions, click on the checkbox to the left of “Predicted” in the network viewer legend at the right.
Figure 28.
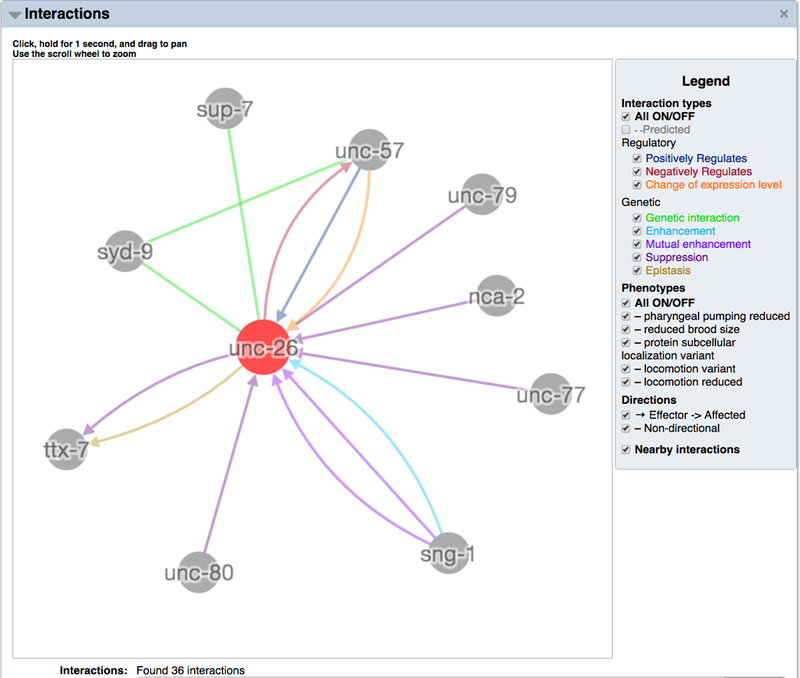
The Cytoscape interaction network viewer. In the top portion of the “Interactions” widget on gene report pages is the network view of interactions for the focus gene as rendered in Cytoscape. The network view can be zoomed in and out (using the mouse scroll feature) and panned left/right/up/down (by clicking and dragging). Individual nodes can be clicked on and rearranged to customize the network view. Interaction types and interactor types can be toggled on or off by clicking the checkboxes in the network view legend to the right.
The Cytoscape network viewer legend provides the ability to toggle on and off different interaction types as well as genetic interactions based on particular phenotypes, directional and non-directional interactions, nearby interactions (interactions between interactors of a focus gene), and different interactor node types (if more than one interactor type is present, e.g. DNA elements or molecules). For convenience there is also a “All ON/OFF” toggle for interaction types and for genetic interaction phenotypes, which can be used to quickly turn off all interactions when there are too many to visualize at once or to quickly turn on all interactions when there are a manageable number of interactions in total and you would like to see all interactions at a glance.
Below the Cytoscape interaction network viewer is a table of all interactions for the focus gene (Fig. 29). The table has seven columns: “Interactions”, which name the interaction by the interacting genes and hyperlink to the individual interaction page; “Interaction Type” which displays the type and subtype of the interaction; “Effector” which displays the first interactor(s) in the interaction, which may play the role of the effector (e.g. suppressor or enhancer) in a directional genetic interaction, the role of the “prey” or “target” for a physical interaction, the role of regulator in a regulatory interaction, or may simply be a non-directional interactor; “Affected” which displays the second interactor(s) in the interaction, which may play the role of the affected gene (e.g. that which is suppressed or enhanced) in a directional genetic interaction, the role of “bait” for a physical interaction, the role of the regulated entity in a regulatory interaction, or also simply the role of a non-directional interactor; “Direction” which displays the directionality of the interaction; for example, if a genetic perturbation of one gene (the effector) suppresses the phenotype of a genetic perturbation in another gene (the affected) in a directional genetic interaction; “Phenotype” which displays the relevant phenotype for genetic interactions; and “Citations” which displays links to WormBase paper pages for the articles from which the interaction data originated.
Figure 29.
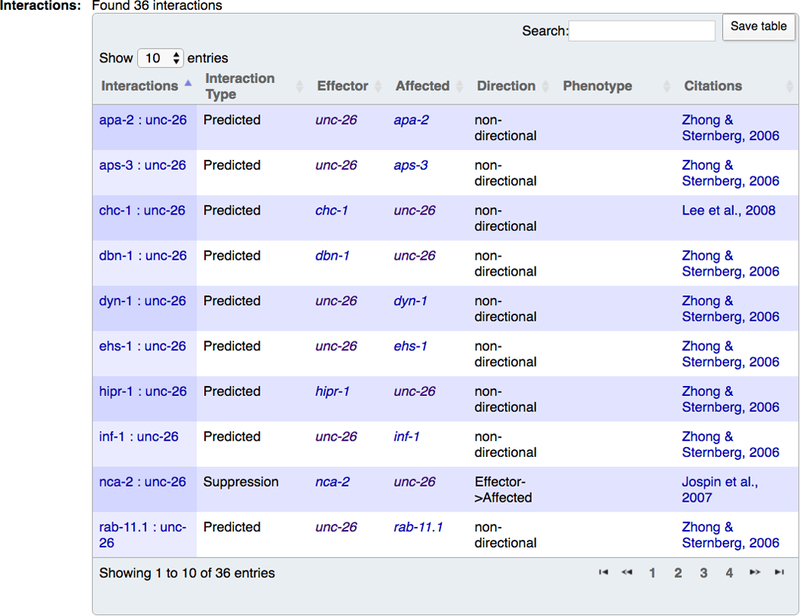
The interactions table for a gene is displayed in the lower half of the “Interactions” widget on the gene report page. Interaction names in the leftmost column can be clicked to open up the web page for that particular interaction. The “Search” box in the table can be used to filter the table’s content to specific interactors or interaction types.
7.2. Interaction Page
By clicking on any interaction name in the table (usually listed by gene names concatenated by a colon), the user is directed to the WormBase interaction page for that interaction. The page has four widgets, including the “Overview” widget displaying interaction details and curator comments, an “External Links” widget to link out to view the interaction at an external database or website, an “Interactors” widget with a layout identical to the “Interactions” widget on a gene report page, and a “References” widget to display the primary research article reporting the interaction.
7.3. Interactions on Process and Pathway Pages
WormBase curates papers and interactions affiliated with certain biological topics, like signaling pathways and developmental processes. To see a process page, click on the magnifying glass icon next to the WormBase search box at the upper right corner of any WormBase page. This will direct you to the advanced search options page. Once there, click on “Process&Pathway” under “Classes” and then type in the name of a process, like “programmed cell death” and hit ENTER. By opening the “Interactions” widget on the process page (also identical in layout to the gene report page “Interactions” widget), users can see all interactions that have been annotated to the process. Note that these are not pathway diagrams, but rather the total network of gene interactions (physical, regulatory, genetic) that have been annotated as pertaining to the process.
8. Phenotype Data
Phenotypes are the observable traits of an organism, resulting from the organism’s genotype interacting with its environment, and may manifest as gross phenotypes like body morphology defects or as more subtle phenotypes like changes in gene expression or metabolic throughput. WormBase organizes nematode phenotype terms according to an ontology (the Worm Phenotype Ontology [20]) which can be browsed using the WormBase Ontology Browser (WOBr, see Subheading 5.1). Phenotype data are most commonly accessed via the gene report page, but are also accessible on variation (allele) pages and transgene pages, as well as on dedicated pages for each phenotype term. The following examples explore some common use cases and describe how to query for phenotype information.
8.1. Finding Phenotypes Associated with a Gene
Perhaps the most common query for phenotype information is to lookup all phenotypes attributed to a gene. Navigate to a gene report page and turn on the “Phenotypes” widget. The widget (Fig. 30) first displays all phenotypes resulting from alleles or RNAi experiments, followed by phenotypes NOT observed for alleles and RNAi, followed by interaction-based phenotypes, followed by overexpression phenotypes.
Figure 30.
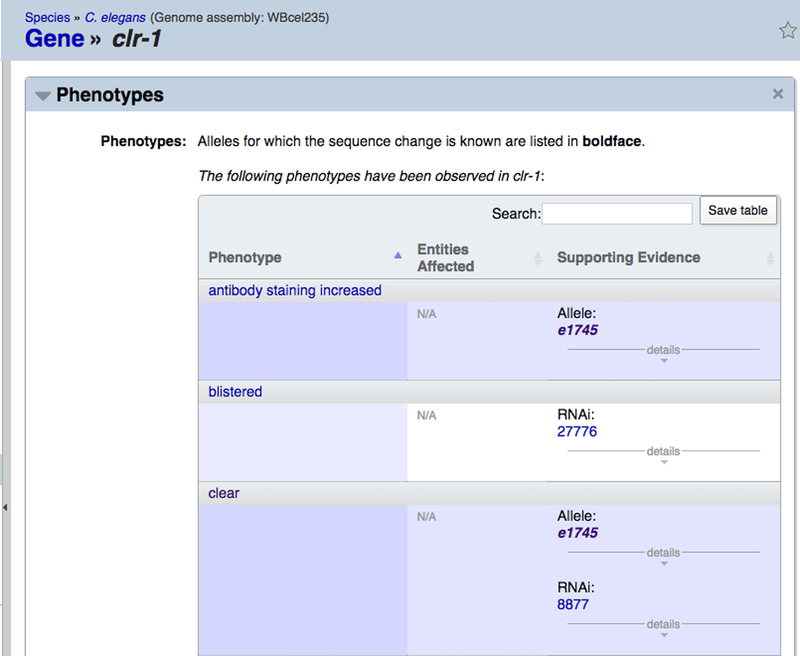
The “Phenotypes” widget on a gene report page displays the phenotypes resulting from various perturbations of the focus gene. The topmost table displays observed phenotypes resulting from allele or RNAi perturbations, followed by a table of phenotypes assayed for but not observed for alleles or RNAi experiments. Below this is a table of interaction-based phenotypes and a table of overexpression phenotypes.
For allele and RNAi-based phenotypes (the top-most table in the “Phenotypes” widget), the table presents three columns: “Phenotype”, “Entities Affected”, and “Supporting Evidence”. The “Phenotype” column displays the name of the phenotype (with a hyperlink to the phenotype term page). The “Entities Affected” column lists all anatomy terms, life stages, and Gene Ontology terms that are affected as part of the phenotype as well as the manner in which each entity is affected, the default being “abnormal”. The “Supporting Evidence” column displays the name of the allele or RNAi experiment annotated to the phenotype as well as additional information about the experiment, including the source (paper reference or personal communication), a remark about the phenotype result, and additional meta data. The table for phenotypes not observed has an identical layout to the allele and RNAi-based phenotypes table but represents phenotypes assayed for but not observed for the indicated genetic perturbation.
For interaction-based phenotypes, the phenotypes reported are those that are affected as part of a genetic interaction. This table has four columns. The “Phenotype” column displays the phenotype affected in the genetic interaction; the “Interactions” column lists the genes involved in the genetic interaction with a hyperlink to the interaction page; the “Interaction Type” column displays the type of genetic interaction; and the “Citations” column lists the papers from which the genetic interactions were annotated. For overexpression phenotypes, the table simply has two columns, “Phenotype” and “Supporting Evidence”. The “Phenotype” column displays the phenotype name and the “Supporting Evidence” lists relevant meta data including paper reference and possibly a remark about the experiment.
Often times exploring all phenotypes for a gene in tabular format is not ideal, as one would like to get a quick overall sense as to the nature of the phenotypes attributed to a gene without having to identify each phenotype by name in a (possibly large) list of phenotypes in alphabetical order. The “Phenotype Graph” widget provides a compact network graph view of all phenotypes annotated to a gene, clustered according to which branches of the Worm Phenotype Ontology are represented in the gene’s annotations (Fig. 31). It provides a summary view of all affected phenotypes with their annotation types and counts. The graph is highly interactive. One can pan around the graph (by clicking and dragging), easily zoom in (using the mouse scroll function) to reveal more details, zoom out to have a broader view, or mouse-over or click on a node to show annotation counts and direct term connections. The Phenotype Graph offers an unweighted view in which each phenotype term node of the graph is of equal size, as well as a weighted view in which node sizes are proportional to the number of independent annotations to each term, with ancestor nodes inheriting annotations from descendant nodes. The entire graph may be exported in PNG format. To make sure labels are visible in the PNG, one should zoom in close enough first before exporting.
Figure 31.
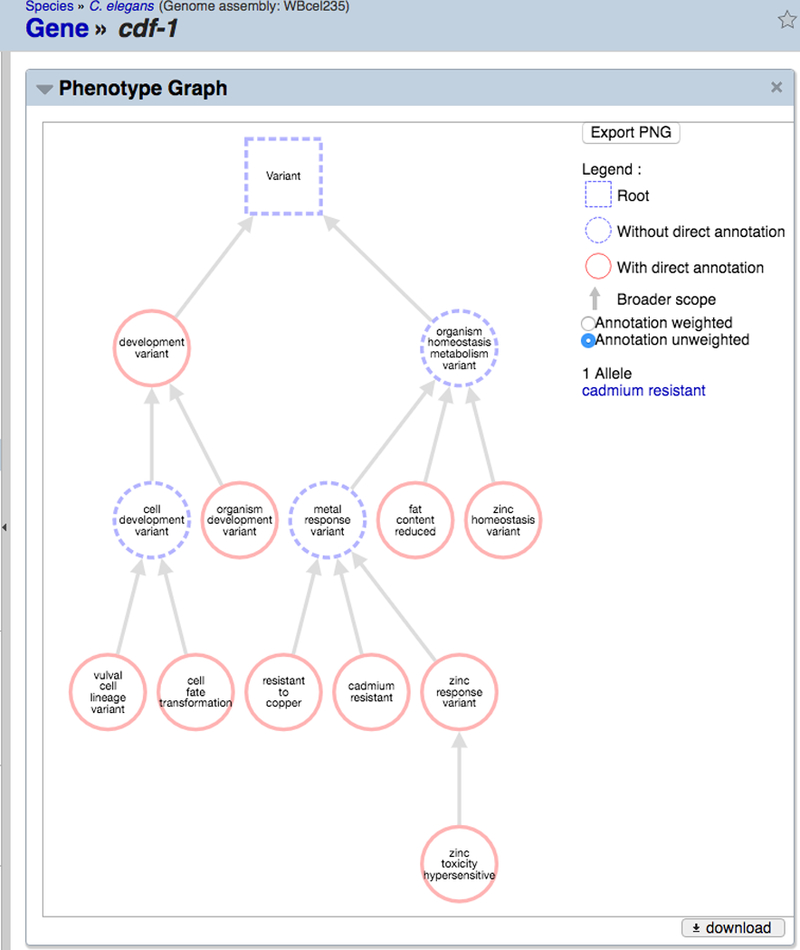
The “Phenotype Graph” widget on gene report pages provides a concise ontology-guided graph view of phenotype annotations to enable more efficient perusal of phenotype terms annotated to the focus gene. The “Annotation weighted” view displays phenotypes as nodes whose size is proportional to the number of annotations to that term; the “Annotation unweighted” view displays each phenotype term as a node of the same size. Hovering the cursor over each node reveals the number and type of annotations to each term. The “Export PNG” button can be used to generate a PNG graphic file depicting the entire graph.
8.2. Finding All Genes Annotated to a Phenotype
Another common task is to lookup all genes annotated to a particular phenotype term as well as to any of the phenotype term’s ontological descendants. For example, a researcher may wish to determine all essential genes, but searching for genes annotated to just the “lethal” phenotype will not include genes specifically annotated to the “larval lethal” or “embryonic lethal” phenotypes. Because the “larval lethal” and “embryonic lethal” phenotype terms are ontological descendants of the “lethal” phenotype term, we want a mechanism that allows users to find genes annotated to the “lethal” phenotype term and/or any of its “is_a” ontological descendants. The “Ontology Browser” widget on a phenotype term page provides this functionality and allows users to find all genes directly annotated to a phenotype term or indirectly annotated to that term via any of its ontological descendants. For example, you can look at the “lethal” phenotype term page by searching in the search box “for a phenotype” with the term “lethal”, and selecting the auto-suggest term that appears or pressing the ENTER/RETURN key. Once at the “lethal” phenotype term page, turn on the “Ontology Browser” widget. At the top of the widget you will see a tree representation of the phenotype ontology and the terms that lead to the “lethal” phenotype term (Fig. 32). To the right of the focus term (“lethal (WBPhenotype:0000062)” in this case) you will see the total number of genes annotated to this term or any of its descendants (4,713 genes as of the WS257 release) and to the right of that you will see the number of genes directly annotated to the “lethal” term (1,904 genes as of WS257). Clicking on either number will direct you to the list of genes, separated according to direct versus total annotations, and according to RNAi-based or allele-based phenotype associations. On the phenotype term page, one can also browse the list of RNAi experiments, alleles, and transgenes that are associated with the phenotype term, in the “RNAi”, “Variation”, and “Transgene” widgets, respectively.
Figure 32.
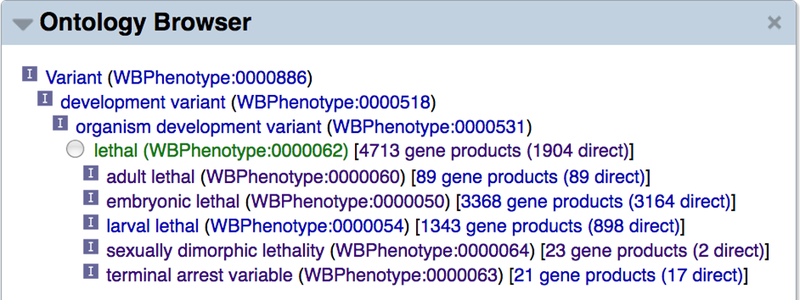
The “Ontology Browser” widget on a phenotype term page is a good location to find out how many genes are annotated to that phenotype term or any of its ontological descendants. The “lethal” phenotype has 4,713 genes annotated to it or any of its ontological descendant terms (e.g. “embryonic lethal”) and 1,904 genes annotated directly to it (as of WormBase release WS257). Clicking on any of the numbers will link to a page listing the names of all genes in that category, subdivided according to the nature of the annotation (direct or indirect annotation, phenotypes observed via alleles or RNAi experiments).
9. Reagents
9.1. Strains
9.1.1. Strain Nomenclature
A strain is a set of individuals of a particular genotype with the capacity to produce more individuals of the same genotype. Strains are given non-italicized names consisting of two or three uppercase letters followed by a number. WormBase has a long-standing collaboration with the Caenorhabditis Genetics Center (CGC), at the University of Minnesota. The CGC collects, maintains, and distributes stocks of C. elegans. Strains can and should be preserved as frozen stocks at −70 degrees Celsius or ideally in liquid nitrogen, in order to ensure long-term maintenance and to avoid drift or accumulation of modifier mutations.
WormBase assigns specific identifying codes to each laboratory engaged in dedicated long-term genetic research on C. elegans. Each laboratory is assigned a laboratory/strain code for naming strains, and an allele code for naming genetic variation (e.g., mutations) and transgenes. These designations are assigned to the laboratory head/PI who is charged with supervising their organization in laboratory databases and their associated biological reagents that are described in WormBase, in publications, and distributed to the scientific community on request. The laboratory/strain code is used (a) to identify the originator of community-supplied information on WormBase, which in addition to attribution facilitates communications between the community/curators and the originator if an issue related to the information should arise at a later date, and (b) provide a tracking code for activities at the CGC. The laboratory/strain designation consists of 2–3 uppercase letters while the allele designation has 1–3 lowercase letters. The final letter of a laboratory code should not be an “O” or an “I” so as not to be mistaken for the numbers “0” or “1” respectively. Additionally, allele designations should also not end with the letter “l” which could also be mistaken for the number “1.” These codes are listed at the CGC and in WormBase. Investigators generating strains, alleles, transgenes, and/or defining genes require these designations and should apply for them at genenames@wormbase.org.
Examples: CB1833 is a strain of genotype dpy-5(e61) unc-13(e51), originally constructed by S. Brenner at the MRC Laboratory of Molecular Biology (strain designation CB, allele designation e), and MT688 is a strain of genotype unc-32(e189) +/+ lin-12(n137) III; him-5(e1467) V, constructed in the laboratory of H.R. Horvitz at M.I.T. (strain designation MT, allele designation n).
Bacterial strain names employ the two or three letter Laboratory/Strain designation, followed by “b”; for example, CBb#. This facilitates distinguishing nematode strains from bacterial strains.
9.1.2. Accessing Strain Information via the Website
Strains carrying a gene of interest can be found within the “Genetics” widget on the gene report page. As well as a Venn diagram indicating strains which carry only the gene of interest and strains which are available to order from the CGC, the widget contains a table listing the genotype of all strains. The strain report page contains more detailed information about the strain e.g. mutagen, who it was made by and when, from where it is available and which alleles, genes and transgenes it carries. Additionally, the alleles are listed in a table, which gives details of the molecular lesion.
9.2. Transgenes and Constructs
Transgenes in WormBase represent (at least partially) heritable, exogenously introduced DNA fragments in the nematode organism that generally tend to confer some functional or potentially functional property to the organism. Constructs, on the other hand, represent the DNA construct that exists independently of the organism (in a test tube, for instance). Thus, transgenes can be generated from constructs, but not the other way around.
Transgenes can be searched for in the main WormBase search box (after specifying “for a transgene”) using conventional C. elegans transgene names. You can also type the name of a gene and see suggested transgene names (that contain the gene or a part of the gene) with the auto-suggest feature of the search. On transgene report pages, the “Overview” and “Construction Details” widgets provide details of how the transgene was constructed and introduced into the nematode. The “Expression” widget displays expression patterns affiliated with the transgene and the “Phenotype” widget displays phenotypes resulting from overexpression of a gene from the transgene. To discover transgenes affiliated with a particular gene, navigate to the gene report page and open the “Reagents” widget. There are two tables that list the transgenes that the focus gene is a component of. The “Drives Transgenes” table lists the transgenes for which a regulatory region (e.g. promoter, enhancer) of the focus gene has been included and is used to drive expression. The “Expressed in Transgenes” table lists the transgenes in which the focus gene is the gene that is expressed.
Constructs are discoverable from transgene pages in the “Construction Details” widget, if available. Clicking on a construct name will redirect you to the construct page, which provides some complementary information about the construct not immediately apparent from the respective transgene report page.
9.3. RNAi Clones
WormBase users often like to know which RNAi reagent to use for effective knockdown of their gene of interest, usually from one of a few commercially available libraries of RNAi clones. These RNAi clones are represented in WormBase both as clone objects as well as PCR product objects, and usually have names that reflect their source. The ORFeome library RNAi clones (from the laboratory of Marc Vidal) [30] are stored in WormBase with names prefixed with “mv_” and are listed on a gene report page in the “Reagents” widget under the label “ORFeome Primers”. To find the location of the clone in the library, it’s best to search for the clone name (following the “mv_” prefix) at the WORFDB website (http://worfdb.dfci.harvard.edu/index.php?page=searchwm). This will direct you to the clone’s web page in WORFDB listing the clone’s plate and well location. Currently, these ORFeome RNAi clones can be purchased through Dharmacon/GE Life Sciences (http://dharmacon.gelifesciences.com) or Source BioScience (http://www.sourcebioscience.com). The RNAi library clones from the laboratory of Julie Ahringer [31] are stored in WormBase with names prefixed with “sjj_” and are listed in the “Reagents” widget of the gene report page as well, but under the “Primer pairs” label. Clicking on the PCR product name (with the “sjj_” prefix) will direct you to the PCR product page for that clone. The “Overview” widget of that page lists the Source BioScience location for the clone in the “Reagent” field, usually of the form <chromosome> - <plate><well row><well column>, for example V-4N08. Alternatively, you can find the Source BioScience clone location on the “sjj_*” clone page (search for a clone from the search box) in the “External Links” widget.
10. Integrated Views of Data in WormBase
10.1. Nematode Models of Human Disease
C. elegans has proven to be an effective, low-cost, preclinical model organism to study the genetics and interactions of human disease-causing genes. It has been used to study human disease gene orthologs, to model human disease and drug-disease interactions, study host-pathogen interactions and bacterial biofilms, and to screen for novel drugs and drug-targets [32–34]. With orthologs to ~50% or more of human disease genes, C. elegans is amenable to live animal drug and bioactive compound screening. C. elegans has the following advantages over tissue and cell culture systems or more expensive mammalian models: lower costs, genetics allowing the identification of effectors/interactors (aiding the identification of drug effector pathways), and experiments that can be done in a physiological whole animal context [35].
A review of the C. elegans literature corpus indicates that the worm has been used as a genetic model system for several diseases; examples include neuromuscular diseases like Amyotrophic Lateral Sclerosis (ALS) and Duchenne Muscular Dystrophy [36], complex neurological diseases like Parkinson’s and Alzheimer’s [37], ciliary diseases like Polycystic kidney disease (PKD) and Bardet-Biedl syndrome [38,39] and premature aging syndromes like Werner syndrome [40]. C. elegans has also been used to study obesity [41] and prion diseases (modeled in C. elegans via the transgenic expression of the prion protein) [42].
10.1.1. Disease Vocabularies
WormBase uses a simple controlled vocabulary that allows the annotation of C. elegans genes as either “Experimental” or “Potential” models for a human disease based on manual curation of published papers, or based on orthology to a human gene implicated in disease, respectively.
A C. elegans gene is associated with a human disease via the use of a Disease Ontology (DO) term. The Disease Ontology project (www.disease-ontology.org) represents and organizes common and rare human diseases into an ontology, providing a knowledgebase of disease terms from several biomedical repositories as well as cross-references to clinical disease vocabularies like Online Mendelian Inheritance in Man (OMIM; http://www.ncbi.nlm.nih.gov/omim) [43,44]. The disease ontology file that consists of disease ontology (DO) terms, synonyms, definitions and cross-references is imported into WormBase, for use in the annotation of genes to disease terms.
10.1.2. Manual Curation of Disease Relevant Data
This curation is based on reading of the published C. elegans literature that describes C. elegans models of disease. Data that curators look for include one or more of the following: data showing orthology between the nematode and human disease-causing gene(s), similarity between nematode and disease phenotypes, similar processes in nematodes and humans underlying the abnormal phenotypes, transgenic rescue of nematode phenotypes by the human gene, transgenic expression of the C. elegans gene in human cell lines causing phenotypes, similarity of genetic and physical interactions between nematode and human proteins, etc. Manual curation results in the annotation of C. elegans genes as “Experimental models” of disease. In addition, a “Disease relevant description” is sometimes written that allows a text description of the nematode model for disease, called “Human disease relevance”, similar in style to the current “Overview” widget at the top of any WormBase gene report page, which describes gene function.
10.1.3. Automated Orthology Based Curation
This type of curation uses orthology between nematode genes and human genes, as predicted by both a number of external methods and internally using the EnsemblCompara method [16] (see Subheading 4.3). Human ortholog information is then cross-referenced with human gene and disease data in the Online Mendelian Inheritance in Man (OMIM) database (www.omim.org) [44]. OMIM disease IDs and their causative genes referenced in the disease ontology file (see explanation of Disease Ontology above) are used as a way to link C. elegans genes to DO terms. This automated orthology-based curation results in the annotation of C. elegans genes as “Potential Models” of disease.
10.1.4. Display of Human Disease Relevant Data
WormBase displays both manually curated disease data from the C. elegans literature and automated orthology-based human disease-related data for genes on the gene report page, in the “Overview” widget and in the “Human Diseases” widget.
-
1.
Disease Data in the “Overview” Widget: When a gene has been curated as an experimental model for human disease, the “Overview” widget of the gene report page features a collapsible subheading, “Human disease relevance”, which consists of a textual description of the model for human disease. This complements the description of normal gene function in C. elegans (Fig. 33).
-
2.
“Human Diseases” Widget: When the “Human Diseases” widget on a gene report page is turned on, the page scrolls to the human disease relevant data for that gene; both manually curated and automated orthology-based data are presented here. Manually curated data include the annotation of a gene to the controlled vocabulary term “Experimental model” for a human disease (described using a Disease Ontology (DO) term) based on experimental evidence from the manually curated literature, or a “Potential model” for a human disease/DO term, based on orthology with a gene(s) in the Online Mendelian Inheritance for Man (OMIM). Also included in the “Human Diseases” widget is a list of the orthologous OMIM genes and diseases with hyperlinks, providing easy access to the OMIM resource. Both experimental and potential model data are supported with various evidence like literature references, date of annotation, and the curator responsible for the annotation (Fig. 34).
-
3.
Searching and Querying for Human Disease Data: Human disease-relevant information for C. elegans genes may be queried for by typing in the name of a disease in the search box on the top right-hand side of the WormBase home page, with the search context “Human Disease” selected from the drop down menu. The auto-complete function suggests a corresponding DO term for the disease and returns a page with all of the relevant information for the human disease including: DO term definition, synonyms, cross-references, genes curated as experimental models and/or potential models for the disease, the disease model descriptions, and the orthologous OMIM genes and hyperlinks. The data is presented in tabular form for ease of viewing e.g., “Parkinson’s disease” (Fig. 35).
-
4.
Browsing Disease Data Using the Ontology Browser: On a given disease term report page, e.g., Alzheimer’s disease, one can also browse the data via the “Ontology Browser” widget. The Ontology Browser depicts the hierarchical structure of the ontology, showing the placement of the term “Alzheimer’s disease”, parent terms and the relationship between the different terms. The browser also shows the number of C. elegans genes annotated with this disease term (Fig. 36).
-
5.
Human Disease Relevant Data Files: Files with C. elegans gene associations to human diseases (DO terms) are available for download via the WormBase FTP site, organized by WormBase release number. For example, the files for WS250 are available at: ftp://ftp.wormbase.org/pub/wormbase/releases/WS250/DISEASE/ and ftp://ftp.wormbase.org/pub/wormbase/releases/WS250/ONTOLOGY/.
Figure 33.
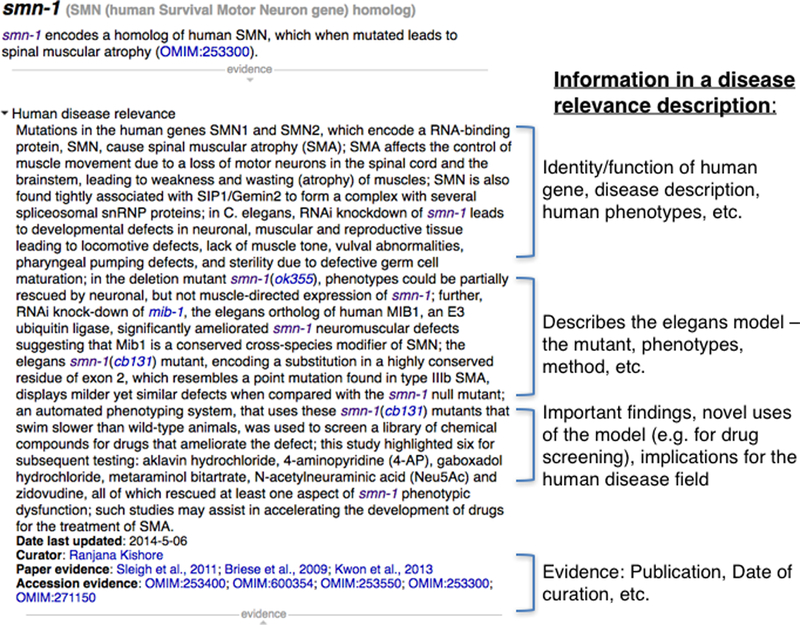
“Human disease relevance” description (when curated) appears in the “Overview” widget on the gene report page. It is a free-text description describing the human disease and how it is modeled in C. elegans.
Figure 34.
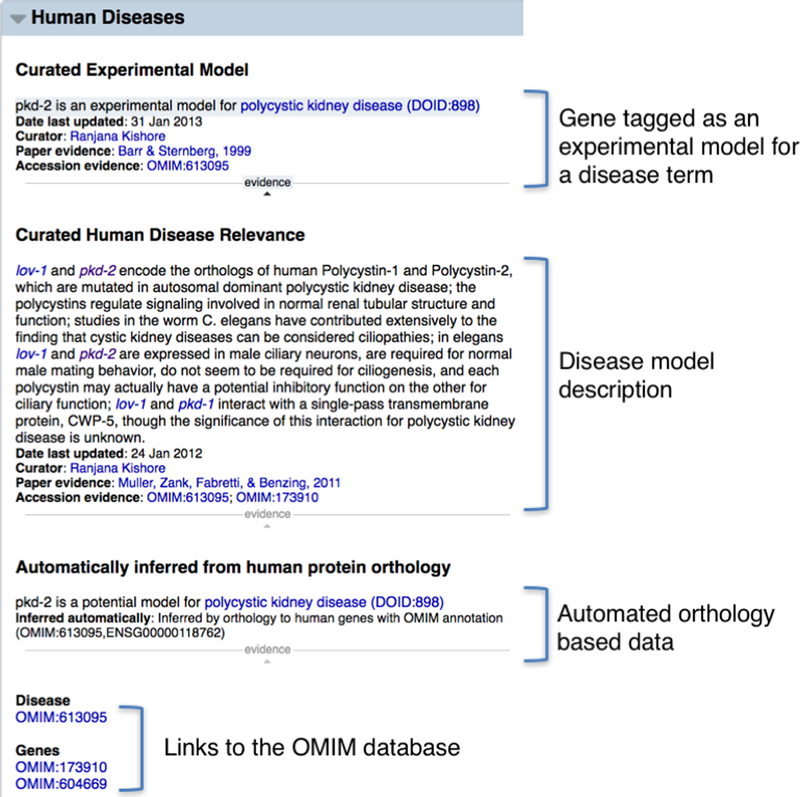
When the “Human Diseases” widget title is clicked on in the left side navigation bar of the gene report page, the page scrolls to all of the disease-relevant data for that gene, both manually annotated and automatically generated.
Figure 35.
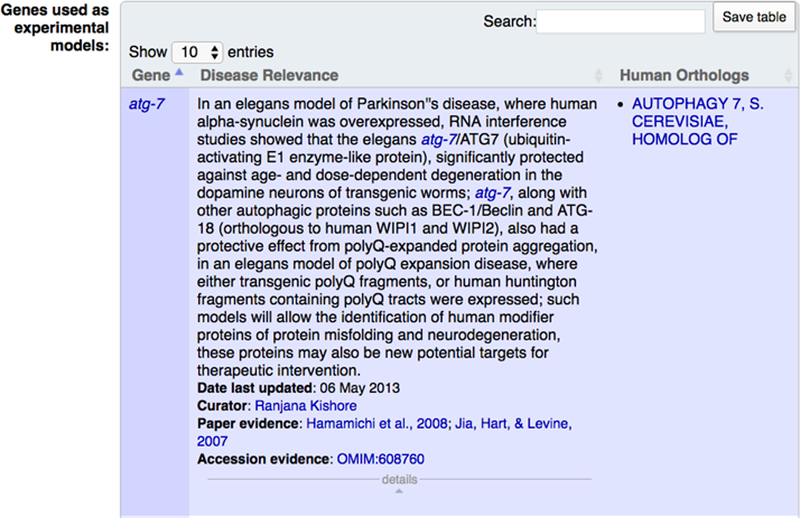
A portion of the “Overview” widget on the disease ontology term page showing the ‘Genes used as experimental models’ table for Parkinson’s disease. This page can be obtained from a context-dependent search using the Human disease term “Parkinson’s disease” from the top-right hand corner search box in WormBase or from a gene report page in the “Human diseases” widget relevant to “Parkinson’s disease”, where this term is hyperlinked.
Figure 36.
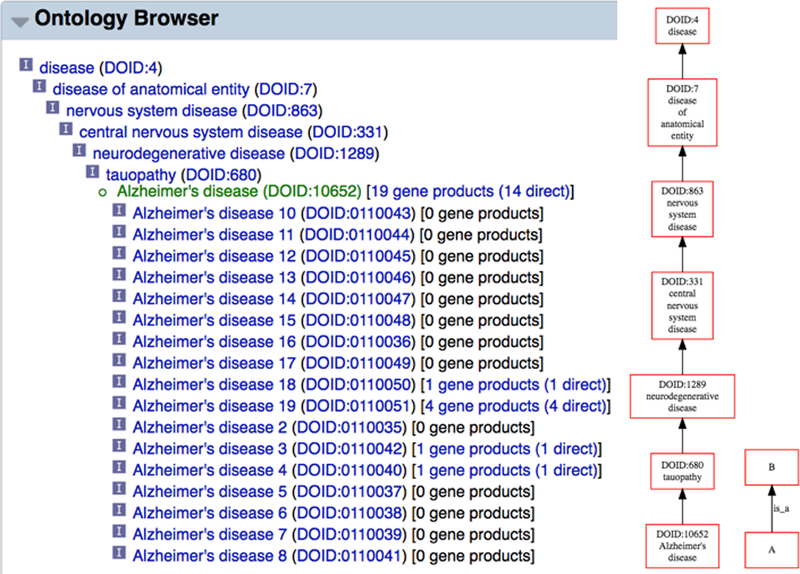
Ontology Browser view of the disease term “Alzheimer’s disease” in the context of the full ontology showing relationships between terms. Also shows number of genes directly or indirectly annotated to this disease term.
10.2. Anatomy Function
Anatomy function is inferred from the observed phenotypic consequences when cells and tissues of interest are specifically affected by physical operations or genetic perturbations like genetic or laser ablation, genetic or expression mosaics, blastomere isolation, and optogenetics. Depending on the treatment, one can infer whether a body part is either necessary or sufficient to support a normal physiological function. When it is available, an anatomy function table can be found on specific phenotype report pages (in the “Associated Anatomy” widget) and anatomy report pages (in the “Associations” widget).
For example, on the “BAG” anatomy term page (http://www.wormbase.org/species/all/anatomy_term/WBbt:0006825#01−−10), users can find reference to the anatomy function WBbtf0434 in the “Associations” widget. Alternatively, users can find reference to the same information in the “Associated Anatomy” widget on the “omega turns variant” phenotype term page (http://www.wormbase.org/species/all/phenotype/WBPhenotype:0000551#01−−10) under the “BAG” neuron header in the “Body Parts Involved” column. By expanding all details under the table columns, the user can best comprehend the full annotation. Specifically, Bretscher and co-workers reported “Coablation of AFD and BAG abolished the suppression of reversals and omega turns following a fall in CO2... These data suggest that together BAG and AFD act to suppress reversals and omega turns when CO2 decreases” [45].
In addition to the annotation of anatomy function using worm phenotype ontology terms, we have recently begun to more fully represent the affected phenotypes with a specifically constructed phrase built from controlled vocabularies from the OBO ontologies (http://www.obofoundry.org/). For example, in anatomy function WBbtf0434, the observed phenotype is represented by the phrase “ENTITY:WBbt:0007833(organism) | GO:0040011(locomotion) GO:0035178(turning) | CHEBI:16526(carbon dioxide) QUALITY:PATO:0000460(abnormal)”. Via this phrase, users can make more atomized associations between anatomy and aspects of biology. For example, one can infer that BAG affects locomotion.
11. Bulk Data Analysis and Downloads
11.1. WormMine
The Intermine biological data warehouse (http://intermine.org/) [46,47] is a powerful tool to perform a variety of queries of biological databases and to manage and manipulate lists of biological entities. This section discusses the use of WormMine, the WormBase instance of Intermine. For the lab biologist, the power of WormMine lies in the ability to generate custom queries and share these queries efficiently with other users, ready-made template queries for common data requests, list editing and comparison, and user login for storing custom queries and tables of results within the context of a high-performance user-friendly web-based interface. Intermine instances have already been established for FlyBase (FlyMine) [48], the Mouse Genome Informatics (MGI) database (MouseMine) [49], and several other model organism databases (MODs) and data sets [50–52], providing biologists across different disciplines a uniform and standard way to access biological data. For a simpler batch gene query, try the SimpleMine tool (see Subheading 12.2) from the WormBase “Tools” menu.
11.1.1. WormMine Data Mining: the Phenotype Data Use-case
The WormBase instance of the InterMine biological data warehouse, which we refer to as “WormMine” (available at http://www.wormbase.org/tools/wormmine/begin.do), is a great tool with which to perform large scale data queries of WormBase data. WormMine can be reached via the “WormMine” link under the “Tools” menu at the top of any WormBase page. Many types of data can be retrieved through WormMine. By way of example to illustrate the power of WormMine, what follows here is specific for querying and retrieving phenotype specific data.
11.1.2. WormMine Lists
Some phenotype data in WormMine are available in the form of pre-generated lists. Lists in WormMine are named “list” objects that hold a list of WormMine-recognized entities. The power of WormMine lists are that they can be used as a filtering criteria when performing queries (e.g. when you want to know all phenotypes attributed to all genes in a list; see below) and that they can be used with Boolean operators to compare and contrast different lists of items with the same object type.
WormMine has several pre-generated lists of phenotypes with all of their respective ontological descendant terms as well as lists of genes that are annotated to those phenotypes. For example, WormMine has a list containing the “lethal” phenotype plus all of the ontological descendant terms of the “lethal” phenotype, including “larval lethal” and “embryonic lethal”. To get to precomputed lists from the WormMine front page (Fig. 37), click on the gray “Lists” tab at the top of the page to open the list entry page. Then, click on the “View” option at the top to the right of the “Upload” label to arrive at the WormMine lists view page. If we click on the “Life span variant and descendant phenotype terms” list, we can view, in table form, the list of WB phenotypes including the generic “life span variant” phenotype plus all of its ontological descendant terms. This table view represents the general layout of all WormMine query results and provides a number of functions for manipulating lists or query results (see below).
Figure 37.
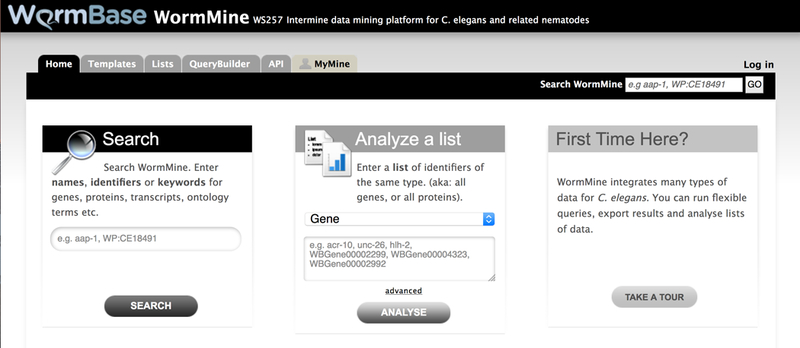
The WormMine homepage provides a search box, a list upload box and a link to a basic tour of the WormMine tool on the WormBase Wiki site. Tabs along the top of the page provide links to template queries (also available via the menu at the bottom of the homepage), list upload and viewing, the “QueryBuilder” tool, information about the WormMine API, and the “MyMine” tab for managing saved lists and queries once a user has logged in.
To upload a list of items into WormMine, click on the “Lists” tab at the top of any WormMine page and click on “Upload” at the top left of the panel if it is not already selected. Next to the “Select type” field, select the data type of your list items from the drop down menu. Paste your list of names/identifiers into the available space or use the “Browse…” button to upload a list from a text file. Once you’ve pasted or uploaded your list of items, click on “Create List” at the bottom right of the panel. WormMine will then process your list, making sure it can find matches to each item in your list. A confirmation page will appear indicating the list of items that WormMine recognizes and a list of items that are not found. If there are any ambiguous names or identifiers, the user will be asked to specify which WormMine objects were intended for the list. Note that deprecated object names (e.g. pseudogene names or names of dead genes) will not be recognized, will be displayed in a list of objects not found, and will be omitted from the final WormMine list. Once you have confirmed the set of items for your list and provided a list name in the field provided, click on the green button “Save a list of # <items>“. You will then be directed to a WormMine table listing your items along with some basic information for each item in your list. You can then find your list under the Lists tab by selecting the “View” option to the right of the “Upload” option. If you are not logged in, the list will be saved for you during your web browser session, but will be removed once you have quit out of your web browser application. If you are logged in, you can permanently save your list into your personal lists for viewing or manipulation at a later date.
Once you have a series of lists that contain the same object type, you may perform list operations such as finding the union, intersection, subtraction, or asymmetric difference of two lists. For example, to find the intersection of two lists, click on the “Lists” tab, select the “View” option, and click the checkbox to the left of each of the two lists you would like to perform the operation on. Note that to perform a list operation, the two lists must contain the same type of object (e.g. both have a list of genes). Once you’ve selected the two lists, click on “Intersect” at the top of the panel and you will be prompted to enter a name for the resulting intersection list. Once you’ve entered a name for the new list, click on “Save” and the resulting intersection list will be generated and stored in the list of WormMine lists. When performing an “asymmetric difference” operation, in addition to being prompted for a new list name, you will be prompted to indicate whether the resulting list should be List 1 minus List 2 or vice versa.
11.1.3. WormMine Tables
WormMine tables enable a user to perform a variety of tasks for analyzing or manipulating a list or table of results. An example view of a WormMine table is presented in Figure 38. The table view appears whenever viewing a list or the results of a query. When viewing a list, the table that appears represents the list of objects plus basic (default) information about each object in the list. For example, gene lists by default display the WormBase gene ID, the gene public name, the gene sequence name and the organism to which the gene belongs (Fig. 38). Other data types similarly have default columns displayed for lists. Once a table is loaded, one can specify the number of rows to show per page or navigate to subsequent or previous pages using the arrow buttons to the right of the “Rows per page” selection. Clicking on the ellipsis (“...”) button in the middle of the arrow buttons allows a user to specify a page number to view.
Figure 38.
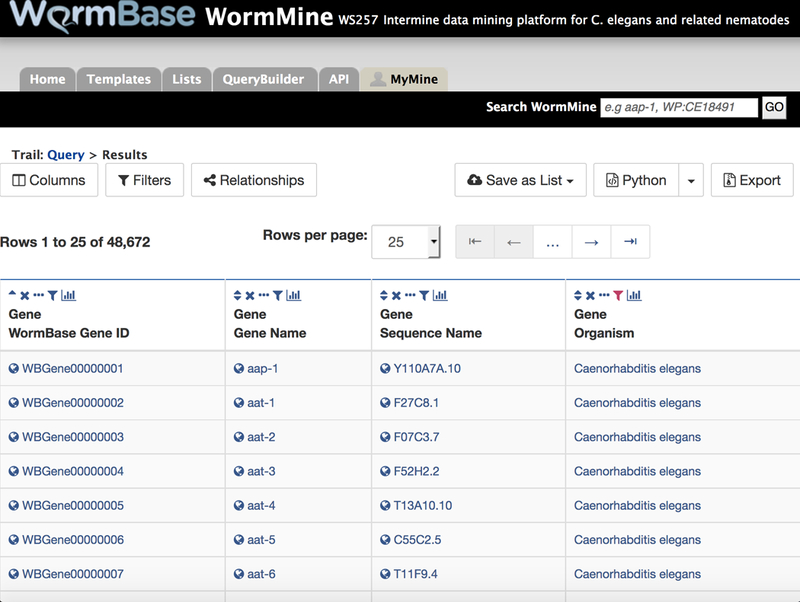
WormMine tables display the results of a query or display default information for a list of objects. Users can manage table columns (add or remove columns, specify sort order) and manage filters from the buttons at the upper left. Users can save a list of objects represented in the table (e.g. save a list of anatomy terms from a query for tissues where a gene is expressed) and export the table in a variety of formats using the buttons at the upper right of the table. Each column header also has several buttons that allow individual manipulation of columns, e.g. sorting, filtering, or hiding.
The first set of manipulations that can be performed on WormMine tables are column operations. At the top of every column is a series of icons representing (from left to right) the sort function (the triangle icons), the remove column function (the “X” icon), the toggle visibility function (the ellipsis icon), the filter function (the funnel-shaped icon), and the column summary function (the bar chart icon). Clicking on the sort function icon will sort the column first in ascending order or, by clicking again, in descending order. Clicking on the “X” remove column icon will remove the column entirely from the table. Clicking on the ellipsis icon (“...”) will collapse the column, resulting in each column entry being replaced by an ellipsis. Subsequently clicking on the expand icon (“<-->“) will reopen the column for viewing. Clicking on the filter icon will present a pop-up window with a list of existing filters for that column and will present the option to apply a new filter. Clicking on the column summary icon will display a summarized list of all entries that exist in that column. This is particularly useful when there are a small number of options in that column and you would like to see how many entries exist for each type or what entries you might like to filter on. The display offers checkboxes next to each entry so that a filter can be applied in place to only show those selected entries (or the inverse of the selection, i.e. show everything except what was selected). Note that whenever an operation is applied to a WormMine table, an “undo” icon will appear allowing the user to undo their last operation (or series of operations).
Next, a user can manage the columns presented by clicking on the “Manage Columns” or “Columns” button. Clicking on this button will present a pop-up window allowing a user to reorder the columns, remove columns (by clicking on the red (−) icon to the right of the column name or by dragging the column to the trash icon), adjust the sort order (for sequential sorting of columns), or add one or more columns by clicking on the green “Add a column” button. When adding columns, the user will be redirected to a model browser allowing the user to select attributes to add to the table. Adjacent to the “Manage Columns”/”Columns” button is the “Manage Filters”/”Filters” button, which allows a user to add a new filter or edit an existing filter. Adjacent to the “Filters” button is the “Manage Relationships”/”Relationships” button, which allows a user to specify whether a particular attribute is required or optional for viewing an entry.
To the right of these buttons is the “Save as List” button, allowing a user to create a new list of objects based on the objects represented in the table being viewed (with all filters and constraints applied) or add objects in the table to an existing list. To save a list, click on the “Save as List” button, choose “Create List” and then click on the data type for which you would like to create a list. This will prompt the user for a name for the new list which will then be saved with other WormMine lists (see above). Rather than select all entities of a particular data type, one can choose the “Pick items from the table” option which will allow for selecting individual items for the destination list. To add items to an existing list, click on “Save as List” and select “Add to List” and the items you would like to add. At this point you will be prompted to select an existing list to add the new items to.
Finally, one can export the table in a variety of formats by clicking on the “Export” button. Specify a filename in the “File name” field and the format of the file in the drop down menu to the right of the “File name” field. Format options include tab-separated values (.tsv), comma-separated values (.csv), XML, and JSON formats. In addition, the left side panel of the “Export” pop-up window provides options to specify which columns and rows to include, whether to apply compression to the downloaded file, and whether to include column headers in the file. Once parameters for the exported file are set, one can view the expected output in the “Preview” tab. To complete the download, click on “Download file”.
11.1.4. WormMine Queries
The pre-existing WormMine lists of phenotypes and genes with those phenotypes are informative, but the real power of WormMine lies in the ability to query the data in a variety of ways. To get a first look at querying phenotype data with WormMine, we can take advantage of two template queries for phenotype data, available under the “PHENOTYPES” template query tab located at about the middle (vertically) of the WormMine home page along with the “GENOMICS”, “PROTEINS”, etc. tabs. Here we can see two template queries that are available: “Genes → Phenotypes” and “Phenotype → Genes”. If we click on the “Genes → Phenotypes” query, we will see a description of the query and some options. As the description states, this template query “returns a list of all phenotypes attributed to a gene or a list of genes”. The default gene input for the query is unc-26. If we click on the green “Show Results” button, we arrive at the query results page, displayed in the table format as described above. What these results depict are all observed variation (allele) induced phenotypes (RNAi phenotypes are not yet available in WormMine, as of this writing) for the gene unc-26, along with the alleles of unc-26 which conferred the phenotypes. This is the same information that can be gleaned from the “Phenotypes” widget on the unc-26 gene page, so this may not seem to add much query power to our existing approaches. However, WormMine also allows querying by using lists instead of just an individual gene. If we click on the “Query” link at the upper left corner of the results table (after the “Trail” header), we can go back to our query options page to perform the same query on a LIST of genes, instead of just unc-26. Click on the checkbox to the left of the text “constrain to be IN” and this will turn on the ability to select one of a list of gene lists in WormMine that may be used as input for the query. Select the list “C. elegans genes with a cell cycle variant - or descendant - allele phenotype...” and click on the green “Show Results” button. The results are, again, displayed in the WormMine table format. This query allows a user to see what other phenotypes are associated with genes that are already known to have a “cell cycle variant” or descendant phenotype. This type of query can, of course, be performed with any list of genes, as long as the list has been generated and saved within WormMine.
The second available template query for phenotype data in WormMine is the “Phenotype → Genes” query. Both this query and the template query described above (“Genes → Phenotypes”) can be found under the “Phenotypes” tab of the WormMine front page (as described above), but also under the gray “Templates” tab at the top of the WormMine interface. Once selected, we can see the description of the “Phenotype → Genes” template query: “Return all genes annotated with a particular phenotype. Select either observed or not observed.”. The default phenotype to search with is “transgene expression variant”. Clicking on “Show Results” brings us to the results table simply displaying all genes that have been annotated (via alleles) with the “transgene expression variant” phenotype. As with the first template query, this query can be modified by going back to the query options page (click on the “Query” at the upper left of the results table) and either typing in a different single phenotype to search with or selecting a list of phenotypes. As before, we can check the checkbox to the left of “constrain to be IN” and then select a registered list of phenotypes to query with. Select the “Cell cycle variant and descendant phenotype terms…” list and click “Show Results” to see the list of all genes annotated to the phenotype “cell cycle variant” or any of its ontological descendant terms.
11.1.5. The WormMine QueryBuilder
To get a better understanding of how queries in WormMine are constructed, and to enable you to perform your own queries, let’s take a closer look at the first template query “Genes → Phenotypes” discussed earlier. Once we’ve selected this template query from the “PHENOTYPES” tab on the WormMine front page and arrived at the template query options page, click on the “Edit Query” button at the lower right of the options panel. This will take you to the template query’s QueryBuilder page, outlining the underlying construction of this query. The upper left quadrant of the QueryBuilder page displays the “Model browser” (Fig. 39) where a user can specify what data is to be displayed and/or constrained on for a query. The upper right quadrant of the page displays the “Query Overview” which summarizes the data chosen to be displayed and constrained on using the model browser. The bottom “Columns to Display” panel of the QueryBuilder page displays the arrangement of output columns for the results table, where the order in which the columns will be displayed in the output table can be rearranged and columns can be removed, given a column header title/description, or set to be sorted.
Figure 39.
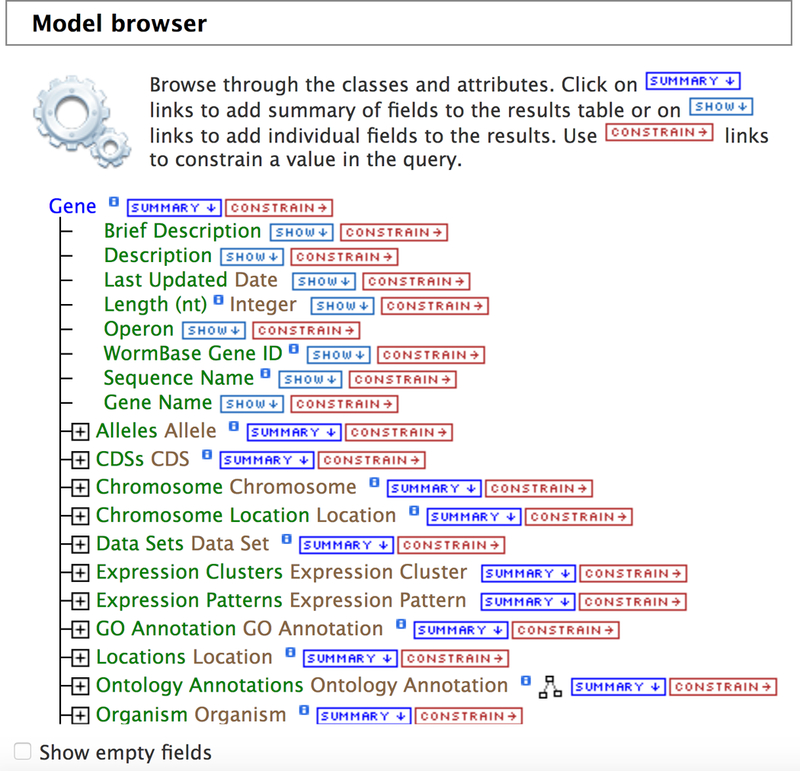
The WormMine “QueryBuilder” tool displays a model browser for the data type that is being queried. Individual tags/attributes may be selected to be shown (by clicking on “SHOW”) or constrained on (by clicking on “CONSTRAIN”). Clicking on “SUMMARY” selects a set of default attributes to be shown for that category of data. Any selections or modifications made in the model browser will immediately be displayed in the “Query Overview” panel to the right of the model browser.
The query overview panel indicates the data to be displayed as well as where the data may be found in the model browser. We can see that the “WB Gene ID”, “Sequence Name”, and “Gene Name” have been selected for display from under the “Gene” heading and this can be seen directly in the model browser to the left (note the highlighted tags in the model browser). The query overview also indicates that a constraint has been set for the gene name to be equal to “unc-26” (thereby only returning data relevant to the gene unc-26). We can also see that the “WormBase ID” and “Public Name” have been selected under the “Alleles” header and subsequently “Identifier” and “Name” under the nested “Phenotypes Observed” header. We can verify this in the model browser panel by expanding the relevant nodes by clicking on the “+” sign, first to the left of the “Alleles” header and then to the left of the now exposed “Phenotypes Observed” header under the “Alleles” header. Note the additional highlighted tags for “WormBase ID”, “Public Name”, “Identifier” and “Name” in the model browser.
To set any data to display in the query results, click on the “Show” button immediately to the right of any desired data attribute title in the model browser and the query overview and columns-to-display panels should update immediately. To remove any data or constraints from the query, click on the red and white “X” icon next to the relevant data type or constraint in the query overview panel or the bottom columns-to-display panel (cannot remove constraints from the bottom panel). To edit an existing constraint (the “Gene Name = unc-26” constraint in this case) click on the blue edit icon immediately to the right of the red and white “X” cancellation button. This brings up the constraint options dialogue box which is the same dialogue box that would appear when applying a new constraint (which can be set by clicking on the red “CONSTRAIN” text next to the data attribute in the model browser). From here we can change the constraint to query using a different gene or a list of genes. We may also use the drop down list of operators to perform a more generalized query. For example, we may select the “not equal to” option “!=“ or use the “CONTAINS” option with the text “unc” to search for all phenotypes for any genes whose names contain the “unc” prefix. Note that the less-than, less-than-or-equal-to, greater-than and greater-than-or-equal-to options only apply meaningfully to numerical data.
The above description of WormMine is not intended to cover all of its features, but provides an adequate first glance at the tool and its capabilities with respect to phenotype data. A complementary guide to WormMine may be found on the WormBase Wiki WormMine user guide page (http://wiki.wormbase.org/index.php/UserGuide:WormMine). Our look at the QueryBuilder focused only on querying from the “Gene” context, but the same general principles apply when building queries in other contexts. The QueryBuilder tool can also be used in the context of “Alleles” and “Phenotype” to extract phenotype data, although the “Alleles” context provides no more than the “Gene” context does (the entire “Alleles” model browser is nested inside the “Gene” model browser) and querying from the “Phenotype” context only provides the list of alleles (not the affiliated genes) annotated to an indicated phenotype or phenotypes. To build a query from scratch, click on the gray “QueryBuilder” tab on the WormMine homepage to arrive at the QueryBuilder starting page. From this page a user may view recent query history, import a query from XML (exported from the QueryBuilder previously) or select a data type to begin a query from scratch.
11.2. FTP Site
To complement WormMine, we also provide a collection of pre-calculated files on our FTP site. Many of these are data files required as input for genome analysis software, e.g. the reference genome sequence (in FASTA format) and the genome annotations (in GFF3 format), and we provide them for convenience. Others capture the results of queries that multiple users have requested in the past.
Many of these files are linked to directly from various different pages on the WormBase site. However, visiting the FTP site itself allows comprehensive access to all the files (ftp://ftp.wormbase.org/pub/wormbase). The files are organized into two parallel directory structures. The first (“releases”) organizes the files first by release, then by species, and finally by genome project. This structure is convenient for downloading all (or many) files for a single WormBase release, or single genome. The second structure (“species”) organizes the files first by species, and then by data type, with all files for a particular species/data-type, across all releases and genome projects, located in the same folder. This structure is useful for retrieving the the latest file for a species/data-type of interest, and to retrieve multiple versions of that file.
In both structures, files are named according to the scheme G_SPECIES.BIOPROJECT.RELEASE.SUFFIX, for example: c_elegans.PRJNA13758.WS257.genomic.fa.gz. Note that the second element of the filename is the INSDC BioProject identifier for the genome project, which is our main way of disambiguating between multiple genome projects for the same species. Some of the main files we provide for each species are listed in Table 6.
Table 6.
FTP site file names and their contents
| Category | Suffix | Description |
|---|---|---|
| Genome | .genomic.fa.gz | Reference genome sequence |
| .genomic_masked.fa.gz | Genome sequence with repettitive sequence masked with Ns | |
| .genomic_softmasked.gz | Genome sequence with repetitive sequence made lower-case | |
| Sequences for genomic features | .mRNA_transcripts | Full length protein-coding transcripts |
| .CDS_transcripts.fa.gz | CDS portion of protein-coding transcripts | |
| .proteins.fa.gz | Reference proteome | |
| .ncRNA_transcripts.fa.gz | Non-coding transcripts | |
| .transposons.fa.gz | Transposable elements | |
| .transposon_transcripts.fa.gz | Transcripts associated with transposable elements | |
| .intergenic_sequences.fa.gz | Sequences between adjacent genes | |
| Genome annotations | .annotations.gff3.gz | Genome annotations in GFF v3 |
| .annotations.gff2.gz | Genome annotations in GFF v3 | |
| .canonical_transcripts.gtf.gz | The canonical gene set in GTF | |
| Misc | .xrefs.txt.gz | Cross-references between WormBase annotations and other resources such as INSDC and UniProt |
11.3. RESTful API
The WormBase website implements a simple yet powerful Application Programming Interface (API) that follows the RESTful design pattern. Each widget on the website corresponds to a unique API endpoint using a generic URI structure:
http://api.wormbase.org/rest/widget/[CLASS]/[ID]/[WIDGET]
For example, to fetch the gene report “Overview” widget for unc-26 (WBGene00006763) in JSON, send the following curl request:
curl -H content-type:application/json \ http://api.wormbase.org/rest/widget/gene/WBGene00006763/overview
The API is described in more complete detail on the WormBase website (http://www.wormbase.org/about/userguide/for_developers/api-rest#10−−10)
12. Tools
12.1. BLAST/BLAT Tool
The BLAST/BLAT tools [53,54] at WormBase are the standard way to compare a protein or nucleotide query sequence with all protein and genome sequences at WormBase, whether you’re looking for an exact match (e.g. by BLASTing a C. elegans sequence) or if you’re looking for the best nematode BLAST match for a foreign sequence (e.g. BLASTing a human protein sequence). The tool can be reached via the “Tools” menu on any WormBase page. Once the tool has opened, paste in your list of protein or nucleotide sequences in FASTA format. Next, select your query tool, BLAST or BLAT, noting that BLAT tends to work more efficiently with exact matches (it’s best not to use BLAT when querying with a non-nematode sequence). Next, select the type of query (blastn, blastp, blastx, or tblastn). There is a “Filter” checkbox, checked by default, that enables the tool to filter out low complexity regions of the query sequence. Finally, select the WormBase version/release, the sequence type (genome or EST for nucleotide queries), the species, and, if applicable, the BioProject ID you would like to BLAST or BLAT against and click the Submit button. Results will be displayed for each sequence submitted (one result page on top of the next), listing the best matches at top with links to the corresponding entities. For nucleotide queries, click on the expandable “+” in the box to the left of the query hit to see a genome view, outlining where the sequence aligns to the genome.
12.2. SimpleMine
SimpleMine is a simple bulk data download tool. Users can submit a list of gene names to get a tab-delimited file containing gene IDs from various databases, phenotypes from alleles and RNAi studies, anatomical and developmental life stages of expression from individual and genomic studies, as well as summarized descriptions about their functions. SimpleMine can be accessed from the WormBase “Tools” menu. To begin a query, type or paste in a list of gene names or identifiers (or upload a list of genes from a file with the “Browse...” button), choose your results format (“download” to download a tab-delimited file; “html” to see the results in your web browser), and click on the “query list” button. Please note that when processing a tab-delimited file of gene names with a spreadsheet program, gene names are often automatically converted into dates, so make sure that all gene names are read-in only as text.
12.3. Gene Set Enrichment Analysis
If a user provides a list of genes, say from an RNA-seq analysis, the Gene Set Enrichment Analysis Tool (available under the WormBase Tools menu) may find tissues, Gene Ontology terms or phenotypes that are over-represented regarding gene annotation frequency. This tool uses the most up to date WormBase gene expression, Gene Ontology, and phenotype data, respectively, and applies a hypergeometric statistical model [55]. The input can be of any format of WormBase gene names, either entered in the provided box or in a file on the user’s computer. The output will inform the user if any of the input genes are not recognized or for which there is no available data and thus excluded from the analysis. A successful analysis will yield a table and a graph of enriched terms. Both the table and the graph may be exported for further analysis or presentations.
12.4. Community Annotation Forms
As the rate at which nematode research articles are published continues to grow, the demand for manual curation is overwhelming the capacity of the WormBase literature curation team. In order to stay up-to-date and current with the literature, WormBase needs the support and curation effort of the entire nematode research community. To that end, WormBase has begun development of a series of web-based, user-friendly community annotation forms designed for easy and efficient submission of data. Links to these forms are available in the “Community Curation” widget of the “Submit Data” page (http://www.wormbase.org/about/userguide/submit_data#01−−10). The “Submit Data” page can be accessed via the “Submit Data” link directly below the search box on any WormBase page or in the “Community” and “Support” drop down menus in the main navigation bar.
Currently, data for four different data types can be submitted via the community curation forms: phenotype, allele sequence, expression data micropublication, and gene descriptions. Each of the forms share common features designed to expedite the data submission process: (1) personal recognition: once any form has been filled out and data submitted, the form will remember users based on their IP address, making it a bit easier to submit data on subsequent visits; (2) autocomplete functionality: wherever a field requires a controlled vocabulary, the field will provide matching options as you type so as to ease the term lookup process, reduce errors, and save time; (3) term information: also for controlled vocabulary fields, term information boxes appear at the upper right corner of the screen to provide additional information about the term and often provide links to the relevant WormBase page; (4) in-line help: green question marks adjacent to entry fields may be clicked to provide help information about that field in the term information box at the upper right corner of the screen; (5) clearly marked mandatory fields to make clear what entries are required for submission.
13. Community Resources
WormBase offers a number of services to support the C. elegans research community. These include tools to interact directly with WormBase curators and developers, to request assistance with specific problems you may have, to publish brief research missives, and to stay up-to-date with items of interest to the community. In brief, your best approach for staying up-to-date.
13.1. Help desk
WormBase provides a responsive help desk service to assist with problems you may have using the website or interpreting data. Need help with a data mining query? Looking for information on a specific gene or have new data to submit? The help desk is appropriate for any and all queries that you may have.
There are two options for submitting queries to the help desk. Most directly, you can send an email to help@wormbase.org. Alternatively, on the website look for a small tab at the bottom of every window that reads “Need help or have feedback?” (Fig 1, bottom right). Click on the tab to expand it. If this is during normal working hours (typically within the range of 6AM - 8PM GMT −5), you may have the option of chatting directly with a WormBase curator or developer. If no members of WormBase staff are available, you will be provided with a form to enter your name and email (optional) and a brief description of your query. Do note that if you do not provide your email, we will not be able to follow up with you on your query.
Regardless of how you contact us, we will quickly triage your issue and make sure that the most appropriate curator or developer handles your query. You can track progress on resolution of your query on our public issue tracker at http://github.com/wormbase/website/issues. We aim to respond to every query within 24 hours, and often do so much more quickly than that. As mentioned above, the website has a built-in chat feature. During normal working hours, you can text chat directly with WormBase staff for quick resolution of your query.
13.2. The Worm Community Forum
The Worm Community Forum is a joint resource sponsored by WormBase and Worm Atlas [56] (www.wormatlas.org). Here, you can submit queries to an audience beyond WormBase staff, to include a wide range of C. elegans and nematode researchers. The Forum includes a variety of sections including those for new lab announcements, job postings, and help with specific experimental techniques. You must register in order to post and reply to topics, but you may browse without registering.
13.3. The WormBase Blog
WormBase maintains a blog (http://blog.wormbase.org) as a home for longer format narratives discussing major new features, meeting announcements and so on. These are generally longer narratives that will not fit within the Twitter confines of 140 characters. You can always stay up-to-date with the WormBase blog by visiting the home page periodically. Items posted to the blog will appear in the “News” section. You can always subscribe by either email or to the RSS feed by visiting the WormBase Blog directly.
13.4. Twitter @WormBase
At WormBase, we use Twitter to inform users of breaking service status issues, as an aggregator of various other outreach channels (such as the blog), and as a means to contact us and ask us questions. We are @wormbase on Twitter (http://twitter.com/wormbase).
13.5. The Worm Breeder’s Gazette
The Worm Breeder’s Gazette (http://wbg.wormbook.org) is an extension of the long-running print version of the newsletter. Operated under the auspices of WormBook [57], the new online version of the Worm Breeder’s Gazette lets authors publish brief (approximately one printed page) research findings, methods, or announcements of general relevance to the community. Submissions are handled directly online. We aim to publish submitted articles within a week after submission, following a brief editorial period to correct typographical errors and insert links to relevant resources.
13.6. The WormBase YouTube Channel
WormBase also manages a YouTube channel (https://www.youtube.com/user/WormBaseHD) that provides users with brief instructional videos on the basics of how to use the WormBase website and carry out common query tasks.
Acknowledgements
WormBase is supported by grant #U41 HG002223 from the National Human Genome Research Institute at the US National Institutes of Health, the UK Medical Research Council and the UK Biotechnology and Biological Sciences Research Council. At the time of writing, the WormBase Consortium included Paul W. Sternberg, Paul Kersey, Matthew Berriman, Lincoln Stein, Tim Schedl, Todd Harris, Scott Cain, Sibyl Gao, Paulo Nuin, Adam Wright, Kevin Howe, Bruce Bolt, Paul Davis, Michael Paulini, Faye Rodgers, Matthew Russell, Myriam Shafie, Gary Williams, Juancarlos Chan, Wen J. Chen, Christian Grove, Ranjana Kishore, Raymond Lee, Hans-Michael Müller, Cecilia Nakamura, Daniela Raciti, Gary Schindelman, Mary Ann Tuli, Kimberly Van Auken, Daniel Wang, and Karen Yook.
Footnotes
The members of the WormBase Consortium are listed in the Acknowledgements
References
- 1.Harris TW, Baran J, Bieri T, Cabunoc A, Chan J, Chen WJ, Sternberg PW (2014). WormBase 2014: new views of curated biology. Nucleic Acids Research, 42(Database issue), D789–793. doi: 10.1093/nar/gkt1063 [DOI] [PMC free article] [PubMed] [Google Scholar]
- 2.Howe KL, Bolt BJ, Cain S, Chan J, Chen WJ, Davis P, … Sternberg PW (2016). WormBase 2016: expanding to enable helminth genomic research. Nucleic Acids Research, 44(D1), D774–780. doi: 10.1093/nar/gkv1217 [DOI] [PMC free article] [PubMed] [Google Scholar]
- 3.elegans Sequencing Consortium C. (1998). Genome sequence of the nematode C. elegans: a platform for investigating biology. Science (New York, N.Y.), 282(5396), 2012–2018. [DOI] [PubMed] [Google Scholar]
- 4.Nakamura Y, Cochrane G, Karsch-Mizrachi I, & International Nucleotide Sequence Database Collaboration. (2013). The International Nucleotide Sequence Database Collaboration. Nucleic Acids Research, 41(Database issue), D21–24. doi: 10.1093/nar/gks1084 [DOI] [PMC free article] [PubMed] [Google Scholar]
- 5.Stein LD, Mungall C, Shu S, Caudy M, Mangone M, Day A, … Lewis S (2002). The generic genome browser: a building block for a model organism system database. Genome Research, 12(10), 1599–1610. doi: 10.1101/gr.403602 [DOI] [PMC free article] [PubMed] [Google Scholar]
- 6.Skinner ME, Uzilov AV, Stein LD, Mungall CJ, & Holmes IH (2009). JBrowse: a next-generation genome browser. Genome Research, 19(9), 1630–1638. doi: 10.1101/gr.094607.109 [DOI] [PMC free article] [PubMed] [Google Scholar]
- 7.Gerstein MB, Lu ZJ, Van Nostrand EL, Cheng C, Arshinoff BI, Liu T, … Waterston RH (2010). Integrative analysis of the Caenorhabditis elegans genome by the modENCODE project. Science (New York, N.Y.), 330(6012), 1775–1787. doi: 10.1126/science.1196914 [DOI] [PMC free article] [PubMed] [Google Scholar]
- 8.Altschul SF, Madden TL, Schäffer AA, Zhang J, Zhang Z, Miller W, & Lipman DJ (1997). Gapped BLAST and PSI-BLAST: a new generation of protein database search programs. Nucleic Acids Research, 25(17), 3389–3402. [DOI] [PMC free article] [PubMed] [Google Scholar]
- 9.Camacho C, Coulouris G, Avagyan V, Ma N, Papadopoulos J, Bealer K, & Madden TL (2009). BLAST+: architecture and applications. BMC Bioinformatics, 10, 421. doi: 10.1186/1471-2105-10-421 [DOI] [PMC free article] [PubMed] [Google Scholar]
- 10.Edgar RC (2004). MUSCLE: multiple sequence alignment with high accuracy and high throughput. Nucleic Acids Research, 32(5), 1792–1797. doi: 10.1093/nar/gkh340 [DOI] [PMC free article] [PubMed] [Google Scholar]
- 11.Mitchell A, Chang H-Y, Daugherty L, Fraser M, Hunter S, Lopez R, … Finn RD (2015). The InterPro protein families database: the classification resource after 15 years. Nucleic Acids Research, 43(Database issue), D213–221. doi: 10.1093/nar/gku1243 [DOI] [PMC free article] [PubMed] [Google Scholar]
- 12.Gene Ontology Consortium. (2015). Gene Ontology Consortium: going forward. Nucleic Acids Research, 43(Database issue), D1049–1056. doi: 10.1093/nar/gku1179 [DOI] [PMC free article] [PubMed] [Google Scholar]
- 13.Finn RD, Bateman A, Clements J, Coggill P, Eberhardt RY, Eddy SR, … Punta M (2014). Pfam: the protein families database. Nucleic Acids Research, 42(Database issue), D222–230. doi: 10.1093/nar/gkt1223 [DOI] [PMC free article] [PubMed] [Google Scholar]
- 14.Powell S, Forslund K, Szklarczyk D, Trachana K, Roth A, Huerta-Cepas J, … Bork P (2014). eggNOG v4.0: nested orthology inference across 3686 organisms. Nucleic Acids Research, 42(Database issue), D231–239. doi: 10.1093/nar/gkt1253 [DOI] [PMC free article] [PubMed] [Google Scholar]
- 15.Li H, Coghlan A, Ruan J, Coin LJ, Hériché J-K, Osmotherly L, … Durbin R (2006). TreeFam: a curated database of phylogenetic trees of animal gene families. Nucleic Acids Research, 34(Database issue), D572–580. doi: 10.1093/nar/gkj118 [DOI] [PMC free article] [PubMed] [Google Scholar]
- 16.Vilella AJ, Severin J, Ureta-Vidal A, Heng L, Durbin R, & Birney E (2009). EnsemblCompara GeneTrees: Complete, duplication-aware phylogenetic trees in vertebrates. Genome Research, 19(2), 327–335. doi: 10.1101/gr.073585.107 [DOI] [PMC free article] [PubMed] [Google Scholar]
- 17.The Gene Ontology Consortium. (2017). Expansion of the Gene Ontology knowledgebase and resources. Nucleic Acids Research, 45(D1), D331–D338. doi: 10.1093/nar/gkw1108 [DOI] [PMC free article] [PubMed] [Google Scholar]
- 18.Lee RYN, & Sternberg PW (2003). Building a cell and anatomy ontology of Caenorhabditis elegans. Comparative and Functional Genomics, 4(1), 121–126. doi: 10.1002/cfg.248 [DOI] [PMC free article] [PubMed] [Google Scholar]
- 19.Schriml LM, Arze C, Nadendla S, Chang Y-WW, Mazaitis M, Felix V, … Kibbe WA (2012). Disease Ontology: a backbone for disease semantic integration. Nucleic Acids Research, 40(Database issue), D940–946. doi: 10.1093/nar/gkr972 [DOI] [PMC free article] [PubMed] [Google Scholar]
- 20.Schindelman G, Fernandes JS, Bastiani CA, Yook K, & Sternberg PW (2011). Worm Phenotype Ontology: integrating phenotype data within and beyond the C. elegans community. BMC Bioinformatics, 12, 32. doi: 10.1186/1471-2105-12-32 [DOI] [PMC free article] [PubMed] [Google Scholar]
- 21.Huntley RP, Harris MA, Alam-Faruque Y, Blake JA, Carbon S, Dietze H, … Mungall CJ (2014). A method for increasing expressivity of Gene Ontology annotations using a compositional approach. BMC Bioinformatics, 15, 155. doi: 10.1186/1471-2105-15-155 [DOI] [PMC free article] [PubMed] [Google Scholar]
- 22.Gaudet P, Livstone MS, Lewis SE, & Thomas PD (2011). Phylogenetic-based propagation of functional annotations within the Gene Ontology consortium. Briefings in Bioinformatics, 12(5), 449–462. doi: 10.1093/bib/bbr042 [DOI] [PMC free article] [PubMed] [Google Scholar]
- 23.Huntley RP, Sawford T, Mutowo-Meullenet P, Shypitsyna A, Bonilla C, Martin MJ, & O’Donovan C (2015). The GOA database: gene Ontology annotation updates for 2015. Nucleic Acids Research, 43(Database issue), D1057–1063. doi: 10.1093/nar/gku1113 [DOI] [PMC free article] [PubMed] [Google Scholar]
- 24.Burge S, Kelly E, Lonsdale D, Mutowo-Muellenet P, McAnulla C, Mitchell A, … Hunter S (2012). Manual GO annotation of predictive protein signatures: the InterPro approach to GO curation. Database: The Journal of Biological Databases and Curation, 2012, bar068. doi: 10.1093/database/bar068 [DOI] [PMC free article] [PubMed] [Google Scholar]
- 25.Trapnell C, Williams BA, Pertea G, Mortazavi A, Kwan G, van Baren MJ, … Pachter L (2010). Transcript assembly and quantification by RNA-Seq reveals unannotated transcripts and isoform switching during cell differentiation. Nature Biotechnology, 28(5), 511–515. doi: 10.1038/nbt.1621 [DOI] [PMC free article] [PubMed] [Google Scholar]
- 26.Trapnell C, Roberts A, Goff L, Pertea G, Kim D, Kelley DR, … Pachter L (2012). Differential gene and transcript expression analysis of RNA-seq experiments with TopHat and Cufflinks. Nature Protocols, 7(3), 562–578. doi: 10.1038/nprot.2012.016 [DOI] [PMC free article] [PubMed] [Google Scholar]
- 27.Zhong W, & Sternberg PW (2006). Genome-wide prediction of C. elegans genetic interactions. Science (New York, N.Y.), 311(5766), 1481–1484. doi: 10.1126/science.1123287 [DOI] [PubMed] [Google Scholar]
- 28.Lee I, Lehner B, Crombie C, Wong W, Fraser AG, & Marcotte EM (2008). A single gene network accurately predicts phenotypic effects of gene perturbation in Caenorhabditis elegans. Nature Genetics, 40(2), 181–188. doi: 10.1038/ng.2007.70 [DOI] [PubMed] [Google Scholar]
- 29.Lee I, Lehner B, Vavouri T, Shin J, Fraser AG, & Marcotte EM (2010). Predicting genetic modifier loci using functional gene networks. Genome Research, 20(8), 1143–1153. doi: 10.1101/gr.102749.109 [DOI] [PMC free article] [PubMed] [Google Scholar]
- 30.Rual J-F, Ceron J, Koreth J, Hao T, Nicot A-S, Hirozane-Kishikawa T, … Vidal M (2004). Toward improving Caenorhabditis elegans phenome mapping with an ORFeome-based RNAi library. Genome Research, 14(10B), 2162–2168. doi: 10.1101/gr.2505604 [DOI] [PMC free article] [PubMed] [Google Scholar]
- 31.Kamath RS, Fraser AG, Dong Y, Poulin G, Durbin R, Gotta M, … Ahringer J (2003). Systematic functional analysis of the Caenorhabditis elegans genome using RNAi. Nature, 421(6920), 231–237. doi: 10.1038/nature01278 [DOI] [PubMed] [Google Scholar]
- 32.Culetto E, & Sattelle DB (2000). A role for Caenorhabditis elegans in understanding the function and interactions of human disease genes. Human Molecular Genetics, 9(6), 869–877. [DOI] [PubMed] [Google Scholar]
- 33.Artal-Sanz M, de Jong L, & Tavernarakis N (2006). Caenorhabditis elegans: a versatile platform for drug discovery. Biotechnology Journal, 1(12), 1405–1418. doi: 10.1002/biot.200600176 [DOI] [PubMed] [Google Scholar]
- 34.Giacomotto J, & Ségalat L (2010). High-throughput screening and small animal models, where are we? British Journal of Pharmacology, 160(2), 204–216. doi: 10.1111/j.1476-5381.2010.00725.x [DOI] [PMC free article] [PubMed] [Google Scholar]
- 35.O’Reilly LP, Luke CJ, Perlmutter DH, Silverman GA, & Pak SC (2014). C. elegans in high-throughput drug discovery. Advanced Drug Delivery Reviews, 69–70, 247–253. doi: 10.1016/j.addr.2013.12.001 [DOI] [PMC free article] [PubMed] [Google Scholar]
- 36.Li J, & Le W (2013). Modeling neurodegenerative diseases in Caenorhabditis elegans. Experimental Neurology, 250, 94–103. doi: 10.1016/j.expneurol.2013.09.024 [DOI] [PubMed] [Google Scholar]
- 37.Alexander AG, Marfil V, & Li C (2014). Use of Caenorhabditis elegans as a model to study Alzheimer’s disease and other neurodegenerative diseases. Frontiers in Genetics, 5, 279. doi: 10.3389/fgene.2014.00279 [DOI] [PMC free article] [PubMed] [Google Scholar]
- 38.O’Hagan R, Wang J, & Barr MM (2014). Mating behavior, male sensory cilia, and polycystins in Caenorhabditis elegans. Seminars in Cell & Developmental Biology, 33, 25–33. doi: 10.1016/j.semcdb.2014.06.001 [DOI] [PMC free article] [PubMed] [Google Scholar]
- 39.Blacque OE, & Sanders AAWM (2014). Compartments within a compartment: what C. elegans can tell us about ciliary subdomain composition, biogenesis, function, and disease. Organogenesis, 10(1), 126–137. doi: 10.4161/org.28830 [DOI] [PMC free article] [PubMed] [Google Scholar]
- 40.Lee S-J, Gartner A, Hyun M, Ahn B, & Koo H-S (2010). The Caenorhabditis elegans Werner syndrome protein functions upstream of ATR and ATM in response to DNA replication inhibition and double-strand DNA breaks. PLoS Genetics, 6(1), e1000801. doi: 10.1371/journal.pgen.1000801 [DOI] [PMC free article] [PubMed] [Google Scholar]
- 41.Zheng J, & Greenway FL (2012). Caenorhabditis elegans as a model for obesity research. International Journal of Obesity (2005), 36(2), 186–194. doi: 10.1038/ijo.2011.93 [DOI] [PubMed] [Google Scholar]
- 42.Park K-W, & Li L (2011). Prion protein in Caenorhabditis elegans: Distinct models of anti-BAX and neuropathology. Prion, 5(1), 28–38. [DOI] [PMC free article] [PubMed] [Google Scholar]
- 43.Kibbe WA, Arze C, Felix V, Mitraka E, Bolton E, Fu G, … Schriml LM (2015). Disease Ontology 2015 update: an expanded and updated database of human diseases for linking biomedical knowledge through disease data. Nucleic Acids Research, 43(Database issue), D1071–1078. doi: 10.1093/nar/gku1011 [DOI] [PMC free article] [PubMed] [Google Scholar]
- 44.Amberger JS, Bocchini CA, Schiettecatte F, Scott AF, & Hamosh A (2015). OMIM.org: Online Mendelian Inheritance in Man (OMIM®), an online catalog of human genes and genetic disorders. Nucleic Acids Research, 43(Database issue), D789–798. doi: 10.1093/nar/gku1205 [DOI] [PMC free article] [PubMed] [Google Scholar]
- 45.Bretscher AJ, Kodama-Namba E, Busch KE, Murphy RJ, Soltesz Z, Laurent P, & de Bono M (2011). Temperature, oxygen, and salt-sensing neurons in C. elegans are carbon dioxide sensors that control avoidance behavior. Neuron, 69(6), 1099–1113. doi: 10.1016/j.neuron.2011.02.023 [DOI] [PMC free article] [PubMed] [Google Scholar]
- 46.Smith RN, Aleksic J, Butano D, Carr A, Contrino S, Hu F, … Micklem G (2012). InterMine: a flexible data warehouse system for the integration and analysis of heterogeneous biological data. Bioinformatics (Oxford, England), 28(23), 3163–3165. doi: 10.1093/bioinformatics/bts577 [DOI] [PMC free article] [PubMed] [Google Scholar]
- 47.Kalderimis A, Lyne R, Butano D, Contrino S, Lyne M, Heimbach J, … Micklem G (2014). InterMine: extensive web services for modern biology. Nucleic Acids Research, 42(Web Server issue), W468–472. doi: 10.1093/nar/gku301 [DOI] [PMC free article] [PubMed] [Google Scholar]
- 48.Lyne R, Smith R, Rutherford K, Wakeling M, Varley A, Guillier F, … Micklem G (2007). FlyMine: an integrated database for Drosophila and Anopheles genomics. Genome Biology, 8(7), R129. doi: 10.1186/gb-2007-8-7-r129 [DOI] [PMC free article] [PubMed] [Google Scholar]
- 49.Motenko H, Neuhauser SB, O’Keefe M, & Richardson JE (2015). MouseMine: a new data warehouse for MGI. Mammalian Genome: Official Journal of the International Mammalian Genome Society, 26(7–8), 325–330. doi: 10.1007/s00335-015-9573-z [DOI] [PMC free article] [PubMed] [Google Scholar]
- 50.Balakrishnan R, Park J, Karra K, Hitz BC, Binkley G, Hong EL, … Cherry JM (2012). YeastMine--an integrated data warehouse for Saccharomyces cerevisiae data as a multipurpose tool-kit. Database: The Journal of Biological Databases and Curation, 2012, bar062. doi: 10.1093/database/bar062 [DOI] [PMC free article] [PubMed] [Google Scholar]
- 51.Contrino S, Smith RN, Butano D, Carr A, Hu F, Lyne R, … Micklem G (2012). modMine: flexible access to modENCODE data. Nucleic Acids Research, 40(Database issue), D1082–1088. doi: 10.1093/nar/gkr921 [DOI] [PMC free article] [PubMed] [Google Scholar]
- 52.Rhee DB, Croken MM, Shieh KR, Sullivan J, Micklem G, Kim K, & Golden A (2015). toxoMine: an integrated omics data warehouse for Toxoplasma gondii systems biology research. Database: The Journal of Biological Databases and Curation, 2015, bav066. doi: 10.1093/database/bav066 [DOI] [PMC free article] [PubMed] [Google Scholar]
- 53.Altschul SF, Gish W, Miller W, Myers EW, & Lipman DJ (1990). Basic local alignment search tool. Journal of Molecular Biology, 215(3), 403–410. doi: 10.1016/S0022-2836(05)80360-2 [DOI] [PubMed] [Google Scholar]
- 54.Kent WJ (2002). BLAT--the BLAST-like alignment tool. Genome Research, 12(4), 656–664. doi: 10.1101/gr.229202. Article published online before March 2002 [DOI] [PMC free article] [PubMed] [Google Scholar]
- 55.Angeles-Albores D, N Lee RY, Chan J, & Sternberg PW (2016). Tissue enrichment analysis for C. elegans genomics. BMC Bioi nformatics, 17(1), 366. doi: 10.1186/s12859-016-1229-9 [DOI] [PMC free article] [PubMed] [Google Scholar]
- 56.Altun ZF, Herndon LA, Wolkow CA, Crocker C, Lints R and Hall DH (ed.s) (2002-2017). WormAtlas. http://www.wormatlas.org. Accessed 10 Apr 2017
- 57.Greenwald I (2016). WormBook: WormBiology for the 21st Century. Genetics, 202(3), 883–884. doi: 10.1534/genetics.116.187575 [DOI] [PMC free article] [PubMed] [Google Scholar]


