

Insulin-like growth factor 2 (IGF2) mRNA binding protein 2 (IMP2) was selectively deleted from adult mouse muscle; two phenotypes were observed: decreased accrual of skeletal muscle mass after weaning and reduced wheel-running activity but normal forced treadmill performance. Reduced wheel running occurs when mice are fed a high-fat diet but is normalized when mice consume standard chow.
KEYWORDS: IGF2 mRNA binding protein 2, IGF2BP2, IMP2, autocrine, intramuscular, skeletal muscle, muscle fiber size, Akt1, Gsk3α, eIF2Bε, wheel running, voluntary activity, forced exercise, PPARα, fatty acid oxidation, oxygen consumption rate, central fatigue
ABSTRACT
Insulin-like growth factor 2 (IGF2) mRNA binding protein 2 (IMP2) was selectively deleted from adult mouse muscle; two phenotypes were observed: decreased accrual of skeletal muscle mass after weaning and reduced wheel-running activity but normal forced treadmill performance. Reduced wheel running occurs when mice are fed a high-fat diet but is normalized when mice consume standard chow. The two phenotypes are due to altered output from different IMP2 client mRNAs. The reduced fiber size of IMP2-deficient muscle is attributable, in part, to diminished autocrine Igf2 production; basal tyrosine phosphorylation of the insulin and IGF1 receptors is diminished, and Akt1 activation is selectively reduced. Gsk3α is disinhibited, and S536-phosphorylated ε subunit of eukaryotic initiation factor 2B [eIF2Bε(S536)] is hyperphosphorylated. Protein synthesis is reduced despite unaltered mTOR complex 1 activity. The diet-dependent reduction in voluntary exercise is likely due to altered muscle metabolism, as contractile function is normal. IMP2-deficient muscle exhibits reduced fatty acid oxidation, due to a reduced abundance of mRNA of peroxisome proliferator-activated receptor α (PPARα), an IMP2 client, and PPARα protein. IMP2-deficient muscle fibers treated with a mitochondrial uncoupler to increase electron flux, as occurs with exercise, exhibit reduced oxygen consumption from fatty acids, with higher oxygen consumption from glucose. The greater dependence on muscle glucose metabolism during increased oxygen demand may promote central fatigue and thereby diminish voluntary activity.
INTRODUCTION
The insulin-like growth factor 2 (IGF2) mRNA binding proteins (IGF2BPs or IMP1 to -3) participate in the splicing, transport, translation, and stabilization of a wide variety of RNAs in a transcript- and tissue-specific manner (1). Each protein binds to the leader 3 5′ untranslated region (UTR) of IGF2 mRNA and enables its translation by internal ribosomal entry; in addition, IMPs also bind the 3′ UTRs shared by all IGF2 mRNAs (2, 3). All three Imps are expressed coordinately in the mouse embryo starting at approximately embryonic day 10.5 (e10.5), coincident with the onset of Igf2 action (4). Expression of Igf2, Imp1, and Imp3 in the mouse embryo is largely extinguished before birth, whereas Imp2 is widely expressed postnatally (2).
Genome-wide association studies have identified single nucleotide polymorphisms (SNPs) in the second intron of the human IMP2 gene (e.g., rs4402960) to be associated, in many populations, with an increased risk for type 2 diabetes (5). Male endurance athletes are less likely to have this risk allele than sprint/power athletes and control subjects (6). Inasmuch as the in vivo functions of IMP2 were not known, we characterized the growth and metabolism of mice with global Imp2 deficiency (7). In contrast to Imp1-null mice, Imp2-null mice exhibit a normal birth size and a body weight similar to that of wild-type littermates until weaning; thereafter, however, Imp2-null mice gain less weight on normal chow or on a high-fat diet (HFD), due to slower accumulation of both lean and fat mass. The lower fat mass of Imp2-null mice is especially marked on a high-fat diet and is accompanied by reduced levels of circulating lipids, markedly less liver triglyceride accumulation, and considerably better glucose tolerance and insulin sensitivity. Seeking to understand the basis for the beneficial but complex metabolic effects of global Imp2 deficiency, we have generated and characterized mice with tissue-specific Imp2 deficiency. Here we inquire whether the lower lean mass and greater insulin sensitivity of Imp2-deficient mice is due in part to Imp2 deficiency within skeletal muscle.
Imp2ff mice that bear a Cre recombinase driven by the rat muscle creatine kinase (MCK) promoter (8) exhibit a marked loss of IMP2 expression in postnatal skeletal muscle. Myocyte-specific Imp2 deficiency in males causes two notable phenotypes: as in mice with global Imp2 deficiency, Imp2ff/MCKcre+/− male mice exhibit an approximately 20% decrease in hind limb muscle mass. This is attributable, at least in part, to reduced autocrine production of Igf2, accompanied by a selective decrease in Akt1 activity and reduced protein synthesis. Nevertheless, glucose tolerance and the hypoglycemic effect of insulin are not altered by muscle-specific inactivation of Imp2.
A second, unexpected phenotype was observed: within 1 to 2 weeks of being fed a high-fat diet, Imp2ff/MCKcre+/− mice exhibit a substantial decrease in voluntary physical activity, initially in wheel running and later in ambulatory physical activity, whereas forced exercise capacity and muscle contractile function in vitro are comparable to those of controls. The diminished voluntary activity is dependent on the high-fat diet: the spontaneous activity of Imp2ff/MCKcre+/− mice fed normal chow increases markedly to a level no different from that of the controls. The IMP2-deficient muscle exhibits reduced levels of peroxisome proliferator-activated receptor α (PPARα) (an Imp2 client) RNA and polypeptide and fatty acid oxidation; when challenged with a mitochondrial uncoupler, IMP2-deficient muscle shows reduced oxygen consumption from oleate, whereas oxygen consumption from glucose is increased. We propose that the shift to glucose to sustain increased demands for oxidative metabolism promotes central fatigue and thereby underlies the diminished voluntary physical activity.
RESULTS
Muscle-specific deletion of Imp2.
The construction of a floxed mouse Imp2 allele is described in Materials and Methods and Fig. S1A in the supplemental material. Seeking to simulate the adult-onset skeletal muscle phenotype of Imp2−/− mice using tissue-specific Imp2 deletion, we chose a Cre recombinase driven by the rat MCK promoter. The cross yielded Imp2ff/MCKcre+/− mice at the expected frequency, which appeared healthy through weaning and exhibited grossly normal feeding and activity. Tissues from 8-week-old Imp2ff and Imp2ff/MCKcre+/− mice were extracted and immunoblotted for IMP2; the abundance of IMP2 in extracts of pooled hind limb muscles of Imp2ff/MCKcre+/− mice was markedly reduced compared with Imp2ff muscle (Fig. S1B), which was also confirmed by immunoprecipitation (Fig. S1C). In contrast, Imp2ff/MCKcre+/− cardiac muscle showed a modest reduction in IMP2, and IMP2 polypeptide levels in brain, liver, and spleen were unaltered from those of the controls (Fig. S1B).
Imp2 deficiency in skeletal muscle reduces muscle mass in males but does not alter glucose tolerance or insulin sensitivity.
Male and female Imp2ff and Imp2ff/MCKcre+/− mice were placed on a high-fat diet from weaning, seeking to accentuate any differences in energy metabolism and insulin sensitivity that might exist. A slight decrease in total body weight of male Imp2ff/MCKcre+/− mice is seen starting at ∼8 weeks of age but disappears after 13 weeks of age (Fig. 1A). Also, at ∼8 weeks of age, the lean mass of male Imp2ff/MCKcre+/− mice becomes significantly lower than that of Imp2ff male mice, and this difference is sustained out to 30 weeks of age; at between 24 and 30 weeks of age, their lean mass is approximately 12% lower than that of the controls. In contrast, the fat mass of male Imp2ff/MCKcre+/− mice does not differ from that of the controls. The total body weights and lean and fat masses of female Imp2ff and Imp2ff/MCKcre+/− mice were essentially identical at all ages examined; consequently, further studies were carried out on male mice. The averaged wet weights of the tibialis anterior (TA), gastrocnemius, extensor digitorum longus (EDL), and soleus (SOL), excised at 24 weeks of age, were each reduced compared with the controls, and the combined weight of these hind limb muscles was ∼22% lower in male Imp2ff/MCKcre+/− mice than in the controls, whereas heart weight did not differ significantly (Fig. 1B). The myofiber size in the tibialis anterior at 26 weeks of age stained for laminin B (Fig. 1C), estimated in a blind manner, is distinctly shifted to smaller sizes in Imp2ff/MCKcre+/− mice, with a highly significant reduction in the average myofiber area of 17% (Fig. 1D). Thus, deletion of IMP2 from skeletal muscle late in development reduces muscle mass primarily by a reduction in muscle fiber size; IMP2 is required for optimal gain in the mass of adult skeletal muscle.
FIG 1.

Growth, body composition, and skeletal muscle mass and fiber size in Imp2ff and Imp2ff/MCKcre+/− mice (see Fig. S1 in the supplemental material). (A) Body mass and composition. Eleven pairs of male and eight pairs of female Imp2ff and Imp2ff/MCKcre+/− mice were used. *, P < 0.05. WT, wild type. (B) Organ and skeletal muscle weights as a percentage of total body weight. Tissues were excised from four pairs of male Imp2ff and Imp2ff/MCKcre+/− mice at 24 weeks of age on an HFD. TibAnt, tibialis anterior; ViscAT, viceral adipose tissue; SubQAT, subcutaneous adipose tissue; BrAT, brown adipose tissue; HLmusc, combined hindlimb muscle. (C) Tibialis anterior muscle fibers. Shown are representative images of fibers from 24-week-old HFD-fed males stained with laminin B (red) and DAPI (blue). (D) Distribution of tibialis anterior fiber sizes. Tibialis anterior was isolated from four HFD-fed male Imp2ff (filled symbols) and Imp2ff/MCKcre+/− (open symbols) mice at 24 weeks and processed as described above for panel C. Shown are the distribution of areas (left) and mean areas ± standard errors of the means (SEM). **, P < 0.01.
Blood glucose levels measured randomly at 7 a.m. (not shown), after a 16-h fast (Fig. 2A), or 2 h after refeeding (Fig. 2B) did not differ between Imp2ff and Imp2ff/MCKcre+/− mice. The blood glucose excursions of 16- or 24-week-old male Imp2ff and Imp2ff/MCKcre+/− mice given intraperitoneal (i.p.) glucose (1 mg/g) after a 16-h fast did not differ (Fig. 2C), nor did the hypoglycemic responses to intraperitoneal insulin (0.75 U/kg of body weight) administered 2 weeks later (Fig. 2D). Thus, although skeletal muscle mass is diminished by skeletal muscle-selective deletion of Imp2, whole-body measures of glucose metabolism and insulin sensitivity are unaltered, in contrast to the very pronounced changes seen in mice with global IMP2 deficiency.
FIG 2.
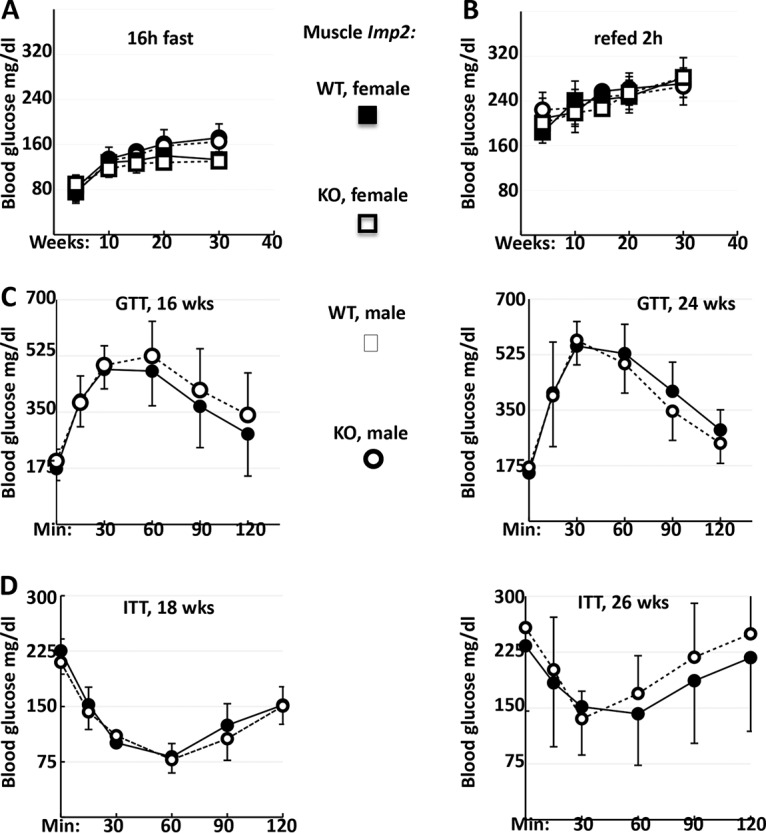
Fasting glucose, glucose tolerance, and insulin tolerance tests. (A and B) Blood glucose levels after fasting for 16 h (A) and 2 h after refeeding (B). Fifteen pairs of male Imp2ff and Imp2ff/MCKcre+/− mice and eight pairs of female Imp2ff and Imp2ff/MCKcre+/− mice were used, all of which were fed an HFD from weaning. (C) Intraperitoneal glucose tolerance tests (GTT). Eight pairs of male Imp2ff and Imp2ff/MCKcre+/− mice were tested at 16 weeks, and 9 pairs were tested at 24 weeks, all of which were fed an HFD from weaning. (D) Insulin tolerance tests (ITT). Eight pairs of male Imp2ff and Imp2ff/MCKcre+/− mice were tested at 18 weeks, and 9 pairs were tested at 26 weeks, all of which were fed an HFD from weaning.
Mice with skeletal muscle IMP2 deficiency fed a high-fat diet show decreased spontaneous physical activity but normal exercise capacity.
Indirect calorimetry, physical activity, and food and water intake were monitored for 8 to 12 pairs of male Imp2ff/MCKcre+/− and Imp2ff mice on an HFD at 5, 10, and 24 weeks of age. The most striking difference is the markedly reduced spontaneous physical activity of the Imp2ff/MCKcre+/− mice, most evident in their voluntary wheel-running behavior. Mice with muscle IMP2 deficiency fed an HFD ran substantially fewer meters on the wheel at 5, 10, and 24 weeks of age (Fig. 3A). At the 5-week time point, Imp2ff/MCKcre+/− mice logged 32.4% fewer meters run per 24 h (Fig. 3A). This reduction is primarily due to less time spent running (Fig. 3B), whereas their average running speed (Fig. 3C) is not significantly different from that of the controls at 10 and 24 weeks and only slightly lower at 5 weeks (P = 0.05). The decreased time spent running on the wheel at 5 weeks reflected mice mounting the wheel fewer times (mean/24 h of 229.2 versus 270.5; P < 0.01) and spending a smaller fraction of their total time on the wheel actually running (62.8% versus 67%; P < 0.001). In addition to diminished voluntary running, the Imp2ff/MCKcre+/− mice fed the HFD also spent significantly more time without any “beam breaking” for periods of 40 s or more (Fig. 3D); inactivity lasting 40 s or more corresponds strongly with electroencephalogram (EEG)-confirmed sleep (9). With the wheel blocked, ambulatory physical activity by the Imp2ff/MCKcre+/− mice also trended low at 5 weeks and was significantly reduced by 10 and 24 weeks of age (Fig. 3E). Energy expenditure (EE) was higher with the wheel in at all ages, especially in the dark. At 5 weeks of age, EE/24 h did not differ by genotype; however, by 10 weeks, EE/24 h was reduced in the Imp2ff/MCKcre+/− mice with the wheel in (Fig. 3F), and by 24 weeks, it was reduced whether the wheel was in or out (Fig. 3F and G). Food intake also trended low in the Imp2ff/MCKcre+/− mice but usually did not reach statistical significance (Fig. S2).
FIG 3.

Indirect calorimetry, voluntary physical activity, and treadmill performance of Imp2ff and Imp2ff/MCKcre+/− male mice (see Fig. S2 in the supplemental material). (A to G) Mice were weaned at 4 weeks and fed thereafter with a normal chow diet (NCD) or a high-fat diet (HFD). After 4 days of acclimation to individual housing in cages containing a running wheel, physical activity and indirect calorimetry were measured starting at 5, 10, and 24 weeks of age, with the wheel being available (4 or 5 days) (A to D and F) or locked (2 or 3 days) (E and G). Values are means ± SEM; P values are shown above the bars (ns, not significant). There were 8 pairs of mice given 5 weeks of an NCD, 12 pairs of mice given 5 weeks of an HFD, 11 pairs of mice given 10 weeks of an HFD, and 9 pairs given an HFD for 24 weeks. (A) Distance covered per 24 h in voluntary wheel running. (B) Percentage of a total 24-h day spent wheel running voluntarily. (C) Mean speed during voluntary wheel running. (D) Percentage of a 24-h day spent not moving for periods of ≥40 s. (E) Distance covered per 24 h in ambulation with the wheel locked. (F) Energy expenditure per 24-h with the running wheel available. (G) Energy expenditure per 24 h with the running wheel locked. (H) Maximal treadmill challenge. Shown are performance and metabolic responses to a peak exercise challenge. The graph shows power demand as a function of time until exhaustion. (Left) Peak blood lactate concentration at exhaustion; (middle) change in the blood glucose concentration from rest to exhaustion; (right) total mechanical work completed by the point of exhaustion (n = 6 pairs of Imp2ff/MCKcre+/− and Imp2ff mice). Data are means ± SEM. (I) Endurance treadmill challenge. Shown are performance and metabolic responses to constant submaximal-power exercise until exhaustion. (Left) Average blood lactate levels sampled every 10 min until exhaustion; (middle) change in blood glucose levels from rest to exhaustion; (right) total mechanical work completed at exhaustion. The graph to the far right shows the time course of blood glucose changes throughout the protocol (n = 4 Imp2ff/MCKcre+/− mice and n = 5 Imp2ff mice). Data are means ± SEM.
If the mice are placed on normal chow after weaning, then at 5 weeks age, there is no significant difference in physical activity between Imp2ff and Imp2ff/MCKcre+/− mice (Fig. 3A). Total wheel distance covered by the Imp2ff mice fed normal chow was slightly (∼4%) but not significantly lower than that covered by mice on the HFD, whereas the number of wheel meters per 24 h logged by the Imp2ff/MCKcre+/− mice fed normal chow increased by 26% over that of the mice on the HFD (P = 0.03), to approach closely that of the Imp2ff mice (Fig. 3A); nonwheel physical activity was also identical. Consistent with their comparable overall physical activity on normal chow, overall energy expenditure (Fig. 3F and G) and food intake (Fig. S2) by the Imp2ff and Imp2ff/MCKcre+/− mice are not significantly different.
In contrast to the reduction in voluntary wheel running exhibited by the Imp2ff/MCKcre+/− mice on an HFD, their exercise capacity is comparable to that of control mice. We employed forced treadmill running to measure both peak exercise capacity and endurance exercise capacity. On a peak exercise protocol (Fig. 3H), Imp2ff/MCKcre+/− mice fed an HFD complete 20.4 J of work prior to exhaustion, similar to controls. Moreover, the peak blood lactate concentration and the change in glucose concentrations from rest to peak exercise were also similar between groups (Fig. 3H). On an endurance exercise protocol (Fig. 3I), Imp2ff/MCKcre+/− mice fed an HFD complete 81 J of work prior to exhaustion, which is also statistically indistinguishable from controls. Blood lactate levels are much lower in the mutant mice on the endurance protocol than in those on the peak protocol (4.2 versus 7.7 mM), and the fall in blood glucose levels postexercise is much greater (−70 mg/dl versus +44 mg/dl). However, these metabolite responses to submaximum exercise are not different between Imp2ff/MCKcre+/− and Imp2ff mice.
In summary, after as little as 1 week of consuming an HFD, the Imp2ff/MCKcre+/− mice exhibit less spontaneous physical activity than Imp2ff littermates; their voluntary wheel runs, although of nearly comparable speeds, are fewer, of a shorter duration, and separated by longer periods of inactivity. In contrast, when mice were fed normal chow, the wheel-running distance of the mice with muscle IMP2 deficiency increased substantially over that of mice on an HFD to levels near those of control mice. If the mice fed an HFD are forced to exercise, the peak and endurance exercise capacities of the Imp2ff and Imp2ff/MCKcre+/− mice are no different. If mice are maintained on the HFD, the lesser voluntary wheel running of the Imp2ff/MCKcre+/− mice persists for up to 6 months, by which time their nonwheel ambulatory activity is also substantially diminished, as is their overall EE.
Effect of IMP2 on the skeletal muscle RNAome and proteome.
Deep sequencing of total RNA (RNA-seq) extracted directly from combined gastrocnemius plus soleus muscles of 3 Imp2ff and 3 Imp2ff/MCKcre+/− mice at 6 weeks of age fed an HFD from weaning, and of RNA retrieved from IMP2 immunoprecipitates (IPs) prepared from extracts of these muscles, identified 13,846 transcripts (see Table S1 in the supplemental material). To identify candidate IMP2 client RNAs, each IP-associated RNA was corrected for abundance in the total extract and divided by the corrected IP value from the IMP2-deficient muscle. This yielded 1,249 transcripts that were ≥2-fold more abundant in the Imp2 IP from Imp2ff muscle and 2,812 transcripts that were ≥1.5-fold more abundant; IGF2 mRNA, e.g., is 2.24-fold enriched. Any significant conclusions concerning relative RNA abundance or the identity of IMP2 client RNAs based on these unfiltered transcriptome-wide sequencing (RNA-seq) results were verified by quantitative PCR (QPCR). The total RNAs in Imp2ff and Imp2ff/MCKcre+/− muscle were compared using gene set enrichment analysis (GSEA) (10). In Imp2ff muscle, the fatty acid metabolism pathway is the most significantly enriched gene set in both the Hallmark and KEGG gene sets, followed in the KEGG set by propanoate metabolism and PPAR signaling (Fig. 4A).
FIG 4.

Relative abundances of selected mRNAs and proteins in the skeletal muscles of Imp2ff and Imp2ff/MCKcre+/− male mice and identification of candidate IMP2 client mRNAs (see Fig. S3 in the supplemental material). (A) mRNA cohorts more abundant in the skeletal muscle of male Imp2ff mice than in Imp2ff/MCKcre+/− mice as assessed by gene set enrichment analysis. The RNA-seq results are shown in Table S1 and reflect RNA extracted directly using Trizol from 6-week-old mice fed an HFD. FDR, false discovery rate; NOM, nominal; FWER, family-wise error rate. (B) Relative abundances of selected flexor digitorum brevis mRNAs encoding proteins involved in fatty acid oxidation. RNA extracted from the FDB of 5 pairs of 6-week-old Imp2ff and Imp2ff/MCKcre+/− male mice fed the HFD was used for QPCR. *, P < 0.05; **, P < 0.01. (C) Relative abundances of selected mRNAs in the gastrocnemius and soleus of Imp2ff and Imp2ff/MCKcre+/− male mice. RNA was extracted from the muscle of 6 pairs of 6-week-old mice fed the HFD; the RNA abundance was measured by QPCR. *, P < 0.05; **, P < 0.01. RNA-seq data are shown in Table S1. (D) Relative abundances of selected proteins extracted from the gastrocnemius and soleus of four pairs of 6-week-old Imp2ff and Imp2ff/MCKcre+/− mice fed an HFD. Quantification was estimated from immunoblots. *, P < 0.05; **, P < 0.01. Polypeptide abundances measured by mass spectroscopy using tandem-mass-tag technology are shown in Table S2. (E) Candidate IMP2 client RNAs. Total RNA and extracts were prepared from the gastrocnemius and soleus of six pairs of Imp2ff and Imp2ff/MCKcre+/− mice. IMP2 was immunoprecipitated from extracts, and the RNA was extracted from each IP. The total extract and IMP2 IP-bound RNAs were quantified by QPCR; IP RNA values were corrected for total RNA abundance. The ratio of the corrected Imp2ff IP RNA to Imp2ff/MCKcre+/− IP RNA is shown. *, P < 0.05; **, P < 0.01. (F) Relative abundances of myosin heavy (Myh) chain RNAs in hind limb muscles of Imp2ff and Imp2ff/MCKcre+/− mice. RNA abundance was measured by QPCR for Myh1, -2, -4, and -7, and the percentage of each Myh RNA as a fraction of the sum is shown (P < 0.05 for values in red).
Quantitative estimates of relative polypeptide abundances in Imp2ff and Imp2ff/MCKcre+/− muscle using mass spectroscopy (MS) with tandem-mass-tag technology showed very modest differences among the 2,950 polypeptides identified (Table S2). Levels of 9 polypeptides were ≥1.5-fold higher in Imp2ff muscle, and levels of 5 polypeptides were ≥1.5-fold higher in Imp2ff/MCKcre+/− muscle. Comparing the proteomes by GSEA confirmed a highly significant enrichment in the Imp2ff muscle of the Hallmark fatty acid metabolism gene set and a comparably significant enrichment of the oxidative phosphorylation set (Fig. S3) (which share 15% to 19% overlap); the latter enrichment was not evident in GSEA of the transcriptome.
Guided by the genome-wide results, we used QPCR (Fig. 4B and C) and protein immunoblotting (Fig. 4D) to evaluate the relative abundances of specific RNAs and polypeptides in extracts of gastrocnemius plus soleus. The relative abundance of PPARα mRNA is decreased by 56% in Imp2-deficient muscle (Fig. 4C), and the abundances of all 11 mRNAs encoding PPARα gene targets (Fig. 4B) were reduced by 10% to 60%, 7 to a statistically significant extent. Notably, after correction for total RNA levels, the abundance of PPARα mRNA in the IMP2 IP from the Imp2ff muscle extract is enriched ∼6-fold over that in the IMP2 IP from Imp2ff/MCKcre+/− muscle (Fig. 4E); thus, PPARα mRNA is an Imp2 client. RNA-seq indicated that IMP2 deficiency caused a modest reduction in RNAs of the slower myosins Myh7 and Myh2, accompanied by an increase in Myh1 and/or Myh4 RNA, and this was fully confirmed by QPCR (Fig. 4C). Examination of Myh RNA expression in five individual hind limb muscles showed that IMP2 deficiency caused a relative decrease in Myh7 and/or Myh2 RNAs, accompanied by an increase in Myh1 and/or Myh4 RNA in each (Fig. 4F). The Myh1, -2, -4, and -7 mRNAs are likely IMP2 clients; corrected for total RNA abundance, each of these RNAs is 1.7- to 2.5-fold enriched in the IMP2 IPs from Imp2ff muscle (Fig. 4E). QPCR and immunoblot analysis of a variety of mitochondrial components and regulators of mitochondrial abundance did not show statistically significant differences, apart from a 1.4-fold-higher abundance of Nrf1 polypeptide in Imp2ff muscle. The similar mitochondrial abundance is further supported by the comparable ratios of mitochondrial DNA to nuclear DNA in the soleus (Fig. S4) and the relative abundances of citrate synthase polypeptide (Table S2).
Skeletal muscle contractile function.
Muscle contractility was measured using extensor digitorum longus (EDL), a predominately fast fiber type, glycolytic muscle, and the soleus (SOL), a mixed-fiber-type, oxidative muscle, isolated at 5 to 6 weeks of age from mice fed the HFD.
Muscles were stimulated with pulse trains at frequencies ranging from 20 to 350 Hz. As a group, EDL muscles produced 60% higher absolute peak force than SOL muscles, but within each muscle group, Imp2ff and Imp2ff/MCKcre+/− mice produced similar tetanic forces both in absolute terms (Fig. 5A, left) and on a unit physiological cross-sectional area (pCSA) basis (Imp2ff and Imp2ff/MCKcre+/− SOL, 259 ± 13 and 259 ± 9 kPa, respectively; Imp2ff and Imp2ff/MCKcre+/− EDL, 226 ± 11 and 230 ± 11 kPa, respectively). Likewise, the twitch forces produced by each muscle group were similar between Imp2ff and Imp2ff/MCKcre+/− mice. Finally, the inflection points of the force-frequency relationships, as well as their slope, did not differ between Imp2ff and Imp2ff/MCKcre+/− EDL muscles or between Imp2ff and Imp2ff/MCKcre+/− SOL muscles.
FIG 5.

Contractile performance in vitro, mitochondrial fatty acid oxidation, and utilization of glucose and oleate for oxidative metabolism by isolated, intact fibers from the muscles of Imp2ff and Imp2ff/MCKcre+/− male mice (see Fig. S4 in the supplemental material). (A) Contractile properties of extensor digitorum longus (EDL) and soleus (SOL) muscles. (Left) Force-frequency relationship and peak force of EDL (n = 8) and SOL (n = 8) muscles isolated from Imp2ff and Imp2ff/MCKcre+/− 6- to 8-week-old male mice on an HFD. There are no genotype differences in the inflection point or the slope of the fitted force-frequency relationships for the EDL or SOL, and the twitch force and peak tetanic force are also not different. P values were all between 0.29 and 0.87. (Right) Fatigue responses of EDL and SOL muscles. Force is expressed relative to the peak force attained during the first stimulus train; only data from the first train and the subsequent even-numbered trains are plotted. There are no differences in the final relative forces of Imp2ff (n = 5) versus Imp2ff/MCKcre+/− (n = 7) EDL muscles (P = 0.22) or SOL muscles (P = 0.91). Data are means ± standard deviations (SD). (B) Oxidation of [1-14C]palmitate by mitochondrial fractions from the liver, heart, and hind limb muscles of Imp2ff and Imp2ff/MCKcre+/− mice. Mice 6 to 8 weeks of age were fed an HFD. The data shown are combined from six experiments, each with six replicate assays, using mitochondria prepared from the pooled tissues of 2 mice of each genotype. ASM, acid-soluble metabolites generated by oxidation of [1-14C]palmitate. Data are means ± SEM. +, P < 0.05; *, P = 0.02; **, P < 0.01. (C) Oxygen consumption from glucose (15 mM) or oleate (0.5 mM) by isolated fibers from the flexor digitorum brevis (FDB) of Imp2ff and Imp2ff/MCKcre+/− male mice. In six experiments, the oxygen consumption of individual FDB fibers isolated from 5- to 6-week-old male Imp2ff (top panels) and Imp2ff/MCKcre+/− (bottom panels) mice, fed either an NCD (left) or HFD (right) from weaning, was measured in replicates during incubations under the following five conditions (conditions 2 to 5 all include glucose [2.5 mM] and FFA-poor BSA [6.7 mg/ml]): (i) glucose (15 mM), (ii) BSA with oleate (0.5 mM), (iii) BSA with oleate (0.5 mM) plus etomoxir (ETO) (40 μM), (iv) BSA, and (v) BSA plus etomoxir (40 μM). After 45 min of basal incubation, oligomycin at 2.5 mg/ml was added, followed by FCCP at 1.5 μM at 65 min (NCD) or 75 min (HFD) and antimycin A (4 μM) plus rotenone (2 μM) at 90 min (NCD) or 105 min (HFD). Oxygen consumption over each interval is shown (±SEM). (D) Maximal oxygen consumption from glucose (15 mM) or oleate (0.5 mM) by isolated FDB fibers from Imp2ff and Imp2ff/MCKcre+/− male mice. Using the data shown in panel C, the maximal rate of oxygen consumption from glucose was calculated as the mean value after FCCP addition minus the OCR after addition of antimycin A plus rotenone; the maximal OCR for oleate was calculated as FCCP plus oleate minus FCCP plus etomoxir plus oleate. *, P < 0.02; **, P < 0.01.
To test whether Imp2ff/MCKcre+/− muscles responded differently to repetitive contractions, muscles were stimulated with trains of tetanic stimulation in order to reduce force 30% to 40%. As illustrated in Fig. 5A, right, Imp2ff and Imp2ff/MCKcre+/− EDLs lost force at similar rates when subjected to fatiguing stimulation. A fatigue protocol of a longer duration was required to reduce the force of SOL muscles, but again, there was no difference in the responses of Imp2ff and Imp2ff/MCKcre+/− muscles.
In summary, there was no evidence that glycolytic or oxidative Imp2ff/MCKcre+/− muscles had an impaired ability to produce force across a wide range of stimulation frequencies, nor was there any evidence that they experienced an excessive loss of force in response to fatiguing stimulation.
Fatty acid oxidation (FAO).
Mitochondria were isolated from hind limb skeletal muscle, heart, and liver of Imp2ff and Imp2ff/MCKcre+/− mice, and their ability to catalyze cleavage of [1-14C]palmitate in vitro was measured (Fig. 5B). The generation of 14CO2 by mitochondria from IMP2-deficient hind limb skeletal muscle was diminished by 23% (P < 0.01), and that of 14C acid-soluble metabolites was diminished by 16% (P = 0.02). Mitochondria from Imp2ff/MCKcre+/− heart showed a nonsignificant trend toward diminished [1-14C]palmitate oxidation, whereas mitochondria from the livers of Imp2ff/MCKcre+/− mice generated 16% more 14CO2 (P = 0.04) than Imp2ff liver mitochondria but similar amounts of 14C acid-soluble metabolites.
Muscle oxygen consumption from glucose and fatty acid.
Oxygen consumption in vitro in response to glucose and oleate was determined using single fibers isolated from the flexor digitorum brevis (FDB) muscles (11) of Imp2ff and Imp2ff/MCKcre+/− mice (Fig. 5C and D). The rate of O2 utilization shows the expected variations in response to oligomycin, FCCP [carbonyl cyanide 4-(trifluoromethoxy) phenylhydrazone], and complex I and complex IV inhibitors, whether the substrate provided is glucose (15 mM) or oleate (0.5 mM, bound to free fatty acid [FFA]-poor bovine serum albumin [BSA]). The most clear-cut finding is that in the presence of the uncoupling agent FCCP, at the substrate concentrations provided, Imp2ff fibers show higher maximal O2 consumption from oleate than from glucose, whereas Imp2ff/MCKcre+/− fibers show higher O2 consumption from glucose. This pattern was seen whether the mice were fed normal chow or the HFD (Fig. 5C). Regarding absolute levels of nutrient-dependent O2 consumption, the Imp2ff FDB fibers show an O2 consumption rate (OCR) from 0.5 mM oleate (FCCP plus oleate minus FCCP plus etomoxir plus oleate) similar to that from 15 mM glucose (FCCP stimulation minus CX1 and CX4 inhibitors), whether the mice were fed the normal chow diet (NCD) or the HFD (Fig. 5D, filled bars). In contrast, the Imp2ff/MCKcre+/− fibers (Fig. 5D, open bars) consistently show higher rates of O2 consumption from glucose, and on the HFD, their OCR from 0.5 mM oleate is ∼40% lower than that of the Imp2ff fibers, and their rate of glucose utilization is about 40% higher. These findings indicate that IMP2-deficient fibers are limited relative to IMP2-replete fibers in their ability to utilize fatty acids compared with glucose to support O2 consumption under conditions of high electron flux, consistent with the reduced FAO activity in Imp2ff/MCKcre+/− muscle measured directly. The diet-independent increase in maximal OCR from glucose by the Imp2ff/MCKcre+/− fibers is as yet unexplained; although polypeptide levels of the pyruvate dehydrogenase (PDH) complex as well as PDK4 and PDP1/PDPR in Imp2ff/MCKcre+/− muscle are comparable to those in Imp2ff muscle (see Table S2 in the supplemental material), the reduced rate of FAO may reduce the acetyl coenzyme A (CoA)/CoASH and/or NADH/NAD+ ratios sufficiently to reduce PDK4 activity and activate PDH.
Imp2ff/MCKcre+/− skeletal muscle exhibits decreased intramuscular IGF2 polypeptide and reduced protein synthesis.
The lower rate of accrual of muscle mass in Imp2ff/MCKcre+/− mice ultimately reflects a lower rate of protein synthesis and/or a higher rate of protein degradation (12, 13). The steady-state level of muscle protein synthesis in vivo was estimated directly by the incorporation of puromycin into muscle proteins 30 min after its i.p. injection (14). The level of puromycin incorporation (Fig. 6A), normalized for total protein, is ∼30% lower in the muscle of Imp2ff/MCKcre+/− mice than with Imp2ff muscle. Protein degradation was not measured directly; however, no significant alterations in the key regulators are evident from RNA-seq or proteomic analysis; the abundances of the RNAs encoding the E3 ubiquitin ligase components Fbxo32/atrogin-1 (of MAF-bx1) and Trim63/MuRF1 (15) are slightly higher in Imp2ff muscle (Table S1), and the abundances of the Asb2 (an E3 ligase and major downstream effector of myostatin’s antihypertrophic action [16]) (see Table S2 in the supplemental material), MAFbx, and MuRF1 polypeptides are essentially identical (Fig. 6B), as are the abundances of the key autophagic regulators Map1LC3b and Gabarap (Table S2).
FIG 6.

Overall protein synthesis, relative abundances of selected polypeptides, and relative polysomal abundances of selected mRNAs in muscles of Imp2ff and Imp2ff/MCKcre+/− male mice. (A) Steady-state levels of puromycin incorporation into muscle protein. Twelve pairs of anesthetized 6- to 8-week-old Imp2ff and Imp2ff/MCKcre+/− male mice on an HFD were injected i.p. with puromycin, and muscles were harvested 30 min thereafter. After extraction and SDS-PAGE of aliquots containing 50 μg protein, an immunoblot for puromycin and rpL26 (left) was stained with Coomassie blue (right). Incorporation of puromycin was quantitated (bar graph) (±SEM); *, P = 0.02. (B) MAFbx and MuRF1 polypeptide levels in Imp2ff and Imp2ff/MCKcre+/− muscle. Shown are data for combined extracts of gastrocnemius and soleus from 5 pairs of mice. (C) IGF1 and IGF2 polypeptide levels in the serum and extracts of perfused muscle of Imp2ff and Imp2ff/MCKcre+/− mice. Nine pairs of mice were taken at weaning. Data are means ± SEM. (D) Total and polysomal abundances of selected mRNAs in muscle of Imp2ff and Imp2ff/MCKcre+/− mice. A representative polysome profile from gastrocnemius and soleus is shown (left). Total RNA was prepared from the muscle extract used for polysome isolation. Selected total and polysome-associated muscle mRNAs were analyzed by QPCR; the data are from four pairs of 6-week-old mice on an HFD.
The major determinants of the overall protein synthetic rate in skeletal muscle are nutritional intake, physical activity, stress (especially inflammatory), and the insulin-like growth factors. Food intake (on the HFD) and stress do not differ between these genotypes; reduced physical activity of Imp2ff/MCKcre+/− mice occurs only when mice are fed the HFD, whereas reduced accrual of muscle mass with IMP2 deficiency occurs regardless of diet. IGF1 polypeptide levels in the serum and in the exsanguinated, perfused muscle of Imp2ff and Imp2ff/MCKcre+/− mice were not different, nor were serum levels of IGF2. In contrast, the level of IGF2 polypeptide in the exsanguinated muscle of Imp2ff/MCKcre+/− mice is 37% lower (P = 0.03) than in Imp2ff muscle (Fig. 6C). Inasmuch as the IGF2 mRNA level (estimated by QPCR within the coding sequence) is similar to or slightly higher than that in Imp2ff/MCKcre+/− muscle, it is likely that the decrease in the intramuscular IGF2 polypeptide level is attributable to a translational or posttranslational mechanism.
The fractional abundance of IGF2 mRNA on polysomes reflects the relative rates of mRNA initiation and elongation, and with rare exception, initiation is rate limiting. In assessing IGF2 mRNA polysomal abundance, as noted above, the level of 18S and 28S rRNAs per gram (wet weight) is slightly higher in Imp2ff than in Imp2ff/MCKcre+/− muscle; however, the fractions of 18S and 28S rRNAs retrieved in polysomes in Imp2ff and Imp2ff/MCKcre+/− muscle are very similar (for 18S, Imp2ff = 36.6% and Imp2ff/MCKcre+/− = 37.9%; for 28S, Imp2ff = 68.3% and Imp2ff/MCKcre+/− = 64.6%). In contrast, the fractional polysomal abundance of IGF2 mRNA in Imp2ff/MCKcre+/− muscle is 68% of that of Imp2ff muscle (P < 0.001), whereas that of a random selection of other low-abundance mRNAs (Cux2, Lbx2, Npff, Slc16a9, Uqqc2, Adora2b, and Lars2) ranges from 0.92 (Cux2) (P = 0.03) to 1.06, and that of the highly abundant Gapdh mRNA is 97% (Fig. 6D, white bars). Thus, the reduction in the amount of intramuscular IGF2 polypeptide is due to a relatively selective reduction in the rate of IGF2 mRNA translational initiation. Inasmuch as IGF2 mRNA is a direct client of Imp2, it is likely that the lack of IMP2 is directly responsible for the reduced IGF2 mRNA translation.
Imp2ff/MCKcre+/− muscle exhibits reduced activation of IGF1R and Akt1, disinhibition of Gsk3α, and increased eIF2bε(S536P), but mTOR complex 1 signaling is unaltered.
Immunoblots of the IGF1R and insulin receptors in extracts prepared from hind limb muscles show that the abundances of the receptor beta subunits are not different; however, immunoblotting of immunoprecipitated receptors indicates that the phosphotyrosine (PY) content of both receptor beta subunits is reduced by 35% to 40% (P < 0.05) (Fig. 7A). IRS1 and -2 polypeptide levels determined by MS or immunoblotting of muscle extracts are not different; however, PY-IRS1 and -2 levels are ∼20% lower (P = 0.059). Akt1 and -2 polypeptide levels are also not different; however, phosphorylations of Akt(Ser308) and Akt(Ser473) are both significantly reduced in Imp2ff/MCKcre+/− muscle (Fig. S5A). Mice lacking Akt1 or Akt2 exhibit very different phenotypes: Akt1 deficiency results in diminished overall organismal growth with preserved insulin sensitivity (17), whereas Akt2 deficiency results in lipodystrophy, hyperglycemia, and greatly diminished insulin sensitivity (18, 19). We therefore examined the phosphorylation of each isoform separately (Fig. 7B): for Akt1, both activating phosphorylations are greatly reduced, whereas Akt2(Ser308) phosphorylation is not significantly altered, and Akt2(Ser473) phosphorylation shows a 20% reduction (P = 0.04).
FIG 7.

Abundances and activation states of elements in the pathway from InsR and IGF1R to mRNA translation in the skeletal muscle of Imp2ff and Imp2ff/MCKcre+/− mice (see Fig. S5 in the supplemental material). (A) Overall abundances and tyrosine phosphorylation of InsR and IGF1R in muscle from Imp2ff and Imp2ff/MCKcre+/− mice. Tissues were obtained from four or more pairs of mice in panels A to E. (B) Overall abundances and phosphorylation of Akt1 and Akt2 in muscle from Imp2ff and Imp2ff/MCKcre+/− mice. (C) Overall abundances and phosphorylation of S6K1 and 4E-BP (top) and overall abundance of eIF4E and amount of bound 4E-BP (bottom) in muscle from Imp2ff and Imp2ff/MCKcre+/− mice. The top bar graphs show the phosphorylation of sites on S6K1 and 4E-BP corrected for polypeptide abundance; immunoblots are shown in Fig. S4B in the supplemental material. In the bottom section, eIF4E was isolated by affinity chromatography on 7-MeGTP–Sepharose; the extract and 7-MeGTP eluate were immunoblotted for eIF4E and 4E-BP. (D) Overall abundances and phosphorylation of Gsk3α and Gsk3β in muscle from Imp2ff and Imp2ff/MCKcre+/− mice. (E) Overall abundances of eIF2B and phosphorylation of the eIF2Bε(Ser536) inhibitory site in muscle from Imp2ff and Imp2ff/MCKcre+/− mice. *, P < 0.05; **, P < 0.01 (for all parts).
Akt is the major effector of the ability of IGFs to promote overall protein synthesis, acting predominantly by two outputs (20). Akt phosphorylates TSC2, which enhances Rheb GTP charging to activate mTOR complex 1; in addition, Akt phosphorylates and inhibits Gsk3, reducing Gsk3-catalyzed inhibitory phosphorylation of the ε subunit of eukaryotic initiation factor 2B (eIF2Bε) at Ser536, and eIF2B, the GTP exchange factor for eIF2α, promotes the formation of the complex. Regarding mTORC1 activity, the muscles of Imp2ff and Imp2ff/MCKcre+/− mice exhibit no differences in the phosphorylation of mTORC1 downstream targets, i.e., 4E-BP (Thr37/Thr46/Ser65), S6K1 (Thr389), or rpS6 (Ser240/244) (Fig. 7C and Fig. S5B). Similarly, there are no differences in the abundances of the 4E-BP1 and eIF4E polypeptides or in the amount of 4E-BP recovered with eIF4E retained by 7-methyl-GTP (7-MeGTP)–Sepharose (Fig. 7C); thus, the availability of eIF4E for incorporation into eIF4F is unaltered. The abundances of Foxo1 and Foxo3 are not altered by elimination of IMP2 (Fig. S5A), and although Akt phosphorylation at the inhibitory sites [Foxo1(S256)/Foxo3(S253)] is modestly diminished (Fig. S5A and S5C), so is the activating AMPK-catalyzed phosphorylation at S413 (Fig. S5A and S5C); the effects of these FoxO modifications are likely offsetting inasmuch as atrogin-1 and MuRF mRNA levels are unaltered (Fig. 6B). The major effect of reduced Akt1 activity is on the Akt-catalyzed inhibitory phosphorylation of Gsk3 (Fig. 7D); whereas Gsk3β(Ser9) phosphorylation is not different, the corresponding phosphorylation of Gsk3α(Ser21) is reduced by ∼50%, pointing to higher activity of Gsk3α in Imp2ff/MCKcre+/− muscle. Most importantly, the Gsk3-catalyzed, inhibitory phosphorylation of eIF2Bε(S536) is increased more than 3-fold in Imp2ff/MCKcre+/− muscle over Imp2ff muscle (Fig. 7E), and the phosphorylation of eIF2Bε(Ser540) is increased ∼40% (Fig. S5D); the latter modification, catalyzed by DYRK1/2 (21), creates a binding site for Gsk3, which primes its inhibitory phosphorylation of eIF2Bε at Ser536 (22, 23).
In summary, deletion of IMP2 from mouse skeletal muscle reduces muscle protein synthesis by ∼30%. This is attributed to a reduction in autocrine IGF2 polypeptide production. Decreased IGF2 action is reflected in diminished activation of Akt1 (but not Akt2). Although the activity of the Akt targets mTORC1 and FoxO1/3 are not significantly altered, a clear-cut decrease in the inhibitory phosphorylation of Gsk3α (but not Gsk3β) is evident, and the Gsk3-catalyzed inhibitory phosphorylation of eIF2Bε(S536) as well as the phosphorylation of the Gsk3 “priming” site on eIF2Bε are increased in the muscle of Imp2ff/MCKcre+/− mice. These modifications indicate that a decrease in the activity of eIF-2B is the basis for the diminished overall muscle protein synthesis.
DISCUSSION
Inactivation of the RNA binding protein Imp2 in the skeletal muscle of male mice results in significant reductions in muscle mass and in spontaneous physical activity, the latter only when mice are fed a high-fat diet. We sought to define the mechanisms underlying these phenotypes.
Imp2 promotes accrual of muscle mass in part by autocrine production of IGF2.
Muscle mass in the adult reflects the number of muscle fibers, established by myogenesis during development, and their accrual of mass after birth. Imp2 has been proposed to contribute to myogenesis as a transcriptional target and proliferative effector of the DNA binding protein HMGA2; Imp2 can partially rescue the diminished proliferation of HMGA2-null myoblasts (24, 25). Myogenesis in the mouse is largely completed prenatally, and the number of myofibers does not increase after postnatal day 7 (p7), although the number of nuclei/myofiber increases somewhat until p21 (26, 27). In sedentary, uninjured mice, satellite cells, the adult muscle stem cells, are dispensable for the maintenance of muscle mass (28). Here we show that postdevelopmental inactivation of Imp2 with late-acting MCK-Cre results in a 22% decrease in hind limb muscle mass of males at 24 weeks of age, with a diminution in overall lean mass evident by 8 weeks of age. Global Imp2 inactivation decreases overall lean mass by ∼24%, which also becomes evident starting at 8 weeks of age, without a change in the ratio of hind limb muscle weight to total body weight; assuming that this indicates a 24% reduction in muscle mass, it appears that the predominant impact of global Imp2 inactivation is on the postnatal accrual of muscle mass rather than on myogenesis. Consistent with this is the finding that muscle fiber area in Imp2ff/MCKcre+/− mice is reduced by ∼17%. The reduced accrual of mass in the Imp2ff/MCKcre+/− muscle indicates an altered balance between protein synthesis and degradation: protein synthesis, measured as puromycin incorporation into nascent muscle proteins in vivo (14), is reduced by ∼30% in Imp2ff/MCKcre+/− muscle, whereas the abundances of the central ubiquitin ligases MuRF1 and atrogin-1 are not different. Thus, IMP2 deficiency in muscle causes a reduced rate of overall protein synthesis, which is the likely basis for the reduced muscle mass; however, direct measurements of protein turnover are lacking, so contributions from altered rates of proteosomal or autophagic protein degradation cannot be entirely disregarded.
The growth factor IGF2 is an obvious candidate as the IMP2-dependent regulator of muscle mass. The role of IGF2 as an autocrine/paracrine skeletal muscle growth factor has been previously established in adult pigs by the work of Andersson (29), who identified a SNP in intron 3 of the porcine IGF2 gene as a paternally expressed expression quantitative trait locus (eQTL) responsible for the increased muscle growth of domesticated pigs (30); the SNP disrupts the binding site for ZBED6, a tissue-specific repressor of IGF2 expression, resulting in a 3-fold increase in the level of IGF2 specifically in postnatal skeletal muscle (31). In the mouse, the decrease of serum IGF2 to nearly undetectable levels within a few weeks after birth (32, 33) led to the view that IGF2 does not contribute to postnatal growth in this species, a function largely ascribed to IGF1. The present results demonstrate that the level of the IGF2 polypeptide in mouse hind limb muscle is approximately 1,000-fold higher than that in mouse blood and similar to the level of intramuscular IGF1. Notably, IGF2 abundance within muscle is reduced in the absence of IMP2; moreover, despite the unaltered levels of serum and intramuscular IGF1, activation of IGF1R and insulin receptor (probably INSR-A, a major INSR isoform in rodent skeletal muscle [34]) and downstream signaling is significantly attenuated in the absence of IMP2, concomitant with significant reductions in the rate of overall protein synthesis and muscle mass. This provides strong evidence that IGF2 is serving as an autocrine growth factor in the skeletal muscle of the adult mouse.
Akt1 drives muscle protein synthesis via Gsk3α and eIF2B independently of mTOR complex 1.
The present data demonstrate that in IMP2-deficient muscle, the activation state of Akt1 is markedly reduced, whereas the activation state of Akt2 is largely preserved. The concomitant reduction in muscle mass with preserved glucose tolerance is consistent with the phenotypes observed for mice lacking Akt1 compared with Akt2; the former mice exhibit a reduced body size with preserved (and possibly enhanced) insulin sensitivity (17), whereas Akt2-deficient mice exhibit marked insulin resistance and overt hyperglycemia without growth retardation (18, 19). Unexpectedly, however, the pathway from Akt1 to the regulation of protein synthesis identified here does not appear to involve the activation of mTOR complex 1 (35, 36); in IMP2-deficient muscle, despite a 30% decrease in the rate of overall protein synthesis, there is no difference from control muscle in S6 or 4E-BP phosphorylation or in the association of 4E-BP with eIF4E. Rather, it is the Akt-catalyzed inhibitory phosphorylation of Gskα(Ser21) [but not Gsk3β(Ser9)] that is reduced in IMP2-deficient muscle. Gsk3 is known to catalyze an inhibitory phosphorylation of eIF2Bε(Ser536) (22, 37), a modification dependent on a priming phosphorylation at Ser540, the latter of which is catalyzed by DYRK kinases (21). We observe a major increase in eIF2Bε(S536) phosphorylation as well as increased phosphorylation of the Gsk3 priming site at S540 in IMP2-deficient muscle. Overexpression of eIF2Bε alone is sufficient to increase cap-dependent translation in myoblasts and myofiber hypertrophy in the mouse in vivo (38). We conclude, therefore, that reduced activation of Akt1 decreases the inhibitory phosphorylation of Gsk3α, whose increased activity, aided by the increased phosphorylation of the eIF2bε DYRK site, hyperphosphorylates and inhibits eIF2B activity and reduces overall protein synthesis in IMP2-deficient mouse skeletal muscle.
Although it is likely that the modest reduction in autocrine IGF2 production in Imp2ff/MCKcre+/− muscle contributes to the reduced activation of Akt1, it seems equally likely that other contributory factors remain to be discovered. We have not identified other examples of selective regulation of Akt1 occurring downstream of the insulin or IGF1 (or any) receptors; such selectivity may reflect the presence in mouse skeletal muscle of an as-yet-unknown scaffold that couples these receptors to Akt1. The selective decrease in Gsk3α amino-terminal phosphorylation accompanying the reduction of Akt1 activation was also unexpected and, to our knowledge, unprecedented.
IMP2 promotes fatty acid oxidation by increasing PPARα abundance.
Gene set enrichment analysis of the RNA-seq data indicated a broad reduction in the abundances of mRNAs concerned with fatty acid metabolism and PPARα action (39) and in the levels of mitochondrial fatty acid oxidation pathway components, confirmed by direct assays (Fig. 4C and Fig. 5B), as well as Fabp3/4, lipid droplet proteins, Cpt1b/2, and the FFA transporters Fatp1/Slc27a1 and CD36; the latter may be particularly consequential, inasmuch as cellular uptake of FFA can be rate limiting for utilization during submaximal exercise (40, 41). Many of these reductions are likely attributable to the reduced abundance of PPARα itself, whose mRNA is an IMP2 client. Functional evidence indicating impaired utilization of FFA by IMP2-deficient muscle is provided by the finding that, regardless of prior diet, Imp2ff FDB fibers utilize oleate (0.5 mM) more effectively than glucose (15 mM) as oxidative fuel, whereas Imp2ff/MCKcre+/−-derived FDB fibers show the opposite pattern, i.e., approximately ≥50% higher O2 consumption from 15 mM glucose than from 0.5 mM oleate. The higher maximal oxygen utilization from glucose by Imp2ff/MCKcre+/− FDB fibers than by Imp2ff fibers indicates that the lower maximal oxygen utilization from oleate by Imp2ff/MCKcre+/− FDB fibers is not due to a limitation in their oxidative phosphorylation (OXPHOS) pathway but rather is due to a limitation in the ability of oleate oxidation to generate electron flow into OXPHOS. Clearly, the preference of Imp2ff/MCKcre+/− muscle for glucose as oxidative fuel in vitro is not sufficient per se to alter glucose tolerance in vivo; however, combined with the increased energy expenditure and reduced adiposity of mice with global Imp2 knockout (KO), the preferential utilization of glucose by IMP2-deficient muscle may contribute to the enhanced glucose tolerance of mice with global IMP2 deficiency (7).
Imp2ff/MCKcre+/− mice fed a high-fat diet exhibit a modest decrease in overall energy expenditure as they age relative to Imp2ff mice (Fig. 3F), which is evident even in mice without access to a running wheel (Fig. 3G); whether this is entirely attributable to their modest reduction in muscle mass and whether the decreased energy expenditure occurs if mice are fed normal chow are unknown. The modest increases in the levels of the fast myosin isoforms Myh1 and -4 relative to the slower myosins Myh7 and -2 in Imp2ff/MCKcre+/− mice are not accompanied by altered contractile function, measured in vitro.
IMP2 deficiency combined with a high-fat diet impairs voluntary wheel running but not exercise capacity.
Mice like to run (42), and given access to a wheel, the distance that mice will run during every 24-h period is highly repeatable (43). The age-dependent pattern of spontaneous wheel running exhibited by the Imp2ff control mice was similar to those in previous reports, reaching a peak at 8 to 12 weeks of age and declining steadily thereafter. Imp2ff/MCKcre+/− mice fed a high-fat diet (whether for 1 to 2, 6, or 24 weeks) logged much smaller distances on the wheel than similarly fed Imp2ff mice. Mice with muscle IMP2 deficiency initiated runs less often, covered shorter distances per run, and took more-frequent and longer pauses between runs. Although the hind limb muscle mass at 24 weeks of age was ∼20% lower in Imp2ff/MCKcre+/− mice than in Imp2ff mice, both genotypes exhibited the same average wheel speed at that age, suggesting that their ability to generate force was not different. At 5 to 6 weeks of age, when muscle cross-sectional areas were similar between groups, the soleus and extensor digitorum longus muscles isolated from high-fat-fed control and Imp2-deficient mice showed no difference in the maximal tetanic forces generated in vitro; furthermore, the rates at which force diminished with repeated tetanic stimulation were also similar. Paralleling the preserved force-generating properties of muscle in vitro, IMP2-deficient mice and controls on a high-fat diet exhibited similar whole-body performances when exercised under forced conditions, in response to both a maximal and a submaximal exercise challenge.
A role for skeletal muscle IMP2 in mediating central fatigue may explain the discrepancy between IMP2’s effect on voluntary wheel running and its effect on exercise performance during forced treadmill running. Central fatigue refers to the decrease in voluntary force/power generation by skeletal muscle caused by decreased nervous system output. During exercise, skeletal muscle generates signals that activate chemosensitive group III/IV muscle afferents. These afferents exert negative feedback on descending motor drive, ultimately impairing spinal motoneuron output and thereby facilitating central fatigue. The site of motor drive inhibition could in principle lie anywhere in the neural transmission circuit, from higher motor centers down to the neuromuscular junction. A key site is thought to be upstream of the motor cortex (44). Thus, a possible mechanism for IMP2’s impact on voluntary wheel running proposes that IMP2 deficiency causes working skeletal muscle to produce an excess of metabolites that hyperstimulate group III/IV afferents, leading to premature, centrally mediated fatigue that curtails voluntary muscular activity. Although the precise identity of the responsible muscle metabolites is the subject of ongoing investigation, evidence from human muscle biopsy specimens (45) suggests that they are products of glucose metabolism. The finding that IMP2 deficiency leads to a shift in metabolism from fatty acid oxidation to glucose oxidation is supportive of this proposal. In contrast to voluntary wheel running, under forced-exercise conditions, the fear stimulus used for motivation may be powerful enough to override feedback inhibition from group III/IV afferents, such that fatigue becomes dependent on peripheral (intramuscular) mechanisms. Forced exercise likely creates conditions similar to those prevailing in highly motivated athletes, where peripheral mechanisms of fatigue are thought to predominate (46). The present data (Fig. 3A, H, and I) indicate that peripheral fatigue mechanisms are not different between Imp2ff/MCKcre+/− and control mice.
In conclusion, postnatal inactivation of IMP2 in mouse skeletal muscle diminishes the accrual of muscle mass, due to reduced autocrine production of IGF2 and impaired activation of Akt1, Gsk3α, and eIF2Bε, with a consequent reduction in overall protein synthesis. IMP2-deficient muscle also shows suboptimal fatty acid oxidation due in part to diminished PPARα, with a preference for glucose as oxidative fuel, accompanied by reduced voluntary wheel-running activity of Imp2ff/MCKcre+/− mice, but only when mice were fed a high-fat diet. The onset of this diet-dependent alteration in voluntary activity is evident at a young age, before differences in muscle mass are evident and within a week of high-fat feeding; the likelihood is high that the behavioral difference is attributable to altered muscle nutrient metabolism.
MATERIALS AND METHODS
Generation of the Imp2-floxed targeting construct.
The Imp2-floxed construct was generated by using a genomic fragment of 12 kb containing Imp2 exons 1 and 2 and flanking intron sequences of the murine gene extracted from the RP23-163F16 bacterial artificial chromosome (BAC) clone. The construct was assembled by using ET recombination (47). Replacement-type targeting was used to modify the endogenous murine Imp2 gene (see Fig. S1A in the supplemental material). The targeting construct was then introduced into E14.1 (strain 129) embryonic stem (ES) cells by electroporation. G418-resistant clones were screened for homologous recombination by Southern blotting using a 3′ probe (PCR fragment of 527 bp) downstream of exon 2 and a Neo probe (PCR fragment of 700 bp), as indicated in Fig. S1A in the supplemental material. ES cells with a correct targeted Imp2-floxed allele were injected into murine C57BL/6J blastocysts, which were transferred to pseudopregnant females, and chimeric offspring were obtained and crossed to the C57BL/6J strain to obtain germ line transmission. F1 offspring carrying the floxed Imp2 allele were then crossed with transgenic mice expressing Flp recombinase ubiquitously (48) for the in vivo removal of the neo cassette. Mice carrying successful removal of the neo cassette were identified by PCR using the strategy indicated in Fig. S1A. The PCR primer sequences are as follows: 5′-AATTTTTTTTGCATAGTTTAGTGATG-3′ for primer 1 (P1) and 5′-AAATAATGCCACTGAAGGAAAATA-3′ for primer 2 (P2).
Animal studies.
All animal procedures were approved by the Institutional Animal Care and Use Committee of Massachusetts General Hospital and were performed in accordance with the National Research Council guidelines for laboratory animal care (60). Mice were maintained on the C57BL/6J background in a specific-pathogen-free facility with a 12-h light/12-h dark cycle and fed irradiated chow (Prolab 5P75 Isopro 3000, with 5% crude fat; PMI Nutrition International) or a high-fat diet (D12492i, 60 kcal% fat; Research Diets Inc.). After weaning at 4 weeks of age, gender-matched littermates were housed in the same cage with a maximum number of four mice per cage. Cages were changed every 2 weeks, and nesting material was provided. Animals were sacrificed if they had wounds from fighting, developed severe dermatitis or tumors, or showed other signs of morbidity, such as unresponsiveness to touch or not eating.
Indirect calorimetry, food intake, activity, and body composition.
For analysis of body weight, body composition, and food intake, mice were kept at a normal ambient temperature of 23°C ± 3°C and had free access to water and food. Measurements of energy expenditure were performed using a customized indirect calorimetric system. Mice were individually housed and placed in a Promethion metabolic analyzer (Sable Systems International, Las Vegas, NV) for 3 days before recording started. Running wheels were present for the whole study but were locked for the days recording wheel-out measurements. Animals were monitored for 2 to 3 days with the wheel locked and 4 to 5 days with the wheel unlocked.
Body composition was evaluated in live, conscious animals in triplicate by quantitative nuclear magnetic resonance spectroscopy (EchoMRI analyzer; Echo Medical Systems, Houston, TX).
Exercise testing.
All exercise testing was performed on a computer-controlled treadmill (Columbus Instruments) that was tilted to a fixed angle of 20°. Exercise was performed in a temperature-controlled room at 70°F, after first fasting the animals for ∼6 h. Mice were first acclimatized to the treadmill over 3 days for durations of 10 min, 10 min, and 15 min, respectively, at speeds of 5 to 10 m/min. For testing, two protocols were employed, “max” and “endurance.” To ensure that a given protocol elicited the same power output from each mouse, we adjusted the treadmill velocity to achieve the desired power (49). In particular, we calculated the velocity needed to elicit this power output from a given mouse by solving the equation P = v × m × g × sin(20°)/60 (where P is power in milliwatts, v is treadmill velocity in meters per minute, m is mouse mass in grams, and g is acceleration due to gravity [9.8 m/s2]). Both the max and endurance protocols started with a warmup period of 5 min, during which power increased continuously from 5 mW to 10 mW at a rate of 1 mW/min. For the max protocol, the warmup was followed by an incremental exercise test, during which the power output needed to keep pace with the treadmill started at 10 mW and increased continuously at a rate of 3 mW/min, until the animal reached exhaustion. For the endurance protocol, the warmup was followed by a constant-power test at 34 mW (the treadmill velocity was fixed at a value that would elicit 34 mW of power from the exercising mouse), until the animal reached exhaustion. A power ramp was used to transition from the end of warmup, 10 mW, to the constant power target of 34 mW, with power increasing from 10 mW to 34 mW at a rate of 3 mW/min. In both protocols, the mouse was motivated to run by tapping its tail or blowing compressed air whenever it descended more than halfway down the length of the treadmill toward the electrical stimulus pad. If the mouse ever rested on the stimulus pad, it was immediately pushed to the center of the treadmill and motivated anew with tail taps and air puffs. Exhaustion was defined as occurring when the mouse could not keep pace with the treadmill for more than 3 s without descending to the back of the treadmill and moreover failing this task 3 times in a row. Exercise performance was defined as the total amount of mechanical work completed by the mouse by the time when exhaustion was reached: W = d × m × g × sin(20°)/1,000 (where W is work in joules, d is total distance run in meters, m is mouse mass in grams, and g is acceleration due to gravity [9.8 m/s2]). During exercise testing, lactate and glucose levels were measured from tail tip blood using point-of-care meters (Nova Biomedical Lactate Plus for lactate and Bayer Contour for glucose). For the max protocol, metabolite levels were measured at rest (prior to testing) as well as at exhaustion, within 10 s of stopping the treadmill. For the endurance protocol, metabolite levels were measured at rest, at the start of the constant-power phase, every 10 min thereafter, and at exhaustion. Since measurements were made during the course of the endurance test, care was taken to ensure that each interruption lasted less than 20 s. The endurance power target of 34 mW was chosen to be the maximum power output that all tested mice could sustain at a near-steady-state lactate concentration, where steady state was defined as a <1 mM rise in the lactate concentration over a 10-min period.
Glucose and insulin tolerance tests.
For glucose tolerance tests, mice were fasted overnight (16 h). Twenty percent d-glucose (Sigma) (1 g/kg body weight) was administered by intraperitoneal injection. At 0, 20, 40, 60, and 120 min after administration, blood was collected by tail vein bleeding. Glucose levels were measured by a One Touch Ultra AlphaTrak2 glucometer (Zoetis, Parsippany, NJ).
For insulin tolerance tests, high-fat-fed mice were fasted for 5 h. Human insulin (Eli Lily) at 0.75 U/kg was injected intraperitoneally. Blood was drawn from the tail vein 0, 20, 40, 60, and 90 min after injection, and glucose levels were measured as described above.
Serum analyses.
Blood was collected into EDTA-coated tubes (Sarstedt, Newton, NC). Serum was separated by centrifugation at 4°C, frozen in liquid nitrogen, and assayed at the Vanderbilt University Mouse Metabolic Phenotyping Center (MMPC). The blood IGF2 concentration was measured using a mouse IGF2 enzyme-linked immunosorbent assay (ELISA) kit (catalog number EK0381; Boster Biological Technology Co., Ltd., CA) according to the manufacturer’s instructions.
Muscle IGF measurements.
After blood draw, mice anesthetized with 2% isoflurane inhalation were perfused through the abdominal aorta with 75 ml phosphate-buffered saline (PBS) (37°C). Muscle protein extraction was performed as described above for immunoblotting, and protein was measured using a mouse IGF1 ELISA kit (Sigma) and a mouse IGF2 ELISA kit (catalog number EK0381; Boster Biological Technology Co., Ltd., CA). For IGF2 measurement, serum and muscle lysates were first concentrated using Amicon Ultra 0.5-ml centrifugal filters. Igf2 levels were quantified by using a mouse IGF2 ELISA kit according to the manufacturer’s procedures.
Skeletal muscle immunohistochemistry.
In brief, 4 pairs of 26-week-old male mice on an HFD were anesthetized with 2% isoflurane inhalation. The mice were perfused briefly through the abdominal aorta with PBS (37°C) for 1 min and then with 4% paraformaldehyde (PFA)-lysine-periodate fixative (PLP) (17 ml/min) for 5 min. After perfusion, the hind limbs were dissected and kept extended overnight in a 50-ml Falcon tube at 4°C with PFA. The muscles were cut longitudinally in 3-mm-thick sections and washed 5 times in PBS, and tissue sections were then cryoprotected in PBS–30% sucrose overnight before being embedded in Tissue-Tek O.C.T. compound 4583 (Sakura Finetek, Torrance, CA). Cryosections (5 μm) were cut using a Leica CM3050S microtome and placed onto positively charged slides (Denville Scientific Inc., Holliston, MA). Before immunostaining, sections were rehydrated in PBS for 20 min before use. The microtubules were stained on nonpermeabilized sections blocked for 10 min with 5% bovine serum albumin (BSA). The tissue sections were stained with antilaminin (17 μg/ml; Sigma). After 3 washes, the sections were incubated Cy3-conjugated donkey anti-rabbit (1.9 μg/ml; Jackson Immunoresearch, West Grove, PA) for 3 h at room temperature. Tissues slices were washed 3 times and then incubated with an anticlathrin antibody (1.3 μg/ml; BD Biosciences, San Jose, CA) for 1 h. After incubation and further washes, the slices were incubated for 1 h with donkey anti-mouse IgG conjugated to Cy3 at room temperature (1.9 μg/ml; Jackson Immunoresearch, West Grove, PA). After three washes in PBS, sections were mounted in Vectashield mounting medium with DAPI (4′,6-diamidino-2-phenylindole) for nucleus counterstaining. Pictures were acquired using a Zeiss LMS800 confocal laser scanning microscope, and the acquired images were imported into Volocity software (PerkinElmer, Waltham, MA) for analysis. Analyses of data were performed with a double-blind method. The identity of the tissues was not known by the person who acquired images and the person who performed the analysis. Totals of 2,261 Imp2ff and 1,927 Imp2ff/MCKcre+/− fibers were measured.
Antibodies and PCR primers are listed in Table S3 in the supplemental material.
RNA-seq and proteomics.
Gastrocnemius and soleus muscles for RNA deep sequencing and proteomics were extracted directly using a Qiagen RNase kit from 3 pairs of mice at 6 weeks of age fed an HFD. RNA-seq libraries were constructed from poly(A)-selected RNA sequenced on an Illumina HiSeq2500 instrument, resulting in approximately 29 million reads per sample on average for both total and IP RNAs. STAR aligner (50) was used to map sequencing reads to transcripts in the mouse mm10 reference genome. Read counts for individual transcripts were produced with HTSeq-count (51), followed by the estimation of expression values and detection of differentially expressed transcripts using EdgeR (52). Proteomic analysis by mass spectroscopy using tandem-mass-tag technology was carried out as described previously (7).
IMP2 immunoprecipitation followed by RNA sequencing (RIP-seq).
Muscle tissues from ∼6-week-old male mice were harvested after sacrifice and extracted directly using a TissueLyser (Qiagen) in ice-cold lysis buffer (140 mM KCl, 1.5 mM MgCl2, 20 mM Tris-HCl at pH 7.4, 0.5% Nonidet P-40, 0.5 mM dithiothreitol, 1 U/μl RNase inhibitor, one complete EDTA-free protease inhibitor cocktail tablet) and extracted for 10 min. The lysates were centrifuged for 10 min at 14,000 rpm, and the supernatant was transferred to a fresh 1.5-ml tube. Total protein was measured by a Bradford assay (53), and 5 mg of the cytoplasmic lysate protein was subjected to immunoprecipitation. Lysates were incubated with 500 μl of protein A Dynabeads magnetic beads precoated with IMP2 antibody and incubated for 6 h at 4°C with rotation. Dynabeads were extensively washed with lysis buffer five times and digested with DNase I and protease K. RNA was extracted with phenol-chloroform and precipitated with ethanol. Either RNA sequencing or real-time PCR was performed to examine RNAs associated with cytoplasmic IMP2 from muscle.
Real-time PCR.
Total RNA (1 μg) was used for cDNA preparation with random-hexamer primers using SuperScript III reverse transcriptase (Invitrogen). Steady-state mRNA expression was measured by quantitative real-time PCR using SYBR green master mix (Bio-Rad) with a CFX96 real-time PCR system (Bio-Rad). Primer sequences for real-time PCRs are listed in Table S3 in the supplemental material.
Immunoblotting.
Proteins were extracted from gastrocnemius and soleus muscles from 6- to 8-week-old HFD-fed male mice using a tissue homogenizer (Qiagen). Muscles were homogenized in ice-cold buffer (20 mM Tris [pH 7.5], 2.7 mM KCl, 1 mM MgCl2, 1% Triton X-100, 10% [wt/vol] glycerol, 1 mM EDTA, 1 mM dithiothreitol) supplemented with protease (Thermo Scientific) and a phosphatase inhibitor cocktails (Millipore). Samples were then centrifuged at 13,000 rpm for 10 min at 4°C, and the supernatants were collected. The protein content of the supernatant was determined using a bicinchoninic acid (BCA) assay (Thermo Scientific). Aliquots of each extract containing 50 μg protein were loaded for Western blotting. Proteins were resolved on a 4%-to-12% gradient SDS Bis-Tris gel (Invitrogen, Carlsbad, CA). Antibodies for immunoblotting are listed in Table S3 in the supplemental material.
Muscle protein synthesis in vivo.
Four- to five-week-old male mice on the HFD were anesthetized with ketamine (100 ng/g body weight) and xylazine (10 ng/g body weight), followed by intraperitoneal injection of puromycin (0.04 μmol/g body weight). After 30 min of injection, the muscle was extracted as described above, and equal protein amounts were subjected to SDS-PAGE and antipuromycin Western blotting. Puromycin incorporation into muscle protein was estimated as described previously (14); equal loading was verified by examination of total Coomassie blue-stained protein and immunoblotted rpL26 polypeptide.
Polysome fractionation.
Gastrocnemius and soleus tissues were homogenized in ice-cold lysis buffer (10 mM Tris [pH 7.5], 250 mM KCl, 10 mM MgCl2, 0.5% Triton X-100, 2 mM dithiothreitol, 100 g/ml cycloheximide, 100 U/ml RNase inhibitor [Thermo Fisher Scientific], and protease inhibitor cocktails [Thermo Fisher Scientific]) using a Qiagen tissue homogenizer. Homogenates were continuously vortexed for 5 min at 4°C and incubated for 15 min on ice. Samples were then centrifuged at 10,000 × g for 10 min at 4°C. The resulting supernatant was layered on a 15 to 50% linear sucrose gradient (20 mM Tris [pH 7.5], 250 mM KCl, 10 mM MgCl2) and centrifuged in an SW41 rotor at 40,000 rpm for 160 min at 4°C. After centrifugation, the gradient was displaced through a spectrophotometer, and the optical density (OD) at 254 nm was continuously recorded. Two sucrose fractions, representing the subpolysomal and polysomal portions of the gradient, were collected directly into an equal volume of TRIzol reagent (Invitrogen). RNA was extracted, and samples were analyzed for quality using the Agilent 2100 bioanalyzer (Agilent Biotechnologies). An equal quantity of RNA in each fraction was converted to cDNA.
Muscle contractile function in vitro.
The procedures for evaluating contractile properties were similar to those previously described (54, 55). Extensor digitorum longus (EDL) and soleus (SOL) muscles were removed from anesthetized mice. Small stainless steel rings were sutured to tendons so that the muscles could be attached between an isometric force transducer and an immobile post. The preparation was suspended in a bicarbonate buffer that was maintained at 35°C and continually equilibrated with 95% O2 plus 5% CO2. Biphasic pulses (duration of 200 μs) generated by a constant-current muscle stimulator were delivered to platinum electrodes that flanked the preparation. Brief trains that induced peak or near-peak force (200 to 300 Hz) were used for establishing the optimal muscle length for tension (L0). The muscle was then subjected to single pulses (for twitch force) and trains of stimuli ranging from 20 to 350 Hz (for the force-frequency relationship). Data were expressed relative to peak tetanic force and plotted versus stimulation frequency given a force-frequency relationship. Nonlinear regression was used to model the relationship as a sigmoid curve (56). Finally, to evaluate fatigability, the muscles were subjected to a series of repetitive trains, one every 3 s, for a duration of either 60 s (EDL) or 90 s (SOL). At the conclusion of data collection, the muscle was removed from the buffer and blotted, the tendons were trimmed, and the muscle mass was determined on an analytical balance. The physiological cross-sectional area (pCSA) of the muscle was estimated by dividing the muscle mass by the product of fiber length and muscle density (assumed to be 1.06 mg/mm2). Fiber length was calculated using fiber length-to-L0 ratios of 0.44 for EDL and 0.71 for SOL.
Fatty acid oxidation assay.
Mitochondria from liver, heart, and skeletal muscle were isolated from 6-week-old male mice as described previously (57). For each experiment, mitochondria were isolated from the liver, heart, and skeletal muscle of 2 littermate Imp2ff and Imp2ff/MCKcre+/− mice; to obtain reliable amounts of mitochondria from heart and skeletal muscle, the corresponding tissues from the two animals were combined. The protocol for the assay of fatty acid oxidation was adapted from methods described previously (58). For each tissue, six replicates of Imp2ff and Imp2ff/MCKcre+/− mitochondria were incubated for 30 min at 37°C in a reaction mixture with 0.7% FFA-poor BSA–500 μM palmitate–1 μCi [14C]palmitate (59). The reaction mixtures were then transferred to a new tube containing cold 1 M perchloric acid, with a paper disc saturated with 1 M NaOH in the cap. After closing the cap, the tubes were incubated for 1 h at 37°C. The 14C counts per minute contained by the paper and the acidic fraction were measured by liquid scintillation counting.
Flexor digitorum brevis fiber isolation and oxygen consumption.
Intact flexor digitorum brevis fibers from 6-week-old mice were isolated as described previously (11). Briefly, two FDB muscles from each animal were incubated for 2 h with 4 mg/ml collagenase A at 37°C with 5% CO2, and intact fibers were dissociated with a fire-polished Pasteur pipette and incubated overnight in a solution containing Dulbecco’s modified Eagle’s medium (DMEM), 2% fetal bovine serum (FBS), 50 μg/ml gentamicin, and 0.5 mM l-carnitine at 37°C with 5% CO2 in Seahorse XF24 cell culture microplates coated with Matrigel. Two hours prior to measurements, incubation buffer was replaced with prewarmed assay buffer (5 mM HEPES, 120 mM NaCl, 3.5 mM KCl, 1.3mM CaCl2, 1 mM MgCl2, 0.4 mM KH2PO4, 0.5mM l-carnitine, 2.5mM d-glucose [pH 7.4]), and the plates were incubated in an unbuffered, humidified incubator. Fifteen minutes prior to the start of the assay, etomoxir (final concentration, 40 μM) or carrier was added to each well, as indicated, and just before loading of the plate in the analyzer, either 0.5 mM oleate–0.67% BSA, 0.67% FFA-free BSA, or 15 mM glucose (final concentration) was added to the appropriate wells. The BSA-oleate complexes were prepared according to methods described previously by Oliveira et al. (59). Bioenergetic analyses were performed using an XF24 extracellular flux analyzer (Seahorse Bioscience, Billerica, MA).
Supplementary Material
ACKNOWLEDGMENTS
This work was supported by NIH grants DK17776, DK057521, and DK043351 and MGH institutional funds. L.M. was supported in part by the Lundbeck foundation (grant 177/05). D.K. was supported by an EMBL postdoctoral fellowship.
We thank the MGH Microscopy Core of the Program in Membrane Biology, J. Lighton (Sable Systems International Inc.), and V. K. Mootha for advice. D.K. and L.M. thank the EMBL-Monterotondo gene expression and transgenic services for the production of the Imp2ff line.
Footnotes
Supplemental material for this article may be found at https://doi.org/10.1128/MCB.00528-18.
REFERENCES
- 1.Degrauwe N, Suvà ML, Janiszewska M, Riggi N, Stamenkovic I. 2016. IMPs: an RNA-binding protein family that provides a link between stem cell maintenance in normal development and cancer. Genes Dev 30:2459–2474. doi: 10.1101/gad.287540.116. [DOI] [PMC free article] [PubMed] [Google Scholar]
- 2.Dai N, Rapley J, Angel M, Yanik MF, Blower MD, Avruch J. 2011. mTOR phosphorylates IMP2 to promote IGF2 mRNA translation by internal ribosomal entry. Genes Dev 25:1159–1172. doi: 10.1101/gad.2042311. [DOI] [PMC free article] [PubMed] [Google Scholar]
- 3.Dai N, Christiansen J, Nielsen FC, Avruch J. 2013. mTOR complex 2 phosphorylates IMP1 cotranslationally to promote IGF2 production and the proliferation of mouse embryonic fibroblasts. Genes Dev 27:301–312. doi: 10.1101/gad.209130.112. [DOI] [PMC free article] [PubMed] [Google Scholar]
- 4.Nielsen J, Christiansen J, Lykke-Andersen J, Johnsen AH, Wewer UM, Nielsen FC. 1999. A family of insulin-like growth factor II mRNA-binding proteins represses translation in late development. Mol Cell Biol 19:1262–1270. doi: 10.1128/MCB.19.2.1262. [DOI] [PMC free article] [PubMed] [Google Scholar]
- 5.Christiansen J, Kolte AM, Hansen TV, Nielsen FC. 2009. IGF2 mRNA-binding protein2: biological function and putative role in type 2 diabetes. J Mol Endocrinol 43:187–195. doi: 10.1677/JME-09-0016. [DOI] [PubMed] [Google Scholar]
- 6.Banting LK, Pushkarev VP, Cieszczyk P, Zarebska A, Maciejewska-Karlowska A, Sawczuk MA, Leońska-Duniec A, Dyatlov DA, Orekhov EF, Degtyarev AV, Pushkareva YE, Yan X, Birk R, Eynon N. 2015. Elite athletes genetic predisposition for altered risk of complex metabolic traits. BMC Genomics 16:25. doi: 10.1186/s12864-014-1199-0. [DOI] [PMC free article] [PubMed] [Google Scholar]
- 7.Dai N, Zhao L, Wrighting D, Krämer D, Majithia A, Wang Y, Cracan V, Borges-Rivera D, Mootha VK, Nahrendorf M, Thorburn DR, Minichiello L, Altshuler D, Avruch J. 2015. IGF2BP2/IMP2 deficient mice resist obesity through enhanced translation of Ucp1 mRNA and other mRNAs encoding mitochondrial proteins. Cell Metab 21:609–621. doi: 10.1016/j.cmet.2015.03.006. [DOI] [PMC free article] [PubMed] [Google Scholar]
- 8.Brüning JC, Michael MD, Winnay JN, Hayashi T, Hörsch D, Accili D, Goodyear LJ, Kahn CR. 1998. A muscle-specific insulin receptor knockout exhibits features of the metabolic syndrome of NIDDM. Mol Cell 2:559–569. doi: 10.1016/S1097-2765(00)80155-0. [DOI] [PubMed] [Google Scholar]
- 9.Pack AI, Galante RJ, Maislin G, Cater J, Metaxas D, Lu S, Zhang L, Von Smith R, Kay T, Lian J, Svenson K, Peters LL. 2007. Novel method for high-throughput phenotyping of sleep in mice. Physiol Genomics 28:232–238. doi: 10.1152/physiolgenomics.00139.2006. [DOI] [PubMed] [Google Scholar]
- 10.Subramanian A, Tamayo P, Mootha VK, Mukherjee S, Ebert BL, Gillette MA, Paulovich A, Pomeroy SL, Golub TR, Lander ES, Mesirov JP. 2005. Gene set enrichment analysis: a knowledge-based approach for interpreting genome-wide expression profiles. Proc Natl Acad Sci U S A 102:15545–15550. doi: 10.1073/pnas.0506580102. [DOI] [PMC free article] [PubMed] [Google Scholar]
- 11.Schuh RA, Jackson KC, Khairallah RJ, Ward CW, Spangenburg EE. 2012. Measuring mitochondrial respiration in intact single muscle fibers. Am J Physiol Regul Integr Comp Physiol 302:R712–R719. doi: 10.1152/ajpregu.00229.2011. [DOI] [PMC free article] [PubMed] [Google Scholar]
- 12.Goodman CA, Mayhew DL, Hornberger TA. 2011. Recent progress toward understanding the molecular mechanisms that regulate skeletal muscle mass. Cell Signal 23:1896–1906. doi: 10.1016/j.cellsig.2011.07.013. [DOI] [PMC free article] [PubMed] [Google Scholar]
- 13.Schiaffino S, Dyar KA, Ciciliot S, Blaauw B, Sandri M. 2013. Mechanisms regulating skeletal muscle growth and atrophy. FEBS J 280:4294–4314. doi: 10.1111/febs.12253. [DOI] [PubMed] [Google Scholar]
- 14.Goodman CA, Mabrey DM, Frey JW, Miu MH, Schmidt EK, Pierre P, Hornberger TA. 2011. Novel insights into the regulation of skeletal muscle protein synthesis as revealed by a new nonradioactive in vivo technique. FASEB J 25:1028–1039. doi: 10.1096/fj.10-168799. [DOI] [PMC free article] [PubMed] [Google Scholar]
- 15.Bodine SC, Baehr LM. 2014. Skeletal muscle atrophy and the E3 ubiquitin ligases MuRF1 and MAFbx/atrogin-1. Am J Physiol Endocrinol Metab 307:E469–E484. doi: 10.1152/ajpendo.00204.2014. [DOI] [PMC free article] [PubMed] [Google Scholar]
- 16.Davey JR, Watt KI, Parker BL, Chaudhuri R, Ryall JG, Cunningham L, Qian H, Sartorelli V, Sandri M, Chamberlain J, James DE, Gregorevic P. 2016. Integrated expression analysis of muscle hypertrophy identifies Asb2 as a negative regulator of muscle mass. JCI Insight 1:e85477. doi: 10.1172/jci.insight.85477. [DOI] [PMC free article] [PubMed] [Google Scholar]
- 17.Cho H, Thorvaldsen JL, Chu H, Feng F, Birnbaum MJ. 2001. Akt1/PKBa is required for normal growth but dispensable for maintenance of glucose homeostasis in mice. J Biol Chem 276:38349–38352. doi: 10.1074/jbc.C100462200. [DOI] [PubMed] [Google Scholar]
- 18.Cho H, Mu J, Kim JK, Thorvaldsen JL, Chu Q, Crenshaw EB III, Kaestner KH, Bartolomei MS, Shulman GI, Birnbaum MJ. 2001. Insulin resistance and a diabetes mellitus-like syndrome in mice lacking the protein kinase Akt2 PKBbeta. Science 292:1728–1731. doi: 10.1126/science.292.5522.1728. [DOI] [PubMed] [Google Scholar]
- 19.Garofalo RS, Orena SJ, Rafidi K, Torchia AJ, Stock JL, Hildebrandt AL, Coskran T, Black SC, Brees DJ, Wicks JR, McNeish JD, Coleman KG. 2003. Severe diabetes, age-dependent loss of adipose tissue, and mild growth deficiency in mice lacking Akt2/PKB beta. J Clin Invest 112:197–208. doi: 10.1172/JCI16885. [DOI] [PMC free article] [PubMed] [Google Scholar]
- 20.Manning BD, Toker A. 2017. AKT/PKB signaling: navigating the network. Cell 169:381–405. doi: 10.1016/j.cell.2017.04.001. [DOI] [PMC free article] [PubMed] [Google Scholar]
- 21.Woods YL, Cohen P, Becker W, Jakes R, Goedert M, Wang X, Proud CG. 2001. The kinase DYRK phosphorylates protein-synthesis initiation factor eIF2Bepsilon at Ser539 and the microtubule-associated protein tau at Thr212: potential role for DYRK as a glycogen synthase kinase 3-priming kinase. Biochem J 355:609–615. doi: 10.1042/bj3550609. [DOI] [PMC free article] [PubMed] [Google Scholar]
- 22.Wang X, Paulin FE, Campbell LE, Gomez E, O’Brien K, Morrice N, Proud CG. 2001. Eukaryotic initiation factor 2B: identification of multiple phosphorylation sites in the epsilon-subunit and their functions in vivo. EMBO J 20:4349–4359. doi: 10.1093/emboj/20.16.4349. [DOI] [PMC free article] [PubMed] [Google Scholar]
- 23.Jefferson LS, Fabian JR, Kimball SR. 1999. Glycogen synthase kinase-3 is the predominant insulin-regulated eukaryotic initiation factor 2B kinase in skeletal muscle. Int J Biochem Cell Biol 31:191–200. doi: 10.1016/S1357-2725(98)00141-1. [DOI] [PubMed] [Google Scholar]
- 24.Li Z, Gilbert JA, Zhang Y, Zhang M, Qiu Q, Ramanujan K, Shavlakadze T, Eash JK, Scaramozza A, Goddeeris MM, Kirsch DG, Campbell KP, Brack AS, Glass DJ. 2012. An HMGA2-IGF2BP2 axis regulates myoblast proliferation and myogenesis. Dev Cell 23:1176–1188. doi: 10.1016/j.devcel.2012.10.019. [DOI] [PMC free article] [PubMed] [Google Scholar]
- 25.Gong C, Li Z, Ramanujan K, Clay I, Zhang Y, Lemire-Brachat S, Glass DJ. 2015. A long non-coding RNA, LncMyoD, regulates skeletal muscle differentiation by blocking IMP2-mediated mRNA translation. Dev Cell 34:181–191. doi: 10.1016/j.devcel.2015.05.009. [DOI] [PubMed] [Google Scholar]
- 26.White RB, Biérinx AS, Gnocchi VF, Zammit PS. 2010. Dynamics of muscle fibre growth during postnatal mouse development. BMC Dev Biol 10:21. doi: 10.1186/1471-213X-10-21. [DOI] [PMC free article] [PubMed] [Google Scholar]
- 27.Li M, Zhou X, Chen Y, Nie Y, Huang H, Chen H, Mo D. 2015. Not all the number of skeletal muscle fibers is determined prenatally. BMC Dev Biol 15:42. doi: 10.1186/s12861-015-0091-8. [DOI] [PMC free article] [PubMed] [Google Scholar]
- 28.Fry CS, Lee JD, Mula J, Kirby TJ, Jackson JR, Liu F, Yang L, Mendias CL, Dupont-Versteegden EE, McCarthy JJ, Peterson CA. 2015. Inducible depletion of satellite cells in adult, sedentary mice impairs muscle regenerative capacity without affecting sarcopenia. Nat Med 21:76–80. doi: 10.1038/nm.3710. [DOI] [PMC free article] [PubMed] [Google Scholar]
- 29.Andersson L. 2009. Studying phenotypic evolution in domestic animals: a walk in the footsteps of Charles Darwin. Cold Spring Harb Symp Quant Biol 74:319–325. doi: 10.1101/sqb.2009.74.039. [DOI] [PubMed] [Google Scholar]
- 30.Van Laere AS, Nguyen M, Braunschweig M, Nezer C, Collette C, Moreau L, Archibald AL, Haley CS, Buys N, Tally M, Andersson G, Georges M, Andersson L. 2003. A regulatory mutation in IGF2 causes a major QTL effect on muscle growth in the pig. Nature 425:832–836. doi: 10.1038/nature02064. [DOI] [PubMed] [Google Scholar]
- 31.Markljung E, Jiang L, Jaffe JD, Mikkelsen TS, Wallerman O, Larhammar M, Zhang X, Wang L, Saenz-Vash V, Gnirke A, Lindroth AM, Barrés R, Yan J, Strömberg S, De S, Pontén F, Lander ES, Carr SA, Zierath JR, Kullander K, Wadelius C, Lindblad-Toh K, Andersson G, Hjälm G, Andersson L. 2009. ZBED6, a novel transcription factor derived from a domesticated DNA transposon regulates IGF2 expression and muscle growth. PLoS Biol 7:e1000256. doi: 10.1371/journal.pbio.1000256. [DOI] [PMC free article] [PubMed] [Google Scholar]
- 32.Moses AC, Nissley SP, Short PA, Rechler MM, White RM, Knight AB, Higa OZ. 1980. Increased levels of multiplication-stimulating activity, an insulin-like growth factor, in fetal rat serum. Proc Natl Acad Sci U S A 77:3649–3653. doi: 10.1073/pnas.77.6.3649. [DOI] [PMC free article] [PubMed] [Google Scholar]
- 33.van Buul-Offers SC, de Haan K, Reijnen-Gresnigt MG, Meinsma D, Jansen M, Oei SL, Bonte EJ, Sussenbach JS, Van den Brande JL. 1995. Overexpression of human insulin-like growth factor-II in transgenic mice causes increased growth of the thymus. J Endocrinol 144:491–502. doi: 10.1677/joe.0.1440491. [DOI] [PubMed] [Google Scholar]
- 34.Vienberg SG, Bouman SD, Sørensen H, Stidsen CE, Kjeldsen T, Glendorf T, Sørensen AR, Olsen GS, Andersen B, Nishimura E. 2011. Receptor-isoform-selective insulin analogues give tissue-preferential effects. Biochem J 440:301–308. doi: 10.1042/BJ20110880. [DOI] [PubMed] [Google Scholar]
- 35.Saxton RA, Sabatini DM. 2017. mTOR signaling in growth, metabolism, and disease. Cell 168:960–976. doi: 10.1016/j.cell.2017.02.004. [DOI] [PMC free article] [PubMed] [Google Scholar]
- 36.Yoon M-S. 2017. mTOR as a key regulator in maintaining skeletal muscle mass. Front Physiol 8:788. doi: 10.3389/fphys.2017.00788. [DOI] [PMC free article] [PubMed] [Google Scholar]
- 37.Welsh GI, Miller CM, Loughlin AJ, Price NT, Proud CG. 1998. Regulation of eukaryotic initiation factor eIF2B: glycogen synthase kinase-3 phosphorylates a conserved serine which undergoes dephosphorylation in response to insulin. FEBS Lett 421:125–130. doi: 10.1016/S0014-5793(97)01548-2. [DOI] [PubMed] [Google Scholar]
- 38.Mayhew DL, Hornberger TA, Lincoln HC, Bamman MM. 2011. Eukaryotic initiation factor 2B epsilon induces cap-dependent translation and skeletal muscle hypertrophy. J Physiol 589:3023–3037. doi: 10.1113/jphysiol.2010.202432. [DOI] [PMC free article] [PubMed] [Google Scholar]
- 39.Finck BN, Bernal-Mizrachi C, Han DH, Coleman T, Sambandam N, LaRiviere LL, Holloszy JO, Semenkovich CF, Kelly DP. 2005. A potential link between muscle peroxisome proliferator-activated receptor-alpha signaling and obesity-related diabetes. Cell Metab 1:133–144. doi: 10.1016/j.cmet.2005.01.006. [DOI] [PubMed] [Google Scholar]
- 40.Yoshida Y, Jain SS, McFarlan JT, Snook LA, Chabowski A, Bonen A. 2013. Exercise- and training-induced upregulation of skeletal muscle fatty acid oxidation are not solely dependent on mitochondrial machinery and biogenesis. J Physiol 591:4415–4426. doi: 10.1113/jphysiol.2012.238451. [DOI] [PMC free article] [PubMed] [Google Scholar]
- 41.Lundsgaard A-M, Fritzen AM, Kiens B. 2018. Molecular regulation of fatty acid oxidation in skeletal muscle during aerobic exercise. Trends Endocrinol Metab 29:18–30. doi: 10.1016/j.tem.2017.10.011. [DOI] [PubMed] [Google Scholar]
- 42.Meijer JH, Robbers Y. 2014. Wheel running in the wild. Proc Biol Sci 281:20140210. doi: 10.1098/rspb.2014.0210. [DOI] [PMC free article] [PubMed] [Google Scholar]
- 43.Knab AM, Bowen RS, Moore-Harrison T, Hamilton AT, Turner MJ, Lightfoot JT. 2009. Repeatability of exercise behaviors in mice. Physiol Behav 98:433–440. doi: 10.1016/j.physbeh.2009.07.006. [DOI] [PMC free article] [PubMed] [Google Scholar]
- 44.Amann M, Sidhu SK, Weavil J, Mangum T, Venturelli M. 2015. Autonomic responses to exercise: group III/IV muscle afferents and fatigue. Auton Neurosci 188:19–23. doi: 10.1016/j.autneu.2014.10.018. [DOI] [PMC free article] [PubMed] [Google Scholar]
- 45.Blain GM, Mangum TS, Sidhu SK, Weavil JC, Hureau TJ, Jessop JE, Bledsoe AD, Richardson RS, Amann M. 2016. Group III/IV muscle afferents limit the intramuscular metabolic perturbation during whole body exercise in humans. J Physiol 594:5303–5315. doi: 10.1113/JP272283. [DOI] [PMC free article] [PubMed] [Google Scholar]
- 46.Farrell PA, Joyner MJ, Caiozzo VJ. 2012. ACSM’s advanced exercise physiology, 2nd ed Lippincott Williams & Wilkins, Philadelphia, PA. [Google Scholar]
- 47.Muyrers JP, Zhang Y, Benes V, Testa G, Rientjes JM, Stewart AF. 2004. ET recombination: DNA engineering using homologous recombination in E. coli. Methods Mol Biol 256:107–121. doi: 10.1385/1-59259-753-X:107. [DOI] [PubMed] [Google Scholar]
- 48.Rodríguez CI, Buchholz F, Galloway J, Sequerra R, Kasper J, Ayala R, Stewart AF, Dymecki SM. 2000. High-efficiency deleter mice show that FLPe is an alternative to Cre-loxP. Nat Genet 25:139–140. doi: 10.1038/75973. [DOI] [PubMed] [Google Scholar]
- 49.Jones NL. 1997. Clinical exercise testing, 4th ed, p 224 Saunders, Philadelphia, PA. [Google Scholar]
- 50.Dobin A, Davis CA, Schlesinger F, Drenkow J, Zaleski C, Jha S, Batut P, Chaisson M, Gingeras TR. 2013. STAR: ultrafast universal RNA-seq aligner. Bioinformatics 29:15–21. doi: 10.1093/bioinformatics/bts635. [DOI] [PMC free article] [PubMed] [Google Scholar]
- 51.Anders S, Pyl PT, Huber W. 2015. HTSeq—a Python framework to work with high-throughput sequencing data. Bioinformatics 31:166–169. doi: 10.1093/bioinformatics/btu638. [DOI] [PMC free article] [PubMed] [Google Scholar]
- 52.Robinson MD, McCarthy DJ, Smyth GK. 2010. edgeR: a Bioconductor package for differential expression analysis of digital gene expression data. Bioinformatics 26:139–140. doi: 10.1093/bioinformatics/btp616. [DOI] [PMC free article] [PubMed] [Google Scholar]
- 53.Bradford MM. 1976. A rapid and sensitive method for the quantitation of microgram quantities of protein utilizing the principle of protein-dye binding. Anal Biochem 72:248–254. doi: 10.1016/0003-2697(76)90527-3. [DOI] [PubMed] [Google Scholar]
- 54.Alexander MS, Casar JC, Motohashi N, Vieira NM, Eisenberg I, Marshall JL, Gasperini MJ, Lek A, Myers JA, Estrella EA, Kang PB, Shapiro F, Rahimov F, Kawahara G, Widrick JJ, Kunkel LM. 2014. MicroRNA-486-dependent modulation of DOCK3/PTEN/AKT signaling pathways improves muscular dystrophy-associated symptoms. J Clin Invest 124:2651–2667. doi: 10.1172/JCI73579. [DOI] [PMC free article] [PubMed] [Google Scholar]
- 55.Widrick JJ, Jiang S, Choi SJ, Knuth ST, Morcos PA. 2011. An octaguanidine-morpholino oligo conjugate improves muscle function of mdx mice. Muscle Nerve 44:563–570. doi: 10.1002/mus.22126. [DOI] [PubMed] [Google Scholar]
- 56.Chan S, Head SI, Morley JW. 2007. Branched fibers in dystrophic mdx muscle are associated with a loss of force following lengthening contractions. Am J Physiol Cell Physiol 293:C985–C992. doi: 10.1152/ajpcell.00128.2007. [DOI] [PubMed] [Google Scholar]
- 57.Freeza C, Cipolat S, Scorrano L. 2007. Organelle isolation: functional mitochondria from mouse liver, muscle and cultured fibroblasts. Nat Protoc 2:287–295. doi: 10.1038/nprot.2006.478. [DOI] [PubMed] [Google Scholar]
- 58.Huynh FK, Green MF, Koves TR, Hirschey MD. 2014. Measurement of fatty acid oxidation rates in animal tissues and cell lines. Methods Enzymol 542:391–405. doi: 10.1016/B978-0-12-416618-9.00020-0. [DOI] [PMC free article] [PubMed] [Google Scholar]
- 59.Oliveira AF, Cunha DA, Ladriere L, Igoillo-Esteve M, Bugliani M, Marchetti P, Cnop M. 2015. In vitro use of free fatty acids bound to albumin: a comparison of protocols. Biotechniques 58:228–233. doi: 10.2144/000114285. [DOI] [PubMed] [Google Scholar]
- 60.National Research Council. 2011. Guide for the care and use of laboratory animals, 8th ed The National Academies Press, Washington, DC. doi: 10.17226/12910. [DOI] [Google Scholar]
Associated Data
This section collects any data citations, data availability statements, or supplementary materials included in this article.