Figure 4.
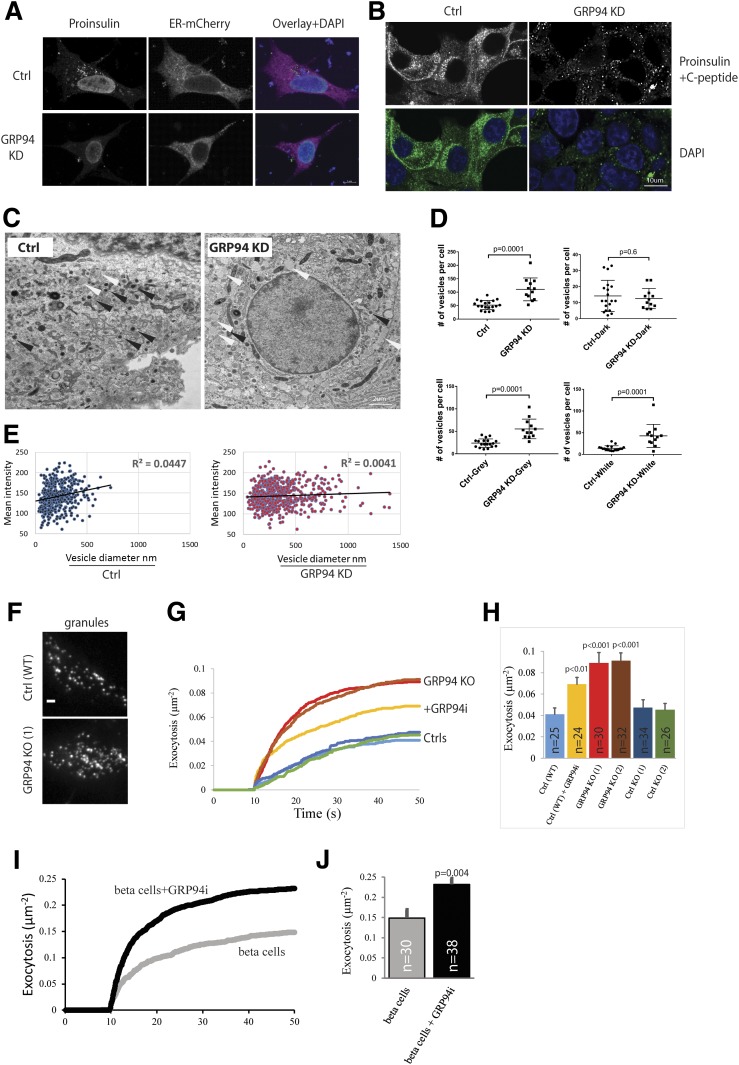
GRP94 KD cells show diminished, non-ER proinsulin staining accompanied by an increased number of larger secretory granules with amorphic content and increased exocytotic events. A: INS-1E cells (control [Ctrl] or GRP94 KD) were transfected with plasmids encoding for ER-mCherry, and 48 h later, cells were incubated for 3 h in 2 mmol/L glucose–containing medium. Next, cells were fixed with 2% paraformaldehyde and immunostained with mouse monoclonal antiproinsulin (GS-9A8) antibody followed by secondary antibody treatment (FITC). B: GRINCH cells were clonally derived from an INS-1 cell line stably expressing hProCpepSfGFP. The cells were incubated for 3 h in 2 mmol/L glucose–containing medium and fixed with 2% paraformaldehyde. A and B: Immunofluorescence was acquired by confocal laser microscopy, and illustrative images from three independent experiments are shown. C: Representative transmission EM of Ctrl and GRP94 KD INS-1E cells cultured for 3 h in 2 mmol/L glucose–containing medium. Images were obtained using a CM100 BioTWIN with tungsten emitter. Arrows point to secretory vesicles (black, vesicles with dark content; white, vesicles with gray/white content). D and E: EM-visualized vesicles were manually counted, marked, and measured in 19 images of Ctrl and 12 images of GRP94 KD cells. In total, 427 vesicles for Ctrl and 618 for GRP94 KD cells were analyzed. Each dot on the graph represents the number of vesicles in a single cell (D) (data represent the means ± SEM analyzed by Bonferroni-corrected nonpaired Student t test of treatments vs. Ctrl). Mean signal intensity of vesicles: dark <145, gray 146–170, and white >171. Correlation between vesicle size and intensity signal of its content in Ctrl and GRP94 KD cells (E). C–E: n = 3. F–J: Exocytosis of fluorescently labeled granules during application of 75 mmol/L K+. F: Representative TIRF microscopy images of Ctrl (WT) and GRP94 KO (1) INS-1 cells expressing the granule marker NPY-GFP. G: Average cumulative number of exocytotic events as a function of time and normalized to the cell area; K+ was elevated from 10 s. INS-1E (Ctrl), GRP94 KO, and GRP94i (20 μmol/L for 24 h). H: Total exocytosis (mean ± SEM) for three independent experiments as in I; number of cells is shown on bars. I and J: As in G and H, but for human β-cells from five donors with or without GRP94i pretreatment (20 μmol/L for 24 h). In H and J, the difference from Ctrl was tested with Student t tests.

