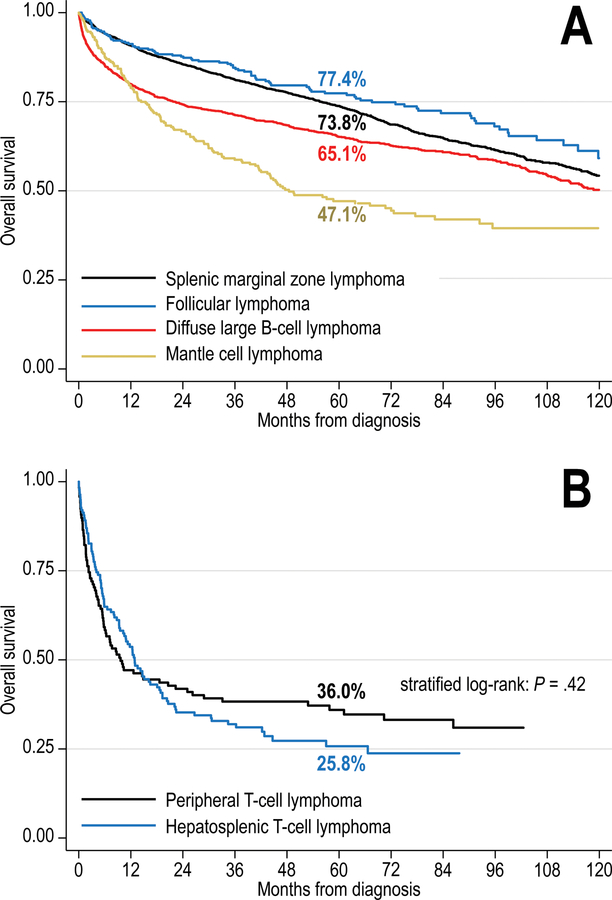
Figure 2.
Kaplan-Meier curves for overall survival of patients with primary splenic B-cell (A) and T-cell (B) lymphomas in the NCDB, 2004–2013. Numbers indicate survival estimates at 5 years; the comparison in panel B was conducted using a log-rank test stratified by age, sex, stage, and comorbidity index.

