Abstract
For biotechnological drugs, it is desirable to formulate antibody solutions with low viscosities. We go beyond previous colloid theories in treating protein–protein self–association of molecules that are antibody–shaped and flexible and have spatially specific binding sites. We consider interactions either through fragment antigen (Fab–Fab) or fragment crystalizable (Fab–Fc) binding. Wertheim's theory is adapted to compute the cluster–size distributions, viscosities, second virial coefficients, and Huggins coefficients, as functions of antibody concentration. We find that the aggregation properties of concentrated solutions can be anticipated from simpler–to–measure dilute solutions. A principal finding is that aggregation is controllable, in principle, through modifying the antibody itself, and not just the solution it is dissolved in. In particular: (i) monospecific antibodies having two identical Fab arms can form linear chains with intermediate viscosities. (ii) Bispecific antibodies having different Fab arms can, in some cases, only dimerize, having low viscosities. (iii) Arm–to–Fc binding allows for three binding partners, leading to networks and high viscosities.
Keywords: antibodies, aggregation, solution viscosity, Wertheim's theory
Graphical abstract
1. Introduction
Most of the therapeutics produced by today's biotechnology are monoclonal antibodies (mAbs). The current global market for biotechnological drugs is around $100 billion per year [1]. A principal challenge is to formulate liquid solutions that are sufficiently concentrated in antibodies to be efficacious, and yet sufficiently dilute and inviscid that patients can inject them into their bodies. Typical therapeutic mAbs formulations have concentrations around 100 mg/mL [2, 3], higher concentrations may yield prohibitively high viscosities. It is clear that the high viscosities of antibody solutions mostly arise from protein–protein interactions [4–14]. But, it is not yet clear how to rationally design formulations that can both maximize efficacy (protein concentration) and minimize viscosity [15, 16]. Here we propose a microscopic theory of antibody aggregation.
There are several previous modeling studies [17–22]. Because atomistic level molecular simulations are not practical for studying phase equilibria of these complicated systems, a traditional approach has been to treat protein aggregation using statistical mechanical theories for solutions of spherical charged particles [23–26]. And beyond simple small spherical proteins, antibodies too have been treated using these spherical–particle approaches [4, 5, 17], based on early hard–sphere theories [14, 27–29]; for review see [30]. We have recently found that an approach based on the Wertheim theories can satisfactorily handle orientation–dependent and short–ranged interactions between model molecules, giving good predictions of the phase behaviors in globular protein solutions [31– 33]. However, antibodies are more complex than globular proteins. Most similar in spirit to the present work is the approach of Schmit et al. [34]. Schmit et al use a binding–polynomial formulation to compute the clustering of featureless 2–arm particles that can link together into chains of different lengths. Then, they compute the viscosities of the few–particle clusters by using long–chain polymer entanglement theory.
Our approach here is different than those above in the following respects. First, we develop a structure–based theory. While simple proteins can often be approximated as spheres or featureless particles, antibodies, in contrast, are big, flexible and Y–shaped, and have interaction sites at particular locations on the Y. Second, we are able to treat a broader range of situations than just 2–arm (monospecific antibodies) binding. For example, of recent interest are synthetic bispecific antibodies (bsAbs), where each arm of the Y can bind to a different epitope, or with a different affinity [35]. Bispecific antibodies are attractive for cancer immunotherapies, where one arm binds to the tumor cell, while the other arm binds to a natural killer T cell, bringing the killer cell close enough to destroy the tumor cell [36, 37].
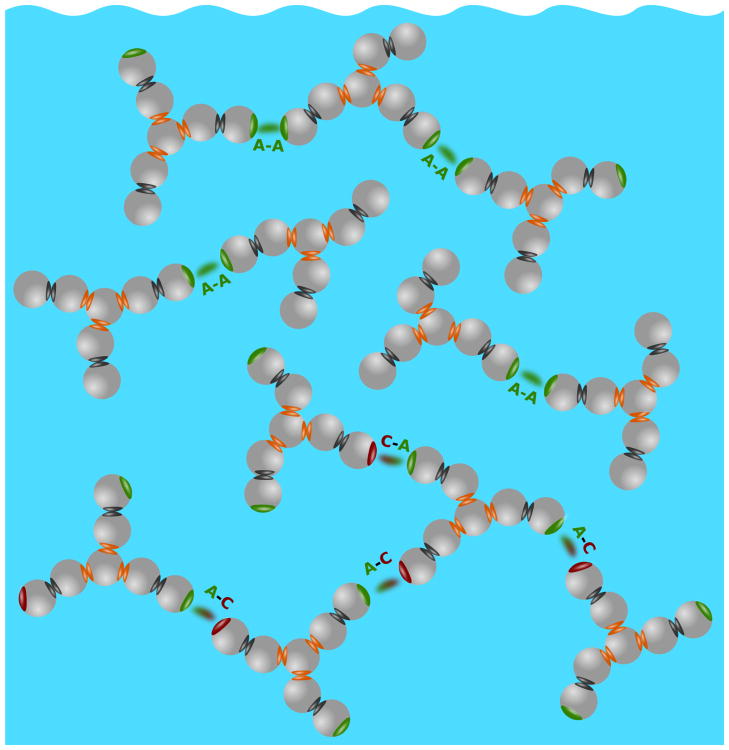
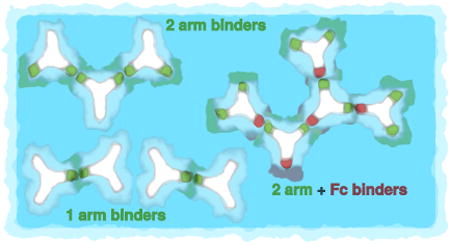
The present model is able to explore the aggregation properties of both monospecific, with two equal fragment antigen arms (Fab) and bispecific antibodies (unequal fragment antigen arms), as well as situations in which the Fc (fragment crystalizable) fragment is attractive. Third, we relate the viscosities to cluster distributions, building on the traditional solution theories of Einstein, Huggins, and Sudduth [38–40], rather than as entangled chains, since antibody clusters appear too small to be treatable as long–chain polymers. The results are presented for three different situations: (1) Monospecific mAbs, where the two Fab arms bind equally, and there is no binding to Fc. (2) Bispecific synthetic antibodies, where each Fab arm binds differently, and there is no binding to Fc region. And (3) Arms–to–Fc: Fab arms are identical, and either one of them can bind to Fc. Schematic illustration of clustering described above is shown in Fig. 1.
Figure 1.
Three types of antibody clustering studied in this work: top (1) Monospecific 2–arm binding, middle (2) Bispecific 1–arm binding, and bottom (3) Arms–to–Fc binding.
2. The 7–bead antibody model
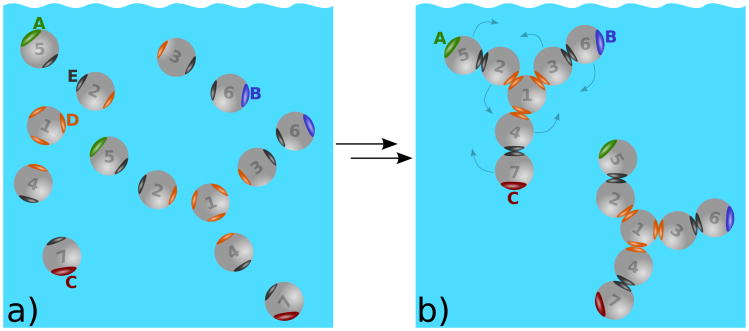
Much of solution statistical mechanics tends to focus on spherical particles. However, Wertheim's theories [41–43] afford us an interesting opportunity for modeling more complex particle shapes. We model antibody solution in two steps, starting with a multi–component mixture of hard spheres (each sphere having diameter σ = 3 nm) that have different attractive interactions. Those spheres self–assemble into Y–shaped molecules, as if they were covalently linked; see Fig. 2.
Figure 2.
a) Hard spheres form model antibody molecules through intramolecular sites D (orange) and E (black). b) Once the molecules are formed, they interact via the intermolecular sites A, B, and C. For better visualization the interaction sites A, B, C, D, and E are enlarged. Possible movements of the beads are on panel b) indicated by arrows. Notice that similar movements below and above the plane of the paper are possible. In this figure A and B sites represent Fab (fragment antigen–binding) regions and C the Fc (fragment crystalizable) region.
First we define the short-range interactions between spheres i and j, , as
| (1) |
| (2) |
where β = (kBT)−1 and T is the absolute temperature. Here rij denotes the distance between spheres of the type i and j, and Ωi, Ωj their orientations. zDD and zEE are the distances between sites D–D and E–E. Angular brackets 〈…〉Ω1Ω2 denote the orientation average, δ(…) is the Dirac delta function, and δij the Kronecker delta. Kronecker delta symbols within the curly brackets {…} provide rules for the intramolecular bond formations between the spheres i and j and sites D and E: 1D–D2, 1D–D3, 1D–D4, 2E–E5, 3E–E6, and 4E–E7 (six intramolecular bonds altogether). Note that each of the sites D and E can be bonded only once. Finally, the molecules modeling antibodies are formed upon enforcing the condition and . Once this limit is taken, no dissociation to separate spheres is possible. Within Wertheim's thermodynamic perturbation theory [41–43] the model molecules are flexible; the only restriction is the sequence of “bonds”, Eqs. (1) and (2), connecting the hard spheres as shown in Fig. 2.
Second, those Y–shaped particles then form a model one–component fluid of molecules, interacting via short–range attractive potentials from their unsatisfied attractive sites; see Fig. 2b. The sites are labeled A (green), B (blue), C (red), D (orange) and E (black). Only sites of the same color can bond to each other. For example, spheres of type 1 assemble at the center of the molecule; it has 3 C sites, contacting other sphere types 2, 3, and 4. In the first stage of incipient assembly, type D–D and E–E bonds form to create the Y–shaped antibody molecules. If the number density of hard spheres of type i (i = 1 … 7) is ρi then the number ρ of antibody molecules is also equal to ρi. These sites allow intermolecular association. We can write the pair potential among model antibody molecules k and l, ukl, as
| (3) |
where primes on the summation signs label the spheres composing antibody molecules k and l. Further, is the hard–sphere potential, while the sums over m and n count the intermolecular interactions among A, B, and C. Notice that α(5) = A, α(6) = B, and α(7) = C. Similarly as above, zAA, zAB, zAC, zBB, zBC, and zCC designate the distances between the pairs of sites.
Interactions among sites A, B, and C in Eq. (3), , have a form of the site–site square well potentials:
| (4) |
where εAA, εAB = εBA, εAC = εCA, εBB, εBC = εCB, and εCC (all defined as positive) are their square–well depths, and ω their range. Attraction between the sites causes for the model antibodies to form clusters. Note that two Fab ends are named A and B, while C stands for Fc end. Clustering is possible through attractive Fab–Fab and Fab–Fc interactions.
3. Wertheim's thermodynamic perturbation theory
To calculate properties of the model fluid we use Wertheim's thermodynamic perturbation theory (TPT1) [41–43]. In this approach we decompose the Helmholtz free energy F in the ideal Fid, hard-sphere Fhs, and association term Fass:
| (5) |
| (6) |
| (7) |
where Λ is the de Broglie thermal wavelength [44], ρt = 7ρ, η = πρtσ3/6, is the Percus–Yevick expression for the contact value of the hard–sphere radial distribution function [45], and XA, XB, and XC are the fractions of the particles, which do not bond via sites A, B, and C, respectively. The fractions follow from the statistical–mechanical analogue of the mass action law [43]:
| (8) |
| (9) |
| (10) |
where
| (11) |
| (12) |
for i and j to be A, B, or C. Here f̄ij(r) is the orientation average of the Mayer function for the square–well site–site interaction [46]. The orientation average is taken over all possible positions of sites A, B, C, D, and E on the beads. This introduces certain flexibility into the model, as indicated in Fig. 2.
Note that the association free energy, Eq. (7), contains the intermolecular association term and six intra–molecular terms each equal to . Osmotic pressure Π is now readily available using standard thermodynamic relations [44]. The second virial coefficient B2, quantifying the binary solute–solute interaction in dilute solutions, is defined as
| (13) |
and can be obtained from this expression at low number densities ρ. Note again that ρi stands for the number density of individual spheres i = 1 … 7, being equal to the number density of the antibody molecules ρ. It is necessary to emphasize that such models are only applicable in the domain of concentrations and pH values where proteins do not undergo major conformational changes [47, 48].
4. Fractions of nonbonded sites determine the solution properties
4.1. Modeling monospecific antibodies: both A and B arms bind identically, and C does not
The simplest possible case to examine is the one where the sites A and B are physically identical so εAA = εAB = εBB. Fab sites interact only in–between (there is no interaction with Fc site) so: εAC = εBC = εCC = 0. The quantity which completely determines the n–distribution, H(n, γ), and weight fraction distribution, P(n, γ), is the fraction of molecules, not bonded through site A, XA (XA = XB). From polymer physics it follows [49]
| (14) |
In addition to H(n, γ), we also defined the average cluster size, 〈n〉, as [49]
| (15) |
and obtain the exact result,
| (16) |
Note that P(n, γ) and H(n, γ) are related as 〈n〉P(n, γ) = nH(n, γ) and normalized: .
4.2. Modeling bispecific antibodies: sites A and B bind differently, and C does not
Distinction among sites A and B can be introduced in several ways. Here we select for εAA ≠ εBB and for the cross interaction to be zero; εAB = 0. As before, there is no interaction with Fc region. The n–distribution H(n, γ) is now determined not only by XA but also by the value of XB. Clusters of size n can be terminated by two A sites (A⋯A), by one A and one B site (A⋯B), or two B sites (B⋯B), depending on the parity of the n–mer cluster. If n is odd, only A⋯B terminated clusters are possible. For even n, the cluster starts and ends with same type of site. The n–distribution, H(n, γ), depends on the cluster parity [49]
| (17) |
where
| (18) |
In this case P(n, γ) and H(n, γ) as also 〈n〉 depend on values of εAA and εBB.
4.3. Modeling the Fab–Fc association
Here we assume that the sites A and B are bonded equally strongly to the C site (εAC = εBC) while all the other site–site attractions are set to zero. From the mass–action law, Eqs. (8), (9), and (10), we obtain the relation XC = 2XA − 1. Three attractive interactions per antibody molecule allow formation of clusters with branched topology. Similarly as above in 4.1 and 4.2 we can obtain the n–distribution H(n, γ) and examine 〈n〉. Following Rubinstein and Colby [49], we write
| (19) |
and, in the next step, also the analytical result for 〈n〉,
| (20) |
In this example both distributions as also < n > depend solely on εAC = εBC value.
5. Solution viscosity depends on the antibody cluster–size distribution
Standard theories give the viscosity, η, of a solution as a polynomial function of the mass concentration γ of the solute particles (mg of protein per mL of solution) [39, 49],
| (21) |
On the one hand, we give this expression here in order to define standard quantities of colloidal solutions, which we will use later. η0 is the viscosity of solvent, [η] is the intrinsic viscosity, kH is the Huggins constant [39, 49], while higher terms are of order γ3. On the other hand, polynomial function in this form is not sufficient for systems of associating particles, such as antibody solutions. To establish the connection between the cluster size and viscosity we assume that an increase of the mass concentration of the cluster with n antibody molecules dγn, contributes to the relative increase of viscosity dη/η as
| (22) |
The one-component version of Eq. (22), which was originally proposed by Sudduth [40], is generalized here to account for the presence of clusters (n > 1). For f(n) we adopt the form:
| (23) |
where c and d are adjustable parameters. This functional form is suggested by the experimental observations [34, 50], indicating a strong increase of solution viscosity for mAb concentrations above 90 mg/mL. Note that f(n) depends solely on the number of molecules involved, n, and not on their spatial distribution in the cluster. Increments of dγn depend on the total mass concentration of antibodies, γ, and the P(n, γ), which is the mass–weighted probability of finding an antibody molecule as a part of n–mer (i.e. a cluster containing n antibody molecules), as
| (24) |
Integration of Eq. (22) yields an expression for η of the form
| (25) |
6. Viscosity increases as power law of the antibody concentration
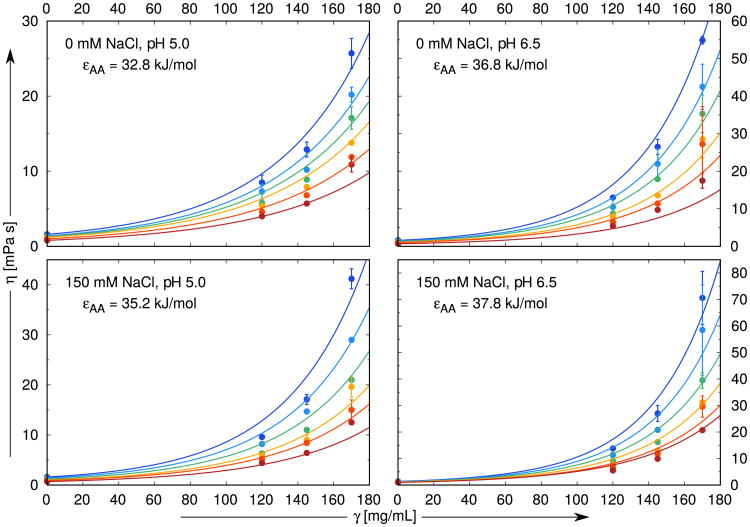
First, we computed solution viscosities for case described in 4.1 above (monospecific antibodies) so we set εAA = εAB = εBB. We fit the model calculations to the experimental data of Schmit et al [34] for the antistreptavidin IgG1 monoclonal antibody, as functions of concentrations of protein, added NaCl, pH, and temperature of the solution. The mass concentration of solution is γ = M2ρ/NA, where NA is Avogadro's number and M2 = 142, 000 g/mol is the molar mass of the antistreptavidin IgG1. Other parameters are obtained as follows: (i) we assume that range of interaction ω roughly equals the hydrogen bond length [31], so ω = 0.18 nm for all the experimental conditions studied here. (ii) We obtain the energy depths εAA and constants c and d in Eq. (23) by fitting to the experimental data [34]. Note that interaction energies define the fractions of the particles which do not bond via sites A, B, and C. This is the only information we need for further calculations. The resulting values of the parameters c and d are c = 0.01205 mL/mg and d = 0.3762, while εAA is taken to depend on solution conditions (pH and salt concentration but not temperature). εAA ranges from 32.8 to 37.9 kJ/mol, where larger values mean stronger attraction. Viscosity data for γ = 0, that is η0, are included in fit. Overall, we use 18 parameters to fit 96 experimental curves. Details of the fitting procedure are given in Section “Monospecific antibodies: Extraction of εAA from experimental data” of SI. The results, Fig. 3 and Fig. S1 of SI, show that viscosity increases sharply with protein concentration. And, with a few exceptions, the solution viscosities increase more rapidly with higher salt (NaCl) content and at higher pH values. Using Eq. (21) and the fit shown by the lines in Fig. 3 and Fig. S1, we obtained a value for the intrinsic viscosity, of [η] = (12.05 ± 0.05) cm3/g for all solution conditions. The value is close to the range from 7.0 to 11.5 cm3/g, observed in experimental studies on human, bovine, and pig IgG dissolved in aqueous solutions [51]. These values are higher than for globular proteins, where [η] ranges from 2.5 to 5.0 cm3/g, reflecting the sizes and shapes of the antibodies.
Figure 3.
Comparison of experimental data [34] (symbols) with the results of our model analysis (lines). NaCl concentrations are 0, 50, 100, and 150 mM, pH values studied here 5.0, 5.5, 6.0, 6.5, while the temperatures vary from 10 °C (top–blue) to 35 °C (bottom–red) in increments of 5 °C. The site–site interaction range ω is fixed to 0.18 nm for all calculations, while εAA varies from panel to panel. The data presented here are merely a part of the complete fit shown in Fig. S1.
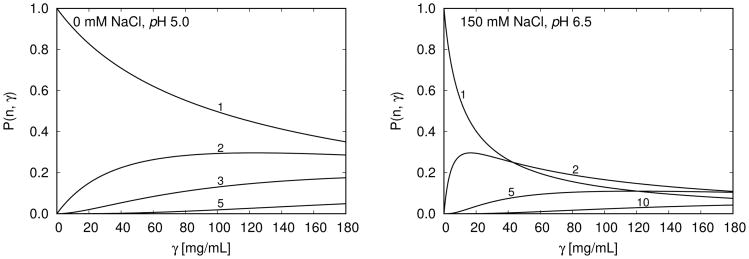
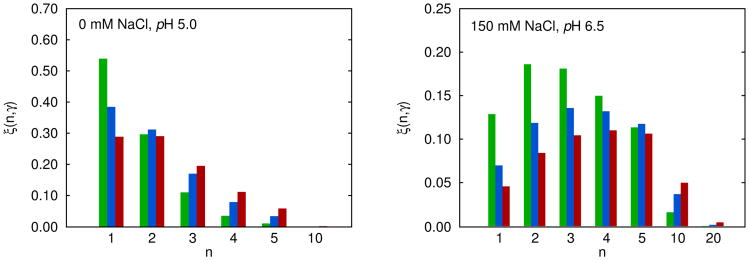
The model gives a microscopic explanation for the dramatic increases in viscosity. In Fig. 4 we see the cluster–size distributions vs. antibody concentration and for different salt concentrations. The main conclusions is that, higher protein and salt concentrations (as also pHs) lead to larger average cluster sizes. Fig. 5 presents a normalized version of this observation. We define the fractional contribution of n–mers to the viscosity as
Figure 4.
P(n, γ) for different cluster size n (1 denotes the monomer, 2 dimer, … etc; up to decamer denoted by 10) as a function of the protein mass concentration γ at 10 °C. (i) Left panel shows the low viscosity trends – no salt present, pH = 5.0, and (ii) the right panel presents the high viscosity trends – concentration of added NaCl is 150 mM, pH = 6.5; see also Fig. 3.
Figure 5.
Histogram of relative contributions of n–mers, ξ(n, γ), to viscosity at 10 °C; Eq. (26). Results are presented for three antibody concentrations: (i) γ = 60 – green, (ii) 110 – blue, and (ii) 160 mg/mL – red. Left panel: pH = 5.0, no salt added. Right panel: pH = 6.5, concentration of added NaCl is 150 mM, see also Fig. 4.
| (26) |
Fig. 5 shows how the cluster size distribution shifts with antibody concentrations. At low concentrations, clusters contain only 1–3 antibody molecules apiece. At higher concentrations, the most probable clusters contain about 3–5 molecules. In the left panel of Fig. 5 we see that at γ = 60 and 110 mg/mL, the largest contribution to viscosity comes from monomers, followed by dimers, trimers, and higher n–mers. At high protein concentration, where γ = 160 mg/mL, the contribution of monomers ξ(1, γ) is about the same as those of dimers. The high viscosity case, shown on the right panel of this figure, is more complex. In this example the ξ(n, γ) functions show the extrema, the positions of which depend on the protein concentration γ. Beyond a certain n value, the clusters make negligible contributions to viscosity. For the left panel this value is ten and for the right one n > 20. For the right panel we also calculated the position of maximum at different γ values. By applying the condition,
| (27) |
we obtain the term np
| (28) |
giving the largest contribution to the histogram. Because d is in our case merely a number (see Eq. (23)) equal to 0.3762, the fraction of non–bonded antibodies XA, or alternatively 〈n〉 (see Eq. (16)), determine np for all the conditions, where such an extreme exists. In the high viscosity limit, where XA ≪ 1, we obtain the following approximate result: np ≈ 1.4 < n >.
7. High–concentration aggregation properties can be predicted from low–density experiments
Exploring aggregation can be challenging because measuring properties in high–concentration solutions can be quirky, slow and technique–limited. On the other hand, measurements done on dilute solutions are often simpler, quicker, and also more reliable. So, it is of interest to know if antibody aggregation properties can be predicted from dilute–solution measurement. In a well–known example, this objective was achieved by George and Wilson [52], and then others [53–56], for predicting protein crystallization. George and Wilson showed a correlation between crystallization conditions (the high–concentration behavior) and the second virial coefficient, B22 (the low–concentration, pairwise–interaction behavior). They introduced the idea of “crystallization slot”, i.e. a region of B22 values between −20 × 10−5 and −80 × 10−5 cm3 mol g−2 [52], where protein crystallization is most likely to occur. B22 is defined through McMillan–Mayer osmotic virial equation [57],
| (29) |
where Π is the osmotic pressure, M2 the molar mass of protein and R the gas constant. B22 can be obtained from the Eq. (29) at low mass concentrations γ and is related to B2 in Eq. (13) as . The concept of “crystallization slot” has been experimentally confirmed for lysozyme, BSA, ovalbumin, and other globular proteins with molar masses around 14 kDa. For larger proteins with molar mass around 140 kDa, Haas [58] and co–workers suggested for the “crystallization slot” values ranging between −4 × 10⁻⁵ and −9 × 10⁻⁵ cm3 mol g−2. This finding is of interest for us because many antibodies [11, 12, 59], including the one studied in this work, have molar masses in this range.
7.1. Monospecific antibodies have identical binding arms
First, we show that two dilute–solution properties that reflect protein–protein pair interactions – the Huggins constant, kH and the second virial coefficient B22 – are closely related to each other, across a range of temperatures. Fig. 6 (left panel) shows excellent theoretical correlation between kH and B22. Note that both parameters B22 and kH are valid for dilute protein solutions, in our case this is up to 90 mg/mL. On the right panel of Fig. 6 we show the viscosity of antistreptavidin IgG1 solutions studied at γ = 150 mg/mL and correlate them with corresponding B22 values from the left panel (
 ). We supplement these data with the correlation between η and B22 measurements of Saito et al [59] for three subclasses of IgG1 antibodies at γ = 150 mg/mL and T = 20 °C: mAb–A (●), mAb–B (×), and mAb–C (Δ). The results indicate that B22 measurements, though in principle only apply to low protein concentration, contain important information about viscosity of concentrated solutions. This finding is confirmed by the recent work of Tomar el at [16], stating that large positive second osmotic coefficient is a good indicator of the low viscosity of antibody solutions up to 150 mg/mL.
Figure 6.
Left panel: theoretical correlation of the Huggins constant kH, Eq. (21), and the second virial coefficient B22, for the conditions of Fig. 3 and Fig. S1 – colors from cold to hot correspond to different temperatures. Note that both quantities are valid for dilute protein solutions, in our case this is up to 90 mg/mL. Right panel: correlation between the viscosities and second virial coefficients, B22, at T = 20 °C and γ = 150 mg/mL. (i) η–B22 theoretical correlation for antistreptavidin IgG1 solutions studied above: viscosities (
 ) correspond to fits in Fig. 3 and Fig. S1 and are correlated with B22 values from the left panel for solutions with different pH and concentration of NaCl. The green line is the best least–square fit through the data. (ii) experimentally measured correlation of Saito et al [59] for mAb–A (●), mAb–B (×), and mAb–C (Δ) solutions. Black lines serve to guide the eye.
7.2. Bispecific antibodies have two different binding arms. Each arm contributes differently to viscosity
Next we consider the aggregation of bispecific antibodies described in Section 4.2. The two arms, A and B, are not equal, so εAA ≠ εBB, and we assume εAB = 0. We call this Fab–Fab' association. Further, the binding energies are expressed in terms of r, the degree of asymmetry of the interactions,
| (30) |
| (31) |
where r takes on values from 0 (symmetric case) to 1. We set ε0 equal to 37.8 kJ/mol, which is the value for the site–site energy extracted from Fig. 3, for the case with highest viscosity (150 mM NaCl, pH = 6.5). Notice that while r varies the total strength of interaction, εAA + εBB, is kept constant. The calculation applies to T = 10 °C, while other potential parameters remain unchanged, ω = 0.18 nm, c = 0.01205 mL/mg, and d = 0.3762.
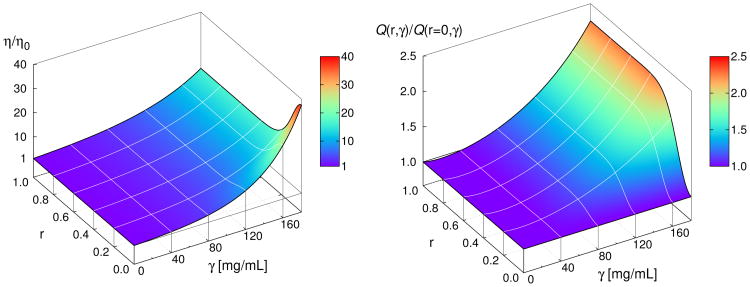
Fig. 7 (left panel) shows the predicted viscosities of bispecific antibodies as a function of both protein concentration and of the asymmetry of the arm interactions. The figure shows two points. First, it shows that when r = 0 (Fab arms are symmetrical), the viscosity increases sharply with concentration. Second, more interestingly, it shows that when r = 1 (εAA = 2ε0 and εBB = 0, very different arm interactions), the antibody solutions are predicted to have much lower viscosities. The interpretation is clear. For r = 0 model antibodies can link to each other through two linkage sites (both arms), leading to networks of two–armed multi–antibody clusters, like chains of people at a party. In contrast, bispecific antibodies in case that r = 1, can only link through a single arm, leading to clusters that are never bigger than dimers. The P(n, γ) distribution for this case (r = 1) drops from 1 to 0 for n = 1 and rises from 0 to 1 for n = 2 as soon as γ > 0. P(n, γ) distributions for intermediate values of r (0 ≤ r ≤ 1) are shown in the SI in Fig. S3.
Figure 7.
Left panel: relative viscosity η/η0 decreases sharply as the energies of the attractive sites A and B start to deviate from each other; that is for r > 0. Right panel: normalized quality factor Q(r, γ)/Q(r = 0, γ) as a function of protein concentration γ and degree of asymmetry r. Asymmetry r > 0 increases Q(r, γ)/Q(r = 0, γ) rapidly for γ > 100 mg/mL.
Here is an implication for antibody design. Normally, for biological efficacy, it is desirable that both arms of an antibody bind to an epitope, either for monospecific or bispecific antibodies. And, normally the objective, for bispecific antibodies, is to bind well to two different epitopes. But, consider now a situation in which it would be sufficient for the biology to have an antibody that binds to only one epitope through only a single Fab arm. To explore this quantitatively, we introduce the quantity Q = γ/(η/η0), which is the ratio between the concentration of antibody and its relative viscosity, with units mg of protein per mL of solution. Now the ratio Q(r, γ)/Q(r = 0, γ) gives the performance (efficacy divided by viscosity) of a bispecific antibody with asymmetry r relative to a model antibody with r = 0. When Q(r, γ)/Q(r = 0, γ) > 1, it means that using the second arm for viscosity control has paid off in allowing for greater concentrations, while Q(r, γ)/Q(r = 0, γ) = 1 implies no benefit in this regard.
In Fig. 7 (right panel) we investigate the effect of degree of asymmetry r on Q(r, γ)/Q(r = 0, γ). For r > 0 and for γ > 40 mg/mL we observe strong increase of the Q(r, γ)/Q(0, γ) ratio. At even higher γ values, small deviations of r from zero substantially increase this ratio. For example, changing r from 0 to 0.2 at γ = 120 mg/mL increases the Q(r, γ)/Q(r = 0, γ) ratio from unity to around 1.5, while the corresponding viscosity (η/η0) decreases from 9.5 to 7.0 as seen from the left panel in Fig. 7. Bispecific antibodies thus meet two important criteria for therapeutic applications: (i) they have low viscosity, and (ii) because higher concentrations can be used, their biological activity is enhanced. Note that in our theory the probability for the site on one Fab arm does not depend on the occupancy of the site on the other Fab arm. Violation of this assumption would change the results for Q.
7.3. When Fc is also attractive, the viscosity increases dramatically
Here, we consider again a situation of monospecific antibodies, in which the two arms are equally attractive. But now in addition, we allow for the possibility that the Fc site can also stick to either Fab arm. So we set εAC = εBC (as before equal to 37.8 kJ/mol), while all the other site–site attractions are equal to zero, see also Section 4.3 for details.
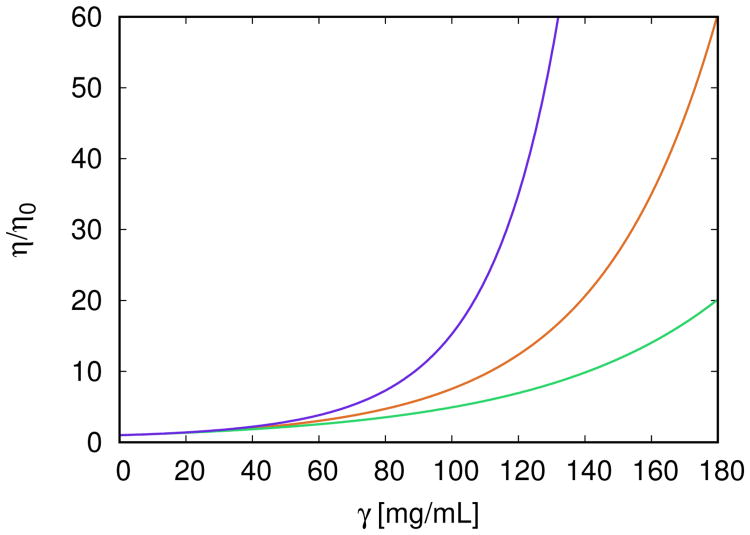
Summarizing, we find that these solutions have very high viscosity. Fig. 8 compares this to the earlier calculations above. This three–fold comparison is simple to interpret. In arms–to–Fc binding each antibody molecule has three attractive arms, so it can link to three neighboring antibody molecules. It can form highly connected branched networks, resulting in high viscosities. The P(n, γ) distributions for these solution conditions are given in Fig. S4 of SI. In monospecific binding, antibodies can, at most, link together as linear chains, leading to intermediate viscosities. In bispecific binding, antibodies can preferebly link together as dimers, leading to lower viscosities. In all three cases η/η0 rises with γ. For low protein concentration (up to 60 mg/mL), the differences between these three curves are small. At higher γ values the curves start to deviate strongly from each other. Under equivalent conditions the bispecific antibodies (green curve) appear to have the lowest solution viscosity. They are followed by the symmetric Fab–Fab case (red curve). In view of the solution viscosity, the worst scenario is the Fab–Fc association (blue curve). The reason for high viscosity in this case lyes in the fact that, because three sites are involved, branched clusters can be formed. Such antibodies are not good candidates for therapeutic use and should be avoided by synthesis. The three scenarios are illustrated in Fig. 8.
Figure 8.
Relative viscosity η/η0 as a function of antibody concentration γ for three scenarios studied so far. From bottom to top: (i) model of bispecific antibodies at the degree of asymmetry r = 0.2 (
 ), ε0 = 37.8 kJ/mol, see Eqs. (30) and (31); (ii) symmetric Fab–Fab model of antibodies (
 ), εAA = εAB = εBB = 37.8 kJ/mol; and (iii) model of interacting Fab–Fc terminals (
 ), εAC = εBC = 37.8 kJ/mol. Other parameters are ω = 0.18 nm, c = 0.01205 mL/mg, and d = 0.3762. Calculations apply to T = 10 °C.
8. Conclusions
Monoclonal antibodies constitute a major form of modern therapeutics. These biological drugs are usually formulated and delivered as highly concentrated solutions of antibody molecules. The problem is that such solutions tend to aggregate and have high viscosities. Unfortunately it is not understood how such solution aggregation properties are encoded within the molecular energies and locations of the attractive sites on the antibody molecules. In the present model, seven spherical particles self–assemble first into Y–shaped model antibody molecules, which then further self–assemble to form antibody clusters. We adapt the Wertheim theory of strongly associating liquids to calculate measurable properties. We used the data of Schmit et at [34] and our model to analyze viscosity measurements as functions of antibody concentration, pH, temperature and added sodium chloride concentration.
We study three situations: Monospecific: two identical Fab arms that are attractive. Bispecific: the two Fab arms have different attractive potential. Arms–to–Fc: two identical Fab arms and Fc are all attractive. The conclusion is that the arms–to–Fc case gives the highest viscosities because each molecule can link to three neighbors, forming dense networks (top curve of Fig. 8). The monospecific case (the middle curve) has lower viscosities because each molecule can link only to two neighbors, leading to linear chains. The bispecific case (the bottom curve) has the lowest viscosity since (in the limiting case, where r = 1) each molecule can link to only one neighbor. A general point here is that antibody solutions can be tailored to have different aggregation properties by tinkering with the antibody molecules themselves, rather than current strategy of tinkering with their formulation solutions.
The present study provides an additional evidence that coarse–grained models can be, in conjunction with Wertheim's theory, useful in interpreting experimental data of protein solutions. The model can in principle be extended in a spirit of our previous study [60] to include ions and water molecules explicitly.
Supplementary Material
Highlights.
We model the aggregation properties of antibodies in aqueous solutions.
In difference with previous theories the model molecules have a realistic (Y-like) shape and flexibility.
Wertheim's theory is adapted to analyse the measurements.
The aggregation can be controlled through modifying the antibody itself: bi-specific antibodies have lower viscosities than the monospecific ones.
Acknowledgments
This study was supported by the Slovenian Research Agency fund (ARRS) through the Program 0103–0201, by NIH research grant (GM063592), and Young Researchers Program (M. K.) of the Republic of Slovenia. The authors acknowledge fruitful discussions with Dr. Miha Lukšič.
Footnotes
Publisher's Disclaimer: This is a PDF file of an unedited manuscript that has been accepted for publication. As a service to our customers we are providing this early version of the manuscript. The manuscript will undergo copyediting, typesetting, and review of the resulting proof before it is published in its final citable form. Please note that during the production process errors may be discovered which could affect the content, and all legal disclaimers that apply to the journal pertain.
References
- 1.Butler M, Meness-Acosta A. Appl Microbiol Biotechnol. 2012;96:885–894. doi: 10.1007/s00253-012-4451-z. [DOI] [PMC free article] [PubMed] [Google Scholar]
- 2.Pindrus M, Shire SJ, Kelley RF, Demeule B, Wong R, Xu Y, Yadav S. Mol Pharmaceutics. 2015;12:3896–3907. doi: 10.1021/acs.molpharmaceut.5b00336. [DOI] [PubMed] [Google Scholar]
- 3.Connolly BD, Petry C, Yadav S, Demeule B, Ciaccio N, Moore JMR, Shire SJ, Gokarn YR. Biophys J. 2012;103:69–78. doi: 10.1016/j.bpj.2012.04.047. [DOI] [PMC free article] [PubMed] [Google Scholar]
- 4.Kanai S, Liu J, Patapoff TW, Shire SJ. J Pharm Sci. 2005;94:1928–1940. doi: 10.1002/jps.20347. [DOI] [PubMed] [Google Scholar]
- 5.Kanai S, Liu J, Patapoff TW, Shire SJ. J Pharm Sci. 2008;97:4219–4227. doi: 10.1002/jps.21322. [DOI] [PubMed] [Google Scholar]
- 6.Joubert MK, Luo Q, Nashed-Samuel Y, Wypych J, Narhi LO. J Biol Chem. 2011;286:25118–25133. doi: 10.1074/jbc.M110.160457. [DOI] [PMC free article] [PubMed] [Google Scholar]
- 7.Esfandiary R, Hayes DB, Parupudi A, Casas-Finet J, Bai S, Samra HS, Shah AU, Sathish HA. J Pharm Sci. 2013;102:62–72. doi: 10.1002/jps.23369. [DOI] [PubMed] [Google Scholar]
- 8.Li L, Kumar S, Buck PM, Burns C, Lavoie J, Singh SK, Warne NW, Nichols P, Luksha N, Boardman D. Pharm Res. 2014;31:3161–3178. doi: 10.1007/s11095-014-1409-0. [DOI] [PubMed] [Google Scholar]
- 9.Roberts D, Keeling R, Tracka M, van der Walle CF, Uddin S, Warwicker J, Curtis R. Mol Pharmaceutics. 2014;12:179–193. doi: 10.1021/mp500533c. [DOI] [PubMed] [Google Scholar]
- 10.Nicoud L, Lattuada M, Yates A, Morbidelli M. Soft Matter. 2015;11:5513–5522. doi: 10.1039/c5sm00513b. [DOI] [PubMed] [Google Scholar]
- 11.Rakel N, Bauer KC, Galm L, Hubbuch J. Biotechnol Progr. 2015;31:438–451. doi: 10.1002/btpr.2065. [DOI] [PubMed] [Google Scholar]
- 12.Roberts D, Keeling R, Tracka M, van der Walle CF, Uddin S, Warwicker J, Curtis R. Mol Pharmaceutics. 2015;12:179–193. doi: 10.1021/mp500533c. [DOI] [PubMed] [Google Scholar]
- 13.Arora J, Hu Y, Esfandiary R, Sathish HA, Bishop SM, Joshi SB, Middaugh CR, Volkin DB, Weis DD. MAbs. 2016;8:1561–1574. doi: 10.1080/19420862.2016.1222342. [DOI] [PMC free article] [PubMed] [Google Scholar]
- 14.Gonçalves AD, Alexander C, Roberts CJ, Spain SG, Uddin S, Allen S. RSC Adv. 2016;6:15143–15154. [Google Scholar]
- 15.Shire SJ, Shahrokh Z, Liu L. J Pharm Sci. 2004;93:1390–1402. doi: 10.1002/jps.20079. [DOI] [PubMed] [Google Scholar]
- 16.Tomar DS, Kumar S, Singh SK, Goswami S, Li L. mAbs. 2016;8:216–228. doi: 10.1080/19420862.2015.1128606. [DOI] [PMC free article] [PubMed] [Google Scholar]
- 17.Yadav S, Liu J, Shire SJ, Kalonia DS. Viscosity J Pharm Sci. 2010;99:1152–1168. doi: 10.1002/jps.21898. [DOI] [PubMed] [Google Scholar]
- 18.Chaudhri A, Zarraga IE, Kamerzell TJ, Brandt JP, Patapoff TW, Shire SJ, Voth GA. J Phys Chem B. 2012;116:8045–8057. doi: 10.1021/jp301140u. [DOI] [PubMed] [Google Scholar]
- 19.Buck PM, Chaudri A, Kumar S, Singh SK. Mol Pharmaceutics. 2014;12:127–139. doi: 10.1021/mp500485w. [DOI] [PubMed] [Google Scholar]
- 20.Fusco D, Charbonneau P. Colloids Surf, B. 2016;137:22–31. doi: 10.1016/j.colsurfb.2015.07.023. [DOI] [PubMed] [Google Scholar]
- 21.McManus JJ, Charbonneau P, Zaccarelli E, Asherie N. Curr Op Colloid Interf Sci. 2016;22:73–79. [Google Scholar]
- 22.Calero-Rubio C, Saluja A, Roberts CJ. J Phys Chem B. 2016;120:6592–6605. doi: 10.1021/acs.jpcb.6b04907. [DOI] [PubMed] [Google Scholar]
- 23.Verwey EJW, Overbeek JTG, editors. Theory of the Stability of Lyophobic Colloids. Elsevier; 1948. [Google Scholar]
- 24.Tavares TW, Prausnitz JM. Colloid Polym Sci. 2004;282:620–632. [Google Scholar]
- 25.Tavares TW, Prausnitz JM. J Phys Chem B. 2004;108:9228–9235. [Google Scholar]
- 26.Tavares TW, Bratko D, Prausnitz JM. Curr Opin Colloid In. 2004;9:81–86. [Google Scholar]
- 27.Minton AP. J Phys Chem B. 2012;116:9310–9315. doi: 10.1021/jp302748k. [DOI] [PMC free article] [PubMed] [Google Scholar]
- 28.Ross PD, Minton AP. Biochem Biophys Res Commun. 1977;76:971–976. doi: 10.1016/0006-291x(77)90950-0. [DOI] [PubMed] [Google Scholar]
- 29.Mooney M. J Colloid Sci. 1951;6:162–170. [Google Scholar]
- 30.Amin S, Barnett GV, Pathak JA, Roberts CJ, Sarangapani PS. Curr Opin Colloid Interface Sci. 2014;19:438–449. [Google Scholar]
- 31.Kastelic M, Kalyuzhnyi YV, Hribar-Lee B, Dill KA, Vlachy V. Proc Natl Acad Sci USA. 2015;112:6766–6770. doi: 10.1073/pnas.1507303112. [DOI] [PMC free article] [PubMed] [Google Scholar]
- 32.Kastelic M, Kalyuzhnyi YV, Vlachy V. Condens Matter Phys. 2016;19:23801. [Google Scholar]
- 33.Kastelic M, Kalyuzhnyi YV, Vlachy V. Soft Matter. 2016;12:7289–7298. doi: 10.1039/c6sm01513a. [DOI] [PMC free article] [PubMed] [Google Scholar]
- 34.Schmit JD, He F, Mishra S, Ketchem RR, Woods CE, Kerwin BA. J Phys Chem B. 2014;118:5044–5049. doi: 10.1021/jp500434b. [DOI] [PubMed] [Google Scholar]
- 35.Kontermann RE, Brinkmann U. Drug Discovery Today. 2015;20:838–847. doi: 10.1016/j.drudis.2015.02.008. [DOI] [PubMed] [Google Scholar]
- 36.Chames P, Baty D. mAbs. 2009;1:539–547. doi: 10.4161/mabs.1.6.10015. [DOI] [PMC free article] [PubMed] [Google Scholar]
- 37.Fan G, Wang Z, Hao M, Li J. J Hematol Oncol. 2015;8:1–14. doi: 10.1186/s13045-015-0227-0. [DOI] [PMC free article] [PubMed] [Google Scholar]
- 38.Einstein A. Ann Phys. 1906;19:289–306. [Google Scholar]
- 39.Huggins ML. J Am Chem Soc. 1942;64:2716–2718. [Google Scholar]
- 40.Sudduth RD. J Appl Polym Sci. 1993;48:25–36. [Google Scholar]
- 41.Wertheim MS. J Stat Phys. 1986;42:459–476. [Google Scholar]
- 42.Wertheim MS. J Stat Phys. 1986;42:477–492. [Google Scholar]
- 43.Chapman WG, Jackson G, Gubbins KE. Mol Phys. 1988;65:1057–1079. [Google Scholar]
- 44.Hansen JP, Mc Donald IR, editors. Theory of Simple Liquids. Elsevier; 2006. [Google Scholar]
- 45.Lebowitz JL. Phys Rev. 1964;133:A895–A899. [Google Scholar]
- 46.Wertheim MS. J Chem Phys. 1986;85:2929–2936. [Google Scholar]
- 47.Sarangapani PS, Hudson SD, Jones RL, Douglas JF, Pathak JA. Biophys J. 2015;108:1–14. doi: 10.1016/j.bpj.2014.11.3483. [DOI] [PMC free article] [PubMed] [Google Scholar]
- 48.Prausnitz JM. Biophys J. 2015;108:1–2. [Google Scholar]
- 49.Rubinstein M, Colby RH, editors. Polymer Physics. Oxford University Press; 2003. [Google Scholar]
- 50.Dear BJ, Hung JJ, Truskett TM, Johnston KP. Pharm Res. 2017;34:193–207. doi: 10.1007/s11095-016-2055-5. [DOI] [PubMed] [Google Scholar]
- 51.Monkos K, Turczynski B. Int J Biol Macromol. 1999;26:155–159. doi: 10.1016/s0141-8130(99)00080-x. [DOI] [PubMed] [Google Scholar]
- 52.George A, Wilson WW. Acta Crystallogr D. 1994;50:361–365. doi: 10.1107/S0907444994001216. [DOI] [PubMed] [Google Scholar]
- 53.Neal BL, Asthagiri D, Velev OD, Lenhoff AM, Kaler EW. J Cryst Growth. 1999;196:377–387. [Google Scholar]
- 54.Bonneté F, Finet S, Tardieu A. J Cryst Growth. 1999;196:403–414. [Google Scholar]
- 55.Vliegenthart GA, Lekkerkerker HNW. J Chem Phys. 2000;112:5364–5369. [Google Scholar]
- 56.Ruppert S, Sandler SI, Lenhoff AM. Biotechnol Prog. 2001;17:182–187. doi: 10.1021/bp0001314. [DOI] [PubMed] [Google Scholar]
- 57.McMillan WG, Mayer JE. J Chem Phys. 1945;13:276–305. [Google Scholar]
- 58.Haas C, Drenth JJ, Wilson WW. J Phys Chem B. 1999;103:2808–2811. [Google Scholar]
- 59.Saito S, Hasegawa J, Kobayashi N, Kishi N, Uchiyama S, Fukui K. Pharm Res. 2012;29:397–410. doi: 10.1007/s11095-011-0563-x. [DOI] [PubMed] [Google Scholar]
- 60.Kalyuzhnyi YV, Vlachy V. J Chem Phys. 2016;144:215101. doi: 10.1063/1.4953067. [DOI] [PMC free article] [PubMed] [Google Scholar]
Associated Data
This section collects any data citations, data availability statements, or supplementary materials included in this article.


