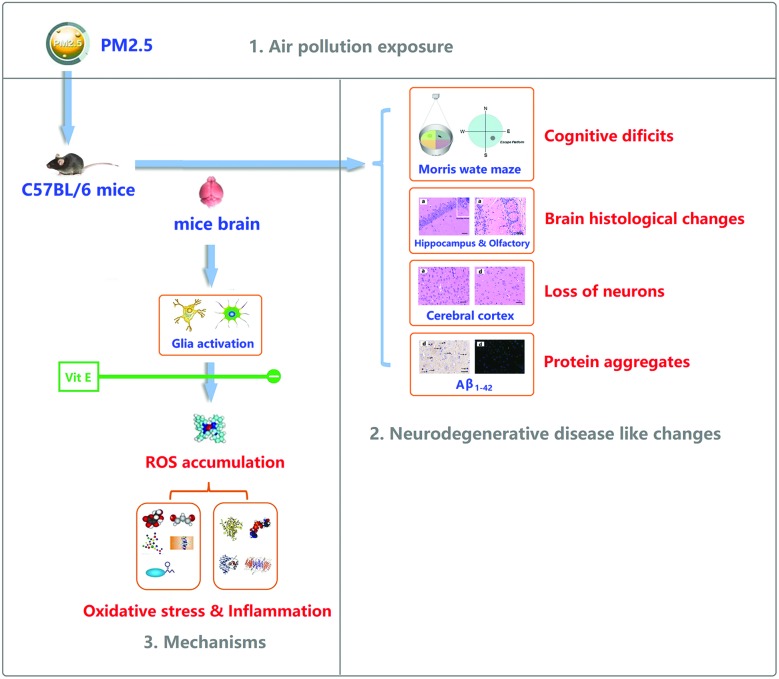
 After PM2.5 exposure, ND-like changes were induced through oxidative stress and inflammation, Vit E could antagonise the effects.
Abstract
Neurodegenerative diseases (ND) affect a large and ever-growing population globally, resulting in heavy burdens for patients and their families. Though some specific genes related to ND have been identified, the genetic factors fail to fully account for the pathogenesis of ND. Therefore, the roles of the environment and life styles in the occurrence of ND are being actively probed. As a typical air pollutant, exposures to PM2.5 are linked to the occurrence of ND. However, there are still few studies on this exposure, particularly on the in vivo and molecular mechanisms of the ND-like lesions after PM2.5 exposure. To investigate this link further, C57BL/6J mice were exposed everyday to PM2.5 for one week. Then, resulting brain damage and upstream events were investigated. After acute PM2.5 exposure, several ND-like changes were detected, such as cognitive deficits, loss of neurons, protein aggregates etc. Oxidative stress and inflammation may be involved with these toxic mechanisms. These effects were blocked by concurrent administration of vitamin E (Vit E). Down-regulation of oxidative stress and inflammation were proposed to explain the antagonistic effects of Vit E.
Introduction
Ambient fine particulate matter (aerodynamic diameter <2.5 μm, PM2.5) is one of the most widespread health threats air pollutant associated with respiratory and cardiovascular pathologies, such as lung cancer, heart disease, and asthma etc.1–4 Recently, increasing evidence suggests that exposure to air pollution not only harms the human heart and lungs, but may also affect the brain.5
Neurodegenerative diseases (ND), including Alzheimer's disease, Parkinson's disease, Amyotrophic lateral sclerosis, and Frontotemporal dementia, affect a large and ever-growing population globally.6 The major clinical symptoms of ND are devastating changes in behavior and cognition. Collectively, pathological markers of ND include dysfunction and loss of synapses and neurons, the formation of protein aggregates, and neuroinflammation.7,8 These changes eventually disrupt connectivity in the neuronal circuitry of the brain.
Though specific genes related to some ND have been identified, the genetic factors fail to fully account for the pathogenesis of ND.9 Therefore, the roles of environment and life styles in the occurrence of ND are being actively probed. Epidemiological studies have shown that there is a correlation between exposure to PM2.5 and the occurrence of ND,10 while the mechanisms driving the pathology are unclear, particularly the in vivo and molecular mechanisms. Whether exposure to PM2.5 contributes to the development of ND, how they affect the brain and what is the potential underlying mechanism all these questions remain controversial and need further investigation.
The aims of this study are (1) to identify whether the development of ND is due to exposure to PM2.5, (2) to explore the possible mechanisms of the effects, (3) try to provide a strategy to antagonize ND risks. To address these objectives, male C57BL/6J mice were exposed to PM2.5 daily for one week, after which several biological endpoints and upstream events were investigated.
Materials and methods
All experimental procedures were approved by the Office of Scientific Research Management of Central China Normal University (Wuhan, China), and animal experiments were conducted under the National Institutes of Health Guide for the Care and Use of Laboratory Animals, with a certificate of Application for the Use of Animals dated 24 January 2016 (approval ID: CCNU-IACUC-2016-003).
Animals
SPF male C57BL/6J mice (6 weeks old, 22 g) were supplied by the Hubei Province Experimental Animal Center (Wuhan, China). All mice were maintained in pathogen-free cages at 20–25 °C with 50–70% humidity and a 12 h light/dark cycle, and they were provided with a commercial diet and filtered water ad libitum.
Collection and components analysis of PM2.5
A high traffic, total suspended particulates sampler (KC-1000, Qingdao, China) was used to collect ambient air composed of PM < 2.5 μm in Wuhan, China. The collected PM2.5 glass filter membranes were cut into small pieces and processed ultrasonically in ultrapure water for 40 min. The extracted liquid was vacuum freeze-dried and cryogenically preserved. The elements in the samples were analyzed using inductively coupled plasma atomic emission spectroscopy (ICP-AES, 61E Trace and ICP-750, Thermo JarrellAsh, MA) after acid digestion with mixed acids (68% nitric, 38% hydrofluoric, and 70% perchloric = 5 : 1 : 1) was performed at 180 °C for 3 h. The water soluble components in the samples were analyzed using ion chromatography (DX-100, Dionex, Sunnyvale, CA) and ICP-AES (61E Trace, Thermo Jarrell-Ash). Polycyclic Aromatic Hydrocarbons (PAHs) were analyzed according to a previously reported method.11 The data of PM2.5 components analysis is provided in ESI (Fig. S1, Tables S1–S3†).
Preparation of PM2.5
In China the environmental exposure hygienic standard of PM2.5 is 35 μg m–3. However, the PM2.5 pollution has become more and more serious, according to the “Report on the State of the Environment in China” published by the Ministry of Environmental Protection (China); PM2.5 is a major air pollutant in China. For example, the annual mean concentration of PM2.5 exceeds the national standard from 2012 to 2016 and the mean concentration of PM2.5 in major cities like Beijing–Tianjin–Hebei Region is even up to 100 μg m–3. According to some studies, the indoor PM2.5 concentration of many offices and public places in China is the same as, or in some cases higher than the outdoor concentration. For example, in Beijing, Shanghai, Wuhan, Chongqin, and Nanchang, the indoor PM2.5 concentrations were measured at 85 μg m–3, 142 μg m–3, 92 μg m–3, 211 μg m–3, and 103 μg m–3 during the test period, respectively.12 The actual daily exposure level is higher than the national hygienic standard. In order to simulate real human exposure using these measured concentrations as a guide, we used 100 μg m–3 (for human) as the exposure dosage in this study. The tidal volume for a human is roughly 15 m3 day–1, so the exposure dose of PM2.5 is 0.1 mg m–3 × 15 m3 day–1 = 1.5 mg day–1. Converting this exposure dosage to mice,13 which results in equivalent effects on humans of 0.193 mg kg–1 day–1 (for mice). In this study we used PM2.5 exposure dosages of 0 mg kg–1 day–1, 0.193 mg kg–1 day–1, 1.93 mg kg–1 day–1, and 19.3 mg kg–1 day–1 for the experiments. Before the experiment, the freeze-dried particulate matter was mixed with normal saline to get a particle suspension, which was then subjected to ultrasonic oscillation for 15 min, ensuring that the suspension was uniform and sterile, and the volume of intranasal instillation was 10 μL.
Experimental protocol
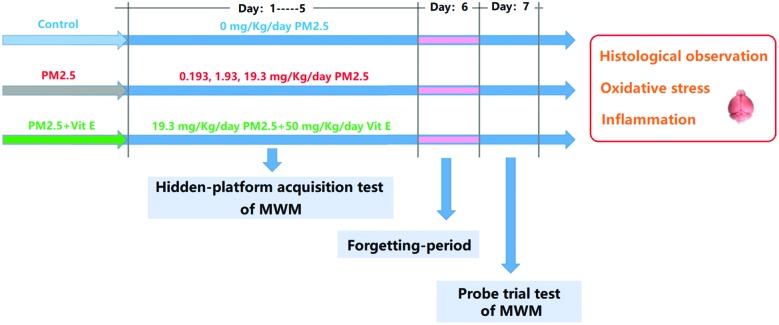
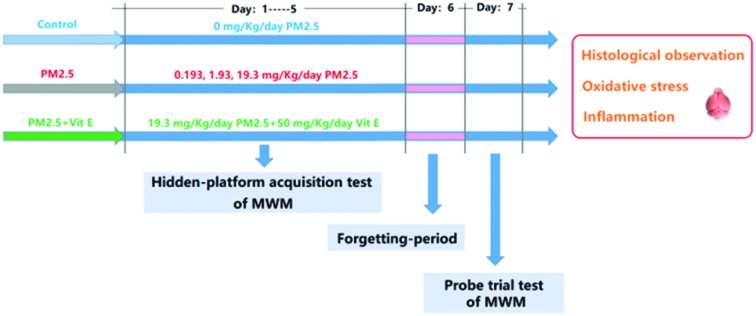
The experimental protocol (two rounds) to address the stated aims of this study is given in Fig. 1. In the first round, mice were divided randomly into 4 groups (ten animals for each group), and were exposed to PM2.5 (0 mg kg–1 day–1, 0.193 mg kg–1 day–1, 1.93 mg kg–1 day–1, and 19.3 mg kg–1 day–1). In the second round, mice were exposed to 19.3 mg kg–1 day–1 PM2.5 + 50 mg kg–1 day–1 vitamin E (Vit E).14 The mice were exposed to PM2.5 by intranasal instillation and Vit E by intragastric administration daily for 7 days. Throughout the experimental period, the Morris Water Maze (MWM) was performed to evaluate the cognitive ability of the mice after exposure. After the MWM, some pathological hallmarks of ND were investigated. To explore possible mechanisms behind the resulting damage, some key upstream events were examined.
Fig. 1. The experimental protocol.
MWM
The MWM test was performed to measure the cognitive ability of mice. In this study, the training continued from the first day to the fifth day (hidden-platform acquisition test), and each mouse was trained three times each day. The time that the mice spend looking for the platform is termed “escape latency (EL)”. If a mouse failed to find the platform within 60s, the EL was recorded as 60s. We, then, guided the mouse to the platform and kept it there for 30s so it could learn. On the sixth day, no MWM test was performed (forgetting-period), but on the seventh day the MWM test was performed again, but with no platform in the pool. In this case, the mice were also put into the pool and forced to swim for 60s. During this period, the swimming tracks were recorded by camera. The swimming time spent in the southeast (SE) quadrant (where the platform was previously) reflects the spatial memory ability of the mice after exposure (probe trial test).
Histological examination
Brain samples were fixed in a mixture (saturated 2,4,6-trinitrophenol/formalin/glacial acetic acid [15 : 5 : 1 v/v/v]) for 24 h at room temperature. Samples were then embedded in paraffin and sectioned into 10 μm slices for hematoxylin and eosin (H&E) staining. All sections were examined and photographed at ×400 magnification using a microscope (DM 4000B, Leica, Berlin, Germany). The number of cells in each of the slices from the cerebral cortex were counted by software (Image-Pro Plus 6.0, Media Cybernetics, Bethesda, MD, USA).
Immunohistochemistry (HIS) for Aβ1-42, Iba1, and GFAP
Brain sections were incubated with diluted primary antibodies (rabbit anti-Aβ1-42, Iba1, GFAP antibody, 1 : 200 dilution). Then, antibody binding was detected by biotinylated immunoglobulins and avidin–biotin peroxidase complex as previously described.15 Immunostained sections were observed under a DM 4000B microscope. Every section was scanned and the images were examined using Image-Pro Plus 6.0 software. A non-stained region was selected and set as the background. The staining intensity OD of each section was detected through Image-Pro Plus 6.0 software. All tissue sections were examined qualitatively by two experienced pathologists in a blinded fashion.
Immunofluorescence (IF) for Aβ1-42, Iba1, and GFAP
Brain sections were blocked with 5% bovine serum albumin for 30 min and incubated with anti-paxillin antibody or anti-phosphotyrosine antibody at 4 °C overnight. Subsequently, brain sections were washed and incubated with Cy-3-conjugated or FITC-conjugated secondary antibody at 37 °C for 60 min, washed again, mounted, and examined under a fluorescence microscope. The cells were also counterstained with DAPI for nuclear staining. Fluorescence images were recorded using a Leica Qwin V3 (Leica Microsystems). Every section was scanned and the images were examined using Image-Pro Plus 6.0 software. A non-stained region was selected and set as the background. The staining intensity OD of each section was detected through Image-Pro Plus 6.0 software. All tissue sections were examined qualitatively by two experienced pathologists in a blinded fashion.
Brain sample homogenate
The mouse brains were collected and weighed. These were put into a glass homogenizer on ice, and PBS (pH = 7.5, 10 mL g–1) was added into the homogenizer. The homogenate was then centrifuged at 10 000 rpm for 10 min at 4 °C. The supernatant was collected for the assessment of some bio-markers; the protein concentration of the supernatant was determined using the Lowry assay.
Assessment of reactive oxygen species (ROS), malondialdehyde (MDA), and glutathione (GSH)
The ROS, MDA, and GSH content of the mouse brain homogenate was measured using 2′,7′-dichlorofluorescin diacetate (DCFH-DA), 2-thiobarbituric acid (TBA), and 3-carboxy-4-nitrophenyl disulfide (DTNB) respectively, as previously described.16
Analysis of superoxide dismutase (SOD) activity
SOD activity was determined using a SOD assay kit (Jiancheng, Nanjing, Jiangsu, China). The kit was used according to the instructions provided by the manufacturer.
Detection of 8-hydroxy-2-deoxyguanosine (8-OH-dG) content
An ELISA kit (R&D System, Minneapolis, MN, USA) was used to measure the 8-OH-dG concentration (sensitive of the kit was 0.5 nmol mg–1 protein) in the brain supernatant according to the manufacturer's instructions.
Analysis of nuclear factor κB (NF-κB), tumor necrosis factor α (TNF-α), interleukin-1β (IL-1β), and Cyclooxygenase 2 (COX-2) content
ELISA kits provided by eBioscience (eBioscience, San Diego, CA, USA) were used to measure the concentrations of NF-κB, TNF-α, IL-1β (the sensitivity of each kit was 50 pg mg–1 protein, 8 pg mg–1 protein, 20 pg mg–1 protein, 0.5 ng mg–1 protein, respectively). AndKits supplied through BlueGene (BlueGene Biotech Company, Shanghai, China) were used to detect the content of COX-2. All kits were used according to the directions provided by the manufacturers.
Statistical analyses
Repeated ANOVAs combined with a post hoc Tukey test were used for the first 5 days average EL analyses in the MWM to determine whether there was any significant difference between groups. All other data collected were analyzed by a one-way ANOVA followed by a Tukey test. Values of p < 0.05 were considered statistically significant. Data analyses were carried out using SPSS 13.0 (Chicago, IL, USA) and generated statistical graphs using GraphPad Prism 5.0 (San Diego, CA, USA).
Results
Cognitive deficits in mice after PM2.5 exposure
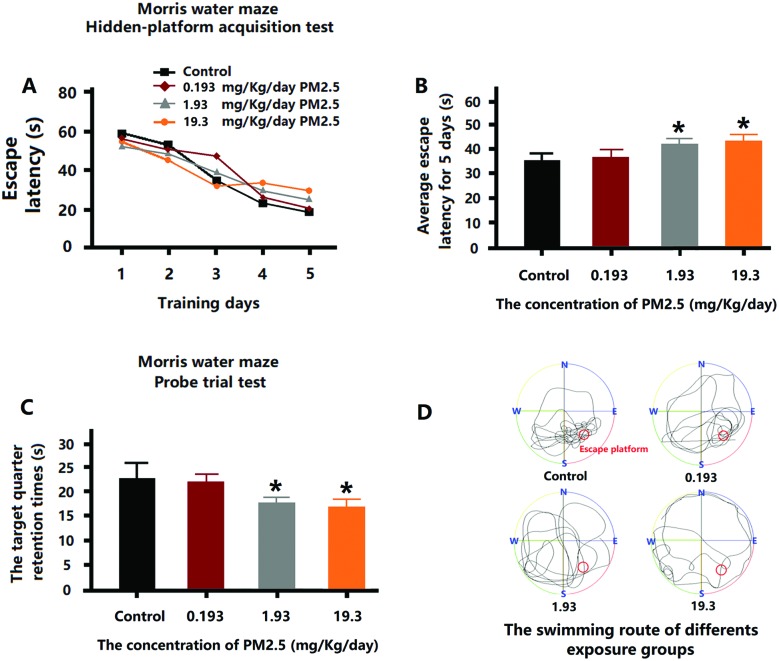
After 5 days of training, each of the mice in the exposure group exhibited a reduction in EL (Fig. 2A). However, the average EL for 5 days of 1.93 mg kg–1 day–1 and 19.3 mg kg–1 day–1 PM2.5 exposure groups were higher than control group (Fig. 2B). On the seventh day, the time that the mice stayed in the platform quadrant (SE quadrant) was remarkably shorter for the mice that received 1.93 mg kg–1 day–1 and 19.3 mg kg–1 day–1 PM2.5 (Fig. 2C). Through the swimming routes of the mice on the seventh day, it can be seen that the routes of the control group were primarily in the platform quadrant, while the routes of the 1.93 mg kg–1 day–1 and 19.3 mg kg–1 day–1 PM2.5 exposure groups were irregular and showed no purpose (Fig. 2D). However, the mice subjected to 0.193 mg kg–1 day–1 PM2.5 exposure levels did not demonstrate any adverse effects.
Fig. 2. MWM test after PM2.5 exposure. (A) The EL for the first 5 days training. (B) The average EL for the first 5 days training. (C) The time spent swimming in the SE quadrant on the seventh day. (D) The swimming route on the seventh day. *p < 0.05, **p < 0.01, compared with the control group.
Brain histological changes in mice after PM2.5 exposure
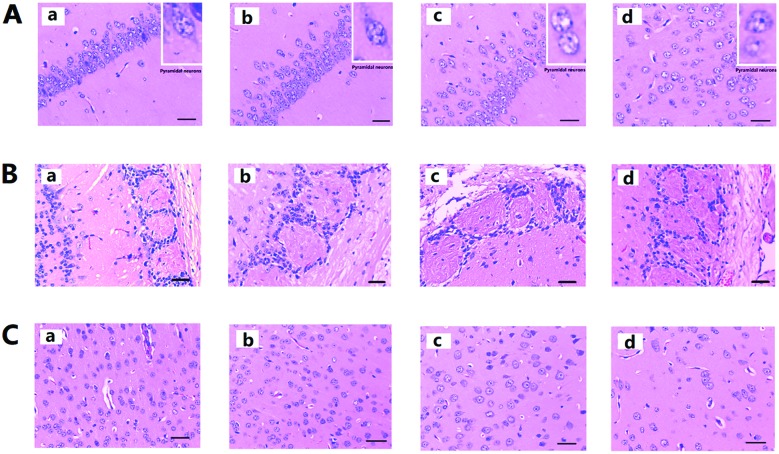
In Fig. 3A, the pyramidal cells of the hippocampus CA1 region of the control group are neatly aligned, the cells have clear edges and are polygonal in shape, and the apical dendrites are clearly visible. After PM2.5 exposure, with increasing exposure concentrations, cell arrangement became loose and disordered, the cell shape became swollen and deformed, and the apical dendrites shortened or even disappeared. Fig. 3B shows the olfactory bulb changes after PM2.5 exposure, the structure of the synaptic glomerulus in the olfactory bulb of control group was integrated and arranged in a tidy manner; however, with increasing exposure concentrations, the circular structure of the synaptic glomerulus was destroyed. Fig. 3C showed histological changes in the cerebral cortex after PM2.5 exposure. Compared with the control groups the cell morphology did not change significantly. However, reduction in the number of cells after exposure to 19.3 mg kg–1 day–1 PM2.5 was noticed (ESI, Table S4†).
Fig. 3. Histological observation of mouse brain after PM2.5 exposure. (A) H&E staining for hippocampus. (B) H&E staining for olfactory bulb. (C) H&E staining for cerebral cortex. Each of the four images (a, b, c, and d) represent the four different exposure groups (0 mg kg–1 day–1, 0.193 mg kg–1 day–1, 1.93 mg kg–1 day–1, and 19.3 mg kg–1 day–1 PM2.5, respectively).
Protein aggregates in mouse brain after PM2.5 exposure
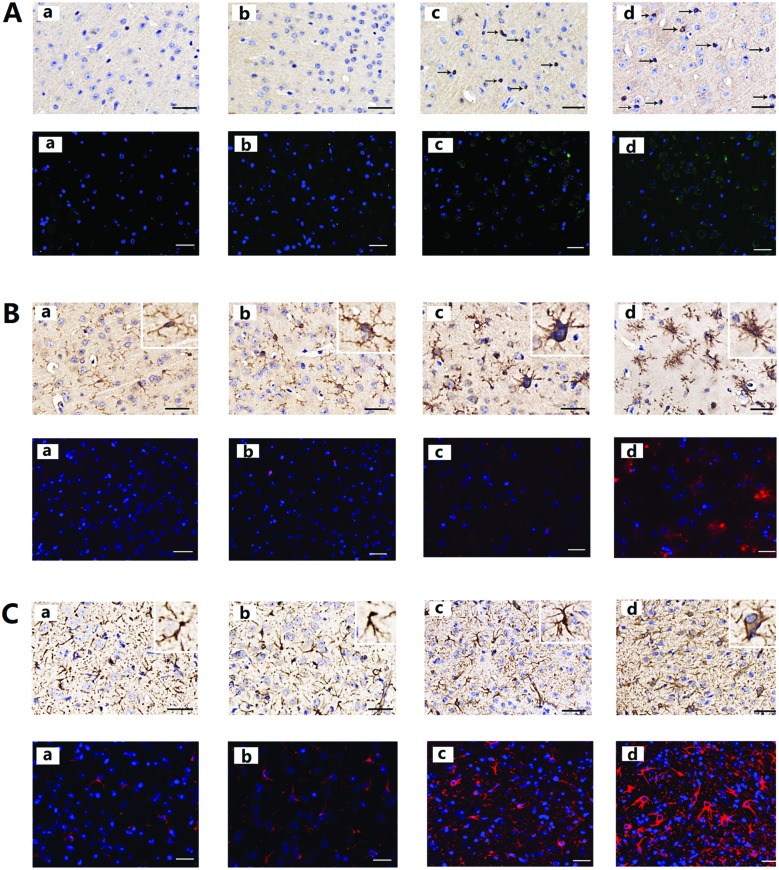
After PM2.5 exposure, protein aggregates were present in the cerebral cortex of mice, and neuronal accumulation of Aβ1-42 is shown in Fig. 4A. After exposure to PM2.5, the number of cells positive with Aβ1-42 increased. Increases in average OD were detected in mice after exposure to 1.93 mg kg–1 day–1 and 19.3 mg kg–1 day–1 PM2.5 (ESI, Table S5†).
Fig. 4. Aβ1-42, Iba1, and GFAP expression in mouse brain after PM2.5 exposure. (A) The expression of Aβ1-42. (B) The expression of Iba1. (C) The expression of GFAP. Each of the four images (a, b, c, and d) represent the four different exposure groups (0 mg kg–1 day–1, 0.193 mg kg–1 day–1, 1.93 mg kg–1 day–1, and 19.3 mg kg–1 day–1 PM2.5, respectively).
Glia activation in mouse brain after PM2.5 exposure
As shown in Fig. 4B, in the control animals the microglia displayed a ramified morphology with small cell bodies and elongated cell neurites, which are all characteristic features of resting microglia. As the exposure concentrations of PM2.5 increased, Iba1-positive cell size increased, neurites retracted and coarsened, and some spines were found on the neurites. Significant changes in Iba1 levels were observed in the mice after 1.93 mg kg–1 day–1 and 19.3 mg kg–1 day–1 PM2.5 exposure (ESI, Table S5†). From Fig. 4C, astrocyte activation can also be observed. In control animals, the astrocytes presented their normal morphology with non-hypertrophic cell bodies and a ramified pattern of their branches. After exposure to 1.93 mg kg–1 day–1 and 19.3 mg kg–1 day–1 PM2.5, astrocytes were activated, this was characterized by increased cell body volume and branches became more ramified. In addition, expression of GFAP in the cerebral cortex increased significantly (ESI, Table S5†).
Effect of PM2.5 on oxidation stress level in mouse brain
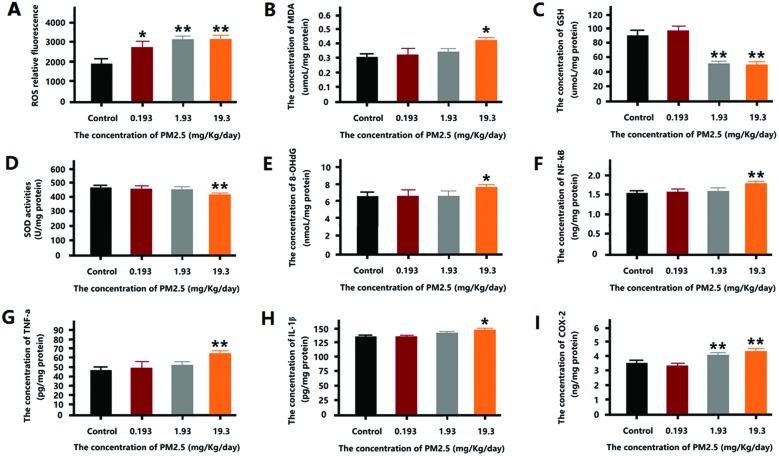
According to Fig. 5, a significant increase in ROS level was observed in the mice of all exposure groups (Fig. 5A). The MDA content in mouse brain increased dramatically after 19.3 mg kg–1 day–1 PM2.5 exposure (Fig. 5B). Conversely, the GSH content of the 1.93 mg kg–1 day–1 and 19.3 mg kg–1 day–1 groups decreased significantly (Fig. 5C). The degree of SOD activity showed a similar trend to the GSH content, with the 19.3 mg kg–1 day–1 group showing a significant reduction in SOD activity (Fig. 5D). 8-OH-dG was used to measure the DNA damage associated with oxidation stress, as shown in Fig. 5E, 8-OH-dG increased significantly after 19.3 mg kg–1 day–1 PM2.5 exposure.
Fig. 5. The oxidative stress level after PM2.5 exposure. (A) The relative fluorescence of ROS in mouse brain after exposure. (B) The concentration of MDA in mouse brain after exposure. (C) The concentration of GSH in mouse brain after exposure. (D) The SOD activity in mouse brain after exposure. (E) The level of 8-OH-dG in the mouse brain after exposure. (F) The concentration of NF-κB in the mouse brain after exposure. (G) The concentration of TNF-a in the mouse brain after exposure. (H) The concentration of IL-1β in mouse brain after exposure. (I) The concentration of COX-2 in mouse brain after exposure. *p < 0.05, **p < 0.01, compared with the control group.
Effect of PM2.5 on inflammation levels in mouse brain
According to Fig. 5F–I, after exposure to 19.3 mg kg–1 day–1 PM2.5, the expression of NF-κB, TNF-α, and IL-1β increased significantly. However, 1.93 mg kg–1 day–1 and 19.3 mg kg–1 day–1 PM2.5 induced an increase in COX-2 expression.
The neuroprotective effects of Vit E
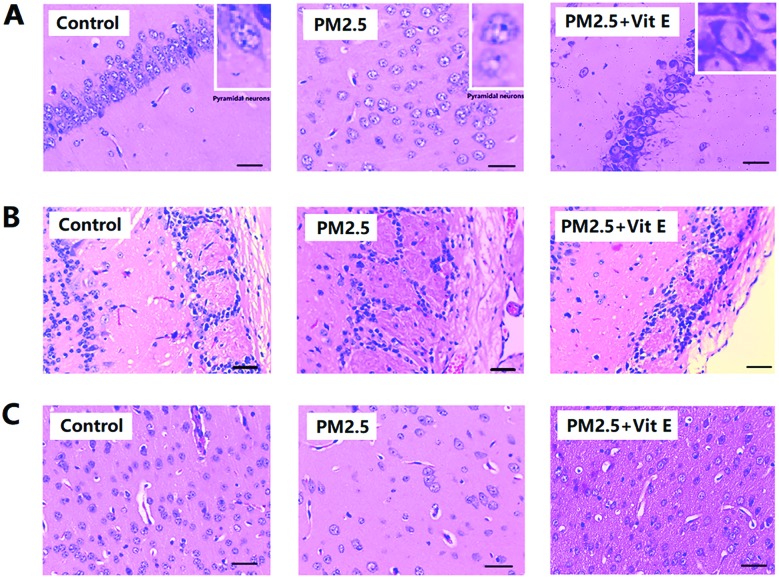
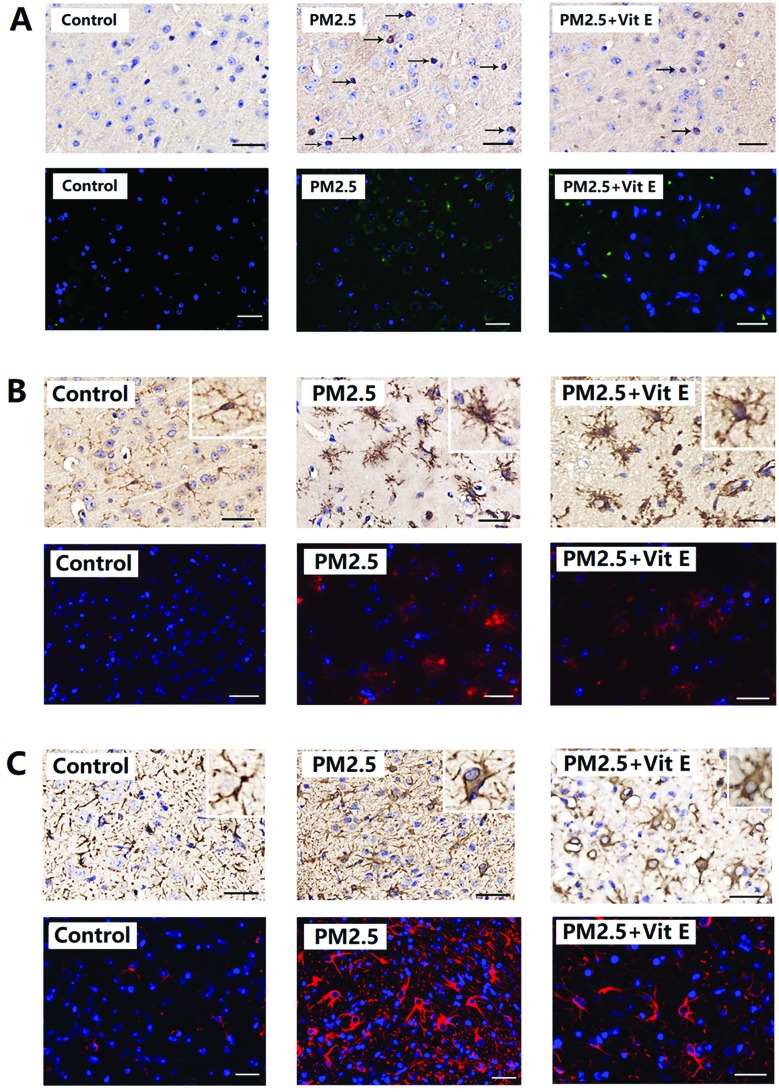
According to Fig. 6A and B, the mice that had Vit E administered were observed to spend less time finding the escape platform in the MWM test, and spent longer time in the SE quadrant (Fig. 6C), when compared with the 19.3 mg kg–1 day–1 PM2.5 exposure group. Histological assay after Vit E administration showed that although the PM2.5 + Vit E group sustained cell damage, this damage was much less than that seen in the 19.3 mg kg–1 day–1 PM2.5 exposure group, most cells in the PM2.5 + Vit E group remained intact (Fig. 7A and B), and there was a significant increase in cell numbers in the cerebral cortex compared with the 19.3 mg kg–1 day–1 PM2.5 exposure group (Fig. 7C). When mice were treated with Vit E, the expression of Aβ1-42 in brain tissues was reduced compared with the 19.3 mg kg–1 day–1 PM2.5 exposure group (Fig. 8A; ESI, Table S5†). Fig. 8B and C show the Glia activation level in mouse brain after Vit E administration, and the expression of Iba1 and GFAP were decreased (ESI, Table S5†).
Fig. 6. Vit E antagonistic effects on the cognitive deficits induced by PM2.5 exposure. (A) The EL for the first 5 days training. (B) The average EL for the first 5 days training. (C) The time spent swimming in the SE quadrant on the seventh day. *p < 0.05, compared with the control group. #p < 0.05, compared with the 19.3 mg kg–1 day–1 PM2.5 exposure group.
Fig. 7. Vit E antagonistic effects on mouse brain histological changes induced by PM2.5 exposure. (A) H&E staining for hippocampus. (B) H&E staining for olfactory bulb. (C) H&E staining for cerebral cortex.
Fig. 8. Vit E antagonistic effects on Aβ1-42, Iba1, and GFAP expression in mouse brain after PM2.5 exposure. (A) The expression of Aβ1-42. (B) The expression of Iba1. (C) The expression of GFAP.
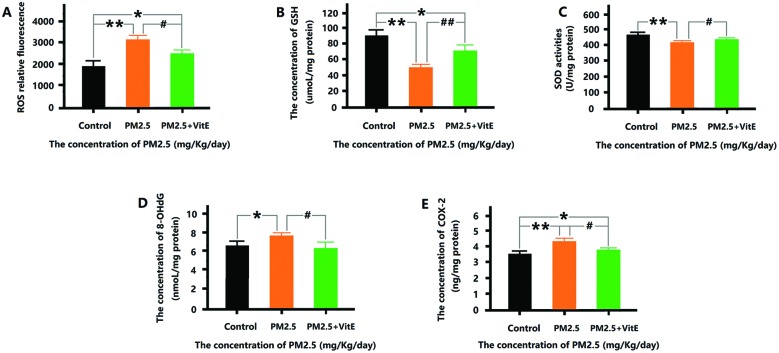
The oxidative stress and inflammation levels after Vit E administration is shown in Fig. 9. The amounts of ROS, 8-OHdG, and COX-2 were significantly less than those in the 19.3 mg kg–1 day–1 PM2.5 exposure group. The GSH levels and activities of SOD in the PM2.5 + Vit E group were significantly higher than those seen in the 19.3 mg kg–1 day–1 PM2.5 exposure group. However, significant changes were also observed in ROS, GSH, and COX-2, compared with the control group.
Fig. 9. The antagonistic effects of Vit E on oxidative stress and inflammation induced by PM2.5 exposure. (A) The relative fluorescence of ROS in mouse brain after exposure. (B) The concentration of GSH in mouse brain after exposure. (C) The SOD activity in mouse brain after exposure. (D) The level of 8-OH-dG in mouse brain after exposure. (E) The concentration of COX-2 in mouse brain after exposure. *p < 0.05, **p < 0.01, compared with the control group. #p < 0.05, ##p < 0.01, compared with the 19.3 mg kg–1 day–1 PM2.5 exposure group.
Discussion
In this research, we have attempted to shed some light on the relationship between exposure to PM2.5 and ND and to explore the possible mechanisms underlying the resulting lesions by studying similar lesions in mice exposed to PM2.5.
The MWM test was selected to test the cognitive ability of the exposed mice based on the understanding of the main pathological features of ND. In the previous 5 days of MWM, EL in mice of the 1.93 mg kg–1 day–1 and 19.3 mg kg–1 day–1 exposure group was obviously higher than that in mice of control group; therefore, exposure to PM2.5 resulted in decrease in the learning ability of the mice. On the seventh day, some mice in the test were still consciously looking for the escape platform within the target quadrant (SE quadrant) although the platform had been previously removed. However, we can see that the time spent by the mice from the 1.93 mg kg–1 day–1 and 19.3 mg kg–1 day–1 exposure group in the SE quadrant significantly reduced and their swimming routes show a clear lack in regularity and purposefulness, indicating a decrease in memory function on different levels in the exposed mice. In general, the exposure to PM2.5 led to the reduction in the cognitive functioning of the mice.
Histopathological studies on ND have revealed lesions of various degrees in the brain tissue of the patients. However, this research also shows damage to the hippocampus in the brains of the exposed mice due to exposure to PM2.5 at different concentrations. Exposure to high concentrations of PM2.5 could even eliminate the entire synaptic ball, leaving its cell arrangement in disorder. The cerebral cortex has long been considered as the highest center of the brain and lesions related to this area have also been confirmed in the clinical diagnosis of ND patients. In this research, increased exposure to PM2.5 has not led to obvious change in the morphological structure of the cortical cells, but a significant decrease in the number of neurons was observed. Such change in the brain tissue will undoubtedly greatly affect the transmission of brain signals and formation of memory, which is considered one of the reasons for reduced cognitive ability of the mice studied.
Typical pathological features of ND also include abnormal protein aggregates in the brain tissue, such as the abnormal expression and accumulation of Aβ1-42.17 Aβ1-42 expression in the brains of the exposed mice in this research indicates that as the exposure dose increased, the expressed quantity of Aβ1-42 in the brains increased significantly. The above results show that the mice exposed to PM2.5 have had pathologic changes similar to the typical pathological features of ND.
As a general rule, large amount of ROS will be produced by aerobes during metabolism but will be eliminated by the reducing enzymes and non-enzymatic antioxidant substances (such as SOD and GSH). However, when the human body is impaired, more ROS will be produced or the elimination process malfunctions, resulting in accumulation of ROS also known as oxidative stress.18 Oxidative stress may cause damage to biomacromolecules (DNA, proteins, and lipids) and produce aberrant molecules, such as MDA and 8-OHdG.19,20 Brain tissue is sensitive to oxidative stress due to its weak oxidation resistance (low GSH content), high consumption of oxygen, and high content of lipids. Thus, it is reasonable to study oxidative stress as a possible mechanism for PM2.5 inducing neurotoxicity.
In this study, we found that the increase in PM2.5 exposure concentration is accompanied by a significant increase of ROS, MDA, and 8-OHdG in mouse brains as well as a decrease in the SOD activity and the content of reducing substances including GSH. This showed an increased oxidative stress level after the mouse brain tissues were exposed to PM2.5. High levels of oxidative stress led to an inflammatory response by activating inflammatory signalling pathways and increasing the expression of cytokines.21 As proved in this study, when the exposure concentration of PM2.5 increases, the expression of transcription factor NF-κB increases. Cytokines including TNF-α, IL-1β, and COX-2 are upregulated. Exposure to PM2.5 leads to high level of oxidative stress in the brain tissue and the inflammatory pathways are activated.
Previous studies indicate that significant activation of microglial cells and astrocytes is associated with many neurological diseases and nerve cell damage, while damaged cells, generated cytokines and toxic substances will in turn activate these two types of glial cells, finally resulting in diseases and lesions.22,23
In this research, Iba1 and GFAP were used as the markers of microglial cells and astrocytes. HIS and IF show that as the exposure concentration of PM2.5 increased, large areas of these two glial cell types were activated in the brain tissues of the mice; cell morphological structure changed obviously and the expression of the two marker proteins increased significantly. The activation of these glial cells played an important role in triggering oxidative stress, inflammatory response, and Aβ1-42 accumulation in the brain tissue of the exposed mice.
Oxidizing substances and antioxidant substances inside the cells form a complex network to jointly coordinate the level of oxidation in the body. The remaining large amount of antioxidant substances inside the cells forms another complex antioxidant network to remove excessive ROS.24 Vit E features oxidation resistance and easy absorption by cells and is readily available from certain foods and medicines. Therefore, Vit E is used in this research as a blocker for oxidative stress to explore whether Vit E can protect the brain tissue of the mice exposed to high concentrations of PM2.5.
This result shows that after using exogenous Vit E as the protective agent, lesions similar to those seen in ND in the mice exposed to high-concentration PM2.5 reduced. The cognitive function of the mice improved by addition of Vit E. In addition, after adding Vit E cell damage reduced and cell quantity increased; Aβ1-42 expression declined significantly, and the glial cells became less activated. Indexes related to oxidative stress in the brain tissue indicate that the level of oxidative stress in the mice of the PM2.5 + Vit E group decreased (as shown in reduced ROS level, increased GSH content, increased SOD activity, decreased 8-OHdG and COX-2 content). Some data from this study shows that although damage in the mouse brain tissue reduced after the addition of Vit E, the mice in the PM2.5 + Vit E group still showed significant differences from those in the control group in terms of many indexes, which meant that the addition of Vit E could only reduce rather than eliminate the damage. The protective effect of Vit E on the brain tissue further indicates that oxidative stress is one of the molecular mechanisms leading to lesions similar to ND after exposure to PM2.5 and provides information on how to reduce damage caused due to exposure to high concentrations of PM2.5.
Conclusions
Previous studies have mainly focused on the respiratory toxicity of PM2.5, while epidemiological investigations and studies in more recent years have revealed certain associations between exposure to PM2.5 and nervous system diseases. In this study, as the exposure concentration of PM2.5 increased, lesions similar to ND, including declined cognitive ability, pathologic damage in brain tissue and protein aggregates in the brain occurred in mice. The level of oxidative stress and inflammation increased and a large amount of glial cells were activated. After adding exogenous Vit E, damage to brain tissue and ND-like lesions after exposure to high level of PM2.5 has been mitigated by reducing the level of oxidative stress in the brain. This shows that oxidative stress was one of the molecular mechanisms leading to ND-like lesions after exposure to PM2.5 (Fig. 10). After the exposure cycle of seven days under the exposure dose of 0.193 mg kg–1 day–1 (equivalent to 100 μg m–3 for humans), no significant changes or lesions were observed in behaviors and brain tissues of the mice. In other words, such an exposure dose is safe after continuous exposure cycle of seven days.
Fig. 10. The potential mechanism of PM2.5 exposure induced damage in the mouse brain.
Conflicts of interest
There are no conflicts of interest to declare.
Supplementary Material
Acknowledgments
This work was supported by the Regular Undergraduate Institutions Nature Science Research Project of the Guizhou Education Department (Technology top-notch talent support project QianjiaoheKYzi[2018]083).
Footnotes
†Electronic supplementary information (ESI) available. See DOI: 10.1039/c8tx00333e
References
- Block M. L., Calderón-Garcidueñas L. Trends Neurosci. 2009;32(9):506–516. doi: 10.1016/j.tins.2009.05.009. [DOI] [PMC free article] [PubMed] [Google Scholar]
- World Health Organization, WHO Ambient air pollution A global assessment of exposure and burden of disease, World Health Organization, Geneva, 2016. [Google Scholar]
- Brook R. D., Rajagopalan S. N. Engl. J. Med. 2007;356(20):2104–2105. doi: 10.1056/NEJMc070556. [DOI] [PubMed] [Google Scholar]
- Brunekreef B., Holgate S. T. Lancet. 2002;360(9341):1233–1242. doi: 10.1016/S0140-6736(02)11274-8. [DOI] [PubMed] [Google Scholar]
- Underwood E. Science. 2017;355(6323):342–345. doi: 10.1126/science.355.6323.342. [DOI] [PubMed] [Google Scholar]
- Forman M. S., Trojanowski J. Q., Lee V. M. Nat. Med. 2004;10(10):1055–1063. doi: 10.1038/nm1113. [DOI] [PubMed] [Google Scholar]
- Block M. L., Zecca L., Hong J. S. Nat. Rev. Neurosci. 2007;8(1):57–69. doi: 10.1038/nrn2038. [DOI] [PubMed] [Google Scholar]
- Buée L., Bussière T., Buée-Scherrer V. Brain Res. Brain Res. Rev. 2000;33(1):95–130. doi: 10.1016/s0165-0173(00)00019-9. [DOI] [PubMed] [Google Scholar]
- Akhter H., Ballinger C., Liu N. Toxicol. Sci. 2015;147(1):222–234. doi: 10.1093/toxsci/kfv124. [DOI] [PMC free article] [PubMed] [Google Scholar]
- Calderón-Garcidueñas L., Avila-Ramírez J., Calderón-Garcidueñas A. J. Alzheimer's Dis. 2016;54(4):597–613. doi: 10.3233/JAD-160472. [DOI] [PubMed] [Google Scholar]
- He M., Ichinose T., Kobayashi M. Toxicol. Appl. Pharmacol. 2016;297:41–55. doi: 10.1016/j.taap.2016.02.017. [DOI] [PubMed] [Google Scholar]
- China Society for Urban Studies, China Green Building 2016, China Architecture & Building Press, 2016, pp. 74–88. [Google Scholar]
- Li C., Replication of Animal Models for Human Diseases, People's Medical Publishing House, 2008, pp. 57–62. [Google Scholar]
- Li J. Q., Li L., Chen H. Q. Sci. Rep. 2014;4:4275. doi: 10.1038/srep04275. [DOI] [PMC free article] [PubMed] [Google Scholar]
- Wu Y., You H. H., Ma P. PLoS One. 2013;8(5):e62827. doi: 10.1371/journal.pone.0062827. [DOI] [PMC free article] [PubMed] [Google Scholar]
- Liu X. D., Zhang Y. C., Li J. Q. Int. J. Nanomed. 2014;9:823–839. doi: 10.2147/IJN.S56339. [DOI] [PMC free article] [PubMed] [Google Scholar]
- Hardy J., Higgins G. A. Science. 1992;256:184–185. doi: 10.1126/science.1566067. [DOI] [PubMed] [Google Scholar]
- Rojas-Gutierrez E., Muñoz-Arenas G., Treviño S. Synapse. 2017;71:e21990. doi: 10.1002/syn.21990. [DOI] [PubMed] [Google Scholar]
- Das M., Babu K., Reddy N. P. Biochim. Biophys. Acta. 2005;1722(2):209–217. doi: 10.1016/j.bbagen.2004.12.014. [DOI] [PubMed] [Google Scholar]
- Sidorczuk M. G., Brzóska M. M., Jurczuk M. Chem.-Biol. Interact. 2009;180(1):31–38. doi: 10.1016/j.cbi.2009.01.014. [DOI] [PubMed] [Google Scholar]
- Xiao G. G., Wang M., Li N. J. Biol. Chem. 2003;278(50):50781–50790. doi: 10.1074/jbc.M306423200. [DOI] [PubMed] [Google Scholar]
- Naert G., Rivest S. Curr. Alzheimer Res. 2011;8(2):151–155. doi: 10.2174/156720511795256035. [DOI] [PubMed] [Google Scholar]
- González-Reyes R. E., Nava-Mesa M. O., Vargas-Sánchez K. Front. Mol. Neurosci. 2017;10:427. doi: 10.3389/fnmol.2017.00427. [DOI] [PMC free article] [PubMed] [Google Scholar]
- Franco-Robles E., Ramírez-Emiliano J., López M. G. Nat. Prod. Res. 2018:1–4. doi: 10.1080/14786419.2017.1423297. [DOI] [PubMed] [Google Scholar]
Associated Data
This section collects any data citations, data availability statements, or supplementary materials included in this article.


