 The purpose of this study was to determine the effect of subchronic, oral, low-dose cadmium exposure (32 ppm over 10 weeks) on the rat immune system. We found that cadmium exposure increased the induction of IFNγ and IL-10 in T cells activated ex vivo after cadmium exposure.
Abstract
Cadmium is a toxic metal and common environmental contaminant. Chronic cadmium exposure results in kidney, bone, reproductive, and immune toxicity as well as cancer. Cadmium induces splenomegaly and affects the adaptive immune system, but specific effects vary depending on the dose, model, and endpoint. This study investigates the effects of subchronic, oral, and low-dose cadmium exposure (32 ppm cadmium chloride in drinking water for 10 weeks) on the rat immune system, focusing on T cell function. Cadmium-exposed animals demonstrated slight increases in the spleen-to-body weight ratios, and decreases in overall splenic cell numbers and markers of oxidative stress. The relative ratios of splenic cell populations remained similar, except for modest increases in regulatory T cells in the cadmium-exposed animals. Cadmium exposure also significantly increased the production of IFNγ, a pro-inflammatory cytokine, and IL-10, a cytokine produced by multiple T cell subsets that typically inhibits IFNγ expression, by activated T cells. The increase in IFNγ and IL-10 suggests that cadmium exposure may affect multiple T cell subsets. Collectively, this study suggests that subchronic, low-dose cadmium exposure impacts both immune cell function and cellularity, and may enhance inflammatory responses.
1. Introduction
Cadmium is a non-essential, toxic metal released into the environment naturally or through anthropogenic sources.1 Although environmental contamination is one route of exposure, non-smoking U.S. residents are mainly exposed to cadmium through diet. Cigarette smoke constitutes an additional route of exposure, as tobacco plants readily phytoaccumulate cadmium from the soil.2 In the United States, the estimated daily intake of cadmium in adult male and female non-smokers is 0.35 and 0.30 μg cadmium per kg body weight per day, respectively.1 According to the National Health and Nutrition Examination Survey (NHANES), participants from 1999–2010 had mean cadmium blood concentrations of 0.37 μg L–1 and 0.41 μg L–1 for men and women, respectively, and mean urine concentrations of 0.25 μg cadmium per L, irrespective of gender.3 After exposure and absorption, cadmium bioaccumulates preferentially in certain tissues, including the kidney and liver.4,5 Unlike some toxicants which are readily excreted, cadmium has a half-life that spans decades, resulting in an increased kidney burden over a lifetime.6,7 In addition to the liver and kidney, cadmium is also detected in other tissues, including the spleen.8
Clinically, chronic cadmium exposure primarily results in kidney and bone damage, reproductive toxicity, and cancer with a long half-life estimated at 26 years in humans.9–11 In addition to the previously mentioned toxicological endpoints, the literature suggests that cadmium may also modulate immune function.12–16 Higher doses of cadmium have been shown to induce inflammatory response and increase markers of tissue damage, evidenced by increases in serum aspartate amino transferase, alanine amino transferase, and tumor necrosis factor alpha (TNFα).17–19 However, specific effects on various immune cell types have been difficult to characterize. Previously, studies investigating immune function by challenging host immune cells with sheep red blood cells (SRBCs) or bacterial pathogens have mixed results. For example, exposure of mice to 300 ppm cadmium chloride (CdCl2) in drinking water for 10 weeks potentiated the host response to SRBCs, whereas exposure of mice to 50 ppm CdCl2 in drinking water for 3 weeks inhibited the response to SRBCs,20,21 Another study performed in mice exposed to 50–300 ppm CdCl2 in drinking water for 3–11 weeks showed a mixed response to SRBCs, where some animals had an increased response to SRBC, but other animals had a decreased response.22 A similar pattern is seen when looking at the proliferative response of lymphocytes. A study done with rats exposed to 6 ppm or 50 ppm CdCl2 for 6 or 4 months in drinking water showed that splenocyte proliferation in response to various immune activators was inhibited at the higher dose, but the effect was mixed at the lower dose, with slight increases in proliferation to two of the activators, and a slight decrease in proliferation to two other activators.23 Some of these discrepancies are likely attributable to differences in the immune endpoint measured, experimental model, cadmium dose, exposure duration, and route of administration. Thus, significant discrepancies still exist, and the mechanisms underlying the effects of cadmium remain unclear. The present study aims to elucidate the immune effects of oral exposure of rats to a relatively low dose of cadmium (32 ppm) for 10 weeks. The actual duration of exposure in chronic in vivo studies is always problematic due to the relatively short life span of the animal and the long half-life of cadmium (see above).
The current study focuses in part on the effect of subchronic low dose cadmium exposure on the function of specific immune cell types, namely CD4 and CD8 T cells, which are a key part of the adaptive immune response. The T cell response to immunogenic stimuli begins when the T cell is presented with its cognate antigen by an antigen-presenting cell, along with a second signal from co-stimulatory molecules.24 This initiates T cell activation and turns on a program of gene transcription which includes production of cytokines such as interleukin-2 (IL-2) and interferon gamma (IFNγ), and expression of cell surface proteins such as CD25.25 T cell activation also induces cell proliferation and sets up T cell differentiation, wherein T cells tailor an immune response to specific immune stimuli. T cell differentiation results in the specialization of T cells into subsets, which are characterized by production of various cytokines and expression of specific transcription factors.26 In the current study, we investigated T cell responses in Sprague/Dawley rats exposed to cadmium for 10 weeks, at a dose relevant to human exposure (32 ppm). The dosing scheme used in these studies mimics the cadmium burden of an adolescent-young adult in the United States based on cadmium levels accumulated in the kidney by the end of the study.10,27 Specifically, the cadmium content in the renal cortex of the rats in this study ranged from 30.9 to 61.55 μg per g dry weight corresponding to 5.2–10.4 μg per g wet weight, which approximates the cadmium levels measured in young adults in the U.S.10,28,29 We investigated the impact of this low-dose, long term cadmium exposure on the overall splenic cellularity, ROS, and mitochondrial function, as well as on splenic T cell function.
2. Materials and methods
2.1. Animals
Six male Sprague Dawley rats weighing 230–260 g (Envigo, Indianapolis, IN) were administered cadmium in drinking water at a concentration of 32 ppm in the form of CdCl2 dissolved in reverse osmosis water with a pH of 4.0. Six control rats weighing 230–260 g were given reverse osmosis water only at a pH of 4.0. These animals are labeled as Ctrl in the figures and are represented by a striped bar. Animals were singly housed in plastic cages with wire mesh tops in an AAALAC accredited animal facility with a 12/12 light/dark cycle and free access to water (with or without cadmium) and food. Weekly body weights were recorded along with weekly consumption of drinking water. All animal studies were conducted in accordance with the Guidelines for the Care and Use of Animals, as adopted by the National Institutes of Health and the Guidelines for the Care and Use of Laboratory Animals at Midwestern University. The animal protocols were approved by the Institutional Animal Care and Use Committee at Midwestern University.
2.2. Quantification of cadmium levels
At the end of the 10 week cadmium exposure period, animals were placed in individual metabolic cages. Animals were anesthetized with an i.p. injection of ketamine/xylazine (67/7 mg kg–1) and the abdominal cavity was opened. The kidneys were removed and the renal cortex was isolated for determination of the cadmium content. The tissue samples were sent to the Michigan State University Diagnostic Center for Population and Animal Health (E. Lansing, MI) for cadmium analysis using inductively coupled plasma mass spectrometry.
2.3. Splenocyte isolation and cell culture
Spleens were processed into a single cell suspension by mechanical disruption and filtered through a 40 μm filter. Splenocytes were washed twice, and the cell numbers were quantified in the presence and absence of red blood cell lysis reagent. Cells were cultured in complete DMEM (with l-glutamine, sodium bicarbonate and d-glucose) supplemented with 100 units penicillin per ml, 100 units streptomycin per ml, 50 μM 2-mercaptoethanol, and 10% fetal bovine serum (FBS). The cell densities were adjusted to 5 × 10⁶ cells per mL for time points up to and including 24 h, and to 1 × 10⁶ cells per mL for all other time points, plated, and then activated with 5 μg mL–1 plate bound αCD3 (clone eBioG4.18, eBioscience, San Diego, CA) and 2.5 μg mL–1 soluble αCD28 (clone JJ319, Biolegend, San Diego, CA).
2.4. Immunophenotyping, cellular activation, and viability
After isolation, splenocytes were labeled with CD3-PE (clone1F4, Biolegend), CD45R-PE/Cy7 (clone HIS24, eBioscience) and CD11b/c-AF647 (clone OX-42, Biolegend), or CD4-AF647 (clone OX-35, Biolegend), CD8-PE/Cy7 (clone OX8, eBioscience), and CD25-PE (clone OX39, eBioscience), prior to flow cytometry analysis. For the analysis of activation-induced cell surface markers, cells were collected at 24 h post-activation and labeled with CD4-AF647, CD8-PE/Cy7, and CD25-PE, prior to FACS analysis. For viability analysis, splenocytes were resuspended in 150 μL of FACS buffer (phosphate-buffered saline with 1% fetal bovine serum), and 5 μL of propidium iodide (Biolegend) was added immediately before the analysis. All flow cytometry assays were performed on an Accuri C6 flow cytometer (BD Biosciences, San Jose, CA). The data were analyzed using CFlow software (BD Accuri, San Jose, CA).
2.5. Mitochondrial membrane potential
Splenocytes collected from the control or cadmium exposed rats either immediately upon isolation (baseline) or after challenge with a vehicle (VEH, dPBS) or 5 μM cadmium chloride for 12 h ex vivo were stained with MitoProbe DilC1(5) as per the manufacturer's protocol (Invitrogen, Eugene, OR). Briefly, pelleted cells (5 × 10⁵) were resuspended in 100 μL of warm FACS buffer (1% fetal bovine serum in dPBS). DilC1(5) at ambient temperature (0.5 μl of stock solution) was added to each sample. The samples were then incubated at 37 °C for 25 minutes. After incubation, the samples were centrifuged at 300g for 7 minutes at 4 °C and the supernatants were discarded. The pellets were then resuspended in 100 μL of warm FACS buffer. The samples were analyzed by flow cytometry with BD Accuri C6 (BD Accuri, San Jose, CA). The fluorescence was quantified with the CFlow software (BD Accuri, San Jose, CA).
2.6. Reactive oxygen species quantification
Reactive oxygen species were measured using a commercially available DCFDA cellular ROS kit (ab113851; Abcam PLC, Cambridge, MA) in splenocytes collected from the control or cadmium exposed rats either immediately upon isolation (baseline) or after challenge with a vehicle (VEH, dPBS) or 5 μM cadmium chloride for 6 h ex vivo. 20 μM DCFDA buffer was prepared by adding 2 μL of 20 mM DCFDA to 2 mL of DMEM supplemented with 100 units penicillin per mL, 100 units streptomycin per mL, 50 μM 2-mercaptoethanol, and 10% fetal bovine serum. The pelleted cells were (5 × 10⁵) resuspended in 100 μL of 20 μM DCFDA buffer. The samples were incubated at 37 °C for 25 minutes and immediately analyzed by flow cytometry on a BD Accuri C6 (BD Accuri, San Jose, CA). The fluorescence was quantified with the CFlow software (BD Accuri, San Jose, CA).
2.7. Quantification of cytokine protein levels
Supernatants were collected from splenocytes activated with the T cell specific activator, anti-CD3/anti-CD28 at various time points. IL-4, IL-5, IL-13, IL-10, and IFNγ were quantified using a multiplex bead array from BioRad (Hercules, CA) as per the manufacturer's protocol. IL-2 and IL-17a were quantified by ELISA from Ray Biotech (Norcross, GA), or eBioscience respectively as per the manufacturer's protocol.
2.8. Quantification of cytokine expression by quantitative RT-PCR
Total RNA was isolated from splenocytes from the control or cadmium-exposed rats using TRIzol reagent as per the manufacturer's protocol (Life Technologies, Grand Island, NY). RNA was then quantified and reverse transcribed, preceding SYBR green qPCR analysis. Relative mRNA was calculated using the ΔΔCT method, normalized to the housekeeper gene ribosomal protein L13a, a gene expressed at similar levels across all samples and treatment groups. CT values were obtained with the Life Technologies/Applied Biosystems Sequence Detection System 7500 (Grand Island, NY). Primer sequences were generated using the Primer-BLAST software except for IL-4, for which the primer sequences were previously published.30,31 Primer sequences can be found in Table 1.
Table 1. Quantitative RT-PCR primer sequences.
| GATA3 | Forward | 5′-CCCTTATCAAGCCCAAGCGA-3′ |
| Reverse | 5′-CTCCGTTAGCGTTCCTCCTC-3′ | |
| IFNγ | Forward | 5′-CTGTTACTGCCAAGGCACAC-3′ |
| Reverse | 5′-TGTTACCGTCCTTTTGCCAGT-3′ | |
| IL-2 | Forward | 5′-TCTGCAGCGTGTGTTGGATT-3′ |
| Reverse | 5′-GGCTCATCATCGAATTGGCAC-3′ | |
| IL-2RB | Forward | 5′-GCAGGGAACATATCGTCACAACTC-3′ |
| Reverse | 5′-CAAGTTGTAGCCAGGAGCAAGA-3′ | |
| IL-4 | Forward | 5′-GCAACAAGGAACACCACGG-3′ |
| Reverse | 5′-AAGCACGGAGGTACATCACGT-3′ | |
| IL-5 | Forward | 5′-TGTTGACGAGCAATGAGACGA-3′ |
| Reverse | 5′-ATGGTATTTCCACAGTGCCCC-3′ | |
| IL-10 | Forward | 5′-ATAAAAGCAAGGCAGTGGAGC-3′ |
| Reverse | 5′-GCCGGGTGGTTCAATTTTTC-3′ | |
| IL-13 | Forward | 5′-GCTTATCGAGGAGCTGAGCAA-3′ |
| Reverse | 5′-CTGGAGATGTTGGTCAGGGA-3′ | |
| IL-17a | Forward | 5′-TGAGTCCCCGGAGAATTCCA-3′ |
| Reverse | 5′-AAGTTATTGGCCTCGGCGTT-3′ | |
| IL-17f | Forward | 5′-GCATGAAGGGCTCCTGTGAA-3′ |
| Reverse | 5′-AGCCCTACTTTGGGGTTCCT-3′ | |
| IL-21 | Forward | 5′-CCAAAGGCCAGATCACCTTCT-3′ |
| Reverse | 5′-AGCTTCGTGCTCACATTGCC-3′ | |
| IL-22 | Forward | 5′-TCAGCGGTGATGACCAGAAC-3′ |
| Reverse | 5′-TCAGACGCAAGCGTTTCTCA-3′ | |
| RPL13a | Forward | 5′-TGCCGAAGATGGCGGAG-3′ |
| Reverse | 5′-ATGCCCTCACAGCGTACAAC-3′ | |
| FoxP3 | Forward | 5′-TGATCCCTCTCTGTCAGTCCA-3′ |
| Reverse | 5′-CAGAGTCAGGAAAAGTTGCCG-3′ |
2.9. Statistical analysis
The data are depicted as mean values, plus or minus the standard error of the mean (SE). Outliers were determined by Grubb's test and data points determined to be outliers were excluded from further analysis. The data were analyzed using either a two-tailed T test or two-way ANOVA using SigmaPlot 12.3 (Systat, Chicago, IL). When differences were detected by ANOVA, the Holms–Sidak post-hoc test was used to determine the differences in and between groups.
3. Results
3.1. Rats exposed to cadmium show changes in base immune parameters
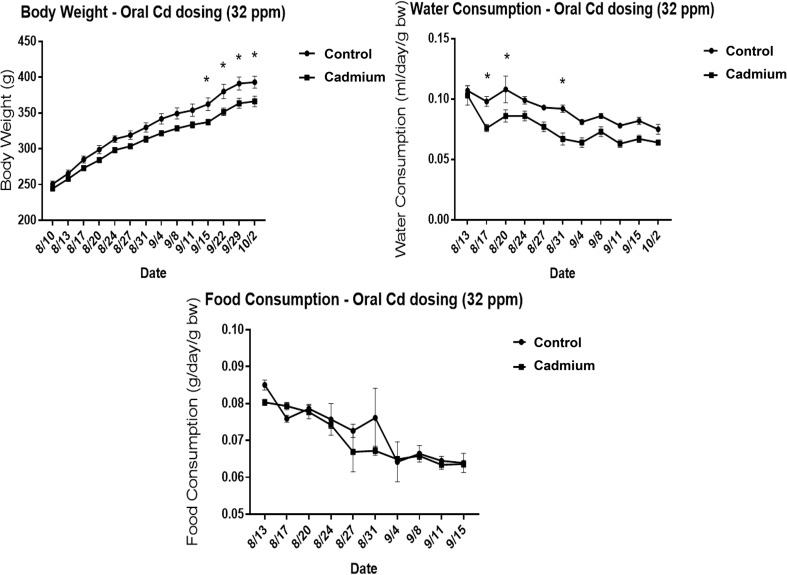
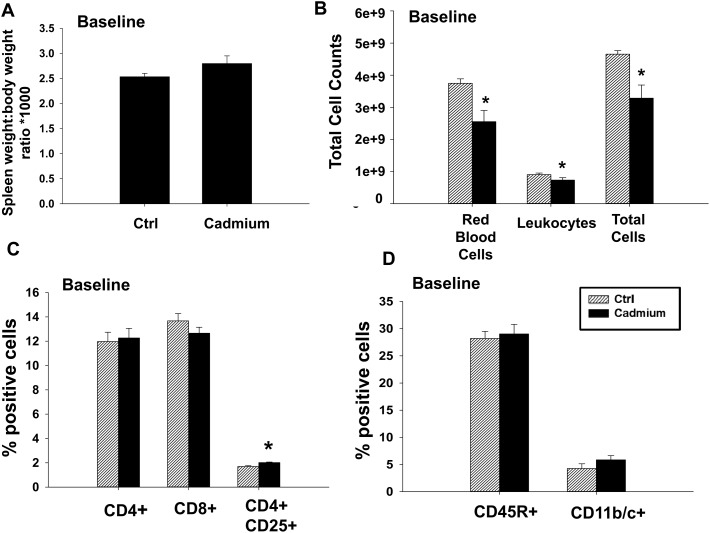
As cadmium is a known immunotoxicant, we first investigated the changes in basal immune parameters in the spleens of cadmium-exposed rats. Rats were exposed to 32 ppm cadmium in drinking water for 10 weeks, and the body weight, food consumption, and water consumption were recorded weekly. Cadmium-exposed rats had a modest decrease in body weight, and drank slightly less water than the control groups, whereas food consumption remained the same between groups (Fig. 1). All cadmium-treated animals in the study appeared to tolerate the cadmium dose and did not show any signs of toxicity or abnormalities. At the end of 10 weeks, various tissues were collected for further analysis. Kidneys were isolated and cadmium levels were determined within the cortex. Cadmium levels in the control group were either below detection (less than 0.1 μg per g dry weight) for 4 animals, or near the limit of detection (0.18 and 0.12 μg per g dry weight) in the remaining two. In contrast, rats exposed to cadmium in the drinking water had increased levels of cadmium in the kidney, ranging from 30.9–61.55 μg per g dry weight or approximately 5.2–10.4 μg per g wet weight (Table 2). Cadmium also tended to cause a modest increase in spleen mass that did not reach statistical significance (Fig. 2A). Analysis of the spleen composition demonstrated that cadmium-exposed rats had fewer red blood cells, slightly fewer leukocytes, and decreased total cell numbers (Fig. 2B). Accordingly, various splenic leukocyte populations were analyzed further by FACS analysis. No differences were seen in the percentages of CD4+ or CD8+ T cells, B cells (CD45R+ cells), or phagocytes (CD11b/c+ cells, Fig. 2C and D). There was a modest, statistically significant, increase in regulatory T cells (CD4+ CD25+ cells) (Fig. 2C). Overall, cadmium modestly increased the spleen size and decreased the overall numbers of red blood cells and leukocytes, but did not cause notable changes in the ratios of specific cell types.
Fig. 1. Water consumption, body weight, and food consumption during cadmium exposure. Male Sprague Dawley rats were exposed to 32 ppm CdCl2 in drinking water for 10 weeks. Weekly body weights were recorded along with weekly consumption of food and drinking water. Food and water consumption was normalized to the body weight, and data are reported as mean ± SE. Data were analyzed by 2-way ANOVA followed by Holms–Sidaks multiple comparison test. * indicates P < 0.05 between in vivo control and cadmium exposed groups.
Table 2. Kidney cadmium levels (μg cadmium per g dry weight).
| Rat # | Control group | Cadmium group |
| 1 | <0.1 μg g–1 | 61.55 μg g–1 |
| 2 | <0.1 μg g–1 | 34.43 μg g–1 |
| 3 | <0.1 μg g–1 | 30.9 μg g–1 |
| 4 | <0.1 μg g–1 | 51.82 μg g–1 |
| 5 | 0.18 μg g–1 | 59.04 μg g–1 |
| 6 | 0.12 μg g–1 | 52.27 μg g–1 |
| Mean* | 0.08 ± 0.03 μg g–1 | 48.34 ± 5.21 μg g–1 |
Fig. 2. Cadmium exposure causes changes in some base immune parameters in rats. At the conclusion of the study, spleens were weighed prior to processing into a single cell suspension. (A) Spleen weight-to-body weight ratio was calculated, and then multiplied by 1000. (B) Splenocytes were counted both with and without red blood cell lysis to obtain the numbers of RBCs, leukocytes, and total cells. Splenocytes were labeled with fluorochrome-conjugated antibodies against (C) CD4 and CD25, CD4 and CD8, or (D) CD3, CD45R, and CD11b/c, and analyzed by flow cytometry. Doublets were excluded prior to the analysis of percentages of each cell type. CD11b/c is expressed as a percentage of cells that are CD3– CD45R–. Data are presented as mean ± SE. * indicates P < 0.05 between the in vivo control and cadmium exposed groups.
3.2. Splenocytes from cadmium-exposed rats have fewer reactive oxygen species (ROS) and a comparatively increased mitochondrial membrane potential
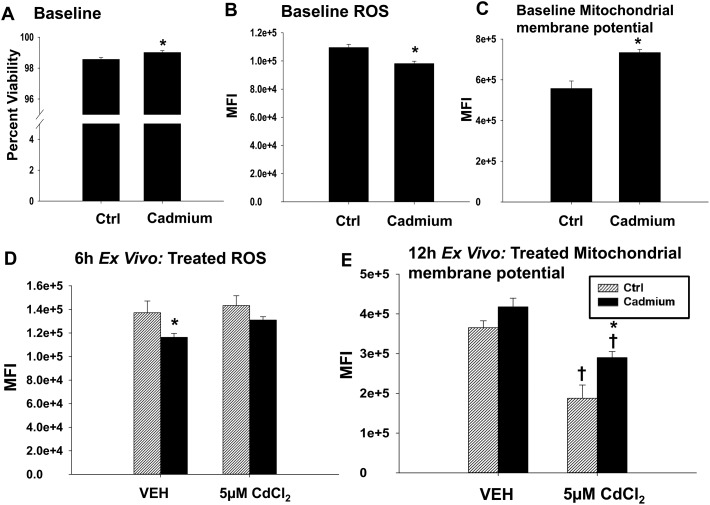
Because cadmium is known to cause cell stress, we next looked at the viability and redox status of the splenocytes from the vehicle and cadmium-exposed rats. Viability, as determined by dye exclusion, was similar in splenocytes from the vehicle and cadmium-exposed rats (Fig. 3A). There is a very small, albeit statistically significant, increase in viability in splenocytes derived from the cadmium-exposed rats (98.5 percent viability to 99 percent viable) that is unlikely to be biologically relevant. The splenocytes from the cadmium-exposed rats had lower mean fluorescence intensities when treated with a dye that fluoresces in the presence of reactive oxygen species (ROS), which suggests that the splenocytes from the cadmium-exposed rats had decreased levels of ROS (Fig. 3B). Interestingly, the splenocytes from the cadmium-treated rats had increased mitochondrial membrane potentials as measured by (DiIC1(5)), a dye that accumulates in mitochondria with active membrane potentials (Fig. 3C). Next, we tested the ability of the splenocytes to respond to additional stress by challenging the splenocytes with 5 μM cadmium chloride for 6 h (ROS) or 12 h ex vivo (MitoProbe). At this concentration, cadmium caused a modest increase in ROS levels in the splenocytes from both groups of rats, though this increase was not statistically significant (Fig. 3D). Although cadmium treatment decreased the mitochondrial membrane potential in splenocytes from both groups of rats, the splenocytes from rats previously exposed to cadmium were partially protected against this effect, suggesting that the subchronic cadmium exposure may have induced factors protective against mitochondrial stress (Fig. 3E). Overall, subchronic cadmium exposure caused a modest increase in mitochondrial membrane potential and the decrease in mitochondrial membrane potential from subsequent cadmium exposure ex vivo was attenuated in the splenocytes from rats chronically exposed to cadmium.
Fig. 3. Splenocytes from the cadmium-treated rats have decreased ROS and increased mitochondrial membrane potentials. (A) Splenocytes from the in vivo control (Ctrl) or cadmium-exposed rats were treated with propidium iodide immediately prior to FACS acquisition for viability analysis. Splenocytes were stained with (B) DCFDA for the analysis of ROS or with (C) DiIC1(5) for the analysis of mitochondrial membrane potential prior to the analysis by flow cytometry. Data are reported as mean fluorescence intensity. Splenocytes from the in vivo Ctrl (striped bar) or cadmium-exposed (black bar) rats were treated with either VEH (dPBS) or 5 μM cadmium chloride and cultured for (D) 6 h or (E) 12 h prior to staining for either (D) ROS or (E) mitochondrial membrane potential. Data are presented as mean ± SE. (A–C) *indicates P < 0.05 as compared to the Ctrl rats in vivo. (D and E) * indicates P < 0.05 between the in vivo control and cadmium exposed groups within the same ex vivo treatment. † indicates P < 0.05 as compared to the ex vivo VEH-treated splenocytes from the same in vivo rat exposure.
3.3. Cadmium exposure has little effect on early events following T cell activation
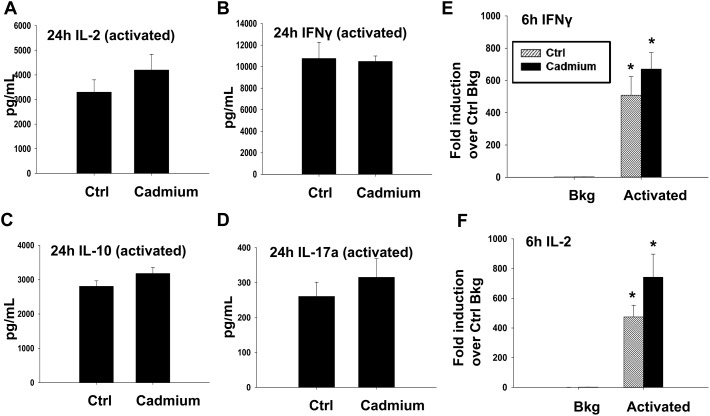
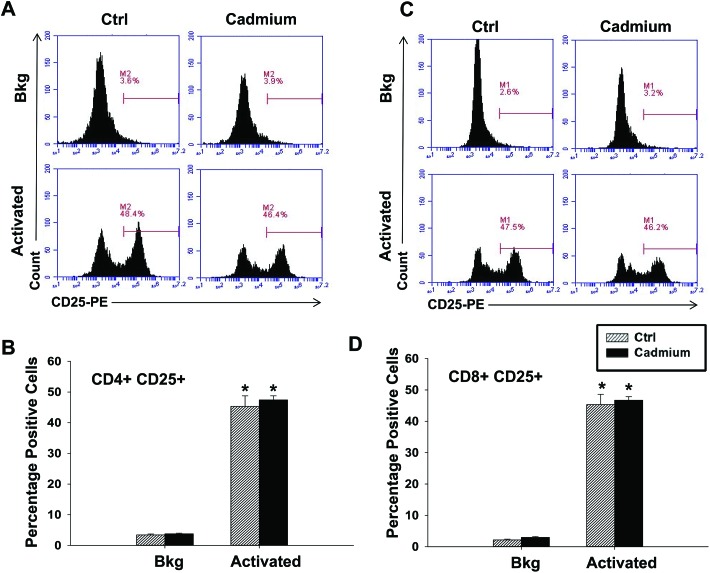
The effect of cadmium on splenic cellularity, redox status and mitochondrial function led us to next assess lymphocyte function. Specifically, we activated the splenocytes for 6 h (RNA analysis) or 24 h (for cytokine proteins) with anti-CD3/anti-CD28, a T cell specific activator. Subchronic cadmium exposure did not cause any statistically significant differences in cytokine induction at early time-points following T cell activation, although there was a trend toward an increase in IL-2 at both the mRNA and protein levels (Fig. 4). Expression of the cell surface protein CD25, the high affinity chain of the IL-2 receptor and a marker of T cell activation was also investigated, but there were no significant differences in CD25 expression between the splenocytes from the vehicle or cadmium-exposed rats in either CD4+ or CD8+ T cells activated with anti-CD3/anti-CD28 (Fig. 5).
Fig. 4. Cadmium exposure has little impact on early cytokines produced upon T cell activation. Splenocytes from the control (Ctrl) or cadmium-exposed rats were left untreated (Bkg) or activated with plate bound αCD3 and soluble αCD28 and cultured for (A–D) 24 h or (E) and (F) 6 h prior to collection and analysis. (A–D) Supernatants were collected 24 h after activation and analyzed for (A) IL-2, (B) IFNγ, (C) IL-10 and (D) IL-17a protein expression by ELISA (IL-17a, IL-2, IL-10) or multiplex suspension assay (IFNγ). (E) and (F) Total RNA was isolated and mRNA expressions of (E) IFNγ and (F) IL-2 were quantified by quantitative RT-PCR. Data are presented as mean ± SE. * indicates P < 0.05 between Bkg and activated splenocytes for the same rat in vivo exposure group.
Fig. 5. Cadmium exposure has little impact on the cell surface marker expression 24 h after T cell activation. Splenocytes from the control (Ctrl) or cadmium-exposed rats were left untreated (Bkg) or activated with plate bound αCD3 and soluble αCD28. Cells were collected 24 h after activation and labeled with fluorochrome-conjugated antibodies against CD4, CD8, and CD25 prior to FACS acquisition and analysis. (A and C) Representative histogram plots gated on (A) CD4+ cells or (C) CD8a+ cells. (B, D) Quantification of CD25 expression in the (B) CD4+ and (D) CD8a+ populations. Data are presented as mean ± SE. * indicates P < 0.05 between Bkg and activated splenocytes for the same rat in vivo exposure group.
3.4. Effect of chronic low-dose cadmium exposure on late cytokine production by activated T cells
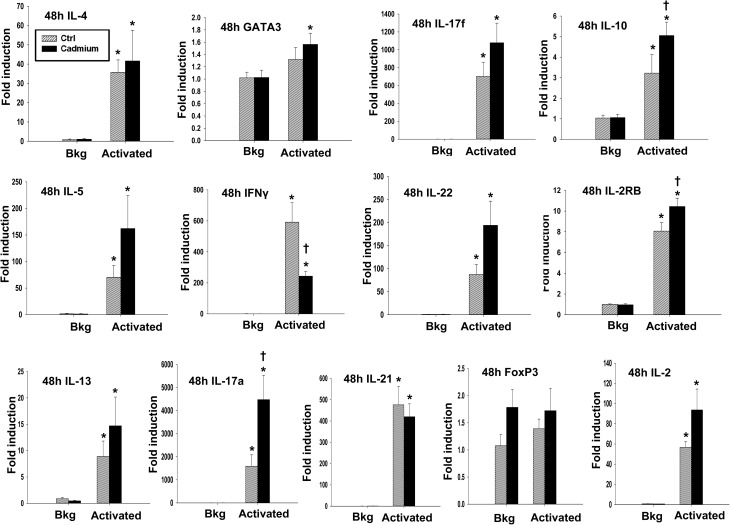
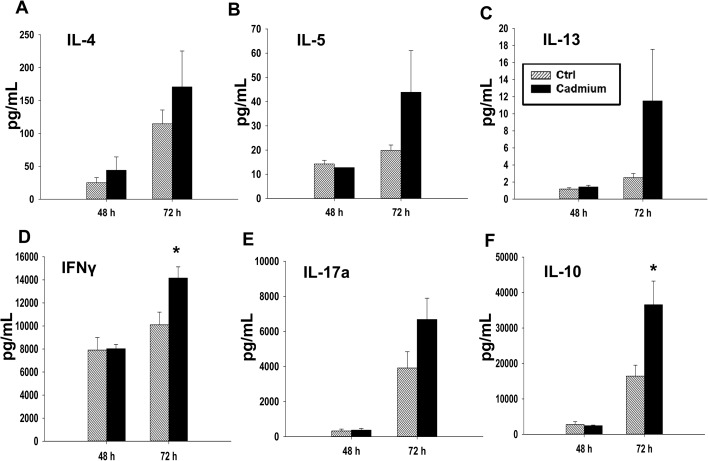
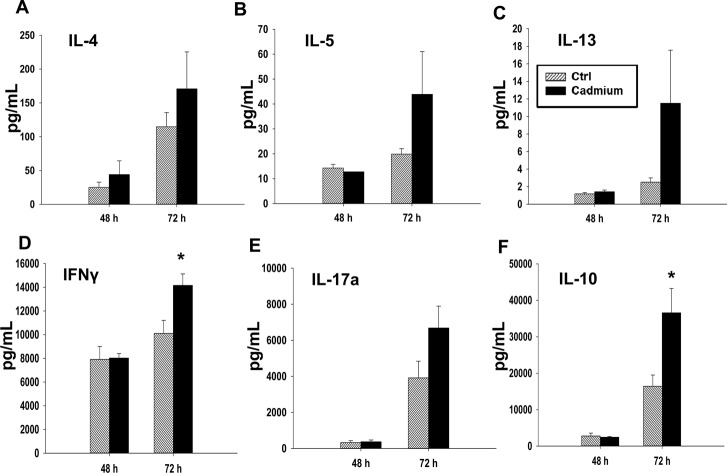
In addition to the effects of cadmium on early events following T cell activation, we also investigated the effects on T cell cytokine production occurring at later time points post activation, including 48 h after activation for mRNA, and up to 72 h after activation for protein quantification. Different cytokines have different patterns of production after T cell activation. Certain cytokines, such as IL-2, are produced in large amounts shortly after T cell stimulation and are subsequently rapidly downregulated.32,33 In contrast, IFNγ is produced both upon T cell activation and through T cell differentiation, and other cytokines, such as IL-4, IL-5, and IL-13, are not produced in substantial amounts initially upon activation, but are upregulated at later timepoints and persist for longer durations.25,34 We observed a statistically significant increase in the mRNA levels of IL-17a and a trend toward an increase in IL-17a protein and in the gene expression of IL-17f and IL-22, all of which are Th17 cytokines (Fig. 6 and 7E). The Th2 cytokines, IL-4, IL-5, and IL-13, also tended to increase at both the mRNA and protein levels, although the differences were not statistically significant (Fig. 6 and 7A–C). However, subchronic cadmium exposure also significantly increased the secretion of IFNγ, a Th1 cytokine, and IL-10, an anti-inflammatory cytokine produced by multiple T cell subsets, 72 h after T cell activation (Fig. 7D and F).
Fig. 6. Cadmium exposure significantly increases IL-10 and IL-17a gene induction in anti-CD3/anti-CD28-activated splenocytes. Splenocytes from the control (Ctrl) or cadmium-exposed rats were activated with plate bound αCD3 and soluble αCD28 (activated) or left unactivated (Bkg). Total RNA was isolated 48 h after activation, and mRNA expression of IL-4, IL-5, IL-13, GATA3, IFNγ, IL-17a, IL-17f, IL-21, IL-22, FoxP3, IL-10, IL-2RB, and IL-2 was quantified by quantitative RT-PCR. Data are presented as mean ± SE. * indicates P < 0.05 between Bkg and activated splenocytes for the same rat in vivo exposure group. † indicates P < 0.05 as compared to the splenocytes derived from control rats within the same ex vivo treatment group.
Fig. 7. Cadmium exposure has moderate effects on T cell differentiation. Splenocytes from the control (Ctrl) or cadmium-exposed rats were activated with plate bound αCD3 and soluble αCD28. Supernatants were collected 48 h and 72 h after stimulation, and protein levels were quantified by multiplex suspension assay for (A) IL-4, (B) IL-5, (C) IL-13, (D) IFNγ, and (F) IL-10 or by ELISA for (E) IL-17a. Data are presented as mean ± SE. * indicates significance compared to the control rat splenocytes (P < 0.05, Student's t-test).
4. Discussion
In this study, we investigated the effect of low-dose, long-term cadmium exposure on basal splenic immune parameters and on T cell responses induced ex vivo. Cadmium-exposed rats had modestly lower body weights compared to the control group, which has been previously reported.1 Cadmium caused a modest, non-significant increase in spleen mass, which is consistent with other studies that have shown splenomegaly in response to cadmium exposure.1,16 Cadmium also decreased the splenic cell numbers overall, which was due to decreases in both leukocytes and red blood cells. However, despite the decrease in total leukocyte numbers, the ratios of various immune cell populations remained unchanged with the exception of the regulatory T cell population, which was modestly, but significantly, increased by cadmium. This suggests that the immune cell populations we analyzed were similarly sensitive to cadmium. Consistent with our findings, Zhang et al. reported that 10 ppm cadmium chloride in drinking water for 3 months modestly decreased splenic B cell, CD8+ T cell, and CD4+ T cell numbers.35
Interestingly, subchronic low-dose cadmium caused a decrease in the ROS and a concurrent increase in mitochondrial membrane potential. This was an unexpected finding as an increased mitochondrial membrane potential is often associated with increased ROS generation. Furthermore, several studies show that cadmium induces oxidative stress in cells, though these studies use higher doses and shorter time points than our study, or in vitro exposure of cultured cells to cadmium.16,36 In contrast, oral exposure to 10 ppm CdCl2 for up to 23 weeks did not change the levels of glutathione and lipid peroxidation in the livers and kidneys of mice, and these experimental conditions more closely match those of our study.37 We hypothesize that the decrease in ROS seen in our study may be due to a compensatory response following low-dose low term cadmium exposure that increases antioxidant genes and decreases the overall ROS levels, which may be occurring through stress response pathways, such as Nrf2,38–40 though this hypothesis would need to be tested in future studies.
Cadmium has been reported to cause numerous effects on cytokine production in cultured cells under a variety of different experimental conditions.16,41–43 Cytokine production is an important part of CD4+ T cell function, with different cytokines promoting different immune responses which are tailored to specific pathogens. Th1 cells produce IFNγ, are important for cell-mediated immunity, and are associated with some types of autoimmunity.44 Th2 cells play an important role in the immune response against larger parasites, are associated with allergy/asthma-like immune responses, and produce IL-4, IL-5, and IL-13.45 IL-17a, IL-17f, IL-21 and IL-22 are produced by Th17 cells, which are involved with certain antibacterial responses and are also associated with autoimmunity.46 IL-10 functions to suppress other immune responses and can be produced by regulatory T cells, among other T cell subsets.47 Thus, changes in cytokine levels, and especially the relative amounts of various cytokines, are critical to shaping immune response and function.
Previous studies indicate that cadmium can impact T cell polarization: cadmium treatment can shift the immune response toward a Th2 response both in vitro and in vivo.41,48,49 Reports have also linked increased cadmium levels with the incidence of asthma in some human populations.50,51 In the current study, we measured T cell cytokine production up to 72 h after activation, a time-point at which T cells are in the middle of lineage decision-making, but prior to ultimate commitment. In line with previous studies that have shown that cadmium exposure can induce Th2 polarization (see above), we found that subchronic cadmium exposure induced the production of Th2 cytokines at both the mRNA and protein levels, though production of these cytokines did not reach significance. Matching this trend, we found that IFNγ mRNA levels were suppressed 48 h after activation in T cells derived from cadmium-exposed rats. However, low-dose cadmium significantly increased the induction of IFNγ protein secretion 72 h after T cell activation. Though unexpected, cytokine production is regulated both transcriptionally and post-transcriptionally,52 and it is possible to have discordant mRNA and protein levels.53 For example, it could be that in our model, the IFNγ protein is stable and persists in the media, whereas the IFNγ mRNA is rapidly degraded, leading to the dichotomy between the two. Cadmium exposure also significantly increased IL-17a mRNA levels and tended to increase IL-17f mRNA, IL-22 mRNA and IL-17a protein expression, although the latter effects were not statistically significant. IL-17a, IL-17f, and IL-22 are all produced by Th17 cells, a cell type that is also typically pro-inflammatory.54 Overall, our observations suggest a trend toward increased cytokine production by activated T cells from the cadmium-exposed rats that may not be skewed toward any particular T cell subset.
In addition to the increased cytokine production stated above, IL-10 induction is increased at both the mRNA and protein levels in activated T cells from the cadmium-exposed rats. Induction of IL-10 often follows inflammatory cytokine induction, which serves as one of the mechanisms to regulate the inflammatory response.47 Likewise, there is a trend toward an increased mRNA expression of Foxp3, a transcription factor associated with Treg differentiation, in unactivated T cells from cadmium-exposed rats, although this trend was not statistically significant.55 The increased expression of Foxp3 mRNA is consistent with the modest increase in CD4+ CD25+ T cells (the majority of which are typically Tregs) as measured by flow cytometry. These effects are consistent with previously published studies in which the splenocytes from the cadmium-exposed mice had increased IL-10 production upon immune stimulation with Concanavalin A.56 Other studies have reported no effect or a decrease in IL-10 production in cells treated with cadmium ex vivo, but the effects of cadmium on regulatory T cells in vivo remains understudied.41
The dose of cadmium used in these studies (32 ppm cadmium chloride in drinking water for 10 weeks) is both representative of prior studies with immune endpoints, and relevant to human exposure. Previously reported studies on a variety of experimental models used doses ranging from 5 to 300 ppm over a range of 1 week to 3 months, and have reported divergent effects1,13,14,16,20,22 Furthermore, the cadmium dose used in this study results in a cadmium body burden, as measured by the cadmium content in the renal cortex, similar to that of young adults.27,29,57 Cadmium bioaccumulates in organs such as the kidney and liver, and the renal cortex of the kidney is considered the critical organ for cadmium toxicity.58 Accordingly, the renal cortex cadmium levels are used as a measure of the internal cadmium dose and cadmium body burden, and have been used in risk assessment.59 To give further context, the cadmium content of the renal cortex from the treated animals reported here ranged from 5.2 to 10.4 μg per g wet weight which is well below the 50 μg per g wet weight average reported for normal middle-aged human beings with non-occupational exposure after lifelong cadmium accumulation.10
Overall, the current study indicates that chronic low-dose cadmium exposure in rats in vivo can impact cytokine production by T cells activated ex vivo. Specifically, we found that cadmium exposure under these experimental conditions significantly increased IFNγ and IL-10 at some time points, but also tended to increase the production of other cytokines such as IL-4, IL-5, IL-13, and IL-17a, although these effects were not statistically significant. Taken together, these results suggest that chronic, low-dose cadmium exposure may cause an overall increase in cytokine production by activated T cells without skewing T cell polarization toward any particular subset.
Abbreviations
- CdCl2
Cadmium chloride
- ConA
Concanavalin A
- DCFDA
2′,7′-Dichlorofluorescin diacetate
- IFNγ
Interferon gamma
- IL-10
Interleukin 10
- IL-13
Interleukin 13
- IL-17a
Interleukin 17a
- IL-17f
Interleukin 17f
- IL-2
Interleukin 2
- IL-4
Interleukin 4
- IL-5
Interleukin 5
- ROS
Reactive oxygen species
- SRBC
Sheep red blood cell
- TNFα
Tumor necrosis factor alpha
Funding information
This work was supported by the National Institutes of Health (grant numbers R00 ES018885 and R01 ES024966 to C. E. R., T32 GM092715 fellowships to J. W. Z. and R. A. F., T32 ES007255 fellowship to A. E. T., and R15 ES028443 to J. R. E.).
Conflicts of interest
The authors report no conflicts of interest.
Acknowledgments
The authors would like to thank Heather Dover, David Cook, and the lab of Dr. Bryan Copple for their assistance.
References
- Faroon O., Ashizawa A., Wright S., Tucker P., Jenkins K., Ingerman L., Rudisill C., ATSDR J. Public Health. 2012:1–487. [PubMed] [Google Scholar]
- Rosen K., Eriksson J., Vinichuk M. J. Environ. Radioact. 2012;113:16–20. doi: 10.1016/j.jenvrad.2012.04.008. [DOI] [PubMed] [Google Scholar]
- Adams S. V., Newcomb P. A. J. Exposure Sci. Environ. Epidemiol. 2014;24:163–170. doi: 10.1038/jes.2013.55. [DOI] [PMC free article] [PubMed] [Google Scholar]
- Satarug S., Baker J. R., Reilly P. E. B., Moore M. R., Williams D. J. Arch. Environ. Health. 2002;57:69–77. doi: 10.1080/00039890209602919. [DOI] [PubMed] [Google Scholar]
- Orłowski C., Piotrowski J. K. Hum. Exp. Toxicol. 2003;22:57–63. doi: 10.1191/0960327103ht326oa. [DOI] [PubMed] [Google Scholar]
- Suwazono Y., Kido T., Nakagawa H., Nishijo M., Honda R., Kobayashi E., Dochi M., Nogawa K. Biomarkers. 2009;14:77–81. doi: 10.1080/13547500902730698. [DOI] [PubMed] [Google Scholar]
- Nordberg G., in Regulatory Toxicology and Pharmacology, 1999, vol. 30. [Google Scholar]
- Ohsawa M., Takahashi K., Otsuka F. Clin. Exp. Immunol. 1988;73:98–102. [PMC free article] [PubMed] [Google Scholar]
- Godt J., Scheidig F., Grosse-Siestrup C., Esche V., Brandenburg P., Reich A., Groneberg D. A. J. Occup. Med. Toxicol. 2006;1:22. doi: 10.1186/1745-6673-1-22. [DOI] [PMC free article] [PubMed] [Google Scholar]
- Friberg L. Environ. Health Perspect. 1984;54:1–11. doi: 10.1289/ehp.84541. [DOI] [PMC free article] [PubMed] [Google Scholar]
- Shaikh Z. A., Smith J. C. Dev. Toxicol. Environ. Sci. 1980;8:569–574. [PubMed] [Google Scholar]
- Descotes J., in Cadmium in the Human Environment, 1992, pp. 385–390. [Google Scholar]
- Dan G., Lall S. B., Rao D. N. Drug Chem. Toxicol. 2000;23:349–360. doi: 10.1081/dct-100100120. [DOI] [PubMed] [Google Scholar]
- Lafuente A., Gonzales-Carracedo A., Esquifino A. I. BioMetals. 2004;17:451–456. doi: 10.1023/b:biom.0000029441.20037.72. [DOI] [PubMed] [Google Scholar]
- Ciz M., Lojek A., Hosek B., Feilhauerova M. Toxicol. Lett. 1996;86:39–45. doi: 10.1016/0378-4274(96)03657-0. [DOI] [PubMed] [Google Scholar]
- Demenesku J., Mirkov I., Ninkov M., Popov Aleksandrov A., Zolotarevski L., Kataranovski D., Kataranovski M. Toxicology. 2014;326:96–108. doi: 10.1016/j.tox.2014.10.012. [DOI] [PubMed] [Google Scholar]
- Kataranovski M., Kataranovski D., Savic D., Jovcic G., Bogdanovic Z., Jovanovic T. Physiol. Res. 1998;47:453–461. [PubMed] [Google Scholar]
- Kataranovski M., Jankovic S., Kataranovski D., Stosic J., Bogojevic D. Biomed. Environ. Sci. 2009;21:1–7. doi: 10.1016/s0895-3988(09)60014-3. [DOI] [PubMed] [Google Scholar]
- Abbes S., Ben Salah-Abbes J., Nahdi K., Ben Younes R., Hetta M. M., El-Kady A. A., Abdel-Wahhab M. A., Oueslati R. Int. Immunopharmacol. 2007;7:750–760. doi: 10.1016/j.intimp.2007.01.013. [DOI] [PubMed] [Google Scholar]
- Koller L. D., Roan J. G. J. Environ. Pathol. Toxicol. 1980;4:47–52. [PubMed] [Google Scholar]
- Blakley B. R. Can. J. Comp. Med. 1985;49:104–108. [PMC free article] [PubMed] [Google Scholar]
- Malave I., De Ruffino D. T. Toxicol. Appl. Pharmacol. 1984;74:46–56. doi: 10.1016/0041-008x(84)90268-0. [DOI] [PubMed] [Google Scholar]
- Suntararuks S., Yoopan N., Rangkadilok N., Worasuttayangkurn L., Nookabkaew S., Satayavivad J. J. Agric. Food Chem. 2008;56:9305–9311. doi: 10.1021/jf801062z. [DOI] [PubMed] [Google Scholar]
- Smith-Garvin J. Annu. Rev. Immunol. 2009;27:591–619. doi: 10.1146/annurev.immunol.021908.132706. [DOI] [PMC free article] [PubMed] [Google Scholar]
- Reddy M., Eirikis E., Davis C., Davis H. M., Prabhakar U. J. Immunol. Methods. 2004;293:127–142. doi: 10.1016/j.jim.2004.07.006. [DOI] [PubMed] [Google Scholar]
- Zhu J., Yamane H., Paul W. E. Annu. Rev. Immunol. 2010;28:445–489. doi: 10.1146/annurev-immunol-030409-101212. [DOI] [PMC free article] [PubMed] [Google Scholar]
- Meranger J. C., Conacher H., Cunningham H., Krewski D. Can. J. Public Health. 1981;72:269–272. [PubMed] [Google Scholar]
- Kjellstrom T. Environ. Health Perspect. 1979;28:169–197. doi: 10.1289/ehp.28-1637502. [DOI] [PMC free article] [PubMed] [Google Scholar]
- Vuori E., Huunan-Seppala A., Kilpio J. O., Salmela S. S. Scand. J. Work, Environ. Health. 1979;5:16–22. doi: 10.5271/sjweh.2670. [DOI] [PubMed] [Google Scholar]
- Ye J., Coulouris G., Zaretskaya I., Cutcutache I., Rozen S., Madden T. L. BMC Bioinf. 2012;13:134. doi: 10.1186/1471-2105-13-134. [DOI] [PMC free article] [PubMed] [Google Scholar]
- Ronis M. J. J., Butura A., Korourian S., Shankar K., Simpson P., Badeaux J., Albano E., Ingelman-Sundberg M., Badger T. M. Exp. Biol. Med. 2008;233:344–355. doi: 10.3181/0707-RM-203. [DOI] [PubMed] [Google Scholar]
- Long M., Adler A. J. J. Immunol. 2006;177:4257–4261. doi: 10.4049/jimmunol.177.7.4257. [DOI] [PMC free article] [PubMed] [Google Scholar]
- Sojka D. K., Bruniquel D., Schwartz R. H., Singh N. J. J. Immunol. 2004;172:6136–6143. doi: 10.4049/jimmunol.172.10.6136. [DOI] [PubMed] [Google Scholar]
- Abdalla A. O., Kiaii S., Hansson L., Rossmann E. D., Jeddi-Tehrani M., Shokri F., Osterborg A., Mellstedt H., Rabbani H. Scand. J. Immunol. 2003;58:601–606. doi: 10.1111/j.1365-3083.2003.01348.x. [DOI] [PubMed] [Google Scholar]
- Zhang Y., Yu X., Sun S., Li Q., Xie Y., Li Q., Zhao Y., Pei J., Zhang W., Xue P., Zhou Z., Zhang Y. Toxicol. Appl. Pharmacol. 2016;313:24–34. doi: 10.1016/j.taap.2016.10.016. [DOI] [PubMed] [Google Scholar]
- Pathak N., Khandelwal S. Toxicol. Lett. 2006;165:121–132. doi: 10.1016/j.toxlet.2006.02.004. [DOI] [PubMed] [Google Scholar]
- Thijssen S., Cuypers A., Maringwa J., Smeets K., Horemans N., Lambrichts I., Van Kerkhove E. Toxicology. 2007;236:29–41. doi: 10.1016/j.tox.2007.03.022. [DOI] [PubMed] [Google Scholar]
- Sandbichler A., Höckner M. Int. J. Mol. Sci. 2016;17:139. doi: 10.3390/ijms17010139. [DOI] [PMC free article] [PubMed] [Google Scholar]
- Liu J., Qu W., Kadiiska M. B. Toxicol. Appl. Pharmacol. 2009;238:209–214. doi: 10.1016/j.taap.2009.01.029. [DOI] [PMC free article] [PubMed] [Google Scholar]
- Chen J., Shaikh Z. A. Toxicol. Appl. Pharmacol. 2009;241:81–89. doi: 10.1016/j.taap.2009.07.038. [DOI] [PubMed] [Google Scholar]
- Hemdan N. Y. A., Emmrich F., Sack U., Wichmann G., Lehmann J., Adham K., Lehmann I. Toxicology. 2006;222:37–45. doi: 10.1016/j.tox.2006.01.026. [DOI] [PubMed] [Google Scholar]
- Boscolo P., Di Giampaolo L., Qiao N., Reale M., Castellani M. L., Lucci I., Travaglini P., Kouri M., Verna N., Volpe A. R., Carmignani M., Paganelli R., Di Gioacchino M. Ann. Clin. Lab. Sci. 2005;35:115–120. [PubMed] [Google Scholar]
- Djokic J., Aleksandrov A. P., Ninkov M., Mirkov I., Zolotarevski L., Kataranovski D., Kataranovski M. J. Immunotoxicol. 2015;12:115–123. doi: 10.3109/1547691X.2014.904955. [DOI] [PubMed] [Google Scholar]
- Abbas A. K., Murphy K. M., Sher A. Nature. 1996;383:787–793. doi: 10.1038/383787a0. [DOI] [PubMed] [Google Scholar]
- Pennock N. D., White J. T., Cross E. W., Cheney E. E., Tamburini B. A., Kedl R. M. Adv. Physiol. Educ. 2013;37:273–283. doi: 10.1152/advan.00066.2013. [DOI] [PMC free article] [PubMed] [Google Scholar]
- Miossec P. Microbes Infect. 2009;11:625–630. doi: 10.1016/j.micinf.2009.04.003. [DOI] [PubMed] [Google Scholar]
- Couper K. N., Blount D. G., Riley E. M. J. Immunol. 2008;180:5771–5777. doi: 10.4049/jimmunol.180.9.5771. [DOI] [PubMed] [Google Scholar]
- Krocova Z., Macela A., Kroca M., Hernychova L. Toxicol. In Vitro. 2000;14:33–40. doi: 10.1016/s0887-2333(99)00089-2. [DOI] [PubMed] [Google Scholar]
- Carey J. B., Allshire A., van Pelt F. N. Toxicol. Sci. 2006;91:113–122. doi: 10.1093/toxsci/kfj142. [DOI] [PubMed] [Google Scholar]
- Park S., Lee E. H., Kho Y. J. Allergy Clin. Immunol. 2016;138:1701–1703. doi: 10.1016/j.jaci.2016.04.030. [DOI] [PubMed] [Google Scholar]
- Huang X., Xie J., Cui X., Zhou Y., Wu X., Lu W., Shen Y., Yuan J., Chen W. PLoS One. 2016;11:1–18. doi: 10.1371/journal.pone.0155818. [DOI] [PMC free article] [PubMed] [Google Scholar]
- Nicolet B. P., Salerno F., Wolkers M. C. Biochem. Soc. Trans. 2017;45:563–570. doi: 10.1042/BST20170003. [DOI] [PubMed] [Google Scholar]
- Shebl F. M., Pinto L. A., García-Piñeres A., Lempicki R., Williams M., Harro C., Hildesheim A. Cancer Epidemiol. Biomarkers Prev. 2010;19:978–981. doi: 10.1158/1055-9965.EPI-10-0064. [DOI] [PMC free article] [PubMed] [Google Scholar]
- Dardalhon V., Korn T., Kuchroo V. K., Anderson A. C. J. Autoimmun. 2008;31:252–256. doi: 10.1016/j.jaut.2008.04.017. [DOI] [PMC free article] [PubMed] [Google Scholar]
- Hori S., Nomura T., Skaguchi S. Science. 2003;299:1057–1061. [PubMed] [Google Scholar]
- Dvoroznakova E., Dvoroznaakova M., Soltys J. Helminthologia. 2016;53:14–23. [Google Scholar]
- Lyon T. D. B., Aughey E., Scott R., Fell G. S. J. Environ. Monit. 1999;1:227–231. doi: 10.1039/a901366k. [DOI] [PubMed] [Google Scholar]
- Nordberg G. F., Bernard A., Diamond G. L., Duffus J. H., Illing P., Nordberg M., Bergdahl I. A., Jin T., Skerfving S. Pure Appl. Chem. 2018;90:755–808. [Google Scholar]
- Foulkes E. C. Environ. Geochem. Health. 1986;8:91–94. doi: 10.1007/BF02439209. [DOI] [PubMed] [Google Scholar]


