

Abstract
Although research highlights neural correlates of Major Depressive Disorder (MDD), it is unclear whether these correlates reflect the state of depression or a pre-existing risk factor. The current study examined whether baseline differences in brain activations, resting-state connectivity, and brain structural differences between non-symptomatic children at high- and low-risk for MDD based on familial depression prospectively predict the onset of a depressive episode or increases in depressive symptomatology. We re-assessed 44 participants (28 high-risk; 16 low-risk) who had undergone neuroimaging in a previous study 3-4 years earlier (Mean age at follow-up = 14.3 years, SD = 1.9 years; 45% females; 70% Caucasian). We investigated whether baseline brain imaging data (including an emotional face match task fMRI, resting-state fMRI and structural MRI) that differentiated the risk groups also predicted the onset of depression. Resting-state functional connectivity abnormalities in the default mode and cognitive control network that differentiated high-risk from low-risk youth at baseline predicted the onset of MDD during adolescence, after taking risk status into account. Increased functional activation to both happy and fearful faces was associated with greater decreases in self-reported depression symptoms at follow-up. This preliminary evidence could be used to identify youth at-risk for depression and inform early intervention strategies.
Keywords: Children, Adolescence, Depression, MDD, Risk, Familial risk, fMRI
1. Introduction
Major Depressive Disorder (MDD) is one of the most common mental illnesses (Kessler et al., 2005) and a leading cause of disability and premature death worldwide (Ferrari et al., 2013). MDD is a highly recurrent disorder with roughly 80% of individuals with a first episode experiencing at least one recurrence (Judd, 1997). MDD leads to greater impairment in work functioning than other chronic medical conditions (Druss et al., 2000), and has an estimated annual cost of $210.5 billion in the US (Greenberg et al., 2015). Due to the high prevalence rates, chronic and recurring nature, and functional impairment of this disorder, researchers have examined risk factors associated with the onset and course of MDD to inform prevention strategies, early identification and intervention, and empirically-informed treatment development.
A large body of research has found differences between those with and without MDD in terms of structural, functional connectivity, and functional activation differences. Intrinsic function connectivity differences have been found to differentiate individuals with MDD from healthy controls in a number of distributed brain regions (Kaiser et al., 2015; Sheline et al., 2010; Greicius et al., 2007; Mulders et al., 2015). The triple network model has been used to provide a framework to understand the core network dysfunctions association with psychopathology (Menon, 2011). Included in this model are the default mode network (DMN; Greicius et al., 2003), anchored by the midline regions of medial prefrontal cortex (mPFC) and posterior cingulate cortex (PCC), the cognitive control network (CCN; Cole & Schneider, 2007), and the salience network (SN; Seeley et al., 2007), which consist of anterior cingulate gyrus, insula and amygdala. Both within and between network connectivity abnormalities have been observed in individuals with MDD. Individuals with MDD show increased resting state whole brain connectivity within regions of the mPFC, a central region of the DMN, and between the DMN and subgenual ACC (sgACC) (Greicius et al., 2007; Kaiser et al., 2015; Zhu et al., 2012). Youth with MDD also exhibit aberrant functional connectivity in regions of the DMN (Connolly et al., 2013; Posner et al., 2016). In addition, research indicates decreased functional connectivity within regions of the CCN in adults with MDD (Alexopoulos et al., 2012; Hamilton et al., 2015) and decreased connectivity between the CCN and the DMN (Mulders et al., 2015; Sheline et al., 2010). Finally, abnormal connectivity has been reported in regions in the SN, and between regions of the SN and the CCN, indicated cortico-limbic dysregulation associated with MDD (Dutta et al., 2014; Kaiser et al., 2015; Zhong et al., 2016) that has also been found in youth (Hulvershorn et al., 2011; Luking et al., 2011).
In parallel, individuals with major depression have shown atypical patterns of activation in DMN, CCN and SN. In individuals with depression, the DMN, anchored in the mPFC and posterior cingulate cortex (PCC), does not show the typical pattern of de-activation that is found in healthy subjects when confronted with emotional stimuli (Sheline et al., 2009; Fales et al., 2008; Ho et al., 2015). The CCN, anchored in the dorsolateral prefrontal cortex (dlPFC), has been shown to be underactive in adults with depression, suggesting poor cognitive control (Diener et al., 2012; Groenewold et al., 2013). Finally, the SN, includes the amygdala and other limbic regions is centrally associated with MDD and exhibits aberrant activation during emotional process in adults with depression (Hamilton et al., 2012; Sheline et al., 2009). A recent meta-analysis indicated that compared to age-matched healthy controls, youth with MDD demonstrated hyperactivation in regions of the SN associated with affective processing and hypoactivation in regions of the CCN associated with cognitive control suggesting that pediatric findings are consistent with adult depression (Miller et al., 2015).
Finally, in addition to the functional abnormalities found in MDD, structural differences have been found between those with MDD and healthy controls in volume of the amygdala (Frodl et al., 2003; Hastings et al., 2004; MacMaster et al., 2008; Sacher et al., 2012), ACC and subregions of the PFC (Kempton et al., 2011), and mPFC (Drevets, Price, & Furey, 2008). A recent review suggests that there is preliminary evidence that pediatric depression is associated with decreased volume in the PFC, abnormally thinned cortical regions, and smaller amygdala and hippocampal volumes in those with MDD (Hulvershorn et al., 2011).
Although this research highlights neural differences between those with and without MDD, it is unclear whether these differences precede onset of depression and constitute risk factors for the disorder or are simply state differences that reflect the state of acute depression (Kraemer et al., 1997). To address this concern, researchers have begun to examine neural differences in individuals known to be at risk for depression who have not yet onset with disorder. One such factor is parental history of MDD which has been shown to increase the risk of MDD in offspring by threefold to fivefold (Williamson et al., 2004).
In the baseline wave of the present study (Chai et al., 2015, 2016), we used fMRI and structural scans to examine function and structure in unaffected children ages 8-14 at familial risk for MDD (high-risk group) and comparison children who were offspring of parents with no lifetime history of any mood disorder (low-risk group). We found that children at high risk for depression had increased connectivity between the DMN and sgACC, and decreased connectivity in CCN regions including the dlPFC (Chai et al., 2016; See Figure 1). In addition, these youth had increased activation to fearful faces in the amygdala and several cortical regions and decreased activation to happy faces in the anterior cingulate cortex and supramarginal gyrus (Chai et al., 2015; See Figure 2). At-risk youth also had structural differences including reduced amygdala volume compared to those at low-risk (Chai et al., 2015). These findings were consistent with prior studies highlighting differences between those with and without MDD (e.g., Greicius et al., 2007; Kaiser et al., 2015). Taken together, these results suggest that offspring at risk for depression show differences in areas associated with MDD.
Figure 1.
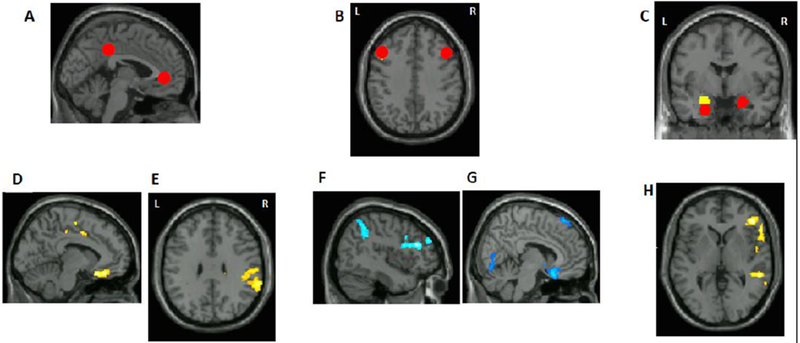
Resting-state connectivity findings previous published in Chai et al., 2016. A) default network seeds, B) left and right dorsolateral prefrontal cortex seeds (dlPFC), C) left and right amygdala seeds. Images are presented in neurological convention in all figures (left side of the brain is on the left side of the image). D) A region in subgenual ACC that showed higher connectivity with the default network in the at-risk compared to the control group. E) A region in supramarginal gyrus that showed higher connectivity with the default network in the at-risk compared to the control group. F) Left supramarginal gyrus and left dlPFC showed lower connectivity with right dlPFC seed in the at-risk compared to the control group. G) A region in the subgenual ACC that showed lower connectivity with left dlPFC seed in the at-risk compared to the control group. H) A region in the right inferior frontal gyrus (IFG) that showed lower connectivity with right amygdala seed in the at-risk compared to the control group.
Figure 2.
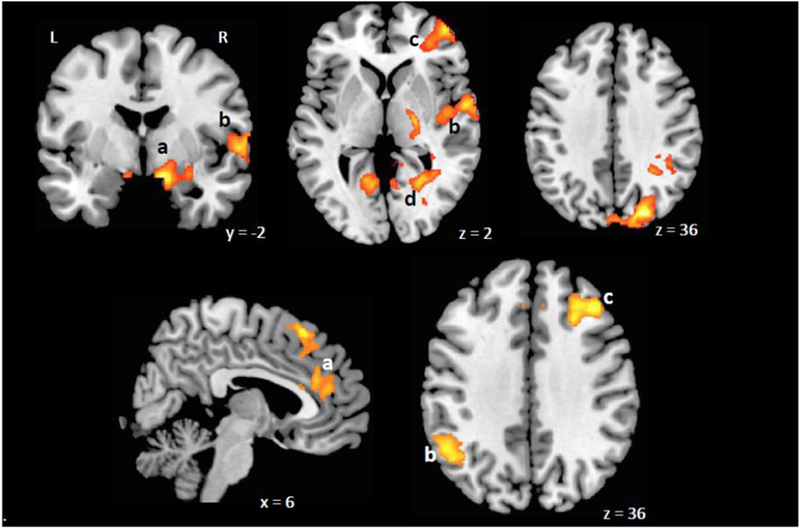
Emotional face matching task activations (previously published in Chai et al., 2015).Top panel: Brain areas with higher activations for fearful faces compared to neutral faces in at-risk group compared to controls. a, amygdala; b, superior temporal gyrus; c, anterior prefrontal cortex (BA10); d, posterior cingulate cortex; Bottom panel: Brain areas with higher activations for happy faces compared to neutral faces. a, anterior cingulate cortex, b, supramarginal gyrus, c, superior prefrontal gyrus.
However, as the offspring we examined were unaffected with depression, it is unclear whether the differences we observed represented risk factors for the onset of depression, or alternatively, resilience factors associated with protection from depression. Therefore, the current study aimed to examine whether the differences in brain activation, resting-state connectivity and structural differences we observed previously (Chai et al., 2015; Chai et al., 2016) would prospectively predict depression in two ways: That is, we utilized only the a priori neural changes that differentiated the high- versus low-risk children to predict who would exhibit increased depressive symptoms or the onset of depression over time. First, we examined whether the children had emerged with a full episode of MDD during the interval since the baseline scan, using diagnostic interviews covering diagnoses during the interval. Second, we examined whether their current symptoms of depression were higher at the follow-up than at the baseline. The follow-up was conducted 3-4 years after the original neuroimaging was conducted, when the children were 11-19 years old. We hypothesized that the functional and structural brain differences measured by MRI between the high- and low-risk children found at baseline would prospectively predict the onset of a depressive episode and increases in symptomatology beyond that predicted by familial risk itself.
2. Methods
2.1. Participants
Baseline.
Participants in the baseline study who had usable scans (i.e. scans without excessive head movement) consisted of 39 offspring of parents with a lifetime history of MDD (at-risk group; 66%) and 20 age-matched offspring of parents with no lifetime mood disorder (control group; 34%). Participants who did not complete the resting-state scan, had excessive head movement (defined by having translational movement > 3mm at any direction during any time of the scan, or having more than 1/3 of the timepoints identified as outliers) were excluded. These children were between 8 and 14 years old (Mean Age = 11.0 years, SD = 1.72 years). Exclusion criteria included the presence of acute psychosis or suicidality in a parent or a child, the presence at any point in the life span of bipolar disorder in the parent, autism in the child, a lifetime history of a traumatic brain injury or neurological disorder in the child, or factors contraindicating MRI (e.g. braces, claustrophobia). At baseline, children had no current or prior history of major depressive disorder, as determined by structured diagnostic interviews with parent informants. Children in the at-risk and control groups did not differ significantly in age, gender, or IQ (ps > .3). The at-risk group had marginally, but not significantly, higher symptoms reported by parents on the Child Behavior Checklist (CBCL total, p = .05). However, none of the children had clinical-levels of symptoms. In addition, self-reported depressive symptoms (CDI total scores) did not differ significantly between the two groups (p = .26).
Follow-Up.
We re-assessed 44 participants (75%) from the 59 who had usable neuroimaging data from the original study (Table 1). This study was approved by the Institutional Review Boards at the Massachusetts General Hospital and at the Massachusetts Institute of Technology. Parents provided written informed consent for their and their child’s participation, and youths provided written assent, or consent if they were 18, for themselves. At the follow-up assessment, participants were between 11-19 years-old (mean age = 14.3 years, SD = 1.9 years) and included 45% females; 70% Caucasian, 5% African-American, 2% Asian-American, 2% Latino/Hispanic, and 19% multi-racial. Follow-up assessments were on average 3.95 years after the initial study (Range 3.18 – 4.56 years, SD = 0.39 years). The follow-up sample consisted of 28 (64%) at-risk children and 16 (36%) control children, reflecting the original ratio of 2:1 at risk to comparison children (χ2 = 0.47, p = .49). An overlapping set of participants was included in another report that examined whole-brain connectivity patterns in depressed individuals (Hirshfeld-Becker et al. in prep).
Table 1:
Demographic and Clinical Differences at Follow-Up
| Measure | At Risk (N=28) | Controls (N=16) | Statistic |
|---|---|---|---|
| n,% | n,% | Fisher Exact, p | |
| Sex (male) | 16, 57.14% | 8, 50% | p=.442 |
| Racea | p=.080 | ||
| European-American | 23, 82.1% | 7, 46.6% | |
| African-American | 1, 3.5% | 1, 6.6% | |
| Asian-American | 0, 0% | 2, 13.3% | |
| Latino-American | 0,0% | 1, 6.6% | |
| Biracial | 4, 14.3% | 4, 26.6% | |
| Mean, SD | Mean, SD | Mann-Whitney, z, p | |
| Age (years) | 14.64 (1.42) | 13.75 (2.49) | z=−1.627, p=.104 |
| Follow-up interval (years) | 3.95 (.31) | 3.71 (.48) | z=−2.45, p=.0142 |
| CBCL Internalizing T-Scoreb | 48.15 (12.07) | 44.5 (7.52) | z=−.97, p=.33 |
| CDI Total Depression T-Score | 51.04 (11.66) | 48.38 (8.38) | z=−56, p=.57 |
One values were missing.
One value was missing.
2.2. Procedures
2.2.1. Diagnostic Assessment
Baseline.
Each child and both parents in each family were assessed for current and lifetime mood disorders (MDD, bipolar disorder, and dysthymia), using structured clinical interviews in which the mother was the informant. Interviews about parents used the depression, mania, dysthymia, and psychosis modules from the Structured Interview for DSM-IV (First, 1995) and those about the child used the depression, mania, dysthymia, and psychosis modules from the Schedule of Affective Disorders and Schizophrenia for School-Aged Children–Epidemiological Version for DSM-IV (K-SADS-E; Orvaschel, 1994). Both at-risk and control-group participants underwent diagnostic interviews at baseline to determine risk status.
Follow-Up.
At the follow-up, the child and one parent completed the K-SADS-E to report on the child’s current of history of psychopathology since the baseline assessment. The assessor was a different interviewer from the baseline interviews that was blind to risk status. The same interviewer administered the K-SADS-E first to the parent and then to the youth, and then created summary ratings. Currently, no consensus exists about how best to integrate discrepant information from multiple informants, despite the fact that parents and children often disagree in their reports of the child’s symptoms (e.g., Braaten et al., 2001; Cantwell, Lewinsohn, Rohde, & Seeley, 1997; Jensen et al., 1999). To maintain fidelity to the K-SADS-E, we used the interviewer’s summary ratings based on his/her ‘best-estimate’ clinical judgment from interviewing both parent and child. The K-SADS-E diagnostic interviews have good inter-rater and retest reliability (Orvaschel, 1995). An advanced post-doctoral psychology fellow (BGS) conducted all prospective interviews. He had extensive experience interviewing adolescents and parents with semi-structured diagnostic interviews, and was trained on reliability on the K-SADS-E with a perfect diagnostic reliability (K = 1.00, p < .001) and high item level correlation (ICC = .88, p < .001). In addition, all diagnostic decisions were reviewed with a senior child and adolescent psychologist (DRHB) who had expertise reliably administering, training, and supervising interviewers on the K-SADS-E.
2.2.2. Symptom Questionnaires
Parent Report.
To assess current behavioral and emotional symptoms in the children, we asked parents to complete the Child Behavior Checklist (CBCL) (Achenbach, 2001) about all children. The CBCL includes a total problems score, as well as scores reflecting internalizing (affective and anxiety) and externalizing symptoms (attentional problems and disruptive behavior). We utilized the internalizing symptoms score to assess parent report of youth symptoms. This measure was completed at baseline and the prospective assessment with a T score above 63 on the internalizing scores considered in clinical range.
Self-Report.
To assess current depressive symptoms by self-report, we administered the Child Depression Inventory (CDI) (Kovacs, 1985) to all children. This is a 27-item self-report questionnaire that measures total depression, and five factors: negative mood, interpersonal problems, ineffectiveness, anhedonia, and negative self-esteem. This measure was completed at baseline and the prospective assessment with a T score above 65 considered above the clinical cutoff.
2.2.3. Imaging Procedure
At baseline, participants underwent fMRI scans. Data were acquired on a 3T TrioTim Siemens scanner using a 32-channel head coil. T1-weighted anatomical images (256 × 256 voxels, 1 × 1.3 mm in-plane resolution, 1.3-mm slice thickness) were acquired. After the anatomical scan, participants underwent a resting fMRI scan in which participants were instructed to keep their eyes open and the screen was blanked. The resting scan lasted 6.2 minutes (67 slices 2×2×2mm voxels, repetition time = 6s, slice thickness = 2mm). Functional MRI images were obtained in 3-mm-thick transverse slices, covering the entire brain (interleaved EPI sequence, repetition time=2 s, 3 × 3 × 3mmvoxels). See Chai et al., 2015; 2016 for more details.
Resting State Functional Connectivity.
Functional connectivity analysis was performed using a seed driven approach with in-house, custom software CONN (Chai et al., 2012; Whitfield-Gabrieli & Nieto-Castanon, 2012). We performed resting state connectivity analysis from the DMN seeds (mPFC, PCC), cognitive control network seeds (left and right dlPFC), and left and right amygdala seeds (Table 2). The DMN and dlPFC seeds were defined as 6-mm spheres around peak coordinates from Fair et al. (Fair et al., 2009). The amygdala seeds were defined from the WFU Pick Atlas (Maldjian et al., 2003).
Table 2.
Baseline Neural Variables that differentiated at-risk from control children
| Functional Activation Variables | |
| 1 | Fear versus Neutral Activation - MTL/amygdala |
| 2 | Fear versus Neutral Activation - PCC |
| 3 | Fear versus Neutral Activation - Right Insula STG |
| 4 | Happy versus Neutral Activation - Dorsal ACC |
| 5 | Happy versus Neutral Activation - Right BA9 dlPFC |
| 6 | Happy versus Neutral Activation - Right Temporal Pole |
| 7 | Happy versus Neutral Activation - Left BA40 |
| 8 | Fearful versus Neutral - Total Voxel Activation |
| 9 | Happy versus Neutral - Total Voxel Activation |
| Functional Connectivity Variables | |
| 1 | DMN Subgenual ACC |
| 2 | DMN Right Supramarginal |
| 3 | DMN Precuneus |
| 4 | Left dlPFC Superior Frontal |
| 5 | Left dlFC Right Inferior Temporal |
| 6 | Left dlPFC Lingual |
| 7 | Left dlPFC Inferior Temporal |
| 8 | Left dlPFC Left Cerebellum |
| 9 | Left dlPFC Subgenual ACC |
| 10 | Left dlPFC Medial Frontal Gyrus |
| 11 | Right dlPFC Right Superior Frontal Gyrus |
| 12 | Right dlPFC Right BA46 |
| 13 | Right dlPFC Right BA40 |
| 14 | Right dlPFC Left Middle Orbital Frontal Gyrus |
| 15 | Right Amygdala Right IFG |
| 16 | Right Amygdala Supramarginal STG |
| 17 | Right Amygdala Right Supramarginal |
| Structural Variables | |
| 1 | Left Amygdala |
| 2 | Right Amygdala |
Note: DMN, Default Mode Network; dlPFC, dorsolateral prefrontal cortex; ACC, anterior cingulate cortex; BA, Brodmann area; IFG, inferior frontal gyrus; STG, superior temporal gyrus
First-level correlation maps were produced by computing Pearson correlation coefficients between the average time course of the voxels in the seed and the time course of all other voxels in the brain. DMN connectivity was calculated from the averages of the time series from mPFC and PCC seeds (Fox et al., 2005; Whitfield-Gabrieli et al., 2009), given their similar connectivity patterns. First-level connectivity maps for each participant were entered into a between-group t test to determine connectivity differences for each seed between groups. See Chai et al, 2016 for details.
Connectivity values that differentiated between the high- and low- risk groups (Figure 1; Table 2) (reported in Chai et al., 2016) were used in the present analysis to predict the onset of depression.
Functional Activation: Face-Match Task.
Participants completed a simple perceptual matching task, during fMRI scanning. Participants viewed a trio of images including faces with fearful, happy and neutral expressions on the screen and were asked to select one of the two images on the bottom that was identical to the target image (on the top). Standard functional image preprocessing analysis were done using SPM8 (http://www.fil.ion.ucl.ac.uk/spm/). We had examined two contrasts of interest: Fearful Faces > Neutral Faces and Happy Faces > Neutral Faces and compared the activation differences between the low-risk and high-risk group. See Chai et al, 2015 for details.
Regions that showed differences in activation levels between the high- and low- risk groups (reported in Chai et al., 2015; Table 2; Figure 2) were used in the present analysis to predict depression. In addition, to reflect overarching differences in activation levels two variables, total voxels activated to Fearful versus Neutral faces and total voxels activated to Happy versus Neutral faces were also used in the present analysis.
Structural Analysis.
Anatomical images were processed in FreeSurfer v5.0 (Dale et al., 1999). We focused on volumes of the left and right amygdala, given previous reports on abnormal amygdala volume in MDD (Frodl et al., 2003; Hastings et al., 2004; MacMaster et al., 2008). Relative amygdala volume was calculated by dividing raw amygdala by total cranial volume in each participant (Chai et al., 2015). Compared to the control group, the at-risk group had a smaller right amygdala volume (adjusted by total brain volume) (t(53) = 3.05, p = .003). The left amygdala volume (adjusted) was marginally lower in the at-risk group compared to control group (p = .06). (Chai et al., 2015).
2.2.4. Data Analysis
To determine whether the neural variables that differentiated the at-risk and comparison youth at baseline would predict the onset of MDD at any point during the interval since the scan, or acutely increased depression symptoms at the time of follow-up, we conducted stepwise logistic and linear regressions, respectively. As predictors, we used the following variables which had previously been found to differentiate risk status (Chai et al, 2015, 2016) (see Table 2): 1) Resting State Functional Connectivity variables (e.g., DMN, 1dLPFC, rdLPFC, R amygdala connectivity); 2) fMRI Functional Activation differences including responses to Fearful vs. Neutral Faces and responses to Happy vs. Neutral faces; and 3) Structural variables that included two differences (i.e. Left and Right Amygdala Volume). Because we had more potential covariates than subjects, it was necessary to reduce the number of covariates considered in predictive models. We selected five covariates using leaps-and-bounds subset selection with canonical correlation as the selection criterion. We determined the size of subsets to be considered based on a simulation of the permutation distribution under the null hypothesis. We considered covariates which appeared most often in the best 30 subset of 5 in order to reduce the risk of overfitting. The dependent variables included 1) the diagnosis of MDD at any point during the assessment interval, and 2) change in current self- and parent-reported depression symptoms (CDI and CBCL Internalizing subscale; respectively) from baseline to follow-up. We conducted separate analyses for functional connectivity, functional activation, and structural differences for each dependent variable. These were run for the onset of MDD and symptom change separately because participants may have had an onset of MDD at some point during the interval but not been currently depressed at the follow-up visit. In addition, because risk status (presence or absence of parental history of depression) is a known risk factor for onset of MDD and depressive symptoms, we covaried risk status (1 - at risk; 0 - control) in all analyses in the first step. This allowed us to determine whether the neural variables distinguishing the groups at baseline added to the ability to predict depression onset beyond that afforded by risk status alone. Data reduction was performed using R (version 3.1) and the subset selection library “subselect” (Cerdiera et al., 2015; R Core Team, 2016).
3. Results
The participants that were re-assessed (N=44) did not differ from the original sample (N=59) on gender (F = .51, p = .48), self-reported (CDI) depressive symptoms (t = 1.50, p = .14), or parent reported (CBCL Internalizing) depressive symptoms (t = 1.57, p = 1.12) at baseline. At baseline, no participants had a history of MDD. At the follow-up assessment 39% of the at-risk youth (11/28) and 6% of the control youth (1/16) had developed at least one episode of MDD in the interval since being scanned. These were mainly diagnoses that had occurred during the follow-up interval and resolved. At the time of the follow-up, only two participants met criteria for current MDD based on the KSADS. Similarly, only four participants had CDI total scaled score above 65 and only 3 had a CBCL Internalizing scaled score above 63 (Table 1). Age, gender, race, income, and time between the baseline scan and follow-up assessment was not significantly associated with the development of MDD (ps >.05) or symptoms at the follow-up assessment based on self or parent report (ps >.05).
3.1. Resting State Functional Connectivity:
Due to the limited sample size affording limited power to test multiple variables, we chose to reduce the number of resting state neural variables. We determined optimal subsets of these variables by selecting subsets most highly correlated with omitted variables. We did this by using leaps-and-bounds subset selection for high- and low-risk subjects combined, with canonical correlation as the criterion (Cadima & Jolliffe, 2001; Duarte Silva, 2001; Duarte Silva, 2002). We compared the maximum canonical correlation as a function of subset size with the upper 95% confidence limit of this quantity as determined by simulation of the permutation distribution under the null hypothesis of no correlation. A subset of size five was the smallest value for which the maximum canonical correlation was greater than this upper confidence limit. Several overlapping subsets had values of the criterion near the maximum value. In order to reduce the risk of overfitting, we considered the 30 subsets with the highest correlation values, instead of simply selecting a single “optimal” subset. Among the best 30 subsets of five variables determined in this way we chose five covariates that appeared most frequently. We included these variables in a stepwise logistic regression analysis with follow-up depression as response. Finally, we used this model to predict depression, and calculated the sensitivity and specificity.
As discussed above, the subset cardinality of five was selected by simulation. The five connectivity values that best predicted the other 17 resting state neural variables in order of decreasing canonical correlation were: (1) DMN - supramarginal connectivity, (2) Right dlPFC seed - RBA46 connectivity, (3) Left dlPFC - medial frontal gyrus connectivity, (4) Left dlPDF - inferior temporal gyrus connectivity, (5) Right dlPFC - BA40 connectivity. The first two values were the most highly correlated with the 17 others. Stepwise logistic regression was used in order to select predictive models for depression and change in depressive symptoms. These models were constrained to include risk as a covariate. The optimal predictive models were selected using Akaike’s Information Criterion (AIC).
MDD outcome:
The model including all five variables significantly predicted MDD outcome (χ2 = 16.60, p = .011) with a 55% sensitivity (5/9) and 86% selectivity (19/22). When including the most representative two factors (DMN - supramarginal connectivity and dlPFC - BA46 connectivity) the model improved to significantly predict MDD outcome (χ2 = 13.73, p = .003) with a 67% sensitivity (6/9) and 82% selectivity (18/22).
Self-reported symptom change:
The model with the most representative 5 (F = 1.47, p = .23) and the most representative 2 (F = 0.34, p = .79) did not significantly predict change in self-reported depressive symptoms.
Parent-reported symptom change:
The model including all 5 connectivity variables (F = 1.82, p = .14) and the top 2 connectivity variables (F = 0.60, p = .62) did not significantly predict change in parent-reported internalizing symptoms.
3.2. Functional Activation: fMRI Face Task:
We conducted stepwise logistic regression predicting MDD outcomes, including risk as a covariate in the first step. In addition, we conducted stepwise linear regression models predicting change in self-reported depressive (CDI) and parent-reported internalizing (CBCL) symptoms. We ran separate models for activation in response to fearful and happy faces as we expected them to be associated with depression in the opposite direction based on previous findings (Chai et al., 2015). Four separate models were run with the 1) Fear v Neutral variables (AMY, PCC, AI), 2) Happy v Neutral variables (dACC, dlPFC, TP, BA40), 3) total voxels in response to fear versus neutral, and 4) the total voxels in response to happy versus neutral faces.
MDD outcome:
The Fear versus Neutral face variables (χ2 = 1.17, p = .76) and the Happy versus Neutral face (χ2 = 6.11, p = .19) variables were not significant in predicting MDD. The total voxels in response to fearful versus neutral faces (χ2 = 0.08, p = .78) and the total voxels in response to happy versus neutral faces (χ2 = 2.03, p = .15) also did not significantly predict MDD outcome.
Self-reported symptom change:
The Fear versus Neutral (F = .55, p = .70) and Happy versus Neutral (F = .96, p = .45) regression models did not significantly predict changes in self-reported depressive symptoms. However, the higher fearful versus neutral total voxels scores predicted greater reduction in depressive symptoms (β = −.45, t = 3.01, p = .005) and higher happy versus neutral total voxels significantly predicted greater reductions in depressive symptoms (β = −.35, t = 2.28, p = .028).1
Parent-reported symptom change:
The model based on the Fear versus Neutral did not (F = .65, p = .63) predict change in parent-reported symptoms. However, the model with Happy versus Neutral variables was significant (F = 2.73, p = .035). Within this model, Happy versus Neutral Temporal Pole predicted greater reductions in parent-reported internalizing symptoms (β = −.44, t = 2.22, p = .03) whereas BA 40 predicted greater increases in symptoms (β = .65, t = 2.23, p = .03). The total voxels in response to fearful versus neutral faces (F = 2.08, p = .14) and total voxels in response to happy versus neutral faces (F = 2.04, p = .14) did not significantly predict changes in parent reported depressive symptoms.
3.3. Structural Variables Methods and Results:
We conducted logistic regression predicting MDD outcomes and linear regression predicting symptom outcomes. These models were run individually due to the likely high levels of correlation between the Left and Right Amygdala Volume. Neither of the variables significantly predicted MDD outcome (χ2 = .20, p = .65; χ2 = .49, p = .48, respectively), self-reported symptom change (F = 3.31, p = .07; F = .71, p = .41, respectively), or parent-reported symptom change (F = 1.47, p = .23; F = 1.84, p = .18, respectively).
4. Discussion
Our findings confirm that resting state connectivity differences that differentiated children at high- and low-risk for depression at ages 8-14 predicted onset of MDD three to four years later. To our knowledge this is the first investigation that has found functional brain biomarkers associated with risk for depression that prospectively predict onset of depression during adolescence. This study extended our previous investigation that found neural correlates of risk for depression based on familial depression status (Chai et al., 2015; Chai et al., 2016) to indicate that premorbid differences may be biomarkers of risk later in life.
Increased intrinsic functional connectivity between DMN and supramarginal gyrus, a region in CCN, and decreased connectivity within the CCN (between left and right dlPFC) found to differentiate at-risk children from controls in our previous study (Chai et al., 2016) were also associated with the onset of MDD. These findings are consistent with prior work indicating the hyper-connectivity of the DMN and hypo-connectivity of the CCN being associated with depression (Kaiser et al., 2015). Similarly, decreased connectivity within the CCN regions has been shown to be correlated with depression in adults and adolescents (Ye et al., 2012; Clasen et al., 2014). The DMN has been shown to be associated with ruminative and self-referential thinking that is endemic to depression (Hamilton et al., 2015; Whitfield-Gabrielli et al., 2011). Studies that indicate the dlPFC is less efficient in depression (Hooley et al., 2005) have been associated with poorer cognitive control and emotion regulation (Gotlib & Hamilton, 2008). Together, the increased connectivity in regions associated with negative self-referential thinking and decreased connectivity in regions associated with the cognitive control of emotions indicate an imbalance in neural networks that place individuals at developmental risk for depression (Alexopoulos et al., 2012). This imbalance has been consistently associated with depression and risk for depression. The current findings now suggest that these are pre-morbid risk factors.
A prospective association between change in self-reported depressive symptoms and baseline functional activation to emotional versus neutral faces was also supported. This result suggests that children with greater response to emotional vs neutral stimuli at baseline were less likely to report an increase in depressive symptoms 3-4 years later. This result ran partially counter to previous reports finding that hyperactivation to fearful faces and hypoactivation to happy faces was associated with MDD (Miller et al., 2015). Current symptoms could represent residual symptoms in children who had had episodes in the intervening years or could represent sub-clinical increases in depressive symptomatology that could affect functioning in their own right or increase risk for future disorder. However, these findings remained significant when excluding participants who had an intervening depressive onset suggesting that this association may not be due to residual symptoms. One possible explanation is that whereas the functional connectivity differences we observed between the high- and low-risk children represented vulnerability factors for the development of depression, the differences in activation to emotional faces represented protective factors, as the children who showed greater activation to emotional faces of either valence at baseline were less likely to develop an increase in depressive symptoms.
A prospective association between change in parent-reported internalizing symptoms and baseline functional activation to happy versus neutral faces was supported. However, an interpretation of these findings is complex. Although the overall model was significant, within the model the specific regions of activation predicted both greater increases (Left BA40) and greater decreases (Right Temporal Pole) in symptoms. Although at-risk youth showed hypoactivation to happy versus neutral faces compared to control youth, it remains unclear whether differences in activation to happy faces represents a vulnerability or protective factor which may depend on the specific regions of interest. A complete understanding of these functional differences will require additional research with larger samples.
Contrary to expectations, many neural variables that differentiated children at high- and low-risk for depression at baseline were not found to predict onset of MDD in adolescence. Our previous investigation found that at-risk youth showed increased activation in the amygdala and several cortical regions to fearful compared to neutral faces and lower activation in several cortical to happy compared to neutral faces (Chai et al., 2015). However, brain activations during fearful or happy faces viewing did not predict the onset of depression, instead, they were associated with reduction in current symptom scores. Although functional activation differences have been frequently found to differentiate those with and without MDD (Sheline et al., 2001; Gotlib et al., 2005), the current findings did not support these differences as predictors of depression onset in adolescence. Further investigation in larger samples with longer follow-up time is needed to make firm conclusions about whether these brain functional and structural differences will confer risk for depression in individuals with and without familial risk for depression.
Our previous investigation found smaller amygdala volume in at-risk children compared to controls (Chai et al., 2015) which was consistent with previous studies in adults (Drevets, 2000; Hamilton et al., 2008). However, the current study failed to find structural differences in the amygdala as predictors of the onset of MDD or changes in symptoms. Findings of structural differences between those with and without MDD have been mixed, due to the suggestion the medication status may influence outcomes (Sacher et al., 2012). We limited analysis in the current study to our previously reported structural differences (Chai et al., 2015) which limited the examination of other possibly important structural abnormalities. Recent investigations have shown that cortical thickness may be another candidate that differentiates those at high familial risk from those at low risk (Foland-Ross et al., 2015a) that may be a predictor of depression onset (Foland-Ross et al., 2015b). Therefore, further studies are needed to determine whether structural abnormalities represent potential markers of risk in depression.
Strengths of our study include the prospective, longitudinal design that followed a well-characterized high- and low-risk sample from late childhood to adolescence, bridging a period of known increase in rates of onset of MDD, as well as state-of-the art neuroimaging, diagnostic assessment and data analytic methods. This design allowed for direct evidence that functional and structural brain differences observed during a euthymic state could confer risk for depression. Further, the study only examined a priori regions of interest that differentiated the at-risk youth from low-risk controls. While focusing on a priori regions interest provides a conservative estimate of regions that may indicate vulnerability, it may also be too stringent to find markers of risk. Although the expected proportion of youth developed MDD, the sample size of this study was modest, which limited our power to detect outcomes. We attempted to reduce the number of models tested and variables included in the model to account for the limited sample, however, these findings should be considered preliminary given the number of participants followed. In addition, our follow-up did not extend over the full period of risk for onset of MDD, so some youths might still develop this disorder. However, even with the modest sample size and limited follow-up period, we did find some significant predictors of MDD and symptomatology. These promising results suggest that further study, in larger prospective studies over longer intervals is warranted.
Our findings provide preliminary evidence that altered functional connectivity in unaffected high-risk children compared to low-risk children represent a neurobiological risk factor for major depression. A growing body of research suggests that psychosocial interventions to prevent onset of depression in youths at risk show promise (Merry et al., 2012; Hetrick et al.,2016). If supported in future studies, our findings could inform targeted interventions to prevent the onset of this chronic and debilitating disorder.
Highlights.
Research highlights neural correlates of MDD, however it is unclear whether these correlates reflect the state of depression or a pre-existing risk factor.
We found that resting-state functional connectivity abnormalities in the default mode and cognitive control network that differentiated high-risk from low-risk youth predicted the onset of MDD during adolescence.
Increased functional activation to both happy and fearful faces was also associated with greater decreases in self-reported symptoms of depression.
This preliminary evidence could be used to identify youth at-risk for depression and inform future early intervention strategies to reduce the development of depression.
Acknowledgments:
We thank Lauren Jacobs, Flavia Vaz De Souza, Gretchen Reynolds, Daniel O’Young, Jiahe Zhangm, Elana Kagen, and Tara Kenworthy for their help with data collection and management. This research was carried out in the Child Cognitive Behavioral Therapy Program at the Massachusetts General Hospital and the Athinoula A. Martinos Imaging Center at the McGovern Institute for Brain Research at the Massachusetts Institute of Technology. Funding: The follow-up study was supported by a Harvard University Catalyst Award, which draws its funding from the National Institutes of Health (NIH 5UL1TR001102-03). The baseline study was carried out in the MGH Clinical and Research Program in Pediatric Psychopharmacology and was supported by the Tommy Fuss Fund, the Poitras Center for Affective Disorders Research, and the MGH Pediatric Psychopharmacology Council Fund. The funding sources had no involvement in study design; in the collection, analysis and interpretation of data; in the writing of the report; or in the decision to submit the article for publication.
Footnotes
Publisher's Disclaimer: This is a PDF file of an unedited manuscript that has been accepted for publication. As a service to our customers we are providing this early version of the manuscript. The manuscript will undergo copyediting, typesetting, and review of the resulting proof before it is published in its final citable form. Please note that during the production process errors may be discovered which could affect the content, and all legal disclaimers that apply to the journal pertain.
Publisher's Disclaimer: Disclaimer: This article was prepared while Benjamin G. Shapero was employed at the Massachusetts General Hospital / Harvard Medical School. The opinions expressed in this article are the author’s own and do not reflect the view of the National Institutes of Health, the Department of Health and Human Services, or the United States government.
Sensitivity analysis was conducted to exclude participants who had the onset of MDD in the interval to account for the possibility of residual symptoms of a depression episode. Both outcomes remained significant when excluding these participants (happy total voxels: t = 2.25, p = .033; fearful total voxels: t = 2.81, p = .009).
References
- Achenbach TM Rescorla LA 2001. Manual for ASEBA School-Age Forms & Profile. Burlington, VT: University of Vermont, Research Center for Children, Youth, & Families. [Google Scholar]
- Alexopoulos GS, Hoptman MJ, Kanellopoulos D, Murphy CF, Lim KO, Gunning FM, 2012. Functional connectivity in the cognitive control network and the default mode network in late-life depression. J Affect Disorders, 139, 56–65. [DOI] [PMC free article] [PubMed] [Google Scholar]
- Cadima JF, Jolliffe IT, 2001. Variable selection and the interpretation of principal subspaces. J Agr Biol Envir St, 6, 62. [Google Scholar]
- Cerdeira JO, Silva PD, Cadima J, Minhoto M, 2015. Subselect: Selecting variable subsets R package version 0.12–5. https://CRAN.R-project.org/package=subselect [Google Scholar]
- Chai XJ, Castañón AN, Öngür D, Whitfield-Gabrieli S, 2012. Anticorrelations in resting state networks without global signal regression. Neuroimage, 59, 1420–1428. [DOI] [PMC free article] [PubMed] [Google Scholar]
- Chai XJ, Hirshfeld-Becker D, Biederman J, Uchida M, Doehrmann O, Leonard JA, Salvatore J, Kenworthy T, Brown A, Kagan E, de lose Angeles C, Gabrieli JDE, Whitefield-Gabrieli S, 2016. Altered intrinsic functional brain architecture in children at familial risk of major depression. Biol Psychiat, 80, 849–858 [DOI] [PMC free article] [PubMed] [Google Scholar]
- Chai XJ, Hirshfeld-Becker D, Biederman J, Uchida M, Doehrmann O, Leanoard JA, Salvatore J, Kenworthy T, Brown A, Kagan E, de lose Angeles C, Whitefield-Gabrieli S, Gabrieli JDE, 2015. Functional and structural brain correlates of risk for major depression in children with familial depression. NeuroImage Clin, 8, 398–407. [DOI] [PMC free article] [PubMed] [Google Scholar]
- Clasen PC, Beevers CG, Mumford JA, Schnyer DM, 2014. Cognitive control network connectivity in adolescent women with and without a parental history of depression. Dev Cogn Neuro, 7, 13–22. [DOI] [PMC free article] [PubMed] [Google Scholar]
- Cole MW and Schneider W, 2007. The cognitive control network: integrated cortical regions with dissociable functions. Neuroimage, 37(1), 343–360. [DOI] [PubMed] [Google Scholar]
- Connolly CG, Wu J, Ho TC, Hoeft F, Wolkowitz O, Eisendrath S, Frank G, Hendren R, Max JE, Paulus MP, Tapert SF, Banergee D, Simmons AN, Yang TT, 2013. Resting-state functional connectivity of subgenual anterior cingulate cortex in depressed adolescents. Biol Psychiat, 74, 898–907. [DOI] [PMC free article] [PubMed] [Google Scholar]
- Dale AM, Fischl B, Sereno MI, 1999. Cortical surface-based analysis: I. Segmentation and surface reconstruction. Neuroimage, 9, 179–194. [DOI] [PubMed] [Google Scholar]
- Diener C, Kuehner C, Brusniak W, Ubl B, Wessa M, Flor H, 2012. A meta-analysis of neurofunctional imaging studies of emotion and cognition in major depression. Neuroimage, 61, 677–685. [DOI] [PubMed] [Google Scholar]
- Drevets WC, Price JL and Furey ML, 2008. Brain structural and functional abnormalities in mood disorders: implications for neurocircuitry models of depression. Brain structure and function, 213(1-2), 93–118. [DOI] [PMC free article] [PubMed] [Google Scholar]
- Drevets WC, Price JL, Simpson JR Jr, Todd RD, Reich T, Vannier M, Raichle ME, 1997. Subgenual prefrontal cortex abnormalities in mood disorders. Nature, 386, 824. [DOI] [PubMed] [Google Scholar]
- Druss BG, Rosenheck RA, Sledge WH, 2000. Health and disability costs of depressive illness in a major US corporation. Am J Psychiat, 157, 1274–1278. [DOI] [PubMed] [Google Scholar]
- Dutta A, McKie S, Deakin JW, 2014. Resting state networks in major depressive disorder. Psychiat Res-Neuroim, 224, 139–151. [DOI] [PubMed] [Google Scholar]
- Fair DA, Cohen AL, Power JD, Dosenbach NU, Church JA, Miezin FM, … Petersen SE, 2009. Functional brain networks develop from a “local to distributed” organization. PLoS Comput Biol, 5, e1000381. [DOI] [PMC free article] [PubMed] [Google Scholar]
- Fales CL, Barch DM, Rundle MM, Mintun MA, Snyder AZ, Cohen JD, Mathews J, Sheline YI, 2008. Altered emotional interference processing in affective and cognitive-control brain circuitry in major depression. Biol Psychiat, 63, 377–384. [DOI] [PMC free article] [PubMed] [Google Scholar]
- Ferrari AJ, Charlson FJ, Norman RE, Patten SB, Freedman G, Murray CJ, Vos T, Whiteford HA, 2013. Burden of depressive disorders by country, sex, age, and year: findings from the global burden of disease study 2010. PLoS Med, 10, e1001547. [DOI] [PMC free article] [PubMed] [Google Scholar]
- First MB, Spitzer RL, Gibbon M, Williams JBW 1995. Structured Clinical Interview for DSM-IV Axis I Disorders (Clinician Version), New York State Psychiatric Institute Biometrics Department, New York. [Google Scholar]
- Foland-Ross LC, Gilbert BL, Joormann J, Gotlib IH, 2015. Neural markers of familial risk for depression: An investigation of cortical thickness abnormalities in healthy adolescent daughters of mothers with recurrent depression. J Abnorm Psychol, 124, 476. [DOI] [PMC free article] [PubMed] [Google Scholar]
- Fox MD, Snyder AZ, Vincent JL, Corbetta M, Van Essen DC, Raichle ME, 2005. The human brain is intrinsically organized into dynamic, anticorrelated functional networks. P Natl Acad Sci USA, 102, 9673–9678. [DOI] [PMC free article] [PubMed] [Google Scholar]
- Frodl T, Meisenzahl EM, Zetzsche T, Born C, Jäger M, Groll C, Bottlender R, Lessinger G, Möller HJ, 2003. Larger amygdala volumes in first depressive episode as compared to recurrent major depression and healthy control subjects. Biol Psychiat, 53, 338–344. [DOI] [PubMed] [Google Scholar]
- Gotlib IH, Hamilton JP, 2008. Neuroimaging and depression: Current status and unresolved issues. Curr Dir Psychol Sci, 17, 159–163. [Google Scholar]
- Gotlib IH, Sivers H, Gabrieli JD, Whitfield-Gabrieli S, Goldin P, Minor KL, Canli T, 2005. Subgenual anterior cingulate activation to valenced emotional stimuli in major depression. Neuroreport, 16, 1731–1734. [DOI] [PubMed] [Google Scholar]
- Greenberg PE, Fournier AA, Sisitsky T, Pike CT, Kessler RC, 2015. The economic burden of adults with major depressive disorder in the United States, 2005 and 2010. J Clin Psychiat, 76, 155–162. [DOI] [PubMed] [Google Scholar]
- Greicius MD, Flores BH, Menon V, Glover GH, Solvason HB, Kenna H, Reiss AL, Schatzberg AF, 2007. Resting-state functional connectivity in major depression: abnormally increased contributions from subgenual cingulate cortex and thalamus. Biol Psychiat, 62, 429–437. [DOI] [PMC free article] [PubMed] [Google Scholar]
- Greicius MD, Krasnow B, Reiss AL and Menon V, 2003. Functional connectivity in the resting brain: a network analysis of the default mode hypothesis. Proceedings of the National Academy of Sciences, 100(1), pp.253–258. [DOI] [PMC free article] [PubMed] [Google Scholar]
- Groenewold NA, Opmeer EM, de Jonge P, Aleman A, Costafreda SG, 2013. Emotional valence modulates brain functional abnormalities in depression: evidence from a meta-analysis of fMRI studies. Neurosc Biobehav R, 37, 152–163. [DOI] [PubMed] [Google Scholar]
- Hamilton JP, Etkin A, Furman DJ, Lemus MG, Johnson RF, Gotlib IH, 2012. Functional neuroimaging of major depressive disorder: a meta-analysis and new integration of baseline activation and neural response data. Am J Psychiat, 169, 693–703. [DOI] [PubMed] [Google Scholar]
- Hamilton JP, Siemer M, Gotlib IH, 2008. Amygdala volume in major depressive disorder: a meta-analysis of magnetic resonance imaging studies. Mol Psychiatr, 13, 993. [DOI] [PMC free article] [PubMed] [Google Scholar]
- Hamilton JP, Farmer M, FogelmN P, Gotlib IH, 2015. Depressive rumination, the default mode network, and the dark matter of clinical neuroscience. Biol Psychiat, 78, 224–230. [DOI] [PMC free article] [PubMed] [Google Scholar]
- Hastings RS, Parsey RV, Oquendo MA, Arango V, Mann JJ, 2004. Volumetric analysis of the prefrontal cortex, amygdala, and hippocampus in major depression. Neuropsychopharmacol, 29, 952. [DOI] [PubMed] [Google Scholar]
- Hetrick SE, Cox GR, Witt KG, Bir JJ, Merry SN, 2016. Cognitive behavioural therapy (CBT), third-wave CBT and interpersonal therapy (IPT) based interventions for preventing depression in children and adolescents. The Cochrane Library. DOI: 10.1002/14651858.CD003380.pub4. [DOI] [PMC free article] [PubMed] [Google Scholar]
- Ho TC, Connolly CG, Blom EH, LeWinn KZ, Strigo IA, Paulus MP, Frank G, Max JE, Wu J, Chan M, Tapert SF, Simons AN, Yang TT 2015. Emotion-dependent functional connectivity of the default mode network in adolescent depression. Biol Psychiat, 78, 635–646. [DOI] [PMC free article] [PubMed] [Google Scholar]
- Hooley JM, Gruber SA, Scott LA, Hiller JB, Yurgelun-Todd DA, 2005. Activation in dorsolateral prefrontal cortex in response to maternal criticism and praise in recovered depressed and healthy control participants. Biol Psychiat, 57, 809–812. [DOI] [PubMed] [Google Scholar]
- Hulvershorn LA, Cullen K, Anand A, 2011. Toward dysfunctional connectivity: a review of neuroimaging findings in pediatric major depressive disorder. Brain Imaging Behav, 5, 307–328. [DOI] [PMC free article] [PubMed] [Google Scholar]
- Kaiser RH, Andrews-Hanna JR, Wager TD, Pizzagalli DA, 2015. Large-scale network dysfunction in major depressive disorder: a meta-analysis of resting-state functional connectivity. JAMA Psychiat, 72, 603–611. [DOI] [PMC free article] [PubMed] [Google Scholar]
- Kempton MJ, Salvador Z, Munafò MR, Geddes JR, Simmons A, Frangou S, Williams SC, 2011. Structural neuroimaging studies in major depressive disorder: meta-analysis and comparison with bipolar disorder. Arch Gen Psychiat, 68, 675–690. [DOI] [PubMed] [Google Scholar]
- Kessler RC, Berglund P, Demler O, Jin R, Merikangas KR, Walters EE, 2005. Lifetime prevalence and age-of-onset distributions of DSM-IV disorders in the National Comorbidity Survey Replication. Arch Gen Psychiat, 62, 593–602. [DOI] [PubMed] [Google Scholar]
- Kovacs M, 1985. The children’s depression inventory (CDI). Psychopharmacol Bull, 21, 995–998. [PubMed] [Google Scholar]
- Kraemer HC, Kazdin AE, Offord DR, Kessler RC, Jensen PS, Kupfer DJ, 1997. Coming to terms with the terms of risk. Arch Gen Psychiat, 54, 337–343. [DOI] [PubMed] [Google Scholar]
- Luking KR, Repovs G, Belden AC, Gaffrey MS, Botteron KN, Luby JL, Barch DM, 2011. Functional connectivity of the amygdala in early-childhood-onset depression. J Am Acad of Child Psy, 50, 1027–1041. [DOI] [PMC free article] [PubMed] [Google Scholar]
- MacMaster FP, Mirza Y, Szeszko PR, Kmiecik LE, Easter PC, Taormina SP, Lynch M, Rose M, Moore GJ, Rosenberg DR, 2008. Amygdala and hippocampal volumes in familial early onset major depressive disorder. Biol Psychiat, 63, 385–390. [DOI] [PMC free article] [PubMed] [Google Scholar]
- Maldjian JA, Laurienti PJ, Kraft RA, Burdette JH, 2003. An automated method for neuroanatomic and cytoarchitectonic atlas-based interrogation of fMRI data sets. Neuroimage, 19, 1233–1239. [DOI] [PubMed] [Google Scholar]
- Menon V, 2011. Large-scale brain networks and psychopathology: a unifying triple network model. Trends in cognitive sciences, 15(10), 483–506. [DOI] [PubMed] [Google Scholar]
- Merry SN, Hetrick SE, Cox GR, Brudevold-Iversen T, Bir JJ, McDowell H, 2012. Cochrane review: Psychological and educational interventions for preventing depression in children and adolescents. evidence-based child health. A Cochrane Rev., 7, 1409–1685. doi: 10.1002/ebch.1867 [DOI] [PubMed] [Google Scholar]
- Miller CH, Hamilton JP, Sacchet MD, Gotlib IH, 2015. Meta-analysis of functional neuroimaging of major depressive disorder in youth. JAMA Psychiat, 72, 1045–1053. [DOI] [PubMed] [Google Scholar]
- Mulders PC, van Eijndhoven PF, Schene AH, Beckmann CF, Tendolkar I, 2015. Resting-state functional connectivity in major depressive disorder: A review. Neurosci Biobehav R, 56, 330–344. [DOI] [PubMed] [Google Scholar]
- Orvaschel H, 1994. Schedule for Affective Disorder and Schizophenia for School-Age Children-Epidemiologic version. Fort Lauderdale, FL: Nova Southeastern University, Center for Psychological Studies. [Google Scholar]
- Posner J, Cha J, Wang Z, Talati A, Warner V, Gerber A, Peterson BS and Weissman M, 2016. Increased default mode network connectivity in individuals at high familial risk for depression. Neuropsychopharmacology, 41(7), 1759–1767 [DOI] [PMC free article] [PubMed] [Google Scholar]
- R Core Team, 2016. R: A language and environment for statistical computing. R Foundation for Statistical Computing, Vienna, Austria: URL https://www.R-project.org/. [Google Scholar]
- Sacher J, Neumann J, Fünfstück T, Soliman A, Villringer A, Schroeter ML, 2012. Mapping the depressed brain: a meta-analysis of structural and functional alterations in major depressive disorder. J Affect Disorders, 140, 142–148. [DOI] [PubMed] [Google Scholar]
- Seeley WW, Menon V, Schatzberg AF, Keller J, Glover GH, Kenna H, Reiss AL and Greicius MD, 2007. Dissociable intrinsic connectivity networks for salience processing and executive control. Journal of Neuroscience, 27(9), 2349–2356. [DOI] [PMC free article] [PubMed] [Google Scholar]
- Sheline YI, Price JL, Yan Z, Mintun MA, 2010. Resting-state functional MRI in depression unmasks increased connectivity between networks via the dorsal nexus. P Natl Acad Sci USA, 107, 11020–11025. [DOI] [PMC free article] [PubMed] [Google Scholar]
- Sheline YI, Barch DM, Donnelly JM, Ollinger JM, Snyder AZ, Mintun MA, 2001. Increased amygdala response to masked emotional faces in depressed subjects resolves with antidepressant treatment: an fMRI study. Biol Psychiat, 50, 651–658. [DOI] [PubMed] [Google Scholar]
- Sheline YI, Barch DM, Price JL, Rundle MM, Vaishnavi SN, Snyder AZ, Mintun MA, Wang S, Coalson RS, Raichle ME, 2009. The default mode network and self-referential processes in depression. P Natl Acad Sci USA, 106, 1942–1947. [DOI] [PMC free article] [PubMed] [Google Scholar]
- Silva APD, 2001. Efficient variable screening for multivariate analysis. J Multivariate Anal, 76, 35–62. [Google Scholar]
- Silva APD, 2002. Discarding variables in a principal component analysis: algorithms for all-subsets comparisons. Computational Stat, 17, 251–271. [Google Scholar]
- Whitfield-Gabrieli S, Nieto-Castanon A, 2012. Conn: a functional connectivity toolbox for correlated and anticorrelated brain networks. Brain Connectivity, 2, 125–141. [DOI] [PubMed] [Google Scholar]
- Whitfield-Gabrieli S, Moran JM, Nieto-Castañón A, Triantafyllou C, Saxe R, Gabrieli JD, 2011. Associations and dissociations between default and self-reference networks in the human brain. Neuroimage, 55, 225–232. [DOI] [PubMed] [Google Scholar]
- Williamson DE, Birmaher B, Axelson DA, Ryan ND, Dahl RE, 2004. First episode of depression in children at low and high familial risk for depression. J Am Acad Child Psy, 43, 291–297. [DOI] [PubMed] [Google Scholar]
- Ye T, Peng J, Nie B, Gao J, Liu J, Li Y, Wang G, Ma X, Li K, Shan B, 2012. Altered functional connectivity of the dorsolateral prefrontal cortex in first-episode patients with major depressive disorder. Eur J Radiol, 81, 4035–4040. [DOI] [PubMed] [Google Scholar]
- Zhong X, Pu W, Yao S, 2016. Functional alterations of fronto-limbic circuit and default mode network systems in first-episode, drug-naive patients with major depressive disorder: A meta-analysis of resting-state fMRI data. J Affect Disorders, 206, 280–286. [DOI] [PubMed] [Google Scholar]
- Zhu X, Wang X, Xiao J, Liao J, Zhong M, Wang W and Yao S, 2012. Evidence of a dissociation pattern in resting-state default mode network connectivity in first-episode, treatment-naive major depression patients. Biological Psychiatry, 71(7), pp.611–617. [DOI] [PubMed] [Google Scholar]