

Abstract
Mental calculation is a complex mental procedure involving a frontoparietal network of brain regions. Functional MRI (fMRI) studies have revealed interesting characteristics of these regions, but the precise function of some areas remains elusive. In the present study, we used electrocorticographic (ECoG) recordings to chronometrically assess the neuronal processes during mental arithmetic. A calculation task was performed during presurgical 3T fMRI scanning and subsequent ECoG monitoring. Mental calculation induced an increase in fMRI blood oxygen level dependent signal in prefrontal, parietal and lower temporo‐occipital regions. The group‐fMRI result was subsequently used to cluster the implanted electrodes into anatomically defined regions of interest (ROIs). We observed remarkable differences in high frequency power profiles between ROIs, some of which were closely associated with stimulus presentation and others with the response. Upon stimulus presentation, occipital areas were the first to respond, followed by parietal and frontal areas, and finally by motor areas. Notably, we demonstrate that the fMRI activation in the middle frontal gyrus/precentral gyrus is associated with two subfunctions during mental calculation. This finding reveals the significance of the temporal dynamics of neural ensembles within regions with an apparent uniform function. In conclusion, our results shed more light on the spatiotemporal aspects of brain activation during a mental calculation task, and demonstrate that the use of fMRI data to cluster ECoG electrodes is a useful approach for ECoG group analysis. Hum Brain Mapp 35:5903–5920, 2014. © 2014 Wiley Periodicals, Inc.
Keywords: arithmetic, chronometry, fMRI, human, ECoG, intracranial, dynamics, high frequency band
INTRODUCTION
Mathematical competence is an essential cognitive ability that is often used in both daily and professional life. It may be considered a central aspect of human intelligence [Neisser et al., 1996] and is part of important intelligence scales, such as the Wechsler Adult Intelligence Scale [Wisdom et al., 2012]. Moreover, numerical ability is an important predictor for later academic achievement [see Butterworth, 2010]. Not surprisingly, mathematics has received a great amount of attention in neuropsychological, developmental, and imaging studies. Important insights in the brain regions involved in mental calculation have been largely based on neuropsychological data, studying the effects of brain lesions in patients, and on experimental imaging data, mainly from functional magnetic resonance imaging (fMRI) studies [Arsalidou and Taylor, 2010]. Although studies differ in their approach, and therefore in their conclusions, the general consensus is that mental calculation involves a frontoparietal network of brain regions, most of which are involved in the performance of other tasks as well [Arsalidou and Taylor, 2010; Gruber et al., 2001]. Especially, the frontally activated areas are assumed to play a more general or supportive role, for instance in working memory related processes [e.g., Dehaene et al., 2004; Gruber et al., 2001; Kroger et al. 2008; Zago et al., 2001], but their exact function during mental arithmetic is still unclear and has received relatively little attention compared to parietal regions.
The parietal cortex is thought to contain neuronal populations that are relatively specific for number‐related processing and mental arithmetic [Cohen Kadosh and Walsh, 2009; Dehaene and Cohen, 1995; Dehaene et al., 2004; Harvey et al., 2013]. In the updated triple‐code model for number processing, it has been proposed that the parietal cortex contains three subsystems with a different role in mental calculation [Dehaene et al., 2003]. A language‐independent representation of numerical quantity or “mental number line” was proposed to be situated in the horizontal part of the intraparietal sulcus (hIPS). Superior parietal regions were suggested to be involved in spatial orienting along this mental number line, whereas verbal number processing, that is, the retrieval of verbally stored arithmetic facts, was attributed to the angular gyrus [Dehaene et al., 2003]. Since then, many studies have specifically addressed the function of these parietal areas in mental arithmetic, some of them validating the model, others challenging (parts of) it.
FMRI reports on mental calculation have focused on localizing areas that show an increase or decrease in the blood oxygen level dependent (BOLD) fMRI signal with for example increasing difficulty, different arithmetic operations, or various levels of mathematical competence [e.g., Fehr et al., 2007; Ischebeck et al., 2009; Menon et al., 2000). If carefully designed, fMRI studies can indeed provide a relatively detailed idea about the function(s) of certain regions within the mental calculation process [e.g., Simon et al., 2002]. However, due to the slow temporal resolution of fMRI, only limited knowledge can be obtained about the timing of activation and deactivation of the involved areas during the full cascade of stimulus perception to actual computation and response. For improving our understanding of the specific function of each involved area and to obtain a better picture of the neuronal processes involved in mental calculation, this temporal information constitutes a significant contribution. EEG and event related potential (ERP) recordings provide data with high temporal resolution but have a limited spatial resolution and limited sensitivity to activity in smaller regions [Ebersole and Ebersole, 2010; Tao et al., 2007]. Results from EEG and ERP studies can therefore only be attributed to the response of relatively large regions, rather than to the specific gyri that are thought to play a role in mental calculation. Over the last few years, intracranial EEG or electrocorticography (ECoG) has received an increasing amount of attention [Crone et al., 2006; Jacobs et al., 2010; Ritaccio et al., 2011]. For ECoG, brain signals are recorded using grids and/or strips of electrodes that are placed on the cortical surface, providing a unique combination of high spatial and temporal resolution. Originally used as a clinical tool, mainly for epilepsy monitoring, ECoG has now been recognized to be of high scientific value as well and is being used to answer fundamental questions about brain functions, and in the development of brain‐computer interfaces [Jacobs and Kahana, 2010; Ritaccio et al., 2011].
In the current study, we used ECoG to chronometrically assess the neuronal processes involved in mental calculation. We performed a group analysis of temporal spectral power changes of the ECoG signal during a mental calculation task, in important nodes of the mental calculation network. Notably, performing an ECoG group analysis is inherently challenging. As electrode placement is determined by the suspected epileptic focus of each individual patient, only a limited portion of the cortex is covered with electrodes, and the location of the covered area varies between subjects. Moreover, standard clinical grids have an interelectrode distance of 1 cm, providing rather sparse sampling of the cortical surface. To address these factors, we clustered electrodes of different subjects into anatomically defined subsets using the results of an fMRI group analysis of the mental calculation task. The fMRI activation pattern was split into regions of interest (ROIs) and we assessed for each electrode whether it was located within one of the ROIs, using the normalized electrode positions (obtained after coregistering a CT‐scan with electrode positions with the patients' MRI scan). The underlying idea is that the fMRI provides spatial information, while ECoG provides data on the temporal characteristics of the neuronal processes within each ROI. We focused on the high frequency band of the ECoG signal, which has been shown to represent local neuronal activity most accurately (as compared to all lower frequency bands), and correlates highly with location and amplitude of the BOLD response [Hermes et al., 2012a; Lachaux et al., 2007; Siero et al., 2013].
To solve a mathematical problem it is necessary to visually process the given problem and to perform a number of calculation steps before coming to a decision and selecting the appropriate response. One therefore expects a sequential activation of the brain regions involved in these subfunctions, with some of the neuronal processes being connected to stimulus onset, and others closely associated with the response. To obtain a reliable estimate of the spectral power changes at the onset and the end of the computation period, we computed stimulus‐locked and response‐locked high frequency power over time of all electrodes. The variation in response time between trials and between subjects will lead to a higher reliability of the average response traces close to the stimulus and the response than a few seconds away from these anchor points (e.g., immediately after stimulus onset, all subjects will be computing, whereas a few seconds later, some, but not all, subjects may have responded with a button press). Therefore, in the final analysis we only considered a time window of a few seconds around stimulus onset and response.
MATERIALS AND METHODS
Subjects and Data Acquisition
Subjects were patients with medically refractory epilepsy who were scheduled for temporary subdural electrode implantation, to determine the location of the seizure focus and to investigate the possibility of surgical removal of the epileptogenic tissue. Most of the patients had left‐hemispheric grid coverage; therefore we focus on the left hemisphere in the current article. fMRI and ECoG was recorded from partly overlapping groups of epilepsy patients: 10 patients contributed to the fMRI dataset (age 34 ± 4, 6 male, 4 female, three left‐handed, seven right‐handed) and 21 patients (age 29 ± 2, 14 male, 7 female, 2 left‐handed, 18 right‐handed, 1 ambidexter) contributed to the ECoG dataset. Seven patients contributed to both datasets (see Table 1 for more details). The study was approved by the Medical Ethical Committee of the Utrecht University Medical Center and informed consent was given in accordance with the Declaration of Helsinki, 2008.
Table 1.
Subject characteristics
| Subject # | Sex | Age | Age/seizure onset | Handed‐ness | ECoG data? | # els in analysis | fMRI data? | Location MRI anomalies | Resected area |
|---|---|---|---|---|---|---|---|---|---|
| 1 | F | 25 | 21 | L | X | 80 | X | L parietotemporal | L parietotemporal |
| 2 | F | 33 | 12 | R | X | 104 | X | L parietal operculum | L postcentral/parietal operculum |
| 3 | M | 26 | 4 | R | X | 120 | X | L mesial temporal | L temporal and hippocampus |
| 4 | M | 42 | 13 | R | X | 88 | X | L mesial temporal | L temporal and hippocampus |
| 5 | M | 34 | 9 | L | X | 120 | X | No anomalies | No resection |
| 6 | F | 19 | 6 | R | X | 80 | X | No anomalies | L frontal |
| 7 | M | 49 | 4 | R | X | 120 | X | L frontal | L frontal |
| 8 | M | 20 | 8 | Ambidexter | X | 8 | – | No anomalies | No resection |
| 9 | F | 30 | 15 | R | X | 112 | – | No anomalies | L temporal |
| 10 | M | 44 | 32 | R | X | 104 | – | No anomalies | L frontal and hippocampus |
| 11 | F | 32 | 10 | R | X | 24 | – | R frontomedian | R frontal |
| 12 | M | 36 | 24 | R | X | 120 | – | L mesial temporal | L temporal and hippocampus |
| 13 | M | 18 | 6 | R | X | 104 | – | L frontal | L frontal |
| 14 | F | 23 | 8 | R | X | 96 | – | L temporal (mediobasal part) | L temporal and hippocampus |
| 15 | M | 28 | 12 | R | X | 120 | – | L frontal | L frontal |
| 16 | F | 15 | 3 | R | X | 96 | – | L parietal | L parietal |
| 17 | M | 29 | 3 | R | X | 72 | – | L parietal (previous resection), basal ganglia, L frontal | L parietal |
| 18 | M | 28 | 15 | R | X | 120 | – | L frontal | L frontal |
| 19 | M | 21 | 14 | R | X | 96 | – | L frontal (previous resection), L parietal | L temporoparietal |
| 20 | M | 26 | 20 | R | X | 96 | – | L frontal | L frontal |
| 21 | M | 19 | 15 | R | X | 112 | – | No anomalies | L temporal and hippocampus |
| 22 | F | 36 | 7 | R | – | – | X | R occipitotemporal | R occipitotemporal |
| 23 | M | 49 | 24 | L | – | – | X | L temporal | No resection |
| 24 | M | 17 | 8 | R | – | – | X | L occipitoparietal (previous resection) | No resection |
Several weeks before implantation surgery, an fMRI scan was obtained from the patients. Functional MRI images were made while patients performed a mental calculation task (below), using a Philips 3T MRI scanner. We used 3D PRESTO, a technique that eliminates signal from blood vessels larger than 1 mm, thereby improving localization accuracy [Neggers et al., 2008; Rutten et al., 1999; Van Gelderen et al., 2012]. Anatomical MRI scans were available for all patients.
During grid implantation surgery, grid and strip electrodes were implanted subdurally (2.3 mm exposed diameter, inter electrode distance 1 cm, between 80 and 136 contact points, Ad‐Tech, Racine, WI). After implantation, clinical ECoG was recorded continuously using a 128‐channel Micromed system (Treviso, Italy, bit depth 22 bits, band pass filter 0.15–134.4 Hz) at a sampling frequency of 512 Hz. During the ECoG recording period, patients performed the same mental calculation task (below) as during fMRI scanning.
Mental Calculation Task
The mental calculation task consisted of 45 (fMRI) or 40 (ECoG) equations of three levels of difficulty with a given answer. Patients were instructed to mentally solve the equations and to indicate whether the answer on the screen was correct or incorrect by pressing one of two buttons. Subjects were instructed to use the right hand for the button press. In three subjects, the left hand was used inadvertently. Three levels of difficulty (task levels) were tested: Easy (e.g., 5 + 2 = 7), Medium (e.g., 43 + 38 = 81) and Difficult (e.g., 92 − 46 − 28 = 18). All equations consisted of additions and/or subtractions. Note that the easy and medium expressions consisted of two terms, whereas the difficult expressions had three terms. Furthermore, the easy expressions only consisted of numbers below 10, whereas the medium and difficult expressions contained at least one (medium) or two (difficult) terms between 10 and 99. Each trial started with the presentation of the equation, after which the participant had 10 s to compute and respond. When the button was pressed, feedback was given for 0.5 s (a green ampersand for correct, a red cross for incorrect), followed by a fixation cross, which lasted until the total trial duration (20 s during fMRI scanning, 13.5 s during ECoG recording) had passed. To maximize power, all presented equations were included in the analysis, independent of a correct or incorrect answer, since it can be assumed that, even in cases where the answer was incorrect, patients have performed the mental act of calculation. This assumption is supported by the fact that the majority of equations was answered correctly (70% of all equations).
fMRI Analysis
Functional scans were realigned, coregistered with the anatomical scan using a reference scan, normalized to Montreal Neurological Institute (MNI) space and smoothed with a Gaussian kernel (8 mm full width at half maximum) for group analysis. Statistical analysis at the individual subject level was performed using a general linear model (GLM, SPM5 software, http://www.fil.ion.ucl.ac.uk/spm), in which two factors were included: one for the button press and one for the mental calculation period. For each subject, three contrast maps were generated: BOLD increase during mental calculation, BOLD decrease during mental calculation, and BOLD increase during the button press. Group analysis was performed by entering the single subject contrast maps into a second level analysis (one‐sample t‐test). The resulting fMRI group activation patterns were split into clusters, by creating a mask for each group of voxels with a t‐value larger than a certain threshold (t ≥ 5.5 for BOLD increase during mental calculation, t ≤ −4 for BOLD decrease during mental calculation, t ≥ 3.5 for BOLD increase during button press). These thresholds were chosen based on visual inspection of the activation pattern, and aimed at defining the mental‐calculation‐related brain areas as completely as possible, without having too much overlap between areas that were close to each other. Note that strict statistical evaluation is not relevant for the present purpose of dividing the cortex into regions associated with calculation for subsequent assignment of ECoG electrodes. Clusters that clearly consisted of two or more subclusters (e.g., two large groups of voxels connected by only one voxel), were split using the AAL template masks of SPM5. Only gray matter clusters on the left hemisphere larger than five voxels were labeled as an ROI for further analysis (see Channel grouping).
ECoG Analysis
The signals of all electrodes were visually inspected, and channels with obvious artefacts due to a broken connection (either no power or excessive line noise in the raw signal) were excluded from further analysis. The remaining channels were rereferenced to a common average reference consisting of all implanted channels within each subject. Epoching of the data was performed both in a stimulus‐locked (traces synchronized relative to stimulus onset, epochs from −3 to 10 s relative to stimulus onset) and a response‐locked (traces synchronized relative to button press, epochs from −13 to 3.5 s relative to button press) manner. A time frequency representation was computed using wavelet decomposition [Morlet wavelet, seven cycles, as implemented in the open source Matlab toolbox Fieldtrip, Oostenveld et al., 2011] for all frequencies between 1 and 95 Hz (steps of 1 Hz), and the data was expressed as percent signal change with respect to the 3 s baseline period preceding every stimulus. The mean power over time was computed for the 65–95 Hz frequency band (line noise is at 50 Hz) and was averaged over trials. To identify channels showing significant task‐related changes in power, we computed a paired t‐test for the mean power during the baseline (the 3 s before stimulus onset) and the calculation period (stimulus until response) for all three conditions (easy, medium, and difficult). Channels showing significant task related changes in power (positive or negative) in one of these categories (P < 0.05, Bonferroni corrected for the number of recorded channels, stimulus‐locked traces) were included in the further analysis (see Channel Grouping).
Channel Grouping
To be able to perform a group analysis of the ECoG data, the precise position of the ECoG electrodes was determined using an anatomical MRI scan that was made prior to grid implantation and a CT‐scan that was made after electrode implantation using the method described by Hermes et al. [2010]. Subsequently, these electrode positions were normalized to MNI space using the segmentation parameters of the fMRI preprocessing segmentation step [Unified segmentation, Ashburner and Friston, 2005]. Using a radius of 15 mm [Lachaux et al., 2007] around the normalized electrode positions, we determined which electrodes were located within one of the fMRI based ROIs. If an electrode was allocated to two or more ROIs in this analysis, the electrode was assigned to the ROI with the shortest distance to the position of the electrode. As the electrode grid coverage differed between patients, the number of electrodes within each ROI varied, as did the number of patients contributing to each ROI.
The electrode allocation method used above is an automatic approach, not taking into account cortical gyral patterns. Therefore, especially in the case of neighbouring ROIs, there is potential risk of assigning an electrode to an ROI that is for instance located at the other side of a sulcus, and which has a fundamentally different function and high frequency response pattern than the other electrodes assigned to the ROI. Therefore, we developed a second criterion and assessed whether the response profiles of the individual electrodes assigned to each specific ROI were similar or not. This approach used the affinity propagation clustering method to group the electrodes based on similarity of the high frequency response profiles [Frey and Dueck, 2007]. Affinity Propagation has the advantage that the number of clusters or groups does not need to be decided a priori, and it allows for self‐definition of a similarity measure between data points. The response profile was defined as the rising (t = −3 to 5 s, relative to stimulus onset) and descending (t = −5 to 3 s relative to button press) phases of the individual stimulus‐ and response‐locked high frequency traces of the difficult equations, and the correlation value between the profiles of individual electrodes was used as the similarity measure. In cases where the affinity propagation method demonstrated the presence of a subset of electrodes showing a deviant response profile (compared to the other electrodes in the ROI), the anatomical location of the electrodes was investigated in single subject space (using the CT‐scan and/or the intraoperative photographs). When the deviant response profile of a certain electrode could be explained by its location in single subject space (e.g., just on the other side of a sulcus compared to the other electrodes of the ROI), the electrode was reassigned accordingly. In cases where there was no neighbouring ROI to which the electrodes could be assigned, or when there was no clear anatomical explanation for the two types of responses, the two groups of electrodes were split into separate ROIs.
ECoG Group Analysis
To study power over time per ROI, we took, per subject and for each ROI, the mean of the high frequency power traces of the electrodes showing a significant change in high frequency power. The resulting traces (i.e., per ROI, averaged over significant electrodes per subject) were smoothed with a 20‐point moving average. To quantify the differences between ROIs in the timing of the high frequency power onsets and offsets, we identified for each smoothed trace, the time points of where the rising and descending phases of the stimulus‐locked or response‐locked traces crossed the 50% max values. The resulting values were corrected for outliers [Chauvenet's criteria, Chauvenet, 1863] and averaged. Only ROIs with five or more contributing subjects were considered for further analysis and in the figures. Differences between ROIs were tested for statistical significance with one‐way ANOVAs and post hoc Students t‐tests (P < 0.05), for both Type 1 and Type 2 traces of the difficult equations. Differences between task levels were tested for significance using Paired Students t‐tests (P < 0.05).
RESULTS
Behavioral Data
Accuracy during fMRI was 96 ± 2, 82 ± 4, and 53 ± 8% correct for easy, medium, and difficult equations, respectively (average ± standard error of the mean). Reaction times were 3.1 ± 0.1, 5.6 ± 0.2, and 7.8 ± 0.3 s. During ECoG recording, accuracy was 92 ± 2, 72 ± 4, and 51 ± 4% correct for the three task levels, with reaction times of 3.3 ± 02, 6.3 ± 0.3, and 8.0 ± 0.3 s, respectively. The average accuracy or reaction time was not significantly different between ECoG and fMRI for any of the task levels (independent t‐tests, P > 0.1).
fMRI Results
Mental calculation induced BOLD activation (t ≥ 5.5, Fig. 1) in a widespread cortical network of frontal, parietal and lower occipital brain regions bilaterally. Left hemispheric activation was more pronounced than that of the right hemisphere. In the left hemisphere, the dorsolateral prefrontal cortex (DLPFC) was activated, as well as Broca's area, a region covering large parts of the precentral gyrus, extending into the lower parts of the middle frontal gyrus, and an area on the superior frontal gyrus, close to the intersection with the precentral sulcus. Frontal cortical activations of the right hemisphere were largely similar, except for a smaller precentral activation. Parietal activation was bilaterally located around the intraparietal sulcus (IPS), including posterior parietal regions, and an area bordering the inferior postcentral sulcus/ascending IPS. Strong activation was also present in lower occipitotemporal regions bilaterally, the bilateral precuneus and bilateral supplementary motor regions. A decrease in BOLD (t ≤ −4) during mental calculation (compared to rest) was observed in the bilateral angular gyrus, with stronger effects in the left hemisphere. BOLD increases related to the button press (t ≥ 3.5) were observed in the left postcentral gyrus, precuneus (anterior to the calculation‐related activation), and in the medial frontal pole.
Figure 1.

Cortical fMRI activation patterns (group map, n = 10) of the mental calculation task. Red: BOLD increase during mental calculation (t ≥ 5.5). Blue: BOLD decrease during mental calculation (t ≤ −4). Green: BOLD increase during button press (t ≥ 3.5). [Color figure can be viewed in the online issue, which is available at http://wileyonlinelibrary.com.]
Based on the left‐hemispheric and interhemispheric (facing the left hemisphere) BOLD (de‐)activation related to mental calculation and the button press, 14 ROIs were obtained. ROIs 1–10 were related to a BOLD increase during mental calculation, ROI11 to a BOLD decrease during mental calculation, and ROI12–14 to a BOLD increase related to the button press (see Fig. 2 and Table 2).
Figure 2.

ROIs based on the fMRI activation patterns of the left hemisphere. Based on the left‐hemispheric and interhemispheric BOLD (de‐)activation related to mental calculation and the button press, 14 ROIs were obtained. ROIs 1–10 were related to a BOLD increase during mental calculation, ROI11 to a BOLD decrease during mental calculation, and ROI12–14 to a BOLD increase related to the button press. Notably, the affinity propagation clustering method revealed that several ROIs contained two types of fundamentally different high frequency power traces. Detailed investigation of the location of these groups of electrodes led to reassignment of several electrodes, and to a split of ROI3, ROI4, and ROI8, yielding ROI15 (next to ROI3), ROI16 (intermixed with ROI4), and ROI17 (intermixed with ROI8). Notably, ROI3 and ROI15 had too few subjects to be analysed further. [Color figure can be viewed in the online issue, which is available at http://wileyonlinelibrary.com.]
Table 2.
Regions of interest
| ROI | Area | Abbreviation | # Subj stimlocked | # Subj resplocked |
|---|---|---|---|---|
| 1 | Opercular/triangular gyrus | Operc/TriangG | 2 | 2 |
| 2 | Middle frontal gyrus (anterior) | aMFG | 9 | 10 |
| 3 | Superior frontal gyrus (posterior) | pSFG | 4 | 4 |
| 4 | Precentral gyrus/middle frontal gyrus 1 | PreCG/MFG1 | 8 | 10 |
| 5 | Inferior parietal lobule | IPL | 8 | 9 |
| 6 | Superior parietal lobule | SPL | 8 | 8 |
| 7 | Middle occipital gyrus | MOG | 2 | 2 |
| 8 | Inferior occipital gyrus/fusiform gyrus 1 | IOG/FFG1 | 5 | 5 |
| 9 | Supplementary motor area/cingulate cortex | SMA/CC | 6 | 6 |
| 10 | Precuneus (posterior) | pPCUN | 2 | 2 |
| 11 | Angular gyrus | AG | 4 | 4 |
| 12 | Superior frontal gyrus (anterior medial) | aSFGmed | 0 | 0 |
| 13 | Postcentral gyrus | PostCG | 9 | 10 |
| 14 | Precuneus (anterior) | aPCUN | 0 | 0 |
| 15 | Precentral gyrus (superior) | PreCGsup | 3 | 3 |
| 16 | Precentral gyrus/middle frontal gyrus 2 | PreCG/MFG2 | 9 | 9 |
| 17 | Inferior occipital gyrus/fusiform gyrus 2 | IOG/FFG2 | 5 | 5 |
Locations of the fMRI‐based ROIsz, the number of electrodes with a significant response in the high frequency range, and the number of subjects contributing to the ECoG dataset, for both the stimulus‐locked and the response‐locked approach, per ROI. Note that ROIs 1, 3, 7, 10, 11, 12, 14, and 15 have less than five subjects contributing, and were therefore left out of the analysis.
ECoG Results and Channel Grouping
Time frequency analysis of the stimulus‐locked ECoG data of the electrodes of all 21 patients revealed that, of a total of 1,992 electrodes (Fig. 3A) located on the left hemisphere (or interhemispherically facing the left hemisphere), 227 electrodes showed significant task‐related power changes in the 65–95 Hz frequency range in one or more of the task levels (222 increase in power, 5 decrease). Of the electrodes showing a significant change in high frequency power, 195 (86%, 192 increase, 3 decrease) were initially assigned to one of the 14 fMRI‐based ROIs, as they were located within 15 mm of one of the group analysis BOLD (de‐)activations. The electrodes that were not assigned to one of the ROIs, were not clustered in particular regions, but were spread across the brain (Fig. 3B). We investigated whether or not electrodes showing a significant response were located on cortical lesional areas. For only one significantly responding electrode, this was the case. This electrode showed a response that was highly similar to that of the other electrodes of the same subject that were assigned to the same ROI, and was therefore not excluded from analysis.
Figure 3.

(A) In red, normalized position of all implanted electrodes on the left hemisphere of the 21 patients contributing to the ECoG dataset, plotted on an average brain. (B) Yellow: Electrodes with a significant high frequency response, assigned to an ROI. Blue: Electrodes with a significant high frequency response NOT assigned to an ROI. More than 80% of significant electrodes were located within 15 mm of a BOLD ROI, and were therefore assigned to it. [Color figure can be viewed in the online issue, which is available at http://wileyonlinelibrary.com.]
Affinity propagation clustering revealed that ROI1, ROI3, ROI4, ROI5, ROI7, ROI8, ROI11, and ROI13 each contained two or more groups of electrodes showing fundamentally different high frequency temporal profiles. Detailed investigation of the results of this procedure revealed that ROI1, ROI7, and ROI11 each had a low number of electrodes (n ≤ 6) that were distributed over two or three clusters. As each of these clusters was too small for further consideration (1–4 electrodes of 1–2 subjects), these respective ROIs were not considered further. The electrodes of ROI3, ROI4, and ROI8 were split into two subsets each, adding three more ROIs, namely ROI15 (next to ROI3), ROI16 (intermixed with ROI4), and ROI17 (intermixed with ROI8) (Fig. 2). In addition, 6 electrodes from ROI5 and ROI13 were reassigned to other ROIs, and one electrode was excluded from further analysis. In the final arrangement of electrodes, eight of the ROIs had less than five subjects contributing data to it. These ROIs were excluded from further analysis. The remaining nine ROIs were retained for further analyses, each containing data from five or more subjects. To study the changes in high frequency power over time, we took for each ROI, per subject, the mean of the stimulus‐locked and response‐locked time frequency traces over these electrodes. Subsequently, we computed the time points at which the ascending phase of the stimulus‐locked traces and the descending phase of the response‐locked traces crossed the 50% max value. These values were corrected for outliers, as described in the methods section. To improve readability, from this point on we refer to the ROIs by their anatomical location, with the ROI number in brackets (see Table 2 for abbreviations).
ECoG High Frequency Power Profiles
Two types of high frequency power profiles were observed (see Figs. 4 and 5). A Type 1 response was characterized by a very slow power increase in the stimulus‐locked traces, especially for the more difficult equations, and a clear peak just before or at the time of the button press in the response‐locked traces, for all task levels (Fig. 4). Three ROIs showed a Type 1 response.
Figure 4.
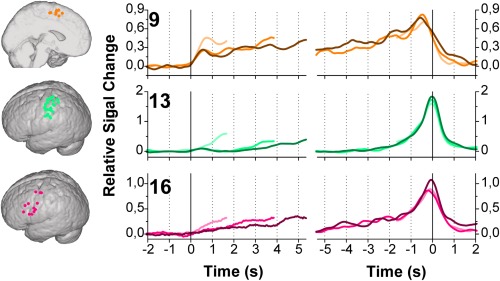
Stimulus‐locked (left) and response‐locked (right) time‐frequency profiles (65–95 Hz) of electrodes on the SMA/CC (ROI9), PostCG (ROI13), and PreCG/MFG2 (ROI16), all showing a Type 1 response. Traces for Easy, Medium and Difficult equations are indicated by increasing color intensity. Traces were computed as follows: First, per subject and per ROI, the average trace over significant electrodes was computed. The resulting traces were averaged per ROI, over subjects. Black vertical lines indicate stimulus onset (in stimulus‐locked traces) or the button press (in response locked traces). Note that the traces for easy and medium equations are shorter than for the difficult traces. We computed the median of the response times (per category, per patient), took the minimum per category (1.63, 3.84, and 5.35 s for easy, medium and difficult, respectively) and used that value as an endpoint in our plots. It can be assumed that, until this time point, (almost) all stimulus‐locked traces represent actual mathematical or number processing, whereas after this time point, the traces will be more and more “diluted” with rest due to the variance in response time. The same holds for the response‐locked traces, with the response time minus the minimum‐median‐RT representing the most consistent part in terms of functional processing. Locations of all individual electrodes contributing to the traces are indicated on the renderings on the left. [Color figure can be viewed in the online issue, which is available at http://wileyonlinelibrary.com.]
Figure 5.

Stimulus‐locked (left) and response‐locked (right) time‐frequency profiles (65–95Hz) over electrodes in the aMFG (ROI2), PreCG/MFG1 (ROI4), IPL (ROI5), SPL (ROI6), IOG/FFG1 (ROI8), and IOG/FFG2 (ROI17), all showing a Type 2 response. Figure details as in Figure 4. [Color figure can be viewed in the online issue, which is available at http://wileyonlinelibrary.com.]
Type 2 responses (Fig. 5) were characterized by a relatively steep increase in power after stimulus presentation onset, with power remaining at elevated levels until shortly before the button press, when it dropped back to baseline levels. Six ROIs showed a Type 2 response.
Areas with Type 1 Responses
As the Type 1 responses clearly represented neuronal processes tightly related to the button press (see Fig. 4), the stimulus‐locked traces were not very informative for a more detailed study of the differences between regions. Therefore, only the response‐locked traces were examined further, and the time points were computed of where the ascending and descending phases of the response‐locked peaks crossed the 50% max value (Fig. 6).
Figure 6.

Time points where the ascending (left) and descending (right) phases of the Type 1 response‐locked high frequency power peaks cross the 50% max values for easy, medium, and difficult equations. Time 0 is the button press. [Color figure can be viewed in the online issue, which is available at http://wileyonlinelibrary.com.]
Response‐locked
Analysis of variance revealed a significant difference between the ascending phases of peaks of the Type 1 ROIs, with the peak onset times of the SMA/CC (ROI9) being significantly different from those of both the PreCG/MFG2 (ROI16) and PostCG (ROI13) [difficult traces, One‐way ANOVA, F(2,22) = 10.042, P = 0.001, with post hoc Students t‐tests, P < 0.05]. None of the ROIs showed a significant difference between the three task levels in the ascending phase of the response‐locked peaks (Paired Students t‐tests, P < 0.05).
Notably, the ascending phases of the response‐locked peaks showed a highly consistent picture over task levels: The SMA/CC (ROI9) was the first to increase high frequency power, followed by the PreCG/MFG2 (ROI16). The PostCG (ROI13) was the last region to respond. The descending phase showed a less discriminating pattern and the timing of the power decrease was not significantly different between areas (Difficult traces, One‐way ANOVA, F(2,22) = 2.498, P = 0.105).
Areas with Type 2 Responses
We computed the points in time where the rising phase of the stimulus‐locked traces and the descending phase of the response‐locked traces crossed the 50% max value (Fig. 7).
Figure 7.

Time points of where the stimulus‐locked (left) traces first or response‐locked (right) Type 2 traces last crossed the 50% max values, for easy, medium, and difficult equations. Time 0 is stimulus onset for the stimulus‐locked traces, and the button press for the response‐locked traces. [Color figure can be viewed in the online issue, which is available at http://wileyonlinelibrary.com.]
Stimulus‐locked
Analysis of variance on all Type 2 stimulus‐locked traces of the difficult equations showed a significant difference between ROIs [F(5,37) = 7.962, P = 0.0004]. Post hoc Students t‐tests showed that the 50% values of ROI8 were significantly different from those of ROI2, 4, 5, and 6 (difficult traces, P < 0.05). The 50% values of ROI2 were significantly different from those of ROI4, 6, 8, and 17 (difficult traces, P < 0.05).
Of the six ROIs with Type 2 responses, the first one to respond upon stimulus presentation was the IOG/FFG1 (ROI8). The steep increase in high frequency power was highly consistent over task levels (Fig. 5), crossing the 50% max threshold at around 0.05–0.07 s after stimulus presentation onset (Fig. 7). Also the rising phase of IOG/FFG2 (ROI17) and SPL (ROI6) was steep and highly comparable between task levels (Fig. 5). The 50% max values were reached at about 0.2 s (IOG/FFG2, ROI17) and 0.35–0.55 s (SPL, ROI6) after stimulus presentation onset (Fig. 7). The 50% max values of these three areas did not show a significant difference between task levels (Paired Students t‐tests, P > 0.05).
For the easy equations, aMFG (ROI2), PreCG/MFG1 (ROI4) and IPL (ROI5) showed very similar responses, rising sharply, and crossing the 50% max level at more or less the same time point as SPL (ROI6). Examination of the traces for medium and difficult equations, however, revealed that 50% max was consistently reached first by PreCG/MFG1 (ROI4), followed by IPL (ROI5) and aMFG (ROI2). The responses of these ROIs were highly dependent on the task level. The more difficult the equation, the less steep the high frequency power increase and the later the 50% levels were reached. Indeed, ROI2, 4, and 5 showed significant differences between the task levels in the timing at which 50% max levels were reached. For ROI2 and 5, there was a significant difference between difficult and easy, and between difficult and medium equations. For ROI4, only the difference between difficult and easy equations was significant (Paired Students t‐tests, P < 0.05).
Response‐locked
All response‐locked traces showed a descending phase that started already quite some time (∼1 s) before the button press. The response‐locked traces of the IOG/FFG1 (ROI8) and IOG/FFG2 (ROI17) additionally showed a second rise and a peak shortly after the button press, around the time of the feedback that was given to the patients about their performance (Fig. 5). Also the traces of SPL (ROI6) showed a small peak or shoulder around this time point after the button press (Fig. 5). This second peak in the traces caused substantial variability in the time points at which the 50% max values were reached (e.g., in the medium level of IOG/FFG1, ROI8, Fig. 7), since for some subjects this value was reached already in the first descending phase, whereas for others, this value was reached during the descending phase of the second peak. Also the response‐locked traces of aMFG (ROI2), PreCG/MFG1 (ROI4), and IPL (ROI5) showed strong variability between subjects, and for none of these areas, a consistent pattern could be identified between task levels (Fig. 7). Analysis of variance showed no significant difference between the ROIs for response‐locked traces of difficult equations [One‐way ANOVA, F(5,41) = 1.622, P = 0.176].
DISCUSSION
In the present study, we have used a combination of fMRI and ECoG group analysis to elucidate the temporal characteristics of the neuronal processes underlying mental calculation. The task involved additions and subtractions of three levels of difficulty. Consistent with previous results [Ramsey et al., 2006], we observed a clear parametric relationship between task level and reaction time, as well as between task level and percentage correct, suggesting that the different categories of equations generated different levels of mental effort. Average reaction time and percentage correct did not differ significantly between fMRI and ECoG recording, indicating that, on average, postsurgical performance was comparable to presurgical performance.
fMRI
In the fMRI analysis of the mental calculation task, we observed a bilateral cortical activation pattern, with BOLD increases in frontal, parietal, and lower occipitotemporal regions. Cortical activation was somewhat more widespread in the left than in the right hemisphere, which corresponds largely with previous results [Arsalidou and Taylor, 2010]. The decrease in BOLD that was observed in the angular gyrus corresponds with other studies using subtraction, addition, and multiplication paradigms [e.g., Grabner et al., 2007; Grabner et al., 2009; Ischebeck et al., 2006; Wu et al., 2009]. Because of the more positive responses that have been observed in this area during the performance of computations that rely more on fact retrieval (e.g., multiplication, trained problems, people with high mathematical competence) than on procedural strategies (addition, subtraction), the angular gyrus has been suggested to be part of the language system, possibly involved in the retrieval of verbally stored arithmetic facts [Grabner et al., 2007, 2009; Ischebeck et al., 2006; Jost et al., 2010]. Others, however, have concluded that the left angular gyrus is not related to the verbal aspects of arithmetic fact retrieval [Zarnhofer et al., 2012], and have taken the mental calculation‐induced decrease in BOLD within the angular gyrus as a sign of a noninvolvement, or nonspecific involvement, of this region in mental calculation [Rickard et al., 2000; Wu et al., 2009]. Recently, evidence was presented for a role of the angular gyrus in mapping between mathematical symbols and their semantic referents (e.g., between mathematical problems and their solutions stored in long term memory, Grabner et al., 2011, 2013). Detailed study of the temporal aspects of the (de‐)activation of the angular gyrus may shed light on its exact function during arithmetic tasks. Unfortunately, there were not enough subjects within our ROI11 (AG) with a significant positive or negative response in the high frequency power to draw any conclusions.
ECoG‐fMRI Correspondence
The results of the ECoG analysis matched quite well with the fMRI activation patterns: 86% of electrodes showing a significant change in high frequency power during mental calculation were located within 15 mm of one (or more) of the fMRI‐based ROIs. The close correspondence between ECoG and fMRI activation agrees with previous studies from our group [Hermes et al., 2012a; Vansteensel et al., 2010] and with a study by Lachaux et al. [2007] who found that, for a semantic decision task, 80% of gamma sites is located within 15 mm of fMRI activation clusters. Notably, in the current study, the high frequency positive electrodes that could not be assigned to one of the ROIs, were not clustered, but were spread out over the brain. Vice versa, eight of the fMRI‐based ROI's were associated with less than five subjects showing high frequency positive electrodes, which, unfortunately, made it impossible to draw any conclusions about those areas. Several factors may contribute to the apparent mismatch between fMRI and ECoG. First, group fMRI analysis was used to define the ROIs. Comparing individual subject fMRI results with ECoG data may improve the match between the two. Second, it has been described that, in addition to high frequency changes, also changes in low frequency rhythms correlate with the fMRI signal, albeit less well than high frequencies [Hermes et al., 2012a, 2012b; Magri et al., 2012; Scheeringa et al., 2011]. Third, due to the 1 cm distance between electrodes, they only capture neural signal from some 5% of the area under the grids. Hence ECoG sampling from fMRI foci, which are smaller for an individual than the group‐based ROIs, is not ensured by grid coverage of that region. Grids with higher electrode densities [e.g., Hermes et al., 2012b] may produce better matching between electrodes and fMRI foci. Finally, three of the ROIs that were associated with less than five high frequency positive electrodes were located interhemispherically, where only a very limited number of subjects had electrodes implanted. The other five ROIs were among the smallest of the dataset, again resulting in only few electrodes that could be assigned to them. Adding many more patients to the dataset may solve this issue and may make it possible to study the time course of spectral power changes in those areas as well.
High Frequency Power Profiles—Type 1
Type 1 traces showed a very slow and shallow rise in the stimulus‐locked traces and a clear response‐locked peak shortly before the button press. The shape of these Type 1 profiles suggests an involvement of the respective areas (SMA/CC, ROI9; PostCG, ROI13; and PreCG/MFG2, ROI16) in the motor related processes of the button press. Interestingly, all peaks occurred shortly before the actual button press. This may be caused by the fact that the traces were locked to the button press itself (a response is registered at the end of a movement), and not to the movement‐onset. The planning of the movement, the movement toward the button and the actual pressing will generate activity in the involved areas before the button is fully pressed.
Motor Response
The supplementary motor area (ROI9) is responsible for planning of motor actions. The rising phase in high frequency power of this region indeed consistently preceded that of areas thought to be involved in later stages of motor actions, such as the PostCG (ROI13), corresponding to previous magnetoencephalography (MEG) and fMRI studies [Huang et al., 2004; Sun et al., 2005; Weilke et al., 2001]. Another highly consistent profile was the rising phase in high frequency power of the PostCG (ROI13), which always occurred after those of the more frontal areas, corresponding to previous results [Pollok et al., 2004] and to the general idea of the role of this area in the processing of somatosensory feedback information.
Two Functions in the Precentral Gyrus/Medial Frontal Gyrus
The PreCG/MFG2 (ROI16) is located in the lower parts of the precentral gyrus and more anterior in the middle frontal gyrus. Interestingly, the location of electrodes assigned to the PreCG/MFG2 (ROI16) could, on anatomical basis, not be separated from those assigned to the PreCG/MFG1 (ROI4). Only the shape of the high frequency power traces was clearly different, with the electrodes of PreCG/MFG2 (ROI16) showing a clear, response‐locked peak, whereas the electrodes of PreCG/MFG1 (ROI4) showed a Type 2 response, which was characterised by a relatively strong rise after stimulus onset, followed by elevated power during the computation period, and a fall to baseline levels before the button press. Notably, these different responses could not be attributed to subject‐specific differences in this brain region, since both types of responses were observed within individual subjects. Although many studies have reported activation of the precentral, inferior and middle frontal gyrus during mental calculation tasks [De Smedt et al., 2011; Grabner et al., 2007, 2009; Ischebeck et al., 2009; Menon et al., 2000; Pesenti et al., 2000], the precise role of the area in number processing and mental calculation is still poorly understood. Based on our observation of two types of high frequency power profiles being present in quite an extended area on the middle frontal and precentral gyri, it must be concluded that the area serves at least two functions during our mental calculation task. The response‐locked peaks of the PreCG/MFG2 (ROI16) may be attributed to the motor processes related to the button press at the end of the computation period. The ventral premotor cortex has been suggested to be involved in the preparation and execution of arm movements, and in the manipulation of objects. The area is thought to directly match sensory information with the motor actions, such as matching of a grasping movement to the location or visuospatial properties of the target [Chouinard and Paus, 2006; Hoshi and Tanji, 2007]. Alternatively, the response‐locked profile of ROI16 could be indicative of the comparison of the mentally computed answer of the equations to the displayed answer, and the subsequent decision about correctness of the latter. A role for the ventral premotor areas in these different task components has been demonstrated previously [Romo et al., 2004].
In contrast to the PreCG/MFG2 (ROI16), the high frequency profile of PreCG/MFG1 (ROI4) is indicative for involvement of precentral and middle frontal regions during the actual computation process, which starts long before the button press takes place. Given its close proximity to the hand motor region, one of the roles that has been ascribed to the left precentral activation during mental arithmetic is being part of the finger movement network that underlies finger counting [Krueger et al., 2010; Pesenti et al., 2000; Venkatraman et al., 2005; Zago et al., 2001], which is considered an evolutionary and neuronal basic substrate of mental calculation [Fayol et al., 1998; see also Fehr et al., 2007]. Others have put forward a role for precentral and middle/inferior frontal areas in working memory related processes, such as rule updates [Kazui et al., 2000; Montojo and Courtney, 2008].
Taken together, it is clear that the lower parts of the precentral gyrus, together with posterior parts of the middle frontal gyrus are involved in a number of aspects of the mental calculation task. This notion corresponds with other recent reports that suggest that the posterior DLPFC and premotor structures are involved in transforming sensation into action, i.e. the use of sensory information in a complete cascade of decision making, execution and evaluation of the outcome of the decision [Acuña et al., 2010; Heekeren et al., 2008; Pardo‐Vazquez et al., 2008, 2011; Romo et al., 2004]. Whether or not the relatively large groups of electrodes assigned to both the PreCG/MFG1 (ROI4) and PreCG/MFG2 (ROI16) can be further distributed into separate subfunctions remains to be determined.
High Frequency Power Profiles—Type 2
Type 2 profiles were characterised by a relatively strong rise around stimulus onset, after which power remained at elevated levels before falling to baseline levels around the time of the button press. Notably, for some ROIs, the power increase seemed to start already before stimulus onset. This is a result of the smoothing we performed on the traces.
The ECoG profiles of the Type 2 responses reveal an interesting general finding: only for stimulus‐locked traces, a significant difference between ROIs could be found (ANOVA, difficult traces), and only for stimulus‐locked traces, the order in which the different ROIs are activated remained consistent across task levels. The response‐locked traces showed much more variability in the timing, despite the fact that all traces are synchronized according to a common event: the button press. This difference in variability has strong effects on the conclusions that can be drawn from the respective traces, but may not be that surprising. Immediately after the presentation of a certain stimulus, certain automatic events take place (e.g., visual processing of the stimulus). These events are followed by events that are more affected by subject‐specific differences in computational, working memory and decision making abilities. For example, there will be much more variation in the amount of time that people need to make a decision, identify the correct button and to press it, after they have computed the equation, than between the first visual identification of the stimulus and the onset of the actual computation. Because of the large variability and the absence of significant differences between ROIs in the response‐locked traces, the discussion of the Type 2 profiles will be based mostly on the stimulus‐locked data.
Visual Responses
The first two areas to respond with an increase in power were the IOG/FFG1 (ROI8) and IOG/FFG2 (ROI17). The electrodes of these ROIs were located in the left inferior occipital/fusiform area, a region playing a central role in visual processing. In our study, the IOG/FFG1 (ROI8) responded first and very quickly to the presentation of a new equation with a steep rise in high frequency power, consistently immediately followed by IOG/FFG2 (ROI17). The time points at which the 50% max levels were crossed were highly similar across task levels for both areas, suggesting that the timing of the responses is not affected by the task level. Interestingly, both areas were responsive to the presentation of feedback about the performance, which was given immediately after the button press. The location of the electrodes of the IOG/FFG1 (ROI8) and IOG/FFG2 (ROI17), the steep rising phase of the high frequency profile, its independence of task level and the response to the feedback after the button press are indicative of an early, automatic, visual response to the newly presented equation or feedback information. After the initial peak, power in IOG/FFG1 (ROI8) and IOG/FFG2 (ROI17) showed a clear decline, but remained elevated during almost the entire computation time, suggesting that the visual processing of different elements of the equations by this region continued also after the initial identification of the visual stimulus. Interestingly, this sustained activation dropped at about 0.5–1 s before the button press, when the equation was still present on the screen. At that point, all elements of the equation can be assumed to have been visually processed in a certain order, and the other steps of the task (e.g., decisions about correct/incorrect and which button to press) do not require further visual processing of the information on the computer screen.
The left inferior occipital/fusiform area is known to contain many visually relevant subregions, such as hV4, VO1, VO2, MT+, LO1, LO2, and the visual word form area [Larsson and Heeger, 2006; Wandell, 2011]. During the last years, there has been extensive research on the visual processing of for instance faces and words [Natu and O'Toole, 2011; Wandell, 2011]. Interestingly, for visual word processing, a number of studies have suggested a posterior to anterior gradient along the ventral part of the brain, from low‐level visual feature processing in occipital areas close to V1 toward higher level, more complex, orthographic processing at more anterior locations [Levy et al., 2008; Tarkiainen et al., 1999; Pammer, 2009]. In addition, a number of papers have recently speculated that responses of occipitotemporal areas to visual word reading are not entirely determined by purely visual, bottom‐up processing. Instead, the ventral occipitotemporal cortex is now recognized to be strongly influenced by top‐down processing [Horner and Henson, 2010; Kherif et al., 2010; Price and Devlin, 2011; Twomey et al., 2011].
For mental calculation, it has been shown many times that lower temporo‐occipital areas are activated [Ischebeck et al., 2006; Rivera et al., 2005]. Indeed, a recent study has demonstrated that there is an area in the posterior part of the inferior temporal gyrus that shows a preferential response to visually presented numerals [Shum et al., 2013]. Moreover, another recent report revealed that parsing of mathematical expressions occurs early in visual processing and that occipito‐temporal regions play an important role in these early syntactic effects [Maruyama et al., 2012]. Although the difference in the time points at which IOG/FFG1 (ROI8) and IOG/FFG2 (ROI17) reached 50% max levels was not significant, it was consistent over task levels, and there was a trend toward a slightly later response of IOG/FFG2 (ROI17; P < 0.1, difficult traces). Together with the slightly more anterior location, on average, of the IOG/FFG2 (ROI17) electrodes, it could be speculated that the traces of IOG/FFG1 (ROI8) and IOG/FFG2 (ROI17) represent two subsequent steps in visual number processing, with the IOG/FFG1 (ROI8) representing a slightly lower level and more automatic process. This notion needs to be substantiated with dedicated experiments.
The Superior Parietal Lobule
Similar to the inferior occipital/fusiform regions (ROI8 and ROI17), the SPL (ROI6) seems to respond in an automatic fashion to the presentation of an arithmetic equation, about 0.3–0.5 s after the activation of IOG/FFG1 (ROI8). The initial rise in power is steep and its timing independent of task level. The decline of the high frequency response in the SPL (ROI6) occurs before the actual button press, with a slight hint of an additional peak or shoulder after the button press, which may correspond to the feedback that subjects receive about the correctness of their response.
In the updated triple code model, the posterior superior parietal lobule has been attributed a role in the attentional processes of mental calculation, or the shifting of attention along a mental number line [Dehaene et al., 2003]. The area is not specific for numbers or calculation, and has also been found to be activated during saccades and/or other visuo‐spatial tasks, such as pointing, grasping or attention [Simon et al., 2002, 2004]. Interestingly, the area activated during the performance of left‐right eye movements is also recruited during addition and subtraction [Knops et al., 2009], confirming the idea that mental calculation can be compared to shifting of attention along a mental number line. Notably, a recent transcranial magnetic stimulation study suggested that the posterior superior parietal lobule may not be essential for solving basic arithmetic problems, since both reaction time and error rate was not affected by virtual lesion of the area by transcranial magnetic stimulation (TMS) [Andres et al., 2011]. The quick and automatic response of the SPL (ROI6) after stimulus presentation onset in our mental calculation task, together with the observation of a small peak or shoulder corresponding with the visual feedback about correctness, is in line with a general role of the area in tuning attention or gaze toward visually presented stimuli.
Traces Affected by Task Level
The timing of the high frequency power rise of the other three ROIs with a Type 2 response (aMFG, ROI2; PreCG/MFG1, ROI4; and IPL, ROI5) was dependent on the task level, in that the onset (at 50% max levels) was later when computations were more difficult. This suggests that the responses of those areas are less “automatic” than those of the SPL (ROI6), IOG/FFG1 (ROI8), and IOG/FFG2 (ROI17) and may be more related to the core computation process. The slower responses of these regions for the difficult equations may be caused by the larger amount of time that subjects need to visually process (read) difficult equations, which contain more terms and larger numbers than the easy and medium equations. Besides reading, parsing will require more time as well, if equations contain more terms. These factors may play a role in determining the average stimulus‐locked power traces.
Working memory
For all task levels, the last ROI to raise its power after stimulus onset is the aMFG (ROI2), a region also known as the anterior DLPFC. The DLPFC has been linked to both maintenance of information and processing in terms of reorganizing or updating content [Jansma et al., 2000; Smith and Jonides, 1999]. The slow but monotonic rise of the response of this region fits perfectly with this role: these processes become increasingly active after the initial computational steps have been taken, and information has to be stored for further computation or comparison with the given answer.
Actual numerical processing
The high frequency power rise of the IPL (ROI5) is dependent on the task level, follows that of the more automatic visual processes of IOG/FFG1 (ROI8), IOG/FFG2 (ROI17) and, although not significantly different in onset time, consistently precedes the storage of intermediate computational steps in the aMFG (ROI2). Although the details of numerical processing are a matter of elaborate discussion [see e.g., Cohen Kadosh and Walsh, 2009 and commentaries], there is consensus about the horizontal segment of the IPS being the critical area for the representation of numerical magnitude or quantity [Cohen Kadosh and Walsh, 2009; Dehaene et al., 2003]. None of our electrodes were located in the depths of the IPS, but the electrodes assigned to the IPL (ROI5) were all located in close vicinity of the IPS, either directly on top of it, or inferior‐posterior to the intersection between the IPS and the postcentral sulcus. We therefore believe that our ROI5 (IPL) profile most closely represents the actual numerical processing during our mental calculation task.
General Discussion
The results of the current study substantiate and extend the results of previous ERP work on the neurophysiological processes involved in mental calculation of different task levels. In general, early ERP components (up to ∼250 ms) are thought to be stimulus‐driven and have been associated with visual processing of the stimuli [El Yagoubi et al., 2003; Iguchi and Hashimoto, 2000; Ku et al., 2010]. These responses are generally not affected by the difficulty of the problem [El Yagoubi et al., 2003; Ku et al., 2010]. Our current data are in agreement with those findings and, together with previous ECoG work on the visual processing of numbers [Shum et al., 2013], provide a more detailed picture of where visual stimulus processing of equations takes place.
The ERP component that occurs slightly later, that is, around 300 ms after stimulus presentation, is not affected by task level. In frontal and central, but not parietal, areas, the component is affected by general task practice [Pauli et al., 1996], and shows a different response to digits and patterns [Iguchi and Hashimoto, 2000]. The frontal representation of this component has therefore been suggested to represent a more general mental calculation process, such as the identification of the numeric meaning of digits [Iguchi and Hashimoto, 2000; Ku et al., 2010], whereas the parietal part may reflect a more common response to visual stimuli [Iguchi and Hashimoto, 2000]. It could be speculated that our PreCG/MFG1 (ROI4) represents the frontal part of this component. Although we did find a significant difference between difficult and easy equations in the timing of its response, the time difference is much smaller than that observed for the aMFG (ROI2) and IPL (ROI5). It will be interesting to further investigate the specific function of the PreCG/MFG1 (ROI4) during the mental calculation process. Interestingly, in our current study, the timing of SPL (ROI6) is highly similar to that of PreCG/MFG1 (ROI4), and its response is not affected by task level. Our conclusion that this area represents a general effect of tuning attention or gaze to visually presented stimuli is in line with the suggestion of Iguchi and Hashimoto [2000] about the parietal P300 component.
Effects of task level on ERPs are generally only observed in the later components, that is, those that occur ∼500 to 1,000 ms after stimulus presentation [Iguchi and Hashimoto, 2000; Ku et al., 2010; Pauli et al., 1996]. This so‐called positive slow potential is thought to reflect a process that is essential to the act of calculation. There are some discrepancies, however, between ERP studies in the location of and exact function ascribed to the positive slow potential. Pauli et al. [1996] do not report about a location, but suggest that the component reflects working memory aspects of the task. Iguchi and Hashimoto [2000] report about an earlier part present over frontal, central, parietal and temporal regions that could represent handling numerals, and a later, frontal, part associated with working memory. Yet another study [Nunez‐Pena et al., 2011] suggests that the parietal positive slow potential may represent the use of different strategies (fact retrieval versus procedures) in solving easy and difficult equations. It is interesting to note that the aMFG (ROI2) and IPL (ROI5) of our study both show late responses, and are both strongly affected by task level. As mentioned above, we believe that these areas represent working memory processes and core mental calculation, respectively. It could be speculated that those areas form the source of the positive slow potential mentioned above, but this may require further investigation.
Limitations of the Study
A number of methodological issues deserve attention. First, the number and identity of the subjects and electrodes contributing to each ROI varies. This is an inevitable aspect of ECoG recordings, where the specific area of the brain that is covered by electrodes is highly subject‐specific, as it is entirely determined by clinical considerations. At present, it cannot be completely excluded that dissimilarities in input data (subjects/electrodes) has contributed to the differences we observed in the temporal power profiles of the ROIs. However, considering that at least five different subjects contributed data to each ROI (and with equal weight per subject, as we averaged the responses of the significant electrodes of each subject per ROI, before averaging over subjects), we believe that the resulting average traces are reasonably representative of the population, and that they do tell us something meaningful about the processes that occur in the brain during arithmetic problem solving.
Second, it could be speculated that the 50% max levels of the ascending phases are related to the maximum amplitude of the traces. In other words, traces that reach a higher amplitude may have a longer ascending phase and an associated later onset (as defined by 50% max values). This issue needs to be addressed separately for each ROI, as every ROI has a fundamentally different function and it cannot be assumed that the presence or not of a relationship between amplitude and onset time is an overall characteristic of the brain. For each ROI, we took, per subject, the 50% max onset time and the amplitude of each trace of each task level and performed a linear regression analysis. For none of the ROIs, this regression analysis was significant (P > 0.05, R < 0.3), indicating that there was no relationship between the onset times and the amplitude of the traces.
CONCLUSIONS
In conclusion, we show here that the different brain regions involved in mental calculation display orderly differences in the temporal evolution of neuronal response and in the effect of computational difficulty thereupon. Our data confirm that activity progresses from visual perceptual regions to computational foci in the parietal and frontal cortex and then to the motor system. An important finding is that the often‐described, uniform fMRI activation in the precentral gyrus and middle frontal gyrus is actually related to at least two different types of temporal ECoG activation signatures. This finding indicates that the area contains foci with quite different functions within mental calculation and emphasizes the fact that temporal signal features, when examined in the degree of detail obtainable with ECoG, provide new insights that complement what can be discovered with fMRI.
Our results additionally demonstrate that ECoG can be used for chronometric assessment of activation in neuronal networks, and that grouping of ECoG electrodes based on their location relative to a group fMRI activation pattern can be a useful approach to study task‐related neuronal activity in different cortical areas over larger groups of subjects. ECoG research is hindered by subject differences in the number of electrodes that are implanted and the cortical areas that are covered, as well as by limited numbers of patients that are treated each year. Methods that allow group analysis of these complex data may be highly valuable for future studies.
ACKNOWLEDGMENTS
The authors would like to thank Nico Teunissen, Herke Jan Noordmans, and Tineke Gebbink for their help in collecting the data, Peter Gosselaar and Peter van Rijen for implanting the electrodes, the clinical neurophysiology team for their time and effort and Lenny Ramsey for help with analyzing the data. The authors have no conflict of interest to declare.
REFERENCES
- Acuña C, Pardo‐Vazquez JL, Leboran V (2010): Decision‐making, behavioural supervision and learning: An executive role for the ventral premotor cortex? Neurotox Res 18:416–427. [DOI] [PubMed] [Google Scholar]
- Andres M, Pelgrims B, Michaux N, Olivier E, Pesenti M (2011): Role of distinct parietal areas in arithmetic: An fMRI‐guided TMS study. NeuroImage 54:3048–3056. [DOI] [PubMed] [Google Scholar]
- Ashburner J, Friston KJ (2005): Unified segmentation. NeuroImage 26:839–851. [DOI] [PubMed] [Google Scholar]
- Arsalidou M, Taylor MJ (2010): Is 2+2=4? Meta‐analysis of brain areas needed for numbers and calculations. NeuroImage 54:2382–2393. [DOI] [PubMed] [Google Scholar]
- Butterworth B (2010): Foundational numerical capacities and the origins of dyscalculia. Trends Cogn Sci 14:534–541. [DOI] [PubMed] [Google Scholar]
- Chauvenet W (1863): A Manual of Spherical and Practical Astronomy, Vol II. Reprint of 1891, 5th ed. Dover Publications, N.Y. pp 474–566.
- Chouinard PA, Paus T (2006): The primary motor and premotor areas of the human cerebral cortex. Neuroscientist 12:143–152. [DOI] [PubMed] [Google Scholar]
- Cohen Kadosh R, Walsh V (2009): Numerical representation in the parietal lobes: Abstract or not abstract? Behav Brain Sci 32:313–373. [DOI] [PubMed] [Google Scholar]
- Crone NE, Sinai A, Korzeniewska A (2006): High‐frequency oscillations and human brain mapping with electrocorticography. Prog Brain Res 159:275–295. [DOI] [PubMed] [Google Scholar]
- De Smedt B, Holloway ID, Ansari D (2011): Effects of problem size and arithmetic operation on brain activation during calculation in children with varying levels of arithmetical fluency. NeuroImage 57:771–781. [DOI] [PubMed] [Google Scholar]
- Dehaene S, Cohen L (1995): Towards an anatomical and functional model of number processing. Math Cogn 1:83–120. [Google Scholar]
- Dehaene S, Piazza M, Pinel P, Cohen L (2003): Three parietal circuits for number processing. Cogn Neuropsychol 20:487–506. [DOI] [PubMed] [Google Scholar]
- Dehaene S, Molko N, Cohen L, Wilson AJ (2004): Arithmetic and the brain. Curr Opin Neurobiol 14:218–224. [DOI] [PubMed] [Google Scholar]
- Ebersole JS, Ebersole SM (2010): Combining MEG and EEG source modelling in epilepsy evaluations. J Clin Neurophysiol 27:360–371. [DOI] [PubMed] [Google Scholar]
- El Yagoubi R, Lemaire P, Besson M (2003): Different brain mechanisms mediate two strategies in arithmetic: Evidence from event‐related brain potentials. Neuropsychologia 41:855–862. [DOI] [PubMed] [Google Scholar]
- Fayol M, Barrouillet P, Marinthe C (1998): Predicting arithmetical achievement from neuro‐psychological performance: A longitudinal study. Cognition 68:B63–B70. [DOI] [PubMed] [Google Scholar]
- Fehr R, Code C, Herrmann M (2007): Common brain regions underlying different arithmetic operations as revealed by conjunct fMRI‐BOLD activation. Brain Res 1172:93–102. [DOI] [PubMed] [Google Scholar]
- Frey BJ, Dueck D (2007): Clustering by passing messages between data points. Science 315:972–976. [DOI] [PubMed] [Google Scholar]
- Grabner RH, Ansari D, Reishofer G, Stern E, Ebner F, Neuper C (2007): Individual differences in mathematical competence predict parietal brain activation during mental calculation. NeuroImage 38:346–356. [DOI] [PubMed] [Google Scholar]
- Grabner RH, Ansari, Koschutnig K, Reishofer G, Ebner F, Neuper C (2009): To retrieve or to calculate? Left angular gyrus mediates the retrieval of arithmetic facts during problem solving. Neuropsychologia 47:604–608. [DOI] [PubMed] [Google Scholar]
- Grabner RH, Reishofer G, Koschutnig K, Ebner F (2011): Brain correlates of mathematical competence in processing mathematical representations. Front Hum Neurosci 5:130. [DOI] [PMC free article] [PubMed] [Google Scholar]
- Grabner RH, Ansari D, Koschutnig K, Reishofer G, Ebner F (2013): The function of the left angular gyrus in mental arithmetic: Evidence from the associative confusion effect. Hum Brain Mapp 34:1013–1024. [DOI] [PMC free article] [PubMed] [Google Scholar]
- Gruber O, Indefrey P, Steinmetz H, Kleinschmidt A (2001): Dissociating neural correlates of cognitive components in mental calculation. Cereb Cortex 11:350–359. [DOI] [PubMed] [Google Scholar]
- Harvey BM, Klein BP, Petridou N, Dumoulin SO (2013): Tophographic representation of numerosity in the human parietal cortex. Science 341:1123–1126. [DOI] [PubMed] [Google Scholar]
- Heekeren HR, Marrett S, Ungerleider LG (2008): The neural systems that mediate human perceptual decision making. Nat Rev Neurosci 9:467–479. [DOI] [PubMed] [Google Scholar]
- Hermes D, Miller KJ, Noordmans HJ, Vansteensel MJ, Ramsey NF (2010): Automated electrocorticographic electrode localization on individually rendered brain surfaces. J Neurosci Methods 185:293–298. [DOI] [PubMed] [Google Scholar]
- Hermes D, Miller KJ, Vansteensel MJ, Aarnoutse EJ, Leijten FS, Ramsey NF (2012a): Neurophysiologic correlates of fMRI in human motor cortex. Hum Brain Mapp 33:1689–1699. [DOI] [PMC free article] [PubMed] [Google Scholar]
- Hermes D, Siero JC, Aarnoutse EJ, Leijten FS, Petridou N, Ramsey NF (2012b): Dissociation between neuronal activity in sensorimotor cortex and hand movement revealed as a function of movement rate. J Neurosci 32:9736–9744. [DOI] [PMC free article] [PubMed] [Google Scholar]
- Hermes D, Miller KJ, Vansteensel MJ, Edwards E, Ferrier CH, Bleichner MG, van Rijen PC, Aarnoutse EJ, Ramsey NF (2014): Cortical theta wanes for language. NeuroImage 85 (Pt 2):738–747. [DOI] [PubMed] [Google Scholar]
- Horner AJ, Henson RN (2010): Repetition suppression in occipitotemporal cortex despite negligible visual similarity: Evidence for postperceptual processing? Hum Brain Mapp 32:1519–1534. [DOI] [PMC free article] [PubMed] [Google Scholar]
- Hoshi E, Tanji J (2007): Distinctions between dorsal and ventral premotor natomical connectivity and functional properties. Curr Opin Neurobiol 17:234–242. [DOI] [PubMed] [Google Scholar]
- Huang MX, Harrington DL, Paulson KM, Weisend MP, Lee RR (2004): Temporal dynamics of ipsilateral and contralateral motor activity during voluntary finger movement. Hum Brain Mapp 23:26–39. [DOI] [PMC free article] [PubMed] [Google Scholar]
- Iguchi Y, Hashimoto I (2000): Sequential information processing during a mental arithmetic is reflected in the time course of event‐related brain potentials. Clin Neurophysiol 111:204–213. [DOI] [PubMed] [Google Scholar]
- Ischebeck A, Zamarian L, Siedentopf C, Koppelstätter F, Benke T, Felber S, Delazer M (2006): How specifically do we learn? Imaging the learning of multiplication and subtraction. NeuroImage 30:1365–1375. [DOI] [PubMed] [Google Scholar]
- Ischebeck A, Zamarian L, Schocke M, Delazer M (2009): Flexible transfer of knowledge in mental arithmetic—An fMRI study. NeuroImage 44:1103–1112. [DOI] [PubMed] [Google Scholar]
- Jacobs J, Kahana MJ (2010): Direct brain recordings fuel advances in cognitive electrophysiology. Trends Cogn Sci 14:162–171. [DOI] [PMC free article] [PubMed] [Google Scholar]
- Jacobs J, Korolev IO, Caplan JB, Ekstrom AD, Litt B, Baltuch G, Fried I, Schulze‐Bonhage A, Madsen JR, Kahana MJ (2010): Right‐lateralized brain oscillations in human spatial navigation. J Cogn Neurosci 22:824–836. [DOI] [PMC free article] [PubMed] [Google Scholar]
- Jansma JM, Ramsey NF, Coppola R, Kahn RS (2000). Specific versus nonspecific brain activity in a parametric N‐back task. NeuroImage 12:688–697. [DOI] [PubMed] [Google Scholar]
- Jost K, Khader PH, Burke M, Bien S, Rösler R (2010): Frontal and parietal contributions to arithmetic fact retrieval: A parametric analysis of the problem size effect. Hum Brain Mapp 32:51–59. [DOI] [PMC free article] [PubMed] [Google Scholar]
- Kazui H, Kitagaki H, Mori E (2000): Cortical activation during retrieval of arithmetical facts and actual calculation: A functional magnetic resonance imaging study. Psychiatry Clin Neurosci 54:479–485. [DOI] [PubMed] [Google Scholar]
- Kherif F, Josse G, Price CJ (2010): Automatic top‐down processing explains common left‐occipito‐temporal responses to visual words and objects. Cereb Cortex 21:103–114. [DOI] [PMC free article] [PubMed] [Google Scholar]
- Knops A, Thirion B, Hubbard EM, Michel V, Dehaene S (2009): Recruitment of an area involved in eye movements during mental arithmetic. Science 324:1583–1585. [DOI] [PubMed] [Google Scholar]
- Kroger JK, Nystrom LE, Cohen JD, Johnson‐Laird PN (2008): Distinct neural substrates for deductive and mathematical processing. Brain Res 1243:86–103. [DOI] [PubMed] [Google Scholar]
- Krueger F, Landgraf S, van der Meer E, Deshpande G, Hu X (2010): Effective connectivity of the multiplication network: A functional MRI and multivariate granger causality mapping study. Hum Brain Mapp 32:1419–1431. [DOI] [PMC free article] [PubMed] [Google Scholar]
- Ku Y, Hong B, Gao X, Gao S (2010): Spectra‐temporal patterns underlying mental addition: An ERP and ERD/ERS study. Neurosci Lett 472:5–10. [DOI] [PubMed] [Google Scholar]
- Lachaux JP, Fonlupt P, Kahane P, Minotti L, Hoffmann D, Bertrand O, Baciu M (2007): Relationship between task‐related gamma oscillations and BOLD signal: New insights from combined fMRI and intracranial EEG. Hum Brain Mapp 28:1368–1375. [DOI] [PMC free article] [PubMed] [Google Scholar]
- Larsson J, Heeger DJ (2006): Two retinotopic visual areas in human lateral occipital cortex. J Neurosci 26:13128–13142. [DOI] [PMC free article] [PubMed] [Google Scholar]
- Levy J, Pernet C, Treserras S, Boulanouar K, Berry I, Aubry F, Demonet JF, Celsis P (2008): Piecemeal recruitment of left‐lateralized brain areas during reading: A spatio‐functional account. NeuroImage 43:581–591. [DOI] [PubMed] [Google Scholar]
- Magri C, Schridde U, Murayama Y, Panzeri S, Logothetis NK (2012): The amplitude and timing of the BOLD signal reflects the relationship between local field potential power at different frequencies. J Neurosci 32:1395–1407. [DOI] [PMC free article] [PubMed] [Google Scholar]
- Maruyama M, Pallier C, Jobert A, Sigman M, Dehaene S (2012): The cortical representation of simple mathematical expressions. NeuroImage 61:1444–1460. [DOI] [PubMed] [Google Scholar]
- Menon V, Rivera SM, White CD, Glover GH, Reiss AL (2000): Dissociating prefrontal and parietal cortex activation during arithmetic processing. NeuroImage 12:357–365. [DOI] [PubMed] [Google Scholar]
- Montojo CA, Courtney SM (2008): Differential neural activation for updating rule versus stimulus information in working memory. Neuron 59:173–182. [DOI] [PMC free article] [PubMed] [Google Scholar]
- Natu V, O'Toole AJ (2011): The neural processing of familiar and unfamiliar faces: A review and synopsis. Br J Psychol 102:726–747. [DOI] [PubMed] [Google Scholar]
- Neggers SFW, Hermans EJ, Ramsey NF (2008): Enhanced sensitivity with fast three‐dimensional blood‐oxygen‐level‐dependent functional MRI: Comparison of SENSE‐PRESTO and 2D‐EPI at 3T. NMR Biomed 21:663–676. [DOI] [PubMed] [Google Scholar]
- Neisser U, Boodoo G, Bouchard TJ, Boykin AW, Brody N, Ceci SJ, Halpern DF, Loehlin JC, Perloff R, Sternberg RJ, Urbina S (1996): Intelligence: Knowns and unknowns. Am Psychol 51:77–101. [Google Scholar]
- Nunez‐Pena MI, Gracia‐Bafalluy M, Tubau E (2011): Individual differences in arithmetic skill reflected in event‐related brain potentials. Int J Psychophysiol 82:143–149. [DOI] [PubMed] [Google Scholar]
- Oostenveld R, Fries P, Maris E, Schoffelen JM (2011): FieldTrip: Open source software for advanced analysis of MEG, EEG, and invasive electrophysiological data. Comput Intell Neurosci 2011:156869. [DOI] [PMC free article] [PubMed] [Google Scholar]
- Pammer K (2009): What can MEG neuroimaging tell us about reading? J Neurolinguistics 22:266–280. [Google Scholar]
- Pardo‐Vazquez JL, Leboran V, Acuna C (2008): Neural correlates of decisions and their outcomes in the ventral premotor cortex. J Neurosci 28:12396–12408. [DOI] [PMC free article] [PubMed] [Google Scholar]
- Pardo Vazquez JL, Padron I, Fernandez‐Rey J, Acuna C (2011): Decision‐making in the ventral premotor cortex harbinger of action. Front Integr Neurosci 5:54. [DOI] [PMC free article] [PubMed] [Google Scholar]
- Pauli P, Lutzenberger W, Birbaumer N, Rickard TC, Bourne LE (1996): Neurophysiological correlates of mental arithmetic. Psychophysiology 33:522–529. [DOI] [PubMed] [Google Scholar]
- Pesenti M, Thioux M, Seron X, De Volder A (2000): Neuroanatomical substrates of Arabic number processing, numerical comparison, and simple addition: A PET study. J Cogn Neurosci 12:461–479. [DOI] [PubMed] [Google Scholar]
- Pollok B, Müller K, Aschersleben G, Schnitzler A, Prins W (2004): The role of the primary somatosensory cortex in an auditorily paced finger tapping task. Exp Brain Res 156:111–117. [DOI] [PubMed] [Google Scholar]
- Price CJ, Devlin JT (2011): The interactive account of ventral occipitotemporal contributions to reading. Trends Cogn Sci 15:246–253. [DOI] [PMC free article] [PubMed] [Google Scholar]
- Ramsey NF, van de Heuvel MP, Kho KH, Leijten FSS (2006): Towards human BCI applications based on cognitive brain systems: An investigation of neural signals recorded from the dorsolateral prefrontal cortex. IEEE Trans Neural Syst Rehabil Eng 14:214–217. [DOI] [PubMed] [Google Scholar]
- Rickard TC, Romero SG, Basso G, Wharton C, Flitman S, Grafman J (2000): The calculating brain: An fMRI study. Neuropsychologia 38:325–335. [DOI] [PubMed] [Google Scholar]
- Ritaccio A, Boatman‐Rech D, Brunner P, Cervenka MC, Cole AJ, Crone N, Duckrow R, Korzeniewska A, Litt B, Miller KJ, Moran DW, Parvizi J, Viventi J, Williams J, Schalk G (2011): Proceedings of the second international workshop on advances in electrocorticography. Epilepsy Behav 22:641–650. [DOI] [PMC free article] [PubMed] [Google Scholar]
- Rivera SM, Reiss AL, Eckert MA, Menon V (2005): Developmental changes in mental arithmetic: Evidence for increased functional specialization in the left inferior parietal cortex. Cereb Cortex 15:1779–1790. [DOI] [PubMed] [Google Scholar]
- Romo R, Hernandez A, Zainos A (2004): Neuronal correlates of a perceptual decision in ventral premotor cortex. Neuron 41:165–173. [DOI] [PubMed] [Google Scholar]
- Rutten GJM, van Rijen PC, van Veelen CWM, Ramsey NF (1999): Language area localization with three dimensional functional magnetic resonance imaging matches intrasulcal electrostimulation in Broca's area. Ann Neurol 46:405–408. [DOI] [PubMed] [Google Scholar]
- Scheeringa R, Fries P, Petersson KM, Oostenveld R, Grothe I, Norris DG, Hagoort P, Bastiaansen MCM (2011): Neuronal dynamics underlying high‐ and low‐frequency EEG oscillations contribute independently to the human BOLD signal. Neuron 69:572–583. [DOI] [PubMed] [Google Scholar]
- Shum J, Hermes D, Foster BL, Dastjerdi M, Rangarajan V, Winawer J, Miller KJ, Parvizi J (2013): A brain area for visual numerals. J Neurosci 33:6709–6715. [DOI] [PMC free article] [PubMed] [Google Scholar]
- Siero JC, Hermes D, Hoogduin H, Luijten PR, Petridou N, Ramsey NF (2013): BOLD consistently matches electrophysiology in human sensorimotor cortex at increasing movement rates: A combined 7T fMRI and ECoG study on neurovascular coupling. J Cereb Blood Flow Metab 33:1448–1456. [DOI] [PMC free article] [PubMed] [Google Scholar]
- Simon O, Mangin JF, Cohen L, Le Bihan D, Dehaene S (2002): Topographical layout of hand, eye, calculation, and language‐related areas in the human parietal lobe. Neuron 33:475–487. [DOI] [PubMed] [Google Scholar]
- Simon O, Kherif F, Flandin G, Poline JB, Riviere D, Mangin JF, Le Bihan D, Dehaene S (2004): Automatized clustering and functional geometry of human parietofrontal networks for language, space, and number. NeuroImage 23:1192–1202. [DOI] [PubMed] [Google Scholar]
- Smith EE, Jonides J (1999): Storage and executive processes in the frontal lobes. Science 283:1657–1661. [DOI] [PubMed] [Google Scholar]
- Sun FT, Miller LM, D'Esposito M (2005): Measuring temporal dynamics of functional networks using phase spectrum of fMRI data. NeuroImage 28:227–237. [DOI] [PubMed] [Google Scholar]
- Tao JX, Baldwin M, Hawes‐Ebersole S, Ebersole JS (2007): Cortical substrates of scalp EEG epileptiformic discharges. J Clin Neurophysiol 24:96–100. [DOI] [PubMed] [Google Scholar]
- Tarkiainen A, Helenius P, Hansen PC, Cornelissen PL, Salmelin R (1999): Dynamics of letter string perception in the human occipitotemporal cortex. Brain 122:2119–2131. [DOI] [PubMed] [Google Scholar]
- Twomey T, Kwabata Duncan KJ, Price CJ, Devlin JT (2011): Top‐down modulation of ventral occipito‐temporal responses during visual word recognition. NeuroImage 55:1242–1251. [DOI] [PMC free article] [PubMed] [Google Scholar]
- Van Gelderen P, Duyn JH, Ramsey NF, Liu G, Moonen CT (2012): The PRESTO technique for fMRI. Neuroimage 62:676–681. [DOI] [PMC free article] [PubMed] [Google Scholar]
- Vansteensel MJ, Hermes D, Aarnoutse EJ, Bleichner MG, Schalk G, van Rijen PC, Leijten FS, Ramsey NF (2010): Brain‐computer interfacing based on cognitive control. Ann Neurol 67:809–816. [DOI] [PubMed] [Google Scholar]
- Venkatraman V, Ansari D, Chee MWL (2005): Neural correlates of symbolic and non‐symbolic arithmetic. Neuropsychologica 43:744–753. [DOI] [PubMed] [Google Scholar]
- Wandell BA (2011): The neurobiological basis of seeing words Ann NY Acad Sci 1224:63–80. [DOI] [PMC free article] [PubMed] [Google Scholar]
- Weilke F, Spiegel S, Boecker H, Gräfin von Einsiedel H, Conrad B, Schwaiger M, Erhard P (2001): Time‐resolved fMRI of activation patterns in M1 and SMA during complex voluntary movement. J Neurophysiol 85:1858–1863. [DOI] [PubMed] [Google Scholar]
- Wisdom NM, Mignogna J, Collins RL (2012): Variability in Wechsler Adult Intelligence Scale‐IV subtest performance across age. Arch Clin Neuropsychol 27:389–3978. [DOI] [PubMed] [Google Scholar]
- Wu SS, Chang TT, Majid A, Caspers S, Eickhoff SB, Menon V (2009): Functional heterogeneity of inferior parietal cortex during mathematical cognition assessed with cytoarchitectonic probability maps. Cereb Cortex 19:2930–2945. [DOI] [PMC free article] [PubMed] [Google Scholar]
- Zago L, Pesenti M, Mellet E, Crivello F, Mazoyer B, Tzourio‐Mazoyer N (2001): Neural correlates of simple and complex mental calculation. NeuroImage 13:314–327. [DOI] [PubMed] [Google Scholar]
- Zarnhofer S, Braunstein V, Ebner F, Koschutnig K, Neuper C, Reishofer G, Ischebeck A (2012): The influence of verbalization on the pattern of cortical activation during arithmetic. Behav Brain Funct 8:13. [DOI] [PMC free article] [PubMed] [Google Scholar]