Abstract
Purpose:
To evaluate the feasibility of using Diffusion Tensor Imaging (DTI) to characterize the temporospatial profile of axonal degeneration and its relation to blood-brain-barrier (BBB) permeability.
Materials and Methods:
Longitudinal DTI was performed in Wallerian degeneration slow (WldS) mice following retinal ischemia. In parallel, Gadolinium (Gd)-enhanced T1-weighted imaging (Gd-T1WI) was performed to evaluate BBB permeability in white matter during axonal degeneration. To confirm the in vivo findings, immunohistochemistry using SMI-31 and MBP was performed to examine the axons and myelin, respectively, and Evans Blue was used to evaluate the permeability of the BBB.
Results:
Reduced axial diffusivity was found in the optic nerve (ON, −15%, p=0.0063) one week and optic tact (OT, −18%, p=0.0077) two weeks after retinal ischemia, which were respectively associated with an 11% (p=0.0116) and 25% (p=0.0001) axonal loss. Increased radial diffusivity was found 1–2 weeks after the co-located decrease of axial diffusivity (35% increase, p = 0.0388 in the ON at week 2 and an 80% increase, p = 0.0015 in the OT at week 4). No significant changes were observed using Gd-T1WI (p = 0.13 −0.75), although an approximately 1-fold increase in Evans blue staining intensity was found in the injured ON and OT starting one week after retinal ischemia.
Conclusions:
We demonstrated the utility of DTI to characterize anterograde-propagating axonal degeneration through the ON and OT following retinal damage. Evans blue staining revealed serum albumin accumulation at injured sites, though there was no BBB leakage detectable using Gd-T1WI.
Keywords: Diffusion Tensor Imaging (DTI), Retinal Ischemia, Gd-T1WI, WldS, Mouse, Wallerian Degeneration
Introduction
Axonal degeneration is a common feature of many neurological diseases (1,2). Damage to neuronal cell bodies or axons may trigger axonal degeneration, which can precipitate secondary degeneration along axons toward remote sites. Distinct patterns of degeneration exist and may depend upon the types of nerve fibers and initial causes of damage (3–5). Use of non-invasive tools to characterize patterns of degeneration in disease may provide useful insights into disease course and pathogenesis.
Diffusion Tensor Imaging (DTI) is a clinically available imaging tool, which is sensitive to white matter disruption, including damage to axons (6,7). Although several studies have used DTI to characterize axonal degeneration (8–11), most studies were conducted in humans, with a lack of histological data to confirm the in vivo findings. Furthermore, no studies have yet systematically collected data from multiple locations along fiber tracts during degeneration, making it difficult to derive a spatial profile of axonal degeneration. It is therefore critical to utilize animal models, with histological follow-up, to evaluate the feasibility of using DTI to characterize the temporospatial profile of axonal degeneration.
Among neurological diseases, axonal degeneration in Multiple Sclerosis (MS) is especially critical, as it may lead to permanent disability of patients who initially were in the Relapsing-Remitting status (12). In MS, gadolinium (Gd)-enhanced T1-Weighted Magnetic Resonance Imaging (Gd-T1WI) is routinely used to detect inflammation (13–15). However, focal inflammatory damage in white matter may trigger axonal degeneration, which can spread degenerating lesions to remote sites in the brain (16–18). It is not certain whether the BBB remains intact in regions remote from initial inflammation, considering that cellular debris removal and pro-inflammatory cytokines may take place as a result from local axonal degeneration (19,20). Although studies support the idea that white matter with axonal degeneration does not show enhancement on Gd-T1WI (21,22), data with supportive evidence are limited. It is therefore of interest to use an animal model to explore the changes in BBB permeability using Gd-T1WI in parallel with DTI during white matter axonal degeneration. The purpose of this study is to evaluate the feasibility of using DTI to characterize the temporospatial profile of axonal degeneration and to understand its relation to BBB permeability.
Materials and Methods
Animal groups and treatment methods
This study was conducted in accordance with National Institutes of Health guidelines and Statement for the Use of Animals in Ophthalmic and Visual Research, and was approved by the Institutional Animal Care and Use Committee.
Twenty-eight 8-week-old female Slow Wallerian Degeneration (WldS) mice were used. Transient retinal ischemia was performed on the right eye of each mouse. The detailed procedure was described previously (6,23–25). In brief, animals were anesthetized by 1.5% isoflurane/oxygen using an isoflurane vaporizer (Vet Equip, Pleasanton, CA). The body temperature was maintained using an electric heating pad under a dissecting microscope. A 30 Gauge needle was connected to a saline reservoir hung 1.5 m above the operating table. This needle was inserted into the vitreous space of the right eye for one hour. The left eyes were left intact to serve as the internal control for each animal.
MRI-DTI
Seven mice were used for longitudinal DTI evaluation. Imaging was performed 3 days and 1, 2, and 4 weeks after retina ischemia. Animals were anesthetized using 1.5% isoflurane/oxygen using an isoflurane vaporizer (Vet Equip, Pleasanton, CA). Core body temperature was maintained by a circulating warm water pad. The mouse was placed in a holder to immobilize the head. A 7-cm inner volume coil was used as a transmitter coil and a 1.5-cm inner diameter surface coil was used as a receiver to collect data on a Bruker BioSpec 4.7T small animal MRI instrument.
Spin-echo DTI was performed with repetition time (TR) 2 s, echo time (TE) 29 ms, time between gradients (Δ) 20 ms, gradient duration (δ) 3 ms, and six-direction diffusion scheme with b-values of 0 and 0.85 ms/µm2. Field of view was 1.5 cm x 1.5 cm, and the matrix of 128 × 128 was zero-filled to 256 × 256. Thirteen contiguous slices with 0.5 mm thickness were collected to cover optic nerves and tracts (26). Data were collected three times. An ordinary-least-squares method was used to derive tensors on a voxel-by-voxel basis using software written in Matlab (MathWorks, Natick, MA, USA) (27). The eigenvalues (λ1, λ2, and λ3) of diffusion tensors were used to calculate axial diffusivity (λ||), radial diffusivity (λ⊥), relative anisotropy (RA), and trace of the diffusion tensor (Tr) defined by the following equations:
| [1] |
| [2] |
| [3] |
| [4] |
Gd-T1WI
Omniscan (gadodiamide, GE Healthcare) was mixed with Saline (Lactated Ringer’s Injection, USP) and Heparin (Heparin Sodium Injection, USP) in a 1:2.5:2.5 ratio. A triple dosage of Gd solution (0.3 mmol/kg or ~ 90 µl injection for a 25 g mouse) was injected via a tail vein. At one and four weeks following retinal ischemia, seven mice were anesthetized and placed in a holder to immobilize the head. The 4.7 T MRI, which was used for DTI collection, was not available for use, so a 3-cm volume coil was used to collect data in a Bruker 11.7T small animal MRI instrument. T1 weighted images (T1WIs) were collected using a spin-echo sequence with TR 500 ms and TE 14.5 ms. Nine contiguous slices were gathered with slice thickness of 0.75 mm to cover the left and right optic nerves and tracts. Field of view was 1.5 cm x 1.5 cm, and the matrix of 128 × 128 was zero-filled to 256 × 256. T1WIs were acquired before and 5 minutes after the Gd injection. In addition to T1WIs, a T2-weighted Rapid Acquisition with Refocused Echoes (RARE) with TR 1s, echo train 4, and effective TE of 28 ms were collected with geometric parameters matching T1WIs to provide images to visualize the ON and OT (28).
Regions of Interest (ROI) Analysis
From our DTI data, regions of interest (ROIs) including the ON and OT were selected manually using RA and λ⊥ maps. The ON and OT appear bright on RA and dark on λ⊥ in comparison to neighboring CSF and grey matter. In both healthy and injured conditions, the intensity contrast remained suitable for ROI selections (Figure 1). For Gd-T1WI measurements, selections were performed using RARE images collected immediately prior to the Gd-T1WI scan. Using RARE images, white matter from the ON and OT was identified based on intensity contrast, with white matter appearing darker than surrounding grey matter and CSF. For each ROI, only the central portion of the ON and OT was selected. For the ON, ROIs were selected from the central 2×2 −3×3 portion of voxels. Each ON measurement is composed of selections from two contiguous slices. For the OT, the central 25–30 voxels were selected. ROI analysis was performed in a blind fashion by J. Mei and C. Nishioka; both have more than 3 years of experience in mouse brain imaging (27,29,30).
Figure 1.
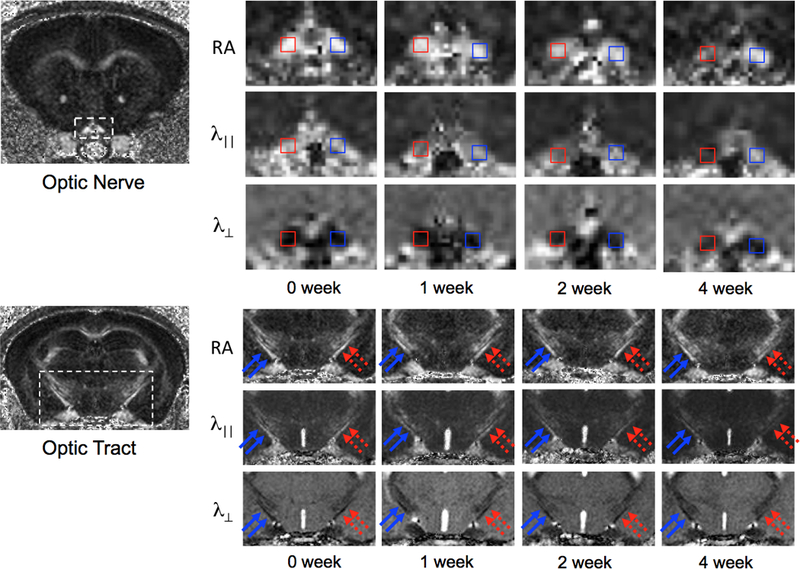
DTI maps of ON and OT in mice after retinal ischemia. Because the majority of RGC axons project to the opposite hemisphere of the brain, damage in the right ON (red, top panel) is associated with damage in the left OT (dashed red arrows, lower panel), showing gradual decreases in RA and λ||, and gradual increases in λ⊥ over time.
Evans Blue Assessments
Mice 1, 2, and 4 weeks after retinal ischemia (N = 7) received a tail vein injection at a dosage of 1 mL/Kg of 2% Evans Blue tracer (E-2129, Sigma, St. Louis, MO) dissolved in normal saline. One hour after the injection, animals were anesthetized and transcardially perfused with PBS followed by formalin. The brains were quickly removed, post-fixed for 1 hour then sunk in 30% sucrose. Brain blocks were snap-frozen in dry ice. For each mouse brain, 2-mm blocks anterior and posterior to Bregma were cut for sections of optic nerve and optic tracts, respectively. Cryostat sections with 20-µm thickness were prepared for fluorescent microscopy. An Olympus FluoView Confocal microscope with laser wavelength of 620 nm was used to examine the brain sections. The Evans Blue extravasation was quantified by measuring signal intensity using ImageJ software.
Immunohistochemistry of SMI-31, MBP and Iba1
A 4-mm-thick coronal section (−1 to +3 mm of Bregma) was obtained from each brain and embedded in paraffin. The integrity of axons was evaluated using a primary antibody against phosphorylated neurofilament (pNF, SMI-31, 1:1000; Sternberger Monoclonals, Lutherville, Maryland), and myelin integrity was assessed with a primary antibody against myelin basic protein (MBP, 1:250; Zymed Laboratories Inc., South San Francisco, CA) at 4°C overnight (6). Following three 5 minute washes in PBS, sections were incubated in fluorescent secondary antibodies for one hour at room temperature (1:200, anti-mouse conjugated to Alexa 488 for SMI-31, 1:200, anti-rabbit conjugated to Texas red for MBP; Molecular Probes). The ionized calcium-binding adapter molecule 1 (Iba1) was used to evaluate macrophages / microglia. Brain slices were cut on a microtome at 5uM. Sections were incubated with primary antibody (Wako Rabbit anti-Iba1, 0.25 ug/mL) overnight at room temperature. Sections were then washed with PBS, and incubated in biotinylated secondary antibody (Vector) for 30 minutes. Sections were then washed, and incubated in strepavadin-HRP (Vector) for 30 minutes. After washing, sections were developed with DAB substrate.
Histological sections were examined using an Olympus Fluoview Confocal Microscope equipped with a 60× oil objective by H. Liang, who has more than 5 years of experience of microscopic imaging (26). Under a microscope, images were taken from the central portions of the left and right ON and OT respectively. The positively labeled axons were counted through the central 100 × 100 µm2 region.
Statistical Analysis
Data are presented as mean ± standard deviation. The multiple comparisons were performed using one-way analysis of variance (ANOVA) followed by the post-hoc Holm-Sidak test. Data analysis was conducted using Sigma Plot 11.0 (San Jose, CA). p < 0.05 was considered to be statistically significant.
Results
In vivo DTI Findings
The ROI measurements from the ON and OT after retinal ischemia were summarized in Figure 2B. In the ON, λ|| decreased 15% (p = 0.0063) at one week and gradually reached a 30% reduction (p < 0.0016) by four weeks. The changes in λ|| were delayed in the OT, which did not show significant changes at one week. The reduction was significant beginning at two weeks, with a decrease in λ|| of 18% (p = 0.0077), with a reduction of λ|| reaching 25% (p = 0.0001) at four weeks.
Figure 2.
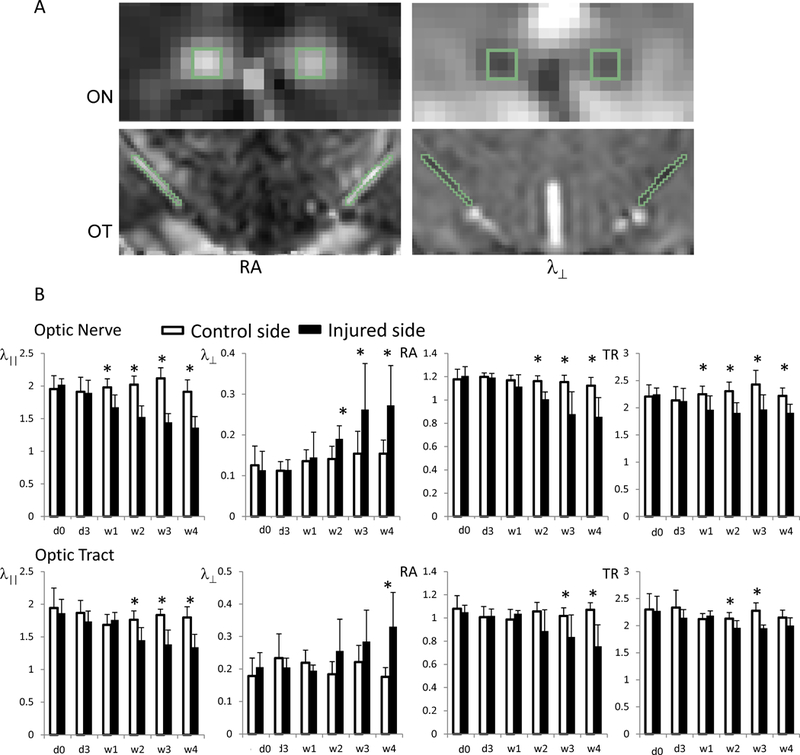
DTI indices of ON and OT in mice after retinal ischemia. The top panel (A) shows an example of ROI selections from the ON and OT on RA and λ⊥ maps. ON and OT appear bright on RA and dark on λ⊥ maps. ROIs were selected in the central portion of ON and OT using synchronized tracing on RA and λ⊥. The bottom panel (B) shows a summary of the measurements. The injured ON and OT (black bars) showed gradual decreases in RA and λ||, and gradual increases in λ⊥ relative to controls. The changes in ON occur 1 – 2 weeks before changes manifest in the OT. The value unit for λ||, λ⊥, and TR is µm2/s. RA is unitless. The “*” indicates significant differences with p < 0.05, compared to the controls.
The increase of λ⊥ was found 1–2 weeks after the co-located decrease of λ||. In the ON, λ⊥ did not show a significant change at one week, but increased 35% (p = 0.0388) at two weeks and gradually increased 80–90% (p < 0.0442) above control levels after 3–4 weeks. In the OT, no significant changes in λ⊥ were observed before three weeks. However, an 80% increase of λ⊥ (p = 0.0015) was measured four weeks after retinal ischemia.
Immunohistochemistry of SMI-31 and MBP
The immunohistochemical examination using SMI-31 showed that axonal density was reduced by 11% (p = 0.0116), 23% (p = 0.0003), and 41% (p = 0.0013) in the injured ON at one, two, and four weeks after retinal ischemia, respectively. In the OT, axonal density was not changed after one week, but was reduced by 9% (p = 0.0056) and 39% (p = 0.0091) at two and four weeks after retinal ischemia (Figure 3). The immunohistochemical examinations using MBP showed no significant changes in the ON and OT before one and two weeks after retinal ischemia, but showed ~30% reduction (p = 0.0001 in ON and p = 0.0086 in OT) of myelinated axon counts in both regions of WldS mice four weeks after retinal ischemia (Figure 4).
Figure 3.
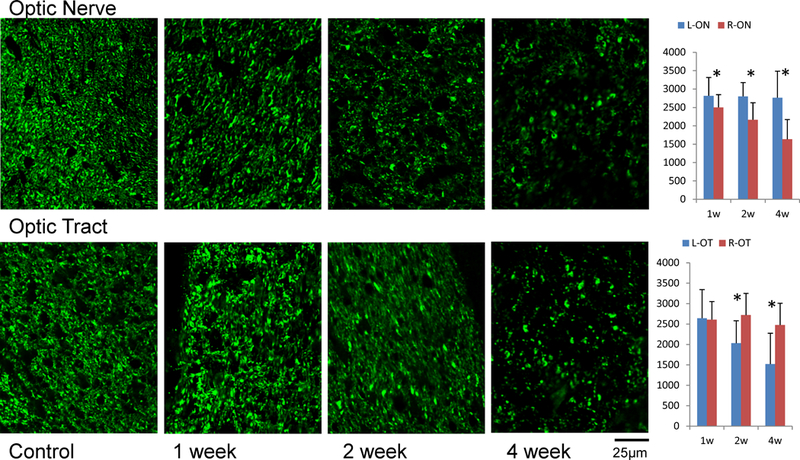
SMI-31 immunohistochemistry in the ON and OT after retinal ischemia. The density of SMI-31 positive axons (axon counts in 100×100 µm2) is summarized in the bar graphs (right, N = 7). The “*” indicates significant changes with p < 0.05. The right ON and left OT showed degeneration as gradual loss of SMI-31 examined at 1, 2, and 4 weeks after retinal ischemia. The loss of axons was significant in the ON beginning at week 1, but gained significance in the OT after two weeks.
Figure 4.
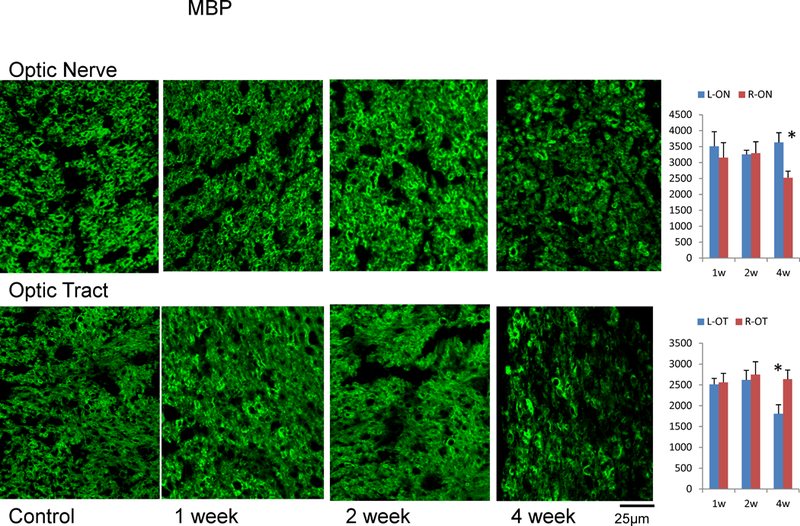
MBP immunohistochemistry in ON and OT after retinal ischemia. The density of MBP positive axons (axon counts in 100×100 µm2) was summarized in bar graphs. The “*” indicates significant changes with p < 0.05. Both ON and OT showed significant myelin loss four weeks after retinal ischemia.
Gd-T1WI
There was no noticeable signal enhancement in the brain after Gd-T1WI at any time point after retinal ischemia (Figure 5). Our ROI analysis found no changes in enhancement within the injured ON and OT, compared to controls. Outside the brain, noticeable enhancement was present in several regions, including the pharyngeal wall, which showed a 4 – 6 -fold increase (p = 0.0001) in signal enhancement (Figure 5D).
Figure 5.
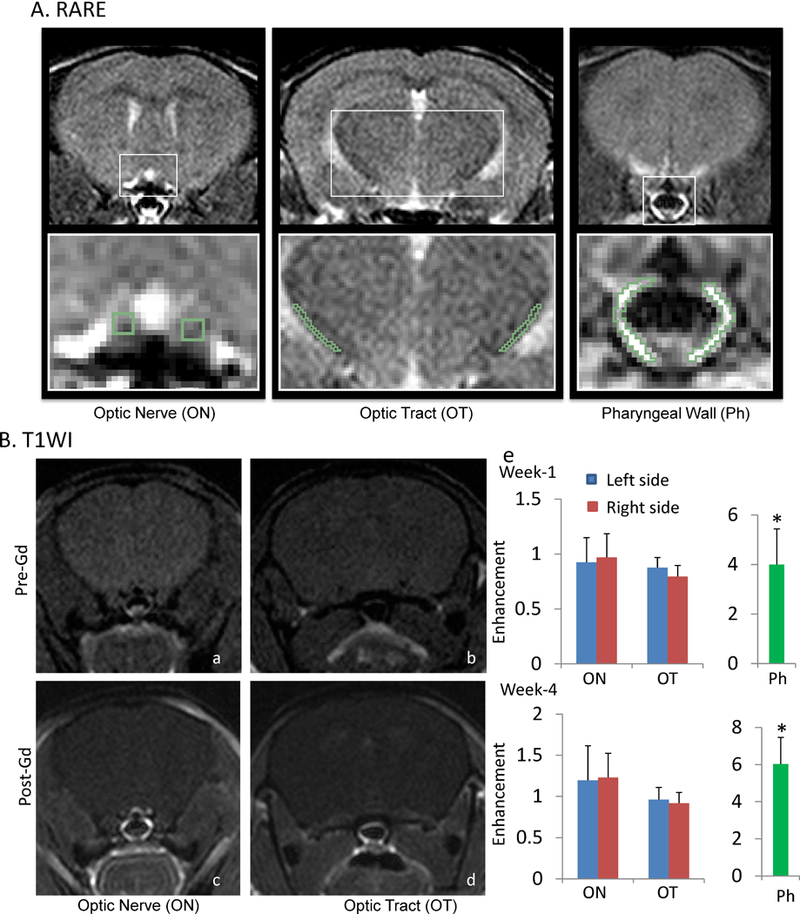
Gd-T1WI of mice after retinal ischemia. Panel A shows examples of RARE images, which provide contrast between grey matter, white matter, and CSF, allowing identification of the ON and OT. Panel B shows examples of T1WI images before and after Gd injection. Pictures a and c contain ON, and pictures b and d contain OT. There was no noticeable enhancement in the brain, including either in the ON or OT (e). Noticeable enhancement was found in several regions outside the brain, including the pharyngeal wall, which showed a 4 – 6 -fold enhancement over baseline (e). “*” indicates p<0.05.
Evans Blue staining
As shown in Figure 6, the injured ON and OT showed a 1 – 2 -fold increase in staining intensity compared to controls beginning one week after retinal ischemia. These differences were statistically significant in the damaged ON at 2 weeks and damaged OT at 1 and 2 weeks after retinal ischemia.
Figure 6.
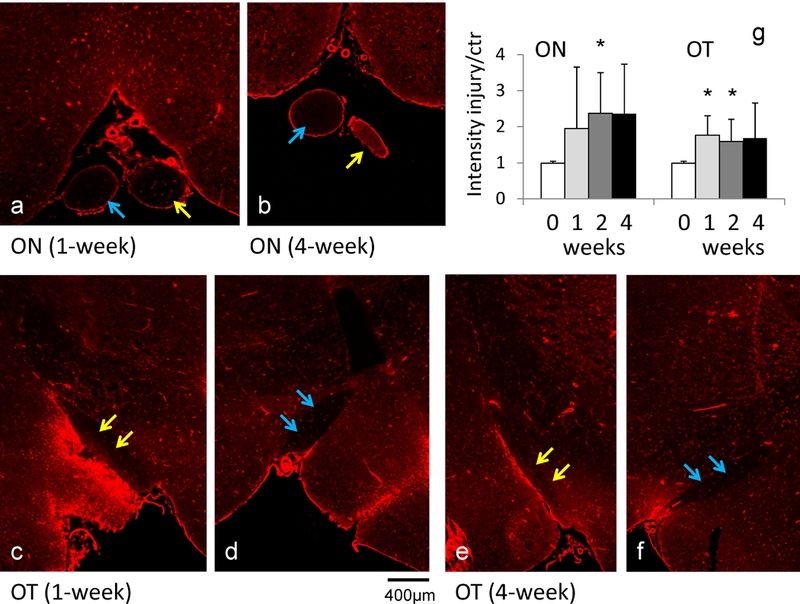
Evans blue staining (a - f) of the ON and OT after retinal ischemia. Evans blue dye detects the presence of albumin. The injured ON (yellow arrows in a and b) and injured OT (yellow arrows in c and e) showed stronger signal than the contralateral ON (blue arrows in a and b) and OT (blue arrows in d and f), respectively. The signal intensity analysis (g) showed increased signal in the injured ON and OT beginning one week after retinal ischemia. The “*” indicates p < 0.05 compared to controls.
Iba1
As shown in Figure 7, slightly enhanced coverage of Iba1 was found in the injured ON and OT two weeks after retinal ischemia. This elevation of Iba1 reached significance (~ 4-fold increase) after four weeks in both the ON and OT.
Figure 7.
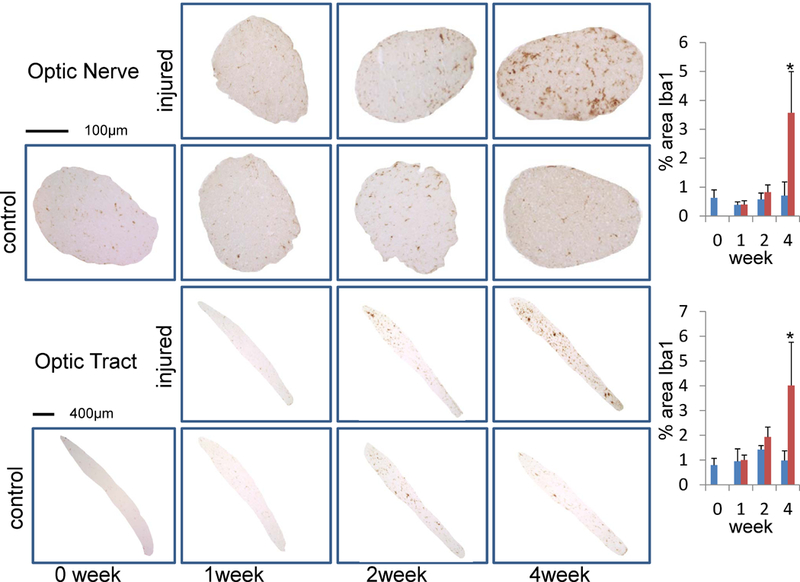
Iba1 staining in ON and OT after retinal ischemia. The percent area of Iba1 positive microglia is summarized in bar graphs (right). The “*” indicates significant changes with p < 0.05. Both ON and OT showed significant increases of Iba1 staining four weeks after retinal ischemia.
Discussion
Decreases in λ|| followed by increases in λ⊥ have been reported to detect axonal and myelin damage in white matter with axonal degeneration (6,25,31). Using WldS mice, we also observed the same DTI changes in ON and OT after retinal ischemia. The damage to axons followed by a co-located myelin loss were detected by DTI and confirmed by histology. This pattern of observed DTI changes reveals the temporal evolution of pathology during and following acute axonal degeneration. The same array of DTI changes have also been reported in humans during Wallerian degeneration (8–11), suggesting some commonalities in axonal degeneration across diseases and species.
In addition to characterizing the temporal evolution of axonal degeneration, it is also important to understand its spatial evolution. Both ON and OT contain axons originated from the same neuronal cells in retina. We have previously attempted to use DTI to track degeneration in the ON and OT after retinal ischemia. Using wild type mice, we found that both the ON and OT exhibited axon disruption concurrently three days after retinal ischemia (6,25,31). This rapid degeneration did not allow us to differentiate the regional variation between the ON and OT. This fast form of degeneration in mice may not reflect the slower process of axonal degeneration in the human CNS (5,32).
In our experiment using WldS mice, the axonal damage in the OT (the distal portion of RGC axons) was detected a week after axonal damage in the ON (a proximal portion of RGC axons), suggesting anterograde degeneration propagating from cell bodies toward the axonal terminals. From our MRI data, we estimate the distance from the retina to the ON ROI to be 4 mm, which is roughly equal to the distance between the ON ROI and the OT ROI. We estimate the speed of degeneration to be roughly 0.57 mm per day (8 mm / 2 weeks for degeneration arrived at OT, which is equal to 4 mm / 1 week for degeneration arrived at ON).
Several studies have attempted to characterize the spatial-temporal profile of axonal degeneration. In vitro work by George et. al. examined granular disintegration of the cytoskeleton in a rat dorsal radiculotomy model and estimated a degeneration speed of ~ 3 mm/hr along axons emanating from the initial damage sites (4). Data by Öztürk et. al. supports the idea that there are distinct axonal degeneration patterns, either with fragmentation or retraction steps during dying-back degeneration. These patterns were related to the survival or death of the neuronal cells (3). As such, different spatial patterns of axonal degeneration may represent pathways critical to neuronal fate in neurodegenerative conditions. Our study does not intend to predict axonal degeneration rates in humans based on our animal data. Instead, our study illustrates the possibility of using longitudinal DTI to characterize ongoing axonal degeneration and to differentiate subtypes of neurodegenerative conditions. This characterization may allow for differentiation from occurrences of ‘dying back’ degeneration, which has been implicated in several diseases including Amyotrophic Lateral Sclerosis (ALS) (33).
In MS, Gd-T1WI is routinely used to detect active inflammatory lesions. While focal damage can precipitate axonal degeneration towards remote brain areas, white matter with axonal degeneration is generally considered to appear normal without enhancement on Gd-T1WI (21,22). As predicted, we found no visible enhancement within the injured ON and OT after retinal ischemia. However, when the tissue was examined using Evans Blue, higher signal was observed, suggesting an infiltration and accumulation of serum albumin into the damaged white matter. To explain this, we note that several studies have confirmed that extensive inflammatory activities exist in damaged white matter without causing enhancement on Gd-T1WI (34,35). Albumin is long known to be one of the acute-phase proteins in response to inflammation (36). As its key functions involve wound healing (37), we speculate that albumin may be transported into the injured sites for tissue repair.
Previous studies have suggested that microglia/macrophage activity in axonal degeneration within the CNS is delayed compared to degeneration in the peripheral nervous system (PNS) (4,22,38). As such, the delayed microglia/macrophage activity in our study did not surprise us. It is noted that even when significant microglia/macrophage activity was detected at the final time point, there was still no BBB leakage detectable by Gd-T1WI. Our data supports the view that BBB permeability remains low in white matter with extensive axonal degeneration and inflammation. According to our results, it seems likely that Gd-T1WI can specifically detect initial autoimmune lesions in MS without confounding factors from secondary axonal degeneration.
While our study demonstrates the capability of DTI to characterize the temporospatial profile of axonal degeneration, limitations must be considered before generalizing our results to other models systems and human disease. Our study was conducted using WldS mice, which show delayed axonal degeneration (39,40). This form of degeneration is more gradual than the rapid process in wildtype mice and may reflect different underlying mechanisms. Considerations of our procedure are also relevant to interpreting the results. Within our experimental procedure, ROI selections were made by two experienced operators manually. Studies using more objective approaches, such as automatic white matter segmentation (41), as well as with a larger amount of samples, may provide data to better describe the temporospatial profiles of degeneration. Further research is required for understanding to what degree our findings can be generalized to other white matter pathways in wild type mice and in conditions of human disease.
In conclusion, using longitudinal DTI on ON and OT of mice after retinal ischemia, decreased λ|| followed by increased λ⊥ were observed and these changes were associated with the axonal damage followed by myelin loss. The early ON damage followed by OT damage shows the spatial evolution of axonal degeneration that propagates from cell bodies to distal axonal terminals. Injured white matter within the ON and OT appear normal on Gd-T1WI, which is consistent with clinical findings in MS. While the BBB remains tight, infiltration and accumulation of albumin detectable by Evans Blue suggests an early inflammatory response in the degenerating nerves.
Acknowledgments:
This work was supported in part by NIH R01 NS062830 and the National Space Biomedical Research Institute (RE03701) through National Aeronautics and Space Administration NCC 9–58. We also thank the insightful comments from Dr. Wei-Xing Shi and Dr. Anatol Manaenko (Loma Linda University).
Grant Support: NIH R01 NS062830 and the National Space Biomedical Research Institute (RE03701) through National Aeronautics and Space Administration NCC 9–58.
References
- 1.Coleman MP, Perry VH. Axon pathology in neurological disease: a neglected therapeutic target. Trends Neurosci 2002;25(10):532–537. [DOI] [PubMed] [Google Scholar]
- 2.Coleman M. Axon degeneration mechanisms: commonality amid diversity. Nat Rev Neurosci 2005;6(11):889–898. [DOI] [PubMed] [Google Scholar]
- 3.Ozturk G, Cengiz N, Erdogan E, et al. Two distinct types of dying back axonal degeneration in vitro. Neuropathol Appl Neurobiol 2013;39(4):362–376. [DOI] [PubMed] [Google Scholar]
- 4.George R, Griffin JW. Delayed macrophage responses and myelin clearance during Wallerian degeneration in the central nervous system: the dorsal radiculotomy model. Exp Neurol 1994;129(2):225–236. [DOI] [PubMed] [Google Scholar]
- 5.Vargas ME, Barres BA. Why is Wallerian degeneration in the CNS so slow? Annu Rev Neurosci 2007;30:153–179. [DOI] [PubMed] [Google Scholar]
- 6.Sun SW, Liang HF, Cross AH, Song SK. Evolving Wallerian degeneration after transient retinal ischemia in mice characterized by diffusion tensor imaging. Neuroimage 2008;40(1):1–10. [DOI] [PMC free article] [PubMed] [Google Scholar]
- 7.Nishioka C, Poh C, Sun SW. Diffusion tensor imaging reveals visual pathway damage in patients with mild cognitive impairment and Alzheimer’s disease. J Alzheimers Dis 2015;45(1):97–107. [DOI] [PMC free article] [PubMed] [Google Scholar]
- 8.Thomalla G, Glauche V, Koch MA, Beaulieu C, Weiller C, Rother J. Diffusion tensor imaging detects early Wallerian degeneration of the pyramidal tract after ischemic stroke. Neuroimage 2004;22(4):1767–1774. [DOI] [PubMed] [Google Scholar]
- 9.Thomalla G, Glauche V, Weiller C, Rother J. Time course of wallerian degeneration after ischaemic stroke revealed by diffusion tensor imaging. J Neurol Neurosurg Psychiatry 2005;76(2):266–268. [DOI] [PMC free article] [PubMed] [Google Scholar]
- 10.Pierpaoli C, Barnett A, Pajevic S, et al. Water diffusion changes in Wallerian degeneration and their dependence on white matter architecture. Neuroimage 2001;13(6 Pt 1):1174–1185. [DOI] [PubMed] [Google Scholar]
- 11.Werring DJ, Toosy AT, Clark CA, et al. Diffusion tensor imaging can detect and quantify corticospinal tract degeneration after stroke. J Neurol Neurosurg Psychiatry 2000;69(2):269–272. [DOI] [PMC free article] [PubMed] [Google Scholar]
- 12.Bjartmar C, Kidd G, Mork S, Rudick R, Trapp BD. Neurological disability correlates with spinal cord axonal loss and reduced N-acetyl aspartate in chronic multiple sclerosis patients. Ann Neurol 2000;48(6):893–901. [PubMed] [Google Scholar]
- 13.Gonzalez-Scarano F, Grossman RI, Galetta S, Atlas SW, Silberberg DH. Multiple sclerosis disease activity correlates with gadolinium-enhanced magnetic resonance imaging. Ann Neurol 1987;21(3):300–306. [DOI] [PubMed] [Google Scholar]
- 14.McDonald WI, Compston A, Edan G, et al. Recommended diagnostic criteria for multiple sclerosis: guidelines from the International Panel on the diagnosis of multiple sclerosis. Ann Neurol 2001;50(1):121–127. [DOI] [PubMed] [Google Scholar]
- 15.Polman CH, Reingold SC, Banwell B, et al. Diagnostic criteria for multiple sclerosis: 2010 revisions to the McDonald criteria. Ann Neurol 2011;69(2):292–302. [DOI] [PMC free article] [PubMed] [Google Scholar]
- 16.Trapp BD, Peterson J, Ransohoff RM, Rudick R, Mork S, Bo L. Axonal transection in the lesions of multiple sclerosis. N Engl J Med 1998;338(5):278–285. [DOI] [PubMed] [Google Scholar]
- 17.Kornek B, Storch MK, Weissert R, et al. Multiple sclerosis and chronic autoimmune encephalomyelitis: a comparative quantitative study of axonal injury in active, inactive, and remyelinated lesions. Am J Pathol 2000;157(1):267–276. [DOI] [PMC free article] [PubMed] [Google Scholar]
- 18.Roosendaal SD, Geurts JJ, Vrenken H, et al. Regional DTI differences in multiple sclerosis patients. Neuroimage 2009;44(4):1397–1403. [DOI] [PubMed] [Google Scholar]
- 19.Be’eri H, Reichert F, Saada A, Rotshenker S. The cytokine network of wallerian degeneration: IL-10 and GM-CSF. Eur J Neurosci 1998;10(8):2707–2713. [PubMed] [Google Scholar]
- 20.Shamash S, Reichert F, Rotshenker S. The cytokine network of Wallerian degeneration: tumor necrosis factor-alpha, interleukin-1alpha, and interleukin-1beta. J Neurosci 2002;22(8):3052–3060. [DOI] [PMC free article] [PubMed] [Google Scholar]
- 21.Ciccarelli O, Werring DJ, Barker GJ, et al. A study of the mechanisms of normal-appearing white matter damage in multiple sclerosis using diffusion tensor imaging--evidence of Wallerian degeneration. J Neurol 2003;250(3):287–292. [DOI] [PubMed] [Google Scholar]
- 22.Avellino AM, Hart D, Dailey AT, MacKinnon M, Ellegala D, Kliot M. Differential macrophage responses in the peripheral and central nervous system during wallerian degeneration of axons. Exp Neurol 1995;136(2):183–198. [DOI] [PubMed] [Google Scholar]
- 23.Song SK, Sun SW, Ju WK, Lin SJ, Cross AH, Neufeld AH. Diffusion tensor imaging detects and differentiates axon and myelin degeneration in mouse optic nerve after retinal ischemia. Neuroimage 2003;20(3):1714–1722. [DOI] [PubMed] [Google Scholar]
- 24.Xie M, Wang Q, Wu TH, Song SK, Sun SW. Delayed axonal degeneration in slow Wallerian degeneration mutant mice detected using diffusion tensor imaging. Neuroscience 2011;197:339–347. [DOI] [PMC free article] [PubMed] [Google Scholar]
- 25.Sun SW, Liang HF, Le TQ, Armstrong RC, Cross AH, Song SK. Differential sensitivity of in vivo and ex vivo diffusion tensor imaging to evolving optic nerve injury in mice with retinal ischemia. Neuroimage 2006;32(3):1195–1204. [DOI] [PubMed] [Google Scholar]
- 26.Sun SW, Liang HF, Schmidt RE, Cross AH, Song SK. Selective vulnerability of cerebral white matter in a murine model of multiple sclerosis detected using diffusion tensor imaging. Neurobiol Dis 2007;28(1):30–38. [DOI] [PMC free article] [PubMed] [Google Scholar]
- 27.Sun SW, Mei J, Tuel K. Comparison of mouse brain DTI maps using K-space average, image-space average, or no average approach. Magn Reson Imaging 2013;31(9):1532–1536. [DOI] [PMC free article] [PubMed] [Google Scholar]
- 28.Mulkern RV, Wong ST, Winalski C, Jolesz FA. Contrast manipulation and artifact assessment of 2D and 3D RARE sequences. Magn Reson Imaging 1990;8(5):557–566. [DOI] [PubMed] [Google Scholar]
- 29.Sun SW, Liang HF, Mei J, Xu D, Shi WX. In vivo diffusion tensor imaging of amyloid-beta-induced white matter damage in mice. J Alzheimers Dis 2014;38(1):93–101. [DOI] [PMC free article] [PubMed] [Google Scholar]
- 30.Sun SW, Nishioka C, Labib W, Liang HF. Axonal Terminals Exposed to Amyloid-beta May Not Lead to Pre-Synaptic Axonal Damage. J Alzheimers Dis 2015;45(4):1139–1148. [DOI] [PMC free article] [PubMed] [Google Scholar]
- 31.Sun SW, Liang HF, Xie M, Oyoyo U, Lee A. Fixation, not death, reduces sensitivity of DTI in detecting optic nerve damage. Neuroimage 2009;44(3):611–619. [DOI] [PubMed] [Google Scholar]
- 32.Kuhn MJ, Mikulis DJ, Ayoub DM, Kosofsky BE, Davis KR, Taveras JM. Wallerian degeneration after cerebral infarction: evaluation with sequential MR imaging. Radiology 1989;172(1):179–182. [DOI] [PubMed] [Google Scholar]
- 33.Karlsborg M, Rosenbaum S, Wiegell M, et al. Corticospinal tract degeneration and possible pathogenesis in ALS evaluated by MR diffusion tensor imaging. Amyotroph Lateral Scler Other Motor Neuron Disord 2004;5(3):136–140. [DOI] [PubMed] [Google Scholar]
- 34.Moll NM, Rietsch AM, Thomas S, et al. Multiple sclerosis normal-appearing white matter: pathology-imaging correlations. Ann Neurol 2011;70(5):764–773. [DOI] [PMC free article] [PubMed] [Google Scholar]
- 35.De Groot CJ, Bergers E, Kamphorst W, et al. Post-mortem MRI-guided sampling of multiple sclerosis brain lesions: increased yield of active demyelinating and (p)reactive lesions. Brain 2001;124(Pt 8):1635–1645. [DOI] [PubMed] [Google Scholar]
- 36.Gabay C, Kushner I. Acute-phase proteins and other systemic responses to inflammation. N Engl J Med 1999;340(6):448–454. [DOI] [PubMed] [Google Scholar]
- 37.Kobayashi N, Nagai H, Yasuda Y, Kanazawa K. The early influence of albumin administration on protein metabolism and wound healing in burned rats. Wound Repair Regen 2004;12(1):109–114. [DOI] [PubMed] [Google Scholar]
- 38.Lazar DA, Ellegala DB, Avellino AM, Dailey AT, Andrus K, Kliot M. Modulation of macrophage and microglial responses to axonal injury in the peripheral and central nervous systems. Neurosurgery 1999;45(3):593–600. [DOI] [PubMed] [Google Scholar]
- 39.Coleman MP, Freeman MR. Wallerian degeneration, wld(s), and nmnat. Annu Rev Neurosci 2010;33:245–267. [DOI] [PMC free article] [PubMed] [Google Scholar]
- 40.Beirowski B, Adalbert R, Wagner D, et al. The progressive nature of Wallerian degeneration in wild-type and slow Wallerian degeneration (WldS) nerves. BMC Neurosci 2005;6:6. [DOI] [PMC free article] [PubMed] [Google Scholar]
- 41.Sun SW, Song SK, Hong CY, Chu WC, Chang C. Directional correlation characterization and classification of white matter tracts. Magn Reson Med 2003;49(2):271–275. [DOI] [PubMed] [Google Scholar]


