Abstract
Low cost, miniaturized assay platforms that work with small sample volumes, high sensitivity and rapid detection will have high value in future biomolecular diagnostics. Herein we report an automated, 3D printed electrochemiluminescent (ECL) immunoarray integrated with a nanostructured pyrolytic graphite sheet (PGS) microwell chip configured to detect 2 proteins simultaneously from complex liquid samples with high sensitivity and selectivity. Assays are done in 18 min at cost of < $1.00 using 1–2 microliters of sample. 3D printed microfluidic array design integrates reagent and sample chambers with rapid ECL detection. A commercial programmable syringe pump used with a preset program allows pump to pause and resume reagent delivery as required for completion of the sandwich immunoassays. Nanostructured surfaces feature antibody-decorated single wall carbon nanotube forests on PGS chip microwells, and sensitivity is amplified via massively labeled RuBPY-silica nanoparticles for detection. Prostate specific antigen (PSA) and prostate specific membrane antigen (PSMA) were measured simultaneously from human serum on the immunoarray with detection limits 150 fg mL−1 for PSA and 230 fg mL−1 for PSMA, with dynamic ranges up to 5 ng mL−1. Validation of the immunoarray by measuring these proteins in human serum showed good correlation with single protein ELISA. These 3D printed platforms can be easily adapted to multiple applications and configurable CAD files for the immunoarray can be downloaded from our lab’s website.
Graphical Abstract
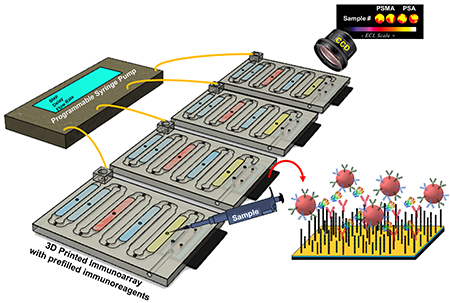
A 3D-printed microfluidic array detects 2 proteins in 4 samples at very low cost with downloadable plans
Introduction
Reliable bioanalytical devices that offer automated, low cost, highly sensitive, multiplexed assays for protein detection in the clinic are lacking. Quantifying proteins in most diagnostic situations typically involves sending sample to a central laboratory and a several day waiting period. Single-protein platforms like ELISA are labor intensive, time consuming, relative expensive, and require significant sample volume.1,2Modern instruments for multiplexed protein assays and protein counting involve considerable cost and require relatively skilled operators.3-7Thus, there is a need for automated, miniaturized, fast, sensitive, low cost immunoarrays for protein analyses, particularly for clinical diagnostics and for research labs using protein assays. This technical note describes such an array with a microfluidic device that can be downloaded from a website and 3D-printed, assembled with an easily fabricated detection chip, and used to measure 2 or more proteins in 4 samples at a time. The system requires a programmable syringe pump for automation and a low-light sensitive CCD camera for detection.
Additive manufacturing, or 3D printing, enables facile low cost fabrication of custom objects by non-experts, and is beginning to play a very significant role in manufacturing.8,9 Stereolithographic (SLA) printers utilize laser-assisted polymerization to print clear plastic objects. Thus arrays suitable for light detection can be printed, and can be improved by simple post-processing to high transmittance suitable for electrochemiluminescent (ECL) detection.10
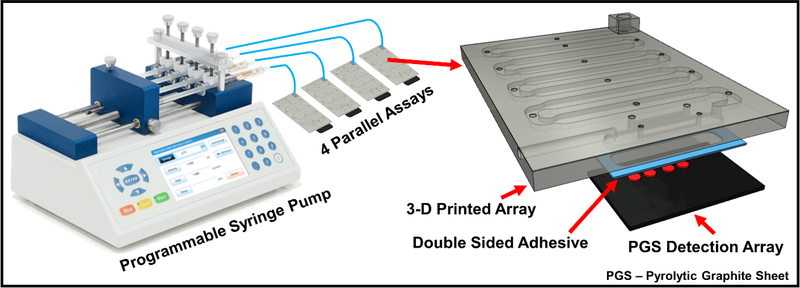
We recently reported a fully automated 3D-printed microfluidic immunoarray with 16 microwells containing capture antibodies attached to single-wall carbon nanotubes and utilizing RuBPY-silica nanoparticles coated with detection antibodies for detection of proteins by ECL.11 In the present technical note, we report a simplified version of this 16-microwell array automated with a programmable syringe pump to achieve 4 simultaneous 2-protein assays, Fig. 1. The 16 microwell array utilized an lab-built integrated microcontroller-micropump system with touch screen interface for fully automated immunoassay in portable applications. The array in the present technical note is a compact (3 × 4 × 0.3 cm) for lower reagent use, operated simply with commercial equipment. Here we demonstrate simultaneous detection of two proteins in duplicate in four, 1 μL serum samples in 18 min for less than $1.00 in reagents.
Fig. 1.
Programmable pump configured for four parallel immunoassays on microfluidic immunoarrays (on left) and a model of the compact 3D-printed immunoarray (on right) attached to a pyrolytic graphite sheet (PGS) 4-microwell detection array.
Experimental
Chemicals and Materials.
Pyrolytic graphite sheets (PGS) were from Panasonic Industrial Devices and Solutions (EYGS121807), and clear resin (GCPL02) from Formlabs (Somerville, MA). Pure prostate specific antigen (PSA, P3235) was from Sigma-Aldrich and prostate specific membrane antigen (PSMA) was from Novus Biologicals. Anti-PSA capture (M0-T40081A) and detection antibodies (M0-T40081B), and anti-PSMA capture (MO-T40086A) and detection antibodies (MO-T40086B) were from Anogen. Single protein ELISA kit for PSA (RAB0331) was from Sigma-Aldrich and PSMA ELISA kit (EL008782HU-96) was from Lifeome Biolabs/Cusabio. Human serum samples were obtained by George Washington University Hospital under ethical approval from Univ. of CT IRB. RuBPY silica nanoparticles used as detection labels were synthesized as described previously12 with average diameter of 115 ± 13 nm (Fig. S1). RuBPY silica nanoparticles were coated with layers of polydiallyldimethylammonium chloride (PDDA) and poly(acrylic acid) (PAA), and then were covalently linked to detection antibodies (Ab2) using 1-(3-(dimethylamino)propyl)-3-ethylcarbodiimidehydrochloride (EDC) and N-hydroxysulfosuccinimide (NHSS) as described previously.13 RuBPY-silica detection nanoparticles were decorated with two different types of antibodies, PSA (PSA-Ab2) and PSMA (PSMA-Ab2). Optimized Ab2 concentrations of 8 μg mL−1 for both anti-PSA and anti-PSMA were used to make the RuBPY-SiNP-Ab2 conjugate, and the Ab2/ RuBPY–SiNP ratio was measured at 38:1 using the BCA total protein assay.14 All immunoreagents were dissolved in pH 7.2 phosphate buffered saline (PBS). Co-reactant solution for ECL was 500 mM tripropylamine (TrPA) with 0.05% Tween-20 (T20) and 0.05% Triton-X in 0.2 M PBS.
The immunoarray was 3D printed on a Form 1+ SLA printer from Formlabs (Somerville, MA). A computer aided design (CAD) with required features were generated using 123D design software (Autodesk), Fig. 2 then converted to 3D printer compatible file. After printing arrays were immediately sonicated in isopropanol for 15 min to remove uncured resin. Dried arrays were coated with clear acrylic spray (Krylon™) and air dried to improve optical transparency.
Fig. 2.
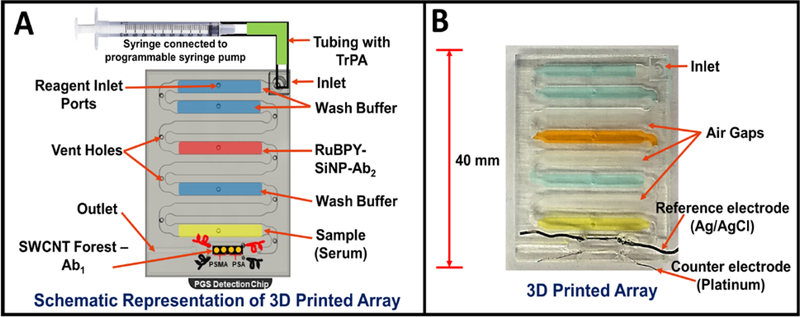
Representations of 3D printed array filled with reagents needed for sandwich immunoassay. (A) Model of array with labeled reagent chambers connected to 4 microwell pyrolytic graphite (PGS) detection chip. Programmable pump connected to the microfluidic array via inlet port to sequentially deliver chamber contents to complete the sandwich immunoassay. (B) Photograph of a 3D printed microfluidic array and fluidic chambers filled with colored dyes for visualization.
Microfluidic immunoarray features a unibody design with microfluidic channels and chambers to hold reagents and sample (Fig. 2A). Each immunoarray is (L x W x H) 3 × 4 × 0.3 cm with one inlet and outlet featuring 8 reagent/sample chambers and an open bottom detection chamber (Fig. 2A&B). Each internal reagent chambers is 18 × 2.5 × 0.5 mm; the detection chamber is 12 × 2.8 × 0.5 mm. The first two chambers after the inlet, chambers 1 and 2, are for wash buffer (PBS, 0.05% Tween-20, pH 7.4) followed by air gap chamber 3 to avoid intermixing of reagents. Chamber 4, is for RuBPY Si-NP-Ab2 ECL label, followed by air gap chamber 5. Chamber 6 holds wash buffer (PBS, pH 7.4) followed by air gap chamber 7. The last chamber, is for sample and is adjacent to the detection chamber downstream. To avoid non-specific binding (NSB) of immunoreagents to the walls of the 3D printed chambers, reagent and detection chambers were filled with 2% BSA and incubates 1 hr. Then, all channels are flushed with PBS buffer and air dried. Attaching the PGS microwell detection chip with adhesive (Aleene’s® Tacky Double-Stick Sheets™) forms the sealed detection chamber. Total volume of reagent chambers was 20 ± 2 μL, having a tiny turn to connect to the detection chamber to achieve very small volume, with detection chamber volume ~20 μL.
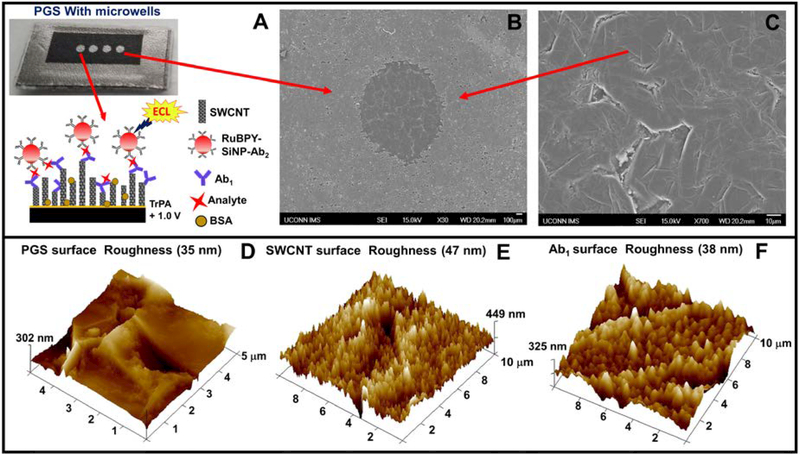
Detection chips were prepared from paper-thin, conductive, flexible pyrolytic graphite sheets (PGS).15 The desired size of PGS was cut from a larger sheet and placed on an double-sided adhesive plastic support followed by microwell patterning using print and heat transfer technology.16 The detection chip features 4 microwells 1 mm diameter and ~10 nm deep. For detection, 2 microwells were used for PSA detection and the other 2 PSMA. The microwell pattern was inkjet printed onto glossy paper (Avery™ 5263) then transferred onto the PGS using a heat press for 60s at 275°C (Fig. 3A). Microwells formed by hydrophobic toner boundaries allowed wet chemistry to be implemented in the wells to build single wall carbon nanotube tube (SWCNT) forests and attach antibodies.17,18 Fig. 3B shows scanning electron micrographs (SEM) of PGS with microwells. SEM scans and tapping mode atomic force microscopy (AFM) of the unmodified PGS revealed fairly smooth surface with surface roughness of 35 nm as shown Fig. 3C&D. AFM images for SWCNT forest modified PGS microwells showed enhanced surface roughness of 47 nm, Fig. 3E. The end carboxyl groups on SWCNT’s were activated with 400 mM EDC + 100 mM NHSS to conjugate capture antibodies (Ab1) by amidization,19 resulting in decreased surface roughness to 38 nm due to the globular nature of the antibodies. Specific capture antibodies were coated onto SWCNT decorated detection microwells by incubating them for 2.5 hours at room temperature followed by adding 2% BSA as a blocking agent for 1 hour to minimize nonspecific binding and stored at 4°C until use. Patterned microwell PG sheet array with SWCNT forest and capture antibody (Ab1) were then attached onto the 3D printed array using double sided adhesive. See SI for additional characterizations of the PGS detection chips.
Fig. 3.
(A) Disposable pyrolytic graphite sheet with microwells formed by hydrophobic toner print. Inset showing sandwich immunoassay on a single wall carbon nanotube forest (SWCNT). (B) SEM image showing hydrophobic boundary formed by printer toner and (B) Inside of a microwell on a PGS. (D-F) tapping mode AFM images of unmodified PGS, SWCNT forest in a PGS microwell, and PGS and Ab1 immobilized in a PGS microwell, respectively.
Immunoassay protocol.
The 3D printed array equipped with Ab1-loaded PGS microwell chip was prefilled with reagents and sample through injection ports in each of the chambers. Once reagents were filled, injection ports and vent holes were sealed with one-sided transparent scotch tape for leak proof flow. Since ports and holes are strategically located perpendicular to reagent flow, very little pressure is exerted on the sealing tape and no leakage occurs. Flexible tubing was then inserted into the inlet port of the 3D printed array and connected to BD Plastic 4.78 mm, 1 mL syringe. Prior to inserting the tubing into the inlet, 100 μL of 500 mM tripropylamine (TrPA) in 0.2 M phosphate buffer + 0.05% Tween-20 and 0.05% triton-X at pH 7.5 was drawn into the tubing. Excess TrPA was used for additional washing and as co-reactant for ECL generation. Chemyx Fusion 400® programmable micro flow syringe pump, is a four-channel syringe system that allowed precise operation of 4 simultaneous immunoassays. The TrPA loaded tubing with syringe was then fitted into a syringe pump with a three step program loaded to control sample incubation, label incubation, followed by washing and delivery of TrPA. The flow rate was set to 90 μL min−1, Step 1 involves delivery of 27 μL volume (includes initial pressure buildup delay, dead volume and 20 μL sample) to the detection chamber. Program was delayed for 8 minutes to allow the sample to incubate on the array chip. Step 2, pump cycle delivers 130 μL of buffer to wash the array and flush unreacted sample, leaving the Ab2-RuBPY-silica nanoparticles in contact with the microwells for 7 minutes. Step 3, 600 μL pump cycle initiated to wash unreacted detection NPs away, and fill the detection chamber with TrPA for ECL generation. The immunoarray was then placed under a CCD camera (Syngene G:box F3) in a dark box and a potential of 1.0 V vs Ag/AgCl was applied with a handheld potentiostat (CH Instruments Electrochemical Analyzer, Model 1200B) to generate ECL for 180 s. When 1.0 V vs Ag/AgCl was applied, TrPA gets oxidized to TrPA•+, then deprotonates to form TrPA• to drive a catalytic redox process involving [RuBPY]2+/3+ that generates electronically excited [RuBPY]2+* for ECL.20 ECL images were then processed by software to obtain ECL intensities.13 ECL images captured simultaneously by the CCD are in gray scale which were further modified by using Photoshop® to produce representative re-colorized images in RGB scale. The ECL color scale (Fig.4A) indicates the intensity map of the captured images. No effect on sensitivity and reproducibility of ECL responses was found based on the order of ECL microwells or arrays when 4 simultaneous assays were performed.
Fig. 4.
Calibration data for simultaneous detection of PSMA and PSA in undiluted calf serum with ECL responses integrated over 180 s at 1.0 V vs Ag/AgCl. (A) Recolorized CCD images of 5 arrays showing increase in ECL response with increase in concentration. Influence of concentrations on relative ECL response for (B) PSMA and (C) PSA, error bars show standard deviation for n=4.
Results
Calibration.
While prostate specific antigen (PSA) represent a standard protein biomarker for prostate cancer screening,21 benign prostate diseases also elevate PSA leading false positives. Prostate specific membrane antigen (PSMA) is overexpressed in early, metastatic and hormone refractory prostate cancers.22,23 and is a potential serum protein biomarker that can be used in conjunction with (PSA) for prostate cancer diagnoses. Thus, we chose detection PSA and PSMA in serum to illustrate our automated immunoassay.
We began with single protein analysis in which all four microwells on the PGS detection chip were coated with either PSA or PSMA capture antibodies and the detection label has either PSA or PSMA detection antibodies. As an example for reproducibility, relative ECL responses captured from the 3D printed immunoarray with three trails in undiluted calf serum of zero-PMSA controls and for 1 pg mL−1 PSMA showed an average relative standard deviation (RSD) of 8% well-to-well (n=4) and 6% array-to-array (n=3). The 3D printed arrays were calibrated by single proteins, where increase in ECL was found with increasing concentration of the respective protein. ECL signal intensities from CCD camera accumulated for 180s, different analyte concentrations were processed by dividing with ECL intensity obtained from zero-protein control to get relative ECL intensity, which were plotted against concentration as show in SI file, Fig. S4.
PSMA and PSA were then simultaneously detected by using a mixture of concentrations of PSA and PSMA standards in undiluted calf serum. The first two microwells equipped with anti-PSMA capture antibodies and the last two with anti-PSA capture antibodies (Fig. 2A). The detection label has both anti-PSA and anti-PSMA detection antibodies coated on RuBPY-SiNP.
Under the control of a preset syringe pump program, standard protein solutions were delivered from analyte chamber to detection chamber and incubated for 8 min. stopped flow, followed by washing with 10 mM PBS buffer, 7.4 pH. RuBPY SiNP-Ab2 dispersion was then delivered to the detection chamber and incubated 7 min, followed by washing with 10 mM PBS and PBS Tween 20 buffer, pH 7.4. Relative ECL intensities were plotted against concentrations to get the 2 calibration curves (Fig. 4). Previous studies suggested absence of noticeable cross reactivity between the PSA and PSMA antibodies used in simultaneous detection.11
Recolorized CCD images in Fig. 4A shows ECL responses for mixture of PSMA and PSA in calf serum, a good surrogate for immunoassay calibration when eventual samples are in human serum. While these plots show upward curvature, they are still reliable for protein detection in the dynamic ranges of 250 fg mL−1 to 5 ng mL−1 obtained for both proteins. Limits of detection (LOD) were 150 fg mL−1 for PSA and 230 fg mL−1 for PSMA, measured at 3 × SD above 0 pg mL−1 protein controls.
Patient Sample Analysis.
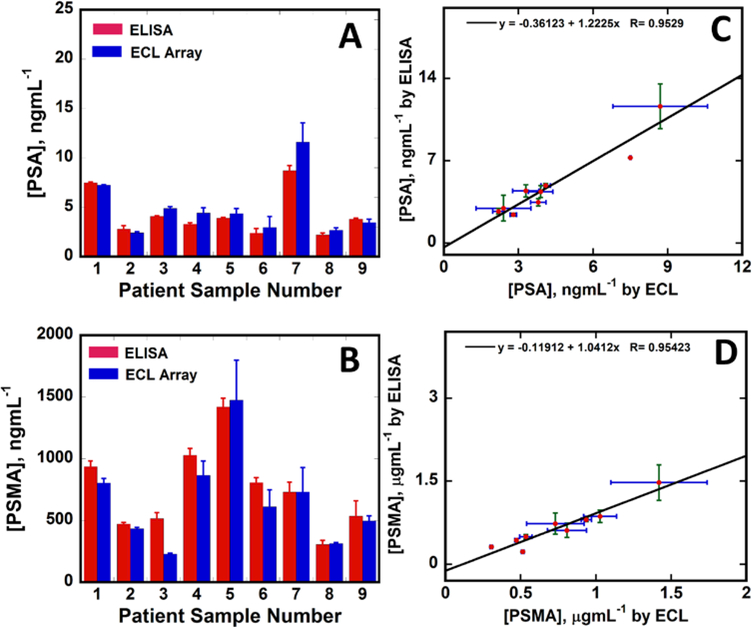
We analyzed 32 cancer patient samples and 6 cancer-free control samples with the proposed immunoarray. In addition, 9 samples were selected across the dynamic range and analyzed by single protein PSA and PSMA ELISAs to establish correlations with the immunoarray. Samples were diluted from 100 to 500 fold in calf serum prior to analysis to bring the ECL responses into the dynamic range. Concentrations found by the immunoarray for all patient samples are in SI, Table S2. Microfluidic immunoarray responses correlated well with ELISA (Fig. 5), with linear correlation plots (Fig. 5C&D) with slopes 1.22 ± 0.14 and intercepts −0.36 ± 0.70 for PSA, and slope 1.04 ± 0.12 and intercept −0.12 ± 0.10 for PSMA. These values were within standard error of the theoretical perfect correlation slopes of 1.0 and intercept 0.0, suggesting very good correlation between the automated immunoarray and ELISA. Concentrations obtained from the ECL immunoarray for all the 32 prostate cancer and 6 cancer negative patient samples were given in SI, Table S2.
Fig. 5.
Comparison ECL vs. ELISA for 9 human patient serum samples. Bar graph shows ECL and ELISA values for (A) PSA and (B) PSMA. Linear correlation plots for (C) PSA and (D) PSMA. Error bars are standard deviations with n=4 for ECL and n=3 for ELISA.
Box plots24 (Figure 6) show visual comparisons of protein concentrations found in patient samples by the immunoassay. The central boxes display values that lie in lower to upper quartile, i.e. 25 to 75 percentile. The horizontal line in each box is the median, while vertical lines and box ends show minimum to maximum concentration. Median values are significantly larger for cancer patient serum for both PSA and PSMA, and most values segregate into sub-groups for cancer-free and cancer patients, with one cancer patient sample showing relatively high concentrations of both biomarkers. Thus, analysis of this limited patient sample set suggests that PSA and PMSA together differentiate well between prostate cancer and cancer-free patient serum. See Figure S5 in SI file for additional statistical analysis.
Fig. 6.
Summary of patient sample results using box-and-whisker plots to show data point distribution for cancer-free and prostate cancer serum samples for (A) PSA and (B) PSMA. The plots present lower, upper quartile, and median values along with minimum and maximum ranges.
Discussion
Results above demonstrated that a low cost, 3D printed immunoarray can provide excellent characteristics for multi sample automated assays of low abundance proteins in serum. Measuring PSA and PSMA levels down into the pg/mL range in human serum that contains thousands of other proteins, many in the mg-mg/mL range,25 demonstrates selective and sensitive detection (Figs 4–6). LODs in calf serum were 150 fg mL−1 for PSA and 230 fg mL−1 for PSMA. The miniature 3D printed microfluidic immunoarray detected ultralow levels of 2 proteins in serum in 20 min assay time using 1–2 μL sample volumes. These miniaturized immunoarrays were optimized with microfluidic structure dimensions of 500 microns resulting in low sample and reagent volumes. Reagent reservoirs are arranged (Fig. 2A) to allow sequential pumping to the detection sensor. The programmable syringe pump allowed precise control of reagent delivery to facilitate incubation and washing without user participation. Total assay cost was $0.75, makes this approach an excellent candidate for applications in virtually any laboratory including in low resource settings.
Dynamic ranges from calibration extending from 250 fg mL−1 to 5 ng mL−1 for both proteins, (Fig. 4) match clinical ranges for selected proteins after 100–500-fold dilutions. Relative standard deviations ranged from 2 to 11 % for both proteins for all tested concentrations. Good repeatability was obtained in reproducible assays (<±8%) performed with controls and 1 pg mL−1 PSMA. Clinical sample analysis clearly suggests that the developed array was able to distinguish low concentrations in cancer free patients (0.2 ng mL−1 for PSA and 13.5 ng mL−1 for PSMA) and very high concentrations in cancer patients ( 11.6 ng mL−1 for PSA and 1475 ng mL−1 for PSMA). Immunoarray accuracy was validated by comparing sample analyses to standard single protein ELISA. Comparison studies between immunoarray results and ELISA showed very good correlation, Fig. 5.
3D printing enabled compact design with construction of reagent chambers and detection channels within the one piece device. Placing the detection channel very close to the sample chamber helps eliminate dead volumes often associated with connectors. Using this parallel alignment of fluidic chambers with optimized minimal distances results in rapid completion of assays.
Pyrolytic graphite sheet (PGS) was used as an alternative to bulky expensive pyrolytic graphite chip or screen printed carbon electrodes. PGS are inexpensive, easy to cut, disposable, highly conductive, and also can withstand organic solvents (SI, Fig.S2 & S3). One PGS costs $6 for a 7in X 5in sheet with thickness of 0.0028 inch. These extremely flexible and tough PG sheets can make up to 75 detection sensor chips with 4 detection spots on each of them resulting in cost of only 8 cents per array. PGS enabled us to grow the single walled carbon nanotubes forests in microwells to attach coatings of capture antibody that in turn facilitated high capture efficiency of analyte proteins from serum. Cost was only $0.40 in materials to print the immunoarray, including all the immunoreagents; total cost per assay is 0.75 $. The arrays can be disposable, or reusable after cleaning.
Conclusion
In summary we demonstrated use of an inexpensive desktop stereolithographic 3D printer to fabricate a compact, optically clear microfluidic array suitable for ECL detection. The immunoarray was low cost and portable with sensitive, selective detection of two proteins from human serum samples. Automation was achieved with a programmable pump that allows 4 samples to be analyzed simultaneously. The choice of 4 duplicate 2-protein assays can be expanded by changing the number of microwells in the detection chip and having more channels in the syringe pump. The assay was cost effective and rapid with low detection limits and dynamic ranges that can be tailored for clinical analysis. CAD files for 3D printing the immunoarray can be downloaded from our lab’s website.26
Supplementary Material
Acknowledgements
This work was supported financially supported financially by an Academic Plan Grant from The University of Connecticut and in part by Grant no. EB016707 from the National Institute of Biomedical Imaging and Bioengineering (NIBIB), NIH
Footnotes
Conflicts of interest
The authors have no conflicts of interest to declare.
References
- 1.Ward AM, Catto J and Hamdy F, Ann. Clin. Biochem, 2001, 38, 633–651. [DOI] [PubMed] [Google Scholar]
- 2.Srinivas PR, Kramer BS and Srivastava S, The lancet oncology, 2001, 2, 698–704. [DOI] [PubMed] [Google Scholar]
- 3.Beveridge JS, Stephens JR and Williams ME, Annual Review of Analytical Chemistry, 2011, 4, 251–273. [DOI] [PubMed] [Google Scholar]
- 4.Roche Diagnostics, https://usdiagnostics.roche.com/en/core_laboratory/reagents/full-menu.html; Last accessed 6/03/2018.
- 5.Meso Scale Diagnostics, http://www.mesoscale.com; Last accessed 6/03/2018.
- 6.Perkin Elmer, http://www.perkinelmer.com/category/protein-detection Last accessed 6/03/2018.
- 7.Meissner EG, Decalf J, Casrouge A, Masur H, Kottilil S, Albert ML and Duffy D, PLoS One, 2015, 10, e0133236. [DOI] [PMC free article] [PubMed] [Google Scholar]
- 8.(a) E. MacDonald and R. Wicker, Science, 2016, 353, 10.1126/science.aaf2093. Epub 2016 Sep 29 (DOI:aaf2093 [pii]) [DOI] [Google Scholar]; (b) J. Poelma and J. Rolland, Science, 2017, 358, 1384–1385. [DOI] [PubMed] [Google Scholar]
- 9.Morgan AJ, San Jose LH, Jamieson WD, Wymant JM, Song B, Stephens P, Barrow DA and Castell OK, PloS one, 2016, 11, e0152023. [DOI] [PMC free article] [PubMed] [Google Scholar]
- 10.Bishop GW, Satterwhite-Warden JE, Bist I, Chen E and Rusling JF, ACS sensors, 2015, 1, 197–202. [DOI] [PMC free article] [PubMed] [Google Scholar]
- 11.Kadimisetty K, Malla S, Bhalerao K, Mosa IM, Bhakta S, Lee N and Rusling JF, Anal. Chem, 2018, 90(12), 7569–7577. [DOI] [PMC free article] [PubMed] [Google Scholar]
- 12.Sardesai N, Pan S and Rusling J, Chemical Communications, 2009, 4968–4970. [DOI] [PMC free article] [PubMed] [Google Scholar]
- 13.Sardesai NP, Kadimisetty K, Faria R and Rusling JF, Analytical and bioanalytical chemistry, 2013, 405, 3831–3838. [DOI] [PMC free article] [PubMed] [Google Scholar]
- 14.Walker JM, The protein protocols handbook, Springer Science & Business Media, 2009, p. 11–15. [Google Scholar]
- 15.Panasonic, https://na.industrial.panasonic.com/products/thermal-management/thermal-management/thermal-management-products/series/pgs-graphite-sheet-ssm/AYA0002/model/EYGS121807; Last accessed 6/03/2018.
- 16.Tang CK, Vaze A and Rusling JF, Lab on a Chip, 2012, 12, 281–286. [DOI] [PMC free article] [PubMed] [Google Scholar]
- 17.Yu X, Munge B, Patel V, Jensen G, Bhirde A, Gong JD, Kim SN, Gillespie J, Gutkind JS, Papadimitrakopoulos F and Rusling JF, J. Am. Chem. Soc, 2006, 128, 11199–11205 (DOI: 10.1021/ja062117e[doi]). [DOI] [PMC free article] [PubMed] [Google Scholar]
- 18.Kadimisetty K, Malla S, Sardesai NP, Joshi AA, Faria RC, Lee NH and Rusling JF, Anal. Chem, 2015, 87, 4472–4478. [DOI] [PMC free article] [PubMed] [Google Scholar]
- 19.Malhotra R, Papadimitrakopoulos F and Rusling JF, Langmuir, 2010, 26, 15050–15056. [DOI] [PMC free article] [PubMed] [Google Scholar]
- 20.Miao W, Choi J and Bard AJ, J. Am. Chem. Soc, 2002, 124, 14478–14485. [DOI] [PubMed] [Google Scholar]
- 21.Ward AM, Catto J and Hamdy F, Ann. Clin. Biochem, 2001, 38, 633–651. [DOI] [PubMed] [Google Scholar]
- 22.Ghosh A and Heston WD, J. Cell. Biochem, 2004, 91, 528–539. [DOI] [PubMed] [Google Scholar]
- 23.Caromile LA, Dortche K, Rahman MM, Grant CL, Stoddard C, Ferrer FA and Shapiro LH, Sci. Signal, 2017, 10, 10.1126/scisignal.aag3326 (DOI:eaag3326 [pii]). [DOI] [PMC free article] [PubMed] [Google Scholar]
- 24.McGill R, Tukey JW, Larsen WA, Amer. Statist 1978, 32, 12–16. [Google Scholar]
- 25.Pieper R, Gatlin CL, Makusky AJ, Russo PS, Schatz CR, Miller SS, Su Q, McGrath AM, Estock MA and Parmar PP, Proteomics, 2003, 3, 1345–1364. [DOI] [PubMed] [Google Scholar]
- 26.https://rusling.research.uconn.edu/research/3d-printing-designs/; last accessed 6/03/2018.
Associated Data
This section collects any data citations, data availability statements, or supplementary materials included in this article.


