

The prevalence of obesity has been increasing in the past few decades across the world.[1] This trend is expected to continue owing to the rising pandemic of “Western diet” and sedentary lifestyle in the low and middle-income regions. High body mass index (BMI, the weight in kilograms divided by the square of the height in meters) has been established as a risk factor for numerous chronic diseases, including cardiovascular disease, type 2 diabetes, many cancers, chronic kidney disease, and an array of musculoskeletal disorders.
Because the incidence of these diseases typically increases with age and excess adiposity tends to accrue during early and middle adulthood, increasing epidemiologic studies have begun to assess how weight change over the life course may influence disease risk independently of the baseline body weight.[2] Leveraging the repeatedly and prospectively collected adiposity data, these studies have examined weight change at different windows of life, mostly from early to middle adulthood and in some cases during middle and late adulthood. Besides corroborating causality for the role of adiposity in disease pathogenesis, such investigations are also important in elucidating the critical window during which excess body fatness may exert most of its adverse effects. This has critical implications, not only for understanding disease etiology but also for development of effective public health strategies. For example, studies of colorectal cancer indicate a predominant risk-elevating effect of weight gain from early adulthood to midlife compared to that from midlife to older age, supporting the importance of early prevention.[3, 4]
However, because of its segmented examination of weight change at different time points, this approach is limited in its ability to capture the dynamic changes of body weight across a broader range of lifespan. More importantly, it becomes challenging to separate and interpret the effect of early adiposity from later weight gain (Table 1), because the two are correlated in a complex manner and together contribute to excess body weight in midlife when chronic disease risk starts to rise rapidly.[5] To overcome these limitations, the group-based trajectory modeling (GBTM) approach has been increasingly used to study the health impact of adiposity from a life course perspective (Figure 1).[6–10] Moreover, the approach has been used to investigate the predictors[11] and influences on intermediate biomarkers[12, 13] of body weight trajectories over an extended period of time. Herein, I provide an overview about the GBTM approach in obesity research. I start with the rationales and principles, and then briefly describe the methods and common applications. I conclude with some critical questions that need to be addressed to fully realize the power of this relatively new method in obesity epidemiology.
Table 1.
Comparison of different approaches in epidemiologic studies of adiposity at different ages in relation to disease risk
| Exposure of study | Typical questions to be addressed |
Example model specification (only primary exposures shown) |
Potential limitations |
|---|---|---|---|
| Adiposity status at certain ages or time points |
Is adiposity at each specific age independently associated with disease risk? |
Y=BMI_age1+BMI_age2 | • Collinearity, because of tracking of early-life weight status into adulthood. • Over-adjustment, because BMI at later life is likely a mediator for the effect of adiposity at a young age. |
| Weight change during certain period of time |
Is weight change associated with disease risk, independently of baseline weight? |
Y=Baseline_weight+weight change |
• Difficult to simultaneously study weight change at multiple periods of time. • Challenging to separate and interpret the effect of baseline weight from later weight gain. |
| Trajectory of body fatness during certain period of time |
Does the disease risk differ between individuals with different trajectories? |
Y=trajectory_groups | • A limited number of trajectories are typically derived that may not accurately reflect each person’s profile of body fatness. • Generalizability: results can be difficult to compare between studies. |
Figure 1.
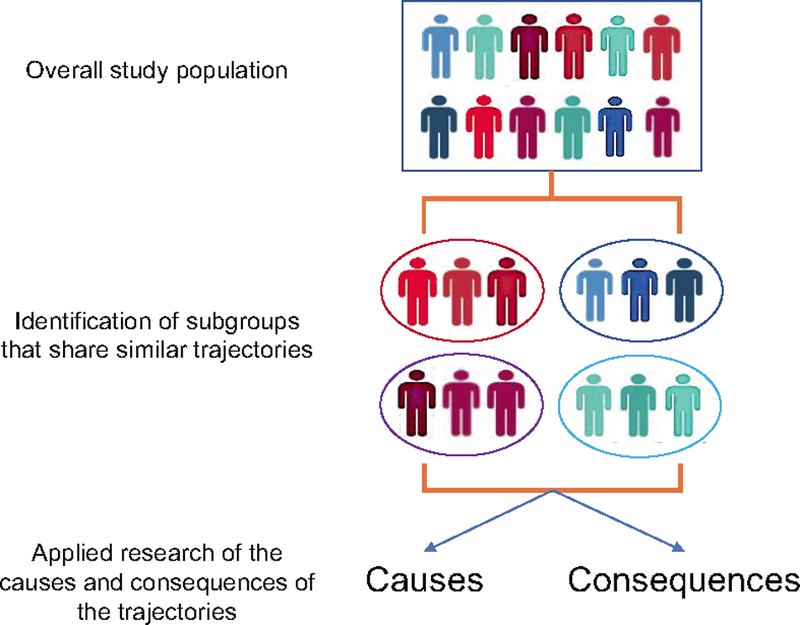
Framework of trajectory analysis in epidemiologic research
Assumption and principles of the trajectory analysis
Since its development by Daniel Nagin in 1999,[14] GBTM has been widely used in psychology and criminology to study population differences in individual-level developmental trajectories of behaviors. It is intended to provide a flexible and easily applied approach for identifying distinctive clusters of individual trajectories within the population and for profiling the characteristics of individuals within the clusters. A fundamental assumption of GBTM is that the population is composed of a mixture of distinct groups defined by their developmental trajectories. This assumption distinguishes GBTM from other trajectory modeling methods, such as growth curve modeling (GCM) which assumes that all individuals in the population follow a similar functional form of development and growth mixture modeling (GMM) which assumes that the population is composed of literally distinct subpopulations.[15] Therefore, compared to GCM that is useful to describe how patterns of growth vary continuously throughout the population and GMM to characterize distinct yet unobservable subpopulations in the course of development, GBTM provides a unique statistical tool to classify individuals into relatively homogeneous groups based on their trajectories and in turn approximate the continuous population distribution of trajectories of unknown shape. This principle makes GBTM well suited for biomedical research, because of the well-recognized between-person variation in the development and progression of a wide range of human traits, disorders, and related symptoms and treatment responses.
For obesity research, the trajectory approach can be particularly useful because it respects the continuity of body growth and fat accumulation over time. Compared to the traditional weight change analysis that partitions time into intervals, GBTM takes a holistic approach to studying the evolution of body fatness over time, allows a close scrutiny of the population heterogeneity in change of body fatness over the life course, and permits direct comparison of the disease risk across different trajectory groups.[7] By doing so, it circumvents the difficulty in disentangling the independent effect of early- versus late-life adiposity and addresses a different but more tangible question about the relative disease risk of people who experience different developmental courses of body fatness (Table 1).
Statistical methods of the trajectory analysis
This section is intended to provide a nontechnical overview of the statistical basis of GBTM. Readers interested in the details are encouraged to refer to other excellent publications on the methods of GBTM.[14, 16, 17] A customized SAS procedure Proc Traj has been developed for GBTM analysis.[17, 18] GBTM represents an application of latent growth mixture model that fits longitudinal data as a discrete mixture of two or more latent trajectories and links age and the study trait through a polynomial relationship. Different statistical models can be specified for different types of data (e.g., Poisson model for count data, linear model for continuous data, and logistic model for binary data). In the case of body fatness analysis, GBTM uses BMI or other anthropometric data collected repeatedly across different ages as the input and classifies individuals into distinct trajectory groups, within which the pattern of adiposity evolution is similar. A cubic polynomial linear model can be specified as yitj = β0j + β1jAgeit + β2jAgeit2 + β3jAgeit3, where yitjis the expected BMI (or other measurements of choice) of subject i at time t given membership in trajectory group j, Ageit is subject i’s age at time t, and Ageit2 and Ageit3 are the square and cubic of subject i’s age at time t.
A key issue of GBTM analysis is model selection, which encompasses two tasks: (a) to determine the optimal number of trajectory groups and (b) to determine the appropriate order of the polynomial function used to model each group’s trajectory. A two-stage approach is typically undertaken to fulfill the two tasks, with the first stage to identify the optimal number of groups by using a quadratic form for all trajectory groups and the second stage to determine the optimal order of the polynomial function specifying the shape of each group. While various criteria have been proposed for model selection, the most commonly used one is the Bayesian information criteria (BIC), which provides a good balance of model complexity and goodness of fit to the data.[16]
Once the form of the final model is determined, trajectories can then be characterized as the product of maximum-likelihood estimation and plotted against age for intuitive interpretation. The derived trajectory groups can be named to describe their visual patterns. Another important product of the modeling process is the posterior membership probability for each individual, which reflects the probability of a person assigned to each of the identified groups. It provides an objective, data-based assignment rule for classification of individuals and post hoc evaluation of the GBTM model. Individuals are assigned to the group to which their posterior membership probability is largest. The resultant group membership assignments can be used as a categorical variable for downstream analyses.
The last step of GBTM analysis involves evaluation of model adequacy. It can be done by calculating the average posterior probability (AvePP) of assignment for each group. The higher the probability, the more adequate the model in describing the data. It has been recommended that an AvePP of at least 0.70 should be achieved for all groups.[9] Another useful diagnostic statistic is the odds of correct classification (OCC) for each group, calculated as the ratio of the odds of correct classification based on the maximum probability classification rule (AvePP/1-AvePP), and the odds of correct classification based on random assignment, which can be calculated using the proportion of individuals assigned to each group π (π/1 − π). If the maximum probability assignment rule has no predictive capacity beyond random chance, OCC=1. As AvePP approaches its ideal value of 1, OCC increases, indicating better assignment accuracy.[7]
Applications of the trajectory analysis
Once the trajectories are identified and individuals are assigned into different groups, subsequent analyses are straightforward and can in general proceed in two directions: to study either the predictors or consequences of the trajectories. The latter is most commonly employed in epidemiology by studying how the risk of diseases or levels of intermediate biomarkers may differ across different trajectories. Specifically, in the area of obesity epidemiology, trajectories of body fatness from early to middle life have been associated with risk of cardiovascular disease,[10] type 2 diabetes,[10] certain cancers,[6, 8, 19–22] and mortality,[7] as well as adulthood biomarkers of telomere length, mitochondrial DNA copy number[12] and the insulin-insulin-like growth factor (IGF) system.[13] Compared to individuals who are lean throughout life, those who are either persistently heavy over the life course or lean in early life and then gain substantial weight in midlife demonstrate a dramatically higher risk of cardiometabolic diseases, modestly increased risk of cancer (with variable associations by cancer types) and early death, and have the most undesirable profiles of biomarkers. These findings highlight a role in metabolic pathogenesis of adiposity across the lifespan, particularly weight gain from early to middle adulthood.
Besides the overall association analysis for all trajectories groups, targeted comparisons can also be made for specific groups to gain further insight into the role of the timing of adiposity in disease development. For example, in our analysis of breast cancer,[6] despite similar levels of achieved body fatness, women who started lean and became heavy later in life actually had a higher risk than those who were persistently heavy across the lifespan, indicating a potential benefit of early-life adiposity, which has been reported in other studies with BMI as the main exposure.
In addition to the “forward” analysis for predicting future events, the analysis can go “backward” to study potential determinants of trajectories using group membership assignments as a multinomial outcome. These analyses are informative for understanding how individual characteristics may influence the developmental course. For example, we recently analyzed the impact on the trajectories of body fatness of adult BMI-associated common genetic variants that have been identified from meta-analysis of genome-wide association studies.[11] We found that individuals with more genetic BMI variants were more likely to maintain a heavy body shape and gain further weight as they aged. The results indicate that the genetic impact is not restricted to shaping early-life adiposity but may extend over the life course.
The trajectory analysis can have important clinical applications to improve prediction rules and identify high-risk subgroups for targeted intervention by leveraging the longitudinal data that provides more information than a snapshot by single assessment. For example, a study assessed the trajectories of blood pressure in early adulthood from age 25 up to 50 years and calculated the probability of having subclinical atherosclerosis in middle age across different trajectories, which increased from 4% in the low-stable group to 25% in the elevated-increasing group, with an area under the ROC curve of 0.84.[23] Given the increasing use of electronic medical records in clinical practice and surging adoption of mobile health (e.g., wearable biometric sensors) in the general population, acquisition of detailed, large-scale longitudinal data is becoming feasible and less costly, which conceivably could increase the utility of trajectory approach in clinical and public health predictions. Also, by monitoring the longitudinal pattern of certain clinical characteristics, trajectories can facilitate identification of high-risk individuals for targeted and more aggressive interventions. For example, a study characterized postdiagnosis trajectories of physical and mental Health-Related Quality of Life (HRQoL) in prostate cancer survivors and identified a group of patients with lower and declining HRQoL for potential interventions.[24] Another study characterized trajectories of physical activity and physical function in cancer survivors enrolled in a randomized trial of home-based lifestyle counseling and identified characteristics of survivors who benefited from the assigned interventions.[25]
Cautions and challenges
While the trajectory analysis provides a powerful tool to address some questions that are difficult to answer using traditional longitudinal approach, careful considerations are needed to avoid potential misuse and inappropriate inference. The first issue relates to decision making in the model building process. Although BIC is a commonly used statistical criterion for model selection, just as in other modeling process, it is important to be aware of the risk of mechanical and rigid application of any formal statistical criteria. Subjective judgement is still essential to ensure the interpretability of any selected model. In the end, the objective of model selection is not to maximize some statistic of model fit; but rather to summarize the distinctive features of the data in a manner that is as parsimonious and useful as possible.[15] Second, it remains to be determined whether random effects should be included in GBTM. Although some extension method and software have been developed to include random effects,[26] others have argued that the addition of random effects to allow for more within-group variability and thus reduce the number of identified groups is at odds with the goal of GBTM to capture as much population variability as possible by using groups as a device for approximation.[15] Third, when trajectories are further studied as a potential risk factor for subsequent outcomes, how to control for confounding is a challenging question, because of our typically limited knowledge about the determinants of the trajectories. Conceivably, many of the trajectory determinants that are also predictors for the outcome are likely to be early-life characteristics that may not be characterized in most cohort studies of adults. Fourth, because GBTM remains relatively new in epidemiologic research, few guidelines exist to assist users in reporting model results for trajectory analysis.[15, 27] This clearly warrants further work to ensure adequate information is presented for critical appraisal of results and comparison between studies.
Acknowledgments
Funding support: This work was supported by the U.S. National Institutes of Health (NIH) grants (K99 CA215314) and American Cancer Society (Grant number MRSG-17-220-01 – NEC)
Footnotes
Publisher's Disclaimer: This is a PDF file of an unedited manuscript that has been accepted for publication. As a service to our customers we are providing this early version of the manuscript. The manuscript will undergo copyediting, typesetting, and review of the resulting proof before it is published in its final citable form. Please note that during the production process errors may be discovered which could affect the content, and all legal disclaimers that apply to the journal pertain.
References
- 1.Collaborators GBDO, Afshin A, Forouzanfar MH, et al. Health Effects of Overweight and Obesity in 195 Countries over 25 Years. N Engl J Med 2017;377(1):13–27. [DOI] [PMC free article] [PubMed] [Google Scholar]
- 2.Zheng Y, Manson JE, Yuan C, et al. Associations of Weight Gain From Early to Middle Adulthood With Major Health Outcomes Later in Life. JAMA 2017;318(3):255–269. [DOI] [PMC free article] [PubMed] [Google Scholar]
- 3.Karahalios A, English DR, Simpson JA. Weight change and risk of colorectal cancer: a systematic review and meta-analysis. Am J Epidemiol 2015;181(11):832–45. [DOI] [PubMed] [Google Scholar]
- 4.Song M, Hu FB, Spiegelman D, et al. Adulthood Weight Change and Risk of Colorectal Cancer in the Nurses’ Health Study and Health Professionals Follow-up Study. Cancer prevention research 2015;8(7):620–7. [DOI] [PMC free article] [PubMed] [Google Scholar]
- 5.Park MH, Falconer C, Viner RM, et al. The impact of childhood obesity on morbidity and mortality in adulthood: a systematic review. Obes Rev 2012;13(11):985–1000. [DOI] [PubMed] [Google Scholar]
- 6. (**).Song M, Willett WC, Hu FB, et al. Trajectory of body shape across the lifespan and cancer risk. International Journal of Cancer 2016;138(10):2383–95. One of the first studies of using trajectory analysis in obesity epidemiology. [DOI] [PMC free article] [PubMed] [Google Scholar]
- 7.Song M, Hu FB, Wu K, et al. Trajectory of body shape in early and middle life and all cause and cause specific mortality: results from two prospective US cohort studies. BMJ 2016;353:i2195. [DOI] [PMC free article] [PubMed] [Google Scholar]
- 8.His M, Le Guelennec M, Mesrine S, et al. Life course evolution of body size and breast cancer survival in the E3N cohort. Int J Cancer 2018;142(8):1542–1553. [DOI] [PubMed] [Google Scholar]
- 9.Kelly SP, Graubard BI, Andreotti G, et al. Prediagnostic Body Mass Index Trajectories in Relation to Prostate Cancer Incidence and Mortality in the PLCO Cancer Screening Trial. J Natl Cancer Inst 2017;109(3). [DOI] [PMC free article] [PubMed] [Google Scholar]
- 10.Zheng Y, Song M, Manson JE, et al. Group-Based Trajectory of Body Shape From Ages 5 to 55 Years and Cardiometabolic Disease Risk in 2 US Cohorts. Am J Epidemiol 2017;186(11):1246–1255. [DOI] [PMC free article] [PubMed] [Google Scholar]
- 11.Song M, Zheng Y, Qi L, et al. Associations between genetic variants associated with body mass index and trajectories of body fatness across the life course: a longitudinal analysis. Int J Epidemiol 2018;47(2):506–515. [DOI] [PMC free article] [PubMed] [Google Scholar]
- 12.Hang D, Nan H, Kvaerner AS, et al. Longitudinal associations of lifetime adiposity with leukocyte telomere length and mitochondrial DNA copy number. Eur J Epidemiol 2018;33(5):485–495. [DOI] [PMC free article] [PubMed] [Google Scholar]
- 13.Kværner AS, Hang D, Giovannucci EL, et al. Trajectories of body fatness from age 5 to 60 years and plasma biomarker levels of the insulin/IGF system. Am J Clin Nutr 2018. [DOI] [PMC free article] [PubMed]
- 14. (**).Nagin DS. Analyzing developmental trajectories: A semiparametric, group-based approach. Psychological Methods 1999;4(2):139–157. A seminal article that introduces the methodology of the trajectory approach. [DOI] [PubMed] [Google Scholar]
- 15. (*).Nagin DS, Odgers CL. Group-based trajectory modeling in clinical research. Annu Rev Clin Psychol 2010;6:109–38. An excellent review of the trajectory approach in biomedical research. [DOI] [PubMed] [Google Scholar]
- 16.Nagin DS. Group-based modeling of development Cambridge: Harvard University Press; 2005. [Google Scholar]
- 17.Jones BL, Nagin DS. Advances in Group-Based Trajectory Modeling and an SAS Procedure for Estimating Them. Sociological Methods & Research 2007;35(4):542–571. [Google Scholar]
- 18.Jones BL, Nagin DS, Roeder K. A SAS procedure based on mixture models for estimating developmental trajectories. Sociological Methods & Research 2001;29(3):374–393. [Google Scholar]
- 19.Petrick JL, Kelly SP, Liao LM, et al. Body weight trajectories and risk of oesophageal and gastric cardia adenocarcinomas: a pooled analysis of NIH-AARP and PLCO Studies. Br J Cancer 2017;116(7):951–959. [DOI] [PMC free article] [PubMed] [Google Scholar]
- 20.Yang B, Petrick JL, Kelly SP, et al. Adiposity across the adult life course and incidence of primary liver cancer: The NIH-AARP cohort. Int J Cancer 2017;141(2):271–278. [DOI] [PMC free article] [PubMed] [Google Scholar]
- 21.Fagherazzi G, Guillas G, Boutron-Ruault MC, et al. Body shape throughout life and the risk for breast cancer at adulthood in the French E3N cohort. Eur J Cancer Prev 2013;22(1):29–37. [DOI] [PubMed] [Google Scholar]
- 22.Zheng R, Du M, Zhang B, et al. Body mass index (BMI) trajectories and risk of colorectal cancer in the PLCO cohort. Br J Cancer 2018; 10.1038/s41416-018-0121-y. [DOI] [PMC free article] [PubMed] [Google Scholar]
- 23.Allen NB, Siddique J, Wilkins JT, et al. Blood pressure trajectories in early adulthood and subclinical atherosclerosis in middle age. JAMA 2014;311(5):490–7. [DOI] [PMC free article] [PubMed] [Google Scholar]
- 24.Farris MS, Kopciuk KA, Courneya KS, et al. Identification and prediction of health-related quality of life trajectories after a prostate cancer diagnosis. Int J Cancer 2017;140(7):1517–1527. [DOI] [PubMed] [Google Scholar]
- 25.Morey MC, Blair CK, Sloane R, et al. Group trajectory analysis helps to identify older cancer survivors who benefit from distance-based lifestyle interventions. Cancer 2015;121(24):4433–40. [DOI] [PMC free article] [PubMed] [Google Scholar]
- 26.Proust-Lima C, Philipps V, Liquet B. Estimation of Extended Mixed Models Using Latent Classes and Latent Processes: The R Package lcmm. 2017 2017;78(2):56. [Google Scholar]
- 27.van de Schoot R, Sijbrandij M, Winter SD, et al. The GRoLTS-Checklist: Guidelines for Reporting on Latent Trajectory Studies. Structural Equation Modeling: A Multidisciplinary Journal 2017;24(3):451–467. [Google Scholar]