

Abstract
Moyamoya disease (MMD) and Moyamoya syndrome (MMS) are referring to a progressive steno-occlusive vasculopathy at terminal portions of the bilateral internal carotid arteries and their proximal branches with prominent collateral artery formation. They can be found throughout the world and cause irreversible damage to the cerebral hemodynamics due to the progressive nature. Prompt diagnosis and accurate assessment could significantly improve the prognosis of MMD and MMS. Some imaging modalities could be used for diagnosis and nonquantitative evaluation of MMD and MMS, such as conventional computed tomography (CT) and magnetic resonance imaging (MRI), digital subtraction angiography, CT angiography (CTA), and magnetic resonance angiography. Some could quantitatively evaluate the cerebral hemodynamics of MMD and MMS, such as single-photon emission CT, positron emission tomography, xenon-enhanced CT, perfusion CT, dynamic susceptibility contrast MRI, arterial spin labeling MRI, and the hemodynamic parameters measured by those imaging methods could guide treatment of MMD and MMS. All the imaging modalities have their merits and demerits, and they can play a part in certain situation. We need establish standardized protocols for preoperative and postoperative evaluation with different imaging techniques in the further science for MMD and MMS.
Key Words: Moyamoya, imaging modality, cerebral hemodynamics
Moyamoya disease (MMD) was first described by Takeuchi and Shimizu in 1957 and then termed by Suzuki and Takaku's in 1969.1 It is a progressive steno-occlusive disease at terminal portions of the bilateral internal carotid arteries and their proximal branches with prominent collateral artery formation. Although MMD is more common in Asian populations, it can be found throughout the world. Two peak incidences of MMD are the ages of 5 and 40 years. Moyamoya syndrome (MMS) is refer to the Moyamoya-like vasculopathy with associated risk factors, such as neurofibromatosis type, down syndrome, thyroid disease, cranial irradiation, sickle cell anemia, and so on.2,3 The clinical manifestations of MMD and MMS could be subdivided into two types: ischemic type and hemorrhagic type. In Asian populations, the former is common in children, whereas the latter is common in adult.4 However, some authors argue that the most common clinical presentation among adult patients is ischemic stroke and/or transient ischemic attacks in some other countries.5 Because of the progressive nature of MMD and MMS, prompt diagnosis and appropriate management are crucial to improve the long-term prognosis of patients.6
Imaging of MMD and MMS
To this day, different imaging modalities has been used for diagnosis of MMD or MMS, including digital subtraction angiography (DSA), computed tomography (CT), magnetic resonance imaging (MRI), single-photon emission CT (SPECT), and positron emission tomography (PET). Some imaging modalities are quantitative, whereas the others are nonquantitative. All of them are useful in certain situation. Each of these imaging techniques has its advantages and disadvantages.
Nonquantitative Imaging
Nonquantitative imaging techniques include different basically angiographies, such as angiography: DSA, CT angiography (CTA), and magnetic resonance angiography (MRA).
Digital subtraction angiography is currently considered to be the criterion standard for diagnosis and assessment of MMD and MMS. Then, the “Moyamoya” was originally used to describe the DSA manifestation of MMD. Moyamoya disease had been subdivided into 6 stages by Suzuki and Takaku (Table 1).1 This staging system has been well accepted so far. However, the disadvantage of this staging system is that it cannot really reflect the hemodynamic status of the brain parenchyma and is insensitive to longitudinal follow-up.7–9 Digital subtraction angiography can be also used for assessment of the postoperation changes, especially extracranial-intracranial (EC-IC) bypass surgery. However, DSA is still an invasive surgery with associated risks, such as groin hematoma, transitory neurological symptoms, and so on10 (Fig. 1).
TABLE 1.
Angiographic Suzuki Grading System of MMD
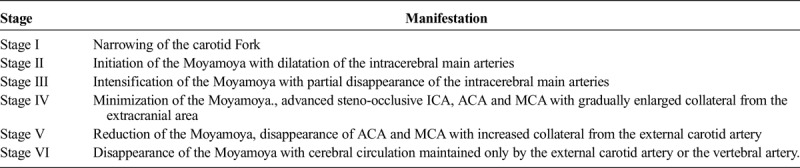
FIGURE 1.
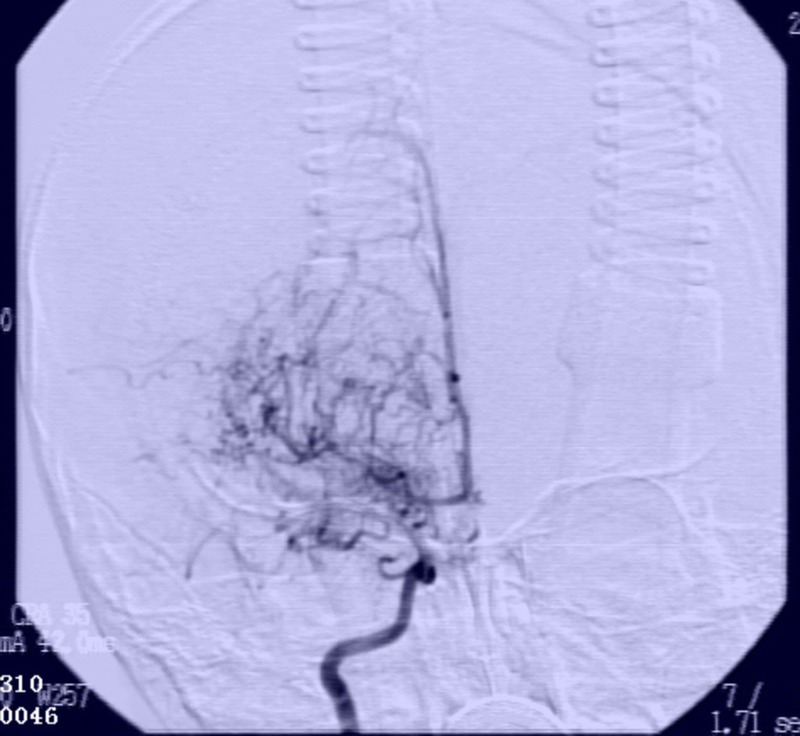
Internal carotid artery angiography shows smog-like vessels. Figure 1 can be viewed online in color at www.jcat.org.
Recently, CTA and MRA have been widely accepted for diagnosis and evaluation of MMD and MMS.11 Computed tomography angiography is especially helpful in patients who are presented to the emergency department with suspected complications due to vascular abnormalities.12 Compared with the DSA, both of CTA and MRA are less time-consuming and safer, although the CTA still accompanies with radiation exposure and the MRA is relatively time-consuming and limited in critically ill patients.13 Sugino et al11 reported that CTA was superior to MRA in identification of very small stenotic lesions in the internal carotid artery (ICA), middle cerebral artery (MCA), and posterior cerebral artery, whereas MRA tends to underestimate the presence of such lesions. Magnetic resonance angiography is widely accepted for it is a completely noninvasive examination with no requirement of contrast medium and radiation exposure. Early report revealed that MRA may overestimate stenotic lesions and underestimate the Moyamoya vessels.14 With the advances of technology, these drawbacks may be overcome to some degree. 3.0-Tesla MRA was better than 1.5-Tesla MRA in depiction of small vessel segments due to the improvement of the contrast-to-noise ratio.15,16 According to the results of this study, 3-Tesla time-of-flight MRA and CTA did better in depiction of intracranial segment of bypass and the trepanation segment, respectively, and there was no difference in assessing the stenosis degree of bypass of the extracranial superficial temporal artery segment between the 2 imaging modalities (Figs. 2A, B).
FIGURE 2.
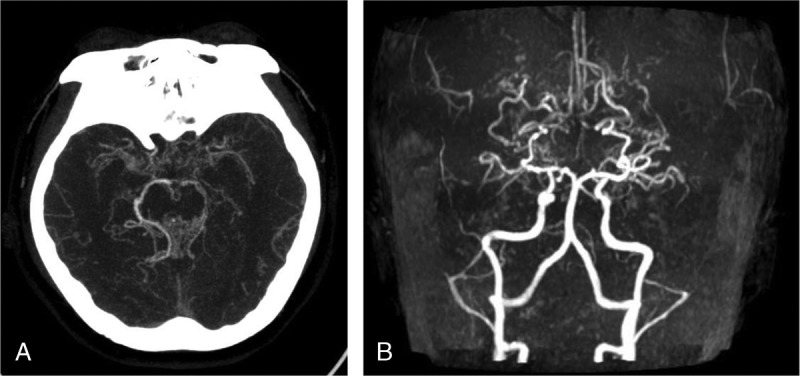
Maximal intensity projection images of CTA and bilateral ICA occlusion of the bed segment occlusion. A, Maximal intensity projection images of CTA showed bilateral ICA bed segment occlusion. There was no development of bilateral anterior and middle cerebral arteries, as well as multiple abnormal vascular network at basis crania. B, Magnetic resonance angiography images of bilateral ICA occlusion of the bed segment occlusion. Bilateral middle cerebral artery showed no development. Multiple abnormal vascular network at basis crania.
Conventional CT and MRI
Although conventional CT and nonquantitative MRI play a limited role in diagnosis and evaluation of the vasculopathy of MMD and MMS, some authors have attempted to improve the usefulness of these basic imaging modalities. These modalities, which are commonly available, can at least provide clues to make preliminary diagnosis and evaluation and offer the possibility for us to obtain the early diagnosis, especially in those asymptomatic MMD and MMS patients (Figs. 3A, B).
FIGURE 3.
T1-weighted imaging–enhanced scan and FLAIR sequence at basis crania. A, T1-weighted imaging–enhanced display of multiple abnormally enhanced vascular network at basis crania. B, FLAIR sequence bilateral radial coronary region multiple cerebral infarction.
Application in Disease Diagnosis
Yamada et al17 reported that combined utilization of T1-weighted imaging (T1WI) and T2-weighted imaging of MRI can successfully demonstrate occlusive disease in the basal portions of the ICA, anterior cerebral artery (ACA), MCA, and posterior cerebral artery, as well as collateral vessels of MMD patients. Hu et al18 retrospectively analyzed the conventional CT and axial T2-weighted imaging of MMD and MMS patients. They found that these two imaging modalities are not only convenient, cost-effective, and commonly available in different clinical practices but also useful in identifying steno-occlusive changes of horizontal segments of the MCAs.18 Yuan et al19,20 found that some findings, such as smaller outer diameter and wall thickness, concentric stenosis, homogeneous signal intensity, and collateral vascular structures in high-resolution MRI, might be the characteristics of MMDs, whereas pathological shrinkage of MCA was an important phenomenon of progression.
Specific Manifestations
The ivy sign was first reported by Ohta et al21 in 1995, which was used to describe a diffuse leptomeningeal enhancement on postcontrast MRIs of MMDs. Later, the ivy sign was used to depict linear high signal intensity along the cortical sulci or brain surface in the cerebral hemisphere on unenhanced fluid-attenuated inversion recovery (FLAIR) MRIs. It is reported that ivy sign on FLAIR can be seen in approximately half of involved hemispheres and in nearly one third of asymptomatic MMD patients. It may be caused by slow retrograde flow of engorged pial arteries via leptomeningeal anastomosis, maximally dilated pial vasculature compensating for decreased perfusion pressure, and congestive thickening of the leptomeninges.22 Thus, the ivy sign can be used to indicate the hemodynamic status of the leptomeningeal collateral pathways in MMD, which is more prominent in hemispheres with poorer visualization of the cortical branches of the MCA on MRA.23,24 In the study of Mori et al,25 the degree of the ivy sign was classified into 3 grades and the results was compared with the finding of 123I-IMP SPECT. Their findings showed that the degree of the ivy sign on FLAIR images demonstrated a negative relationship with the resting cerebral blood flow (CBF) and a more prominent negative relationship with the cerebral vascular reserve (CVR).25 The same grading was used by Kaku et al26 to correlate it with the results of 15O gas PET. It turned out that the ivy sign was associated with both dilated pial vasculature and the slow flow of developed leptomeningeal collaterals in MMDs26 (Figs. 4A, B).
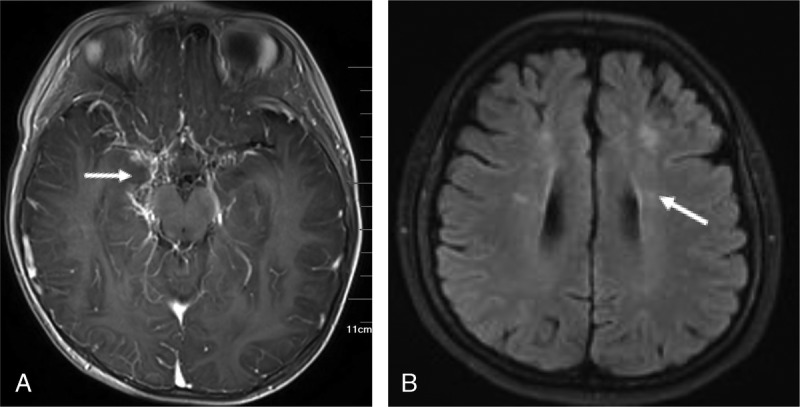
FIGURE 4.
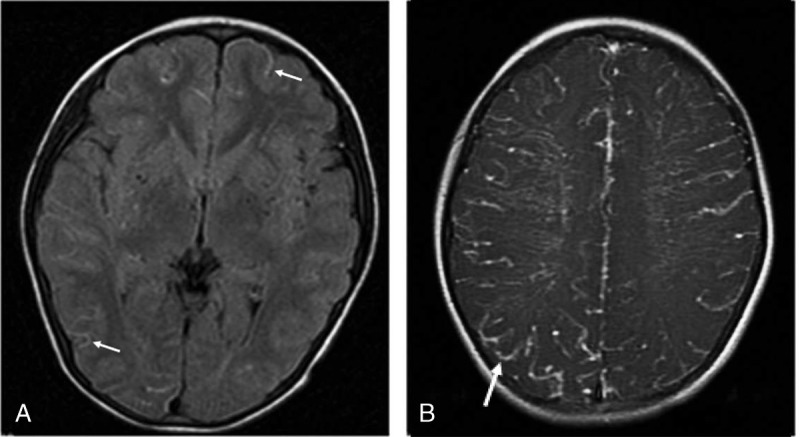
FLAIR sequence and T1WI-enhanced scan. A, FLAIR sequence showed multiple dots and bars of high signals (arrows) along the soft meninges distributed in the cerebral cortex of both hemispheres, ivy-like. B, T1-weighted imaging–enhanced scan was performed on both hemispheres of the brain with abnormal enhancement of blood vessels, ivy-like.
Susceptibility-weighted MRI (SWI), which is available to evaluate deep venous flow in ischemia and to demonstrate increased oxygen extraction in focal cerebral ischemia, can be also used to assess the severity of the hemodynamics in MMDs.27 Horie et al28 used SWI to evaluate the deep medullary vein and found that the SWI stage correlated with hemodynamics on SPECT, especially CVR.
Quantitative Imaging
Once the diagnosis of MMD or MMS is made, how to select the therapeutic schemes may be the next key step for the prognosis. Although medical therapies are not effective for MMD and surgical revascularization become more acceptable,6,29 medical treatments still are the first choice in the asymptomatic MMD patients.30 It is noteworthy that cerebral hemodynamic status has no correlation with the angiographic stage according to the Suzuki and Takaku's classification.31 To this day, there is no established standard of the best time to choose the surgical treatment. However, it is recognized that the cerebral hemodynamic status should be carefully evaluated before and after surgical revascularization.
Hemodynamic Characteristics of MMD and MMS
Reported mechanism (Fig. 5) of MMD and MMS demonstrate that progressive nature of MMD and MMS leads to sustained reduction of cerebral perfusion pressure (CPP). Decreased CPP could cause the reduction of CBF. Fortunately, CBF can be still within the normal range due to the autoregulation, which is referring to the vasodilation of resistance arterioles, and this ability to maintain CBF is termed CVR. When the autoregulation cannot offset the effect of decreased CPP, CBF will decrease as well. To maintain normal oxygen metabolism, compensatory increases in oxygen extraction fraction (OEF) could work temporarily and this phenomenon is named misery perfusion. Ischemic symptom will come up if the reduction of CPP beyond the limit of compensatory increases of OEF. Cerebral blood volume (CBV) comprises arterial, capillary, venous, parenchyma, and pial components. It may increase because of autoregulation when the CPP decreases; however, the results could be variable in different studies. Other hemodynamics parameters, such as mean transit time (MTT) and time to peak (TTP), could also be used to reflect the cerebral hemodynamic changes of MMDs. Among these hemodynamic parameters, CVR may be the most valuable indicator for choosing therapeutic regimen. To figure out the CVR, resting CBF and activated CBF should be measured respectively. Acetazolamide or CO2 is often used as the vasodilator. Sometimes, the blood may flow into areas where the autoregulation can still work from areas where vasodilation is at its maximum. When treated with surgical revascularization, elevated CBF may cause hyperperfusion syndrome, some of which could lead to transient or permanent neurological deficits.
FIGURE 5.
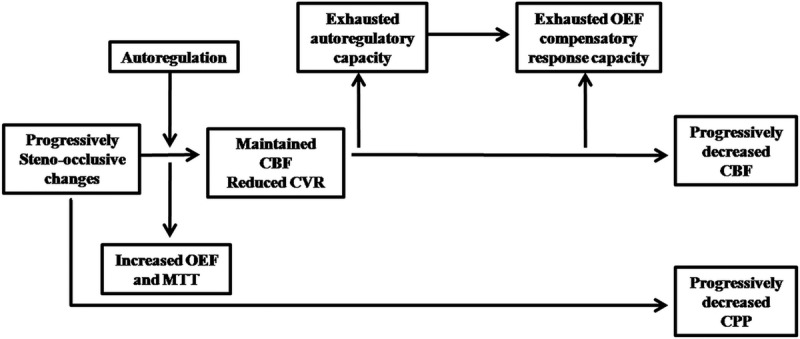
Basic changes of cerebral hemodynamics in MMD and MMS. Abbreviation: MTT, mean transit time.
Quantitative Modalities of MMD and MMS
Single-photon emission CT, PET, xenon-enhanced computed tomography (Xe-CT), perfusion CT, dynamic susceptibility contrast (DSC), and arterial spin labeling (ASL) MRI, quantitative DSA (QDSA), as well as other modalities could be used in evaluation of cerebral hemodynamic status in MMD and MMS. Each of them has its merit and demerit. Single-photon emission CT, PET, and Xe-CT may be the top-quality methods on account of their good quantitative accuracy, and they are often used as the reference standard. However, they are expensive and have risks of radiation damage. In addition, PET and Xe-CT are not always available, especially the Xe-CT for the Xenon gas, and the hardware of Xe-CT can be only found in few institutions of some countries.5,32 On the contrary, perfusion CT, DSC and ASL-MRI, and Doppler are easier to go with. Recently, ASL-MR has been widely used for assessment of MMD because of its repeatability and lack of radiation and no need of intravenous contrast.33–36 Doppler may be the most convenient method in this situation; however, it is an indirect method for evaluating cerebral hemodynamic status and operator dependent. quantitative digital subtraction angiography is another approach to reflect the cerebral hemodynamic status in MMD, and its results may be affected by the injection rate, total amount of the contrast media catheter tip, and the patient's cardiac function.37,38 A number of articles had focused on assessment of preoperative and postoperative cerebral hemodynamic status of MMD and MMS with different modalities.
Assessment of Preoperative and Postoperative Hemodynamics and Cerebral Oxygen Metabolism of MMD and MMS
Single-Photon Emission CT
Single-photon emission CT can use the 133Xe, 99mTc-HMPAO, 99mTc-ECD, and 123I-IMP as the blood tracer to evaluate the regional CBF and CVR in MMD. A study of Honda et al39 by using Split-dose 123I-IMP SPECT reported that resting regional CBF increased significantly in treated hemispheres and the frontal lobe of unaffected hemispheres, whereas only the CVR in the frontal lobe of treated hemispheres increased significantly in MMD patients after surgery. Marushima et al40 found that regional CBF and CVR obtained from 99mTc-ECD SPECT during conservative therapy or before and after revascularization surgery were useful to assess clinical status in MMD patients. In their study, CBF of hemispheres with a hemodynamic disorder was significantly lower than that of normal contrast and increased significantly after surgery. The follow-up CVR decreased significantly if no revascularization was performed. The results of Fujimura et al41 showed that 21.5% of hemispheres of MMD patients who received EC-IC bypass could develop symptomatic hyperperfusion evaluated by 123I-IMP SPECT. They declared that MMD patients tend to develop symptomatic hyperperfusion after EC-IC bypass compared with the other occlusive cerebrovascular diseases.41
Positron Emission Tomography
Positron emission tomography may be one of the most reliable quantitative assessment modalities for MMD and MMS, and it could be used to evaluate the CBF, CBV, OEF, and cerebral metabolic rate of oxygen (CMRO2). In this technique, some tracers, such as H215O, C15O2, and 15O2, are often used.42 The findings may vary among different researches. Kuhn et al43 retrospectively analyzed preoperation and postoperation CBF and CVR measured by H215O PET of 14 pediatric MMD patients. The results of their study showed that the preoperation deficits of resting CBF, activated CBF, and CVR were more prominent in cortical rather than that of subcortical regions or cerebellum, and these deficits were most evident in MCA and ACA regions. Significant improvement of resting CBF and activated CBF could be found in postoperation measurements. However, no significant differences can be seen in CVR. The authors also thought that it might be caused by small sample size, steal phenomenon, and relatively short interval between preoperation and postoperation follow-up PET, which was not long enough for recovery of brain tissues. Kuroda et al44 reported that approximately 80% of adult and pediatric MMD patients with lesions involved hemispheres had significant depression of CMRO2 measured by 15O2 gas PET, and significant improvement of CMRO2 could be found after revascularization in pediatric or younger adult patients without parenchymal lesions, even though the underlying mechanisms are still unclear.
Xe-CT
Xe-CT has been a reliable method to quantitatively measure CBF for a long-term following-up. Cerebral vascular reserve can be calculated as well if the vasodilator is used with Xe-CT. Several earlier studies had investigated its usefulness for evaluation of MMD.45,46 McAuley et al47 suggested that Xe-CT could be used to assess the stroke risk in pediatric MMD patient population and predict surgical outcome earlier than DSA.
Perfusion CT
The acquisition time of perfusion CT, which has satisfactory temporal resolution and spatial resolution, is relatively short. With the progress of CT hardware, whole-brain hemodynamics can be also obtained by perfusion CT. Thus, perfusion CT can be used in evaluation of cerebral hemodynamic parameters, such as CBF, CBV, MTT, and TTP. Zhang et al48 analyzed the preoperation and postoperation whole-brain perfusion CT values of 39 MMD patients using 256-slice CT. The results showed that postoperative CBF, relative CBF, and relative CBV values of surgical sites were significantly increased, whereas the postoperative MTT, TTP, relative MTT, and relative TTP (rTTP) were significantly decreased in the region of MCA compared with those of preoperation.48 Dai et al49 used the perfusion CT to evaluate the effects of multiple burr hole surgery on adult ischemic MMD. The cerebral hemodynamic changes of 6-month follow-up were the same as those of Zhang et al,48 and they also suggested that CBF and TTP, especially the rTTP, were sensitive to the presence of early altered cerebral hemodynamics after indirect revascularization. Acetazolamide can be also used in perfusion CT to assess the CVR. Kang et al50 reported that the quantitative CVR obtained from perfusion CT was comparable with that of PET or SPECT.50
Dynamic Susceptibility Contrast and ASL-MRI
Both of the 2 imaging modalities are noninvasive and do not expose the patients to ionizing radiation. Dynamic susceptibility contrast MRI can be easy to assess and performed on children. However, its application needs injection of contrast media and the signal intensity is affected by several factors, for instance, bolus delay and nonlinear contrast relaxivity. Thus, CBF measured by DSC is relatively reliable. In addition, the interpretation of DSC may be difficult and lack standardization. Tanaka et al51 found that CBV and MTT measured by DSC were valuable in MMD patients when compared with PET, and prolonged MTT may suggest the presence of misery perfusion. Arterial spin labeling MRI may be a more acceptable method because it is completely noninvasive and uses endogenous water as a tracer. However, extensive collaterals of MMDs can prolong arterial transit delays and thereby result in inaccurate assessment of perfusion. Goetti et al36 demonstrate the possibility of using ASL-MRI to evaluate DSC for detection of reduced perfusion per vascular territory in pediatric MMD patients. Wang et al52 suggested that perfusion data from multidelay ASL-MRI are accurate as that from CT perfusion. Goetti et al53 reported that ASL-MRI had a good correlation with H215O PET in quantitative evaluation of CBF in children and young adult MMD patients. Noguchi et al54 used a standard ASL-MRI sequences and pulse-wave–synchronized ASL to obtain the CVR of MMD patients. They found similar results compared with those determined by 123I-IMP SPECT.54
Quantitative DSA
Although the conventional DSA is still the criterion standard for evaluating the severity of MMD, it is frustrating that the imaging finding of conventional DSA cannot reflect the hemodynamic changes of MMD. As an alternative, QDSA may offset this drawback. Using QDSA, Hung et al38 measured the delay time of maximal opacification between ICA and MCA in MMD patients without bypass surgery. They found that delay time of maximal opacification significantly correlated with the Suzuki staging and closer correlation with prolonged rTTP measured by DSC.38 However, standardizing the DSA procedures is required to minimize the affection of the injection rate and the total amount of the contrast medium.37
Doppler
Doppler is a completely noninvasive, real-time, easily repeatable, readily available, and economical method for evaluation of hemodynamics of MMD.55 It offers information about quantitative flow characteristics, including ratio between systolic and end-diastolic velocity, flow resistance, and vessel pulsatility. This technique has been used to measure blood flow volume in the ICA as a correlate for CBF in the corresponding hemispheres.12,45 Thus, Doppler can be used to assess the preoperative and postoperative changes of MMD and MMS. Ruan et al56 reported that transcranial color Doppler and power Doppler can be used to display the steno-occlusive changes of intracranial arteries and Moyamoya vessels, which could be used to make diagnosis of MMD when combined with the symptoms and hemodynamic changes of extracranial arteries. Some authors suggested that duplex ultrasonography is a reliable method to evaluate the postoperative changes of MMD.57,58
CONCLUSIONS
To this day, different imaging modalities have been used for diagnosis of MMD and MMS and for evaluation of the prognosis after various treatments of MMD and MMS. Each of these imaging techniques has its strengths and weaknesses, and each of them can be performed for different purposes in management of MMD and MMS. Apparently, the most valuable and acceptable imaging modality is based on the facts that it should have less injury to the human body, need less or no injection of contrast media, as well as be technically stable and convenient. Quantitative MRI-based methods and Doppler may become promising tools for accurate diagnosis of MMD and MMS, whereas establishment of standardized protocols for preoperative and postoperative evaluation with different imaging techniques is warranted in the further science for MMD and MMS.
Footnotes
The authors declare no conflict of interest.
J.L. and M.J. contributed equally to this work.
REFERENCES
- 1.Suzuki J, Takaku A. Cerebrovascular “moyamoya” disease. Disease showing abnormal net-like vessels in base of brain. Arch Neurol. 1969;20:288–299. [DOI] [PubMed] [Google Scholar]
- 2.Scott RM, Smith ER. Moyamoya disease and moyamoya syndrome. N Engl J Med. 2009;360:1226–1237. [DOI] [PubMed] [Google Scholar]
- 3.Phi JH, Wang KC, Lee JY, et al. Moyamoya syndrome: a window of moyamoya disease. J Korean Neurosurg Soc. 2015;57:408–414. [DOI] [PMC free article] [PubMed] [Google Scholar]
- 4.Liu XJ, Zhang D, Wang S, et al. Clinical features and long-term outcomes of moyamoya disease: a single-center experience with 528 cases in China. J Neurosurg. 2015;122:392–399. [DOI] [PubMed] [Google Scholar]
- 5.Lee M, Zaharchuk G, Guzman R, et al. Quantitative hemodynamic studies in moyamoya disease: a review. Neurosurg Focus. 2009;26:E5. [DOI] [PMC free article] [PubMed] [Google Scholar]
- 6.Kuroda S, Houkin K. Moyamoya disease: current concepts and future perspectives. Lancet Neurol. 2008;7:1056–1066. [DOI] [PubMed] [Google Scholar]
- 7.Calamante F, Ganesan V, Kirkham FJ, et al. MR perfusion imaging in Moyamoya syndrome: potential implications for clinical evaluation of occlusive cerebrovascular disease. Stroke. 2001;32:2810–2816. [DOI] [PubMed] [Google Scholar]
- 8.Togao O, Mihara F, Yoshiura T, et al. Cerebral hemodynamics in Moyamoya disease: correlation between perfusion-weighted MR imaging and cerebral angiography. Am J Neuroradiol. 2006;27:391–397. [PMC free article] [PubMed] [Google Scholar]
- 9.Suzuki J, Kodama N. Moyamoya disease - a review. Stroke. 1983;14:104–109. [DOI] [PubMed] [Google Scholar]
- 10.Chen Q, Qi R, Cheng X, et al. Assessment of extracranial-intracranial bypass in Moyamoya disease using 3T time-of-flight MR angiography: comparison with CT angiography. VASA. 2014;43:278–283. [DOI] [PubMed] [Google Scholar]
- 11.Sugino T, Mikami T, Ohtaki S, et al. Assessment of moyamoya disease using multidetector row computed tomography. J Stroke Cerebrovasc Dis. 2013;22:644–649. [DOI] [PubMed] [Google Scholar]
- 12.Bacigaluppi S, Dehdashti AR, Agid R, et al. The contribution of imaging in diagnosis, preoperative assessment, and follow-up of moyamoya disease: a review. Neurosurg Focus. 2009;26:E3. [DOI] [PubMed] [Google Scholar]
- 13.Han A, Yoon DY, Kim ES, et al. Value of ct angiography for the detection of intracranial vascular lesions in patients with acute severe headache. Eur Radiol. 2013;23:1443–1449. [DOI] [PubMed] [Google Scholar]
- 14.Saeki N, Silva MN, Kubota M, et al. Comparative performance of magnetic resonance angiography and conventional angiography in moyamoya disease. J Clin Neurosci. 2000;7:112–115. [DOI] [PubMed] [Google Scholar]
- 15.Fushimi Y, Miki Y, Kikuta K, et al. Comparison of 3.0- and 1.5-t three-dimensional time-of-flight MR angiography in moyamoya disease: preliminary experience. Radiology. 2006;239:232–237. [DOI] [PubMed] [Google Scholar]
- 16.Jin Q, Noguchi T, Irie H, et al. Assessment of moyamoya disease with 3.0-t magnetic resonance angiography and magnetic resonance imaging versus conventional angiography. Neurol Med Chir. 2011;51:195–200. [DOI] [PubMed] [Google Scholar]
- 17.Yamada I, Suzuki S, Matsushima Y. Moyamoya disease: diagnostic accuracy of MRI. Neuroradiology. 1995;37:356–361. [DOI] [PubMed] [Google Scholar]
- 18.Hu P, Sun J, Jin Y, et al. Conventional computed tomography and axial magnetic resonance t2-weighted imaging of horizontal segment of middle cerebral artery in moyamoya disease or syndrome in adult patients. J Stroke Cerebrovasc Dis. 2015. [DOI] [PubMed] [Google Scholar]
- 19.Yuan M, Liu ZQ, Wang ZQ, et al. High-resolution MR imaging of the arterial wall in moyamoya disease. Neurosci Lett. 2015;584:77–82. [DOI] [PubMed] [Google Scholar]
- 20.Kaku Y, Morioka M, Ohmori Y, et al. Outer-diameter narrowing of the internal carotid and middle cerebral arteries in moyamoya disease detected on 3d constructive interference in steady-state MR image: is arterial constrictive remodeling a major pathogenesis? Acta Neurochir. 2012;154:2151–2157. [DOI] [PubMed] [Google Scholar]
- 21.Ohta T, Tanaka H, Kuroiwa T. Diffuse leptomeningeal enhancement, “ivy sign,” in magnetic resonance images of moyamoya disease in childhood: case report. Neurosurgery. 1995;37:1009–1012. [DOI] [PubMed] [Google Scholar]
- 22.Vuignier S, Ito M, Kurisu K, et al. Ivy sign, misery perfusion, and asymptomatic moyamoya disease: flair imaging and (15)o-gas positron emission tomography. Acta Neurochir. 2013;155:2097–2104. [DOI] [PubMed] [Google Scholar]
- 23.Houkin K, Nakayama N, Kuroda S, et al. Novel magnetic resonance angiography stage grading for moyamoya disease. Cerebrovasc Dis. 2005;20:347–354. [DOI] [PubMed] [Google Scholar]
- 24.Fujiwara H, Momoshima S, Kuribayashi S. Leptomeningeal high signal intensity (ivy sign) on fluid-attenuated inversion-recovery (FLAIR) MR images in moyamoya disease. Eur J Radiol. 2005;55:224–230. [DOI] [PubMed] [Google Scholar]
- 25.Mori N, Mugikura S, Higano S, et al. The leptomeningeal “ivy sign” on fluid-attenuated inversion recovery MR imaging in moyamoya disease: a sign of decreased cerebral vascular reserve? AJNR Am J Neuroradiol. 2009;30:930–935. [DOI] [PMC free article] [PubMed] [Google Scholar]
- 26.Kaku Y, Iihara K, Nakajima N, et al. The leptomeningeal ivy sign on fluid-attenuated inversion recovery images in moyamoya disease: positron emission tomography study. Cerebrovasc Dis. 2013;36:19–25. [DOI] [PubMed] [Google Scholar]
- 27.Tong KA, Ashwal S, Obenaus A, et al. Susceptibility-weighted MR imaging: a review of clinical applications in children. Am J Neuroradiol. 2008;29:9–17. [DOI] [PMC free article] [PubMed] [Google Scholar]
- 28.Horie N, Morikawa M, Nozaki A, et al. “Brush sign” on susceptibility-weighted MR imaging indicates the severity of moyamoya disease. AJNR Am J Neuroradiol. 2011;32:1697–1702. [DOI] [PMC free article] [PubMed] [Google Scholar]
- 29.Fung LW, Thompson D, Ganesan V. Revascularisation surgery for paediatric moyamoya: a review of the literature. Childs Nerv Syst. 2005;21:358–364. [DOI] [PubMed] [Google Scholar]
- 30.Jo KI, Yeon JY, Hong SC, et al. Clinical course of asymptomatic adult moyamoya disease. Cerebrovasc Dis. 2014;37:94–101. [DOI] [PubMed] [Google Scholar]
- 31.Fujimura M, Tominaga T. Lessons learned from moyamoya disease: outcome of direct/indirect revascularization surgery for 150 affected hemispheres. Neurol Med Chir. 2012;52:327–332. [DOI] [PubMed] [Google Scholar]
- 32.Schubert GA, Weinmann C, Seiz M, et al. Cerebrovascular insufficiency as the criterion for revascularization procedures in selected patients: a correlation study of xenon contrast-enhanced CT and PWI. Neurosurg Rev. 2009;32:29–35; discussion 35-26. [DOI] [PubMed] [Google Scholar]
- 33.Zaharchuk G, Do HM, Marks MP, et al. Arterial spin-labeling MRI can identify the presence and intensity of collateral perfusion in patients with moyamoya disease. Stroke. 2011;42:2485–U2183. [DOI] [PMC free article] [PubMed] [Google Scholar]
- 34.Noguchi T, Kawashima M, Nishihara M, et al. Arterial spin-labeling MR imaging in Moyamoya disease compared with clinical assessments and other MR imaging findings. Eur J Radiol. 2013;82:e840–e847. [DOI] [PubMed] [Google Scholar]
- 35.Sugino T, Mikami T, Miyata K, et al. Arterial spin-labeling magnetic resonance imaging after revascularization of moyamoya disease. J Stroke Cerebrovasc Dis. 2013;22:811–816. [DOI] [PubMed] [Google Scholar]
- 36.Goetti R, O'Gorman R, Khan N, et al. Arterial spin labelling MRI for assessment of cerebral perfusion in children with moyamoya disease: comparison with dynamic susceptibility contrast MRI. Neuroradiology. 2013;55:639–647. [DOI] [PubMed] [Google Scholar]
- 37.Cheon JE. Quantitative digital subtraction angiography in pediatric moyamoya disease. J Korean Neurosurg Soc. 2015;57:432–435. [DOI] [PMC free article] [PubMed] [Google Scholar]
- 38.Hung SC, Liang ML, Lin CF, et al. New grading of moyamoya disease using color-coded parametric quantitative digital subtraction angiography. J Chin Med Assoc. 2014;77:437–442. [DOI] [PubMed] [Google Scholar]
- 39.Honda M, Ezaki Y, Kitagawa N, et al. Quantification of the regional cerebral blood flow and vascular reserve in moyamoya disease using split-dose iodoamphetamine I 123 single-photon emission computed tomography. Surg Neurol. 2006;66:155–159. [DOI] [PubMed] [Google Scholar]
- 40.Marushima A, Tsurushima H, Suzuki K, et al. Time-course analysis of brain perfusion single photon emission computed tomography using a three-dimensional stereotactic region-of-interest template in patients with moyamoya disease. World Neurosurg. 2011;76:304–310. [DOI] [PubMed] [Google Scholar]
- 41.Fujimura M, Shimizu H, Inoue T, et al. Significance of focal cerebral hyperperfusion as a cause of transient neurologic deterioration after extracranial-intracranial bypass for moyamoya disease: comparative study with non-moyamoya patients using N-isopropyl-p-[(123)I]iodoamphetamine single-photon emission computed tomography. Neurosurgery. 2011;68:957–964. [DOI] [PubMed] [Google Scholar]
- 42.Ibaraki M, Miura S, Shimosegawa E, et al. Quantification of cerebral blood flow and oxygen metabolism with 3-dimensional pet and 15o: validation by comparison with 2-dimensional pet. J Nucl Med. 2007;49:50–59. [DOI] [PubMed] [Google Scholar]
- 43.Kuhn FP, Warnock G, Schweingruber T, et al. Quantitative h2[(15)o]-pet in pediatric moyamoya disease: evaluating perfusion before and after cerebral revascularization. J Stroke Cerebrovasc Dis. 2015;24:965–971. [DOI] [PubMed] [Google Scholar]
- 44.Kuroda S, Kashiwazaki D, Hirata K, et al. Effects of surgical revascularization on cerebral oxygen metabolism in patients with Moyamoya disease: an 15O-gas positron emission tomographic study. Stroke. 2014;45:2717–2721. [DOI] [PubMed] [Google Scholar]
- 45.Horowitz M, Yonas H, Albright AL. Evaluation of cerebral blood flow and hemodynamic reserve in symptomatic moyamoya disease using stable xenon-CT blood flow. Surg Neurol. 1995;44:251–261. [DOI] [PubMed] [Google Scholar]
- 46.Nambu K, Suzuki R, Hirakawa K. Cerebral blood flow: measurement with xenon-enhanced dynamic helical CT. Radiology. 1995;195:53–57. [DOI] [PubMed] [Google Scholar]
- 47.McAuley DJ, Poskitt K, Steinbok P. Predicting stroke risk in pediatric moyamoya disease with xenon-enhanced computed tomography. Neurosurgery. 2004;55:327–332. [DOI] [PubMed] [Google Scholar]
- 48.Zhang J, Wang JH, Geng DY, et al. Whole-brain CT perfusion and CT angiography assessment of Moyamoya disease before and after surgical revascularization: preliminary study with 256-slice CT. PloS One. 2013;8:e57595. [DOI] [PMC free article] [PubMed] [Google Scholar]
- 49.Dai DW, Zhao WY, Zhang YW, et al. Role of ct perfusion imaging in evaluating the effects of multiple burr hole surgery on adult ischemic Moyamoya disease. Neuroradiology. 2013;55:1431–1438. [DOI] [PMC free article] [PubMed] [Google Scholar]
- 50.Kang KH, Kim HS, Kim SY. Quantitative cerebrovascular reserve measured by acetazolamide-challenged dynamic ct perfusion in ischemic adult moyamoya disease: initial experience with angiographic correlation. AJNR Am J Neuroradiol. 2008;29:1487–1493. [DOI] [PMC free article] [PubMed] [Google Scholar]
- 51.Tanaka Y, Nariai T, Nagaoka T, et al. Quantitative evaluation of cerebral hemodynamics in patients with moyamoya disease by dynamic susceptibility contrast magnetic resonance imaging—comparison with positron emission tomography. J Cereb Blood Flow Metab. 2006;26:291–300. [DOI] [PubMed] [Google Scholar]
- 52.Wang R, Yu S, Alger JR, et al. Multi-delay arterial spin labeling perfusion MRI in moyamoya disease—comparison with ct perfusion imaging. Eur Radiol. 2014;24:1135–1144. [DOI] [PMC free article] [PubMed] [Google Scholar]
- 53.Goetti R, Warnock G, Kuhn FP, et al. Quantitative cerebral perfusion imaging in children and young adults with Moyamoya disease: comparison of arterial spin-labeling-MRI and H(2)[(15)O]-PET. AJNR Am J Neuroradiol. 2014;35:1022–1028. [DOI] [PMC free article] [PubMed] [Google Scholar]
- 54.Noguchi T, Kawashima M, Nishihara M, et al. Noninvasive method for mapping CVR in moyamoya disease using ASL-MRI. Eur J Radiol. 2015;84:1137–1143. [DOI] [PubMed] [Google Scholar]
- 55.Wintermark M, Sincic R, Sridhar D, et al. Cerebral perfusion CT: technique and clinical applications. J Neuroradiol. 2008;35:253–260. [DOI] [PubMed] [Google Scholar]
- 56.Ruan LT, Duan YY, Cao TS, et al. Color and power Doppler sonography of extracranial and intracranial arteries in Moyamoya disease. J Clin Ultrasound. 2006;34:60–69. [DOI] [PubMed] [Google Scholar]
- 57.Wang Y, Chen L, Wang Y, et al. Hemodynamic study with duplex ultrasonography on combined (direct/indirect) revascularization in adult moyamoya disease. J Stroke Cerebrovasc Dis. 2014;23:2573–2579. [DOI] [PubMed] [Google Scholar]
- 58.Kraemer M, Schuknecht B, Jetzer AK, et al. Postoperative changes in the superficial temporal artery and the external carotid artery duplex sonography after extra-intracranial bypass surgery in European Moyamoya disease. Clin Neurol Neurosurg. 2012;114:930–934. [DOI] [PubMed] [Google Scholar]