Abstract
The purpose of this study was to investigate the findings of diffuse periportal enhancement in the liver on hepatobiliary phase gadoxetate disodium-enhanced magnetic resonance images by comparing with the finding of periportal hyperintensity on T2-weighted images and to reveal their clinical significance.
Nineteen consecutive patients with diffuse periportal enhancement on hepatobiliary phase images constituted the study population. The intrahepatic diffuse periportal enhancement finding was assessed on whether it corresponded to periportal hyperintense patterns on T2-weighted images or not in the location, and the cases were classified into 2 groups according to this characteristic. Signal intensities at the periportal areas were also assessed on T1-, T2-, diffusion-weighted and dynamic images. Furthermore, possible associations between these image findings and the final diagnoses were explored.
In 7 of the 19 patients, periportal enhancement area corresponded with the periportal hyperintensity area on T2-weighted images. In the remaining 12 patients, the finding of periportal T2-hyperintensity was absent or the periportal enhancement differed from the periportal T2-hyperintensity in the location. Diseases of the former group comprised autoimmune hepatitis, acute exacerbation of chronic hepatitis and acute alcoholic steatohepatitis, and those of the latter group primary sclerosing cholangitis, autoimmune hepatitis-primary biliary cirrhosis overlap syndrome, and liver cirrhosis with miscellaneous etiology.
Diffuse periportal enhancement during the hepatobiliary phase did not always correspond to periportal hyperintensity on T2-weighted images. In the classification based on whether enhancement area corresponded or not, each enhancement pattern appeared in different groups of liver diseases. Specifically, the former (corresponding) was associated with active inflammation such as hepatitis and the latter (not corresponding) was predominantly associated with a chronic change such as cirrhosis. Appropriate recognition of these periportal enhancement patterns may contribute to the improved diagnosis of diffuse liver diseases.
Keywords: Gd-EOB-DTPA, liver, magnetic resonance imaging, primary biliary cirrhosis, primary sclerosing cholangitis
1. Introduction
Diffuse liver diseases include a wide range of diseases with various etiologies such as storage, vascular, and inflammatory disorders.[1–5] The clinical diagnosis of these diseases is generally based on clinical presentation, blood tests including serological assays, and histopathological evaluation.[3–5] Of these, histopathological evaluation by means of liver biopsy is the standard reference for the diagnosis of diffuse liver diseases.[3–5] However, liver biopsy is an invasive procedure involving potential complications[6,7] and can result in sampling errors since only a tiny fraction of the liver can be captured.[8,9] Several studies have found that imaging study can also play a beneficial role in the diagnosis of diffuse liver diseases.[10–16]
Gadoxetate disodium is a liver-specific contrast agent for magnetic resonance (MR) imaging.[17–22] Many researchers have subjected gadoxetate disodium-enhanced MR imaging to rigorous investigations and have found its diagnostic performance is superior for the detection and characterization of focal liver lesions.[23–28] For diffuse liver diseases, several studies have examined the usefulness of gadoxetate disodium-enhanced MR imaging, and then mainly as a functional imaging tool for staging hepatic fibrosis.[29,30]
In our clinical practice, we came across the relatively uncommon finding of diffuse periportal enhancement patterns in the liver on hepatobiliary phase gadoxetate disodium-enhanced MR images showing relatively higher enhancement areas around the portal tracts and lower enhancement of the remaining areas of the liver. Several studies have investigated periportal signal abnormalities on T2-weighted images, which predominantly reflected periportal edema.[9,12–14,31–33] However, only 1 study has addressed the findings of periportal signal abnormalities on images obtained with hepatobiliary contrast agents.[34] The purpose of this study was therefore to investigate the finding of diffuse periportal enhancement in the liver on hepatobiliary phase images by comparing with the finding of periportal hyperintensity on T2-weighted images and other image findings and to explore the possible relationships between the image finding and corresponding liver conditions in reference with clinical data.
2. Materials and methods
2.1. Study population
A total of 1655 consecutive patients who underwent gadoxetate disodium-enhanced liver MR imaging for the evaluation of focal or diffuse liver diseases between April 2010 and April 2012 were eligible for this retrospective study. One abdominal radiologist (blinded data) with 15 years of experience retrospectively evaluated the hepatobiliary phase MR images of all the patients focusing on the presence or absence of intrahepatic diffuse periportal enhancement finding. Subsequently, 19 of 1655 patients showed the finding on the hepatobiliary phase images, who constituted the study population. Approval of the local institutional ethics board was waived by the chairman of the institutional ethics committee since all studies were performed as part of the clinical diagnostic workup for liver disease.
2.2. Liver MR imaging
MR imaging was performed on a 1.5-T (Magnetom Avanto or Magnetom Aera; Siemens Healthcare, Erlangen, Germany) or a 3.0-T system (Magnetom Verio; Siemens Healthcare) with phased array coils centered over the liver.
The standard liver MR protocol at our institution consists of T1-, T2- and diffusion-weighted images, contrast-enhanced dynamic images (precontrast, arterial, portal venous, and late venous phase), and hepatobiliary phase images obtained 20 minutes after injection of the contrast agent. For contrast enhancement, 10 mL of gadoxetate disodium (Primovist; Bayer-Schering Pharma AG, Berlin, Germany) was administered intravenously at 1 mL/s, followed by 20 mL of a saline flush. Acquisition parameters are listed in Table 1.
Table 1.
MR imaging sequences and parameters.

2.3. Qualitative image analysis
The intrahepatic diffuse periportal enhancement finding was assessed on whether it corresponded to periportal hyperintense patterns on T2-weighted images or not in the location, and the cases were classified into 2 groups according to this characteristic: corresponding periportal enhancement pattern and noncorresponding periportal enhancement pattern. Signal intensities at the periportal area and its surrounding area were assessed on T1-, T2-, diffusion-weighted, and dynamic images in detail. In addition, the presence or absence of hepatic steatosis was determined on the basis of the findings of in- and opposed-phase T1-weighted gradient echo imaging. Enhancement of biliary tracts during the hepatobiliary phase was also evaluated.
Furthermore, possible associations between these findings and the final diagnoses based on the clinical course and on laboratory findings including serological data and/or histological findings were explored.
2.4. Quantitative image analysis
The signal intensities of the liver at the periportal areas and the remainder and the spleen parenchyma were measured. The regions of interest (ROIs) for the liver and spleen parenchyma, not including the large vessels, were placed on the axial precontrast and hepatobiliary phase images at the same location. For each area, 2 ROIs, each measuring 0.5 to 1.0 cm2, were evaluated and the values averaged. For assessment of enhancement of the liver parenchyma, the liver-spleen relative enhancement ratio was calculated with the following equation:
 |
where SI = signal intensity, HBP = hepatobiliary phase, and pre = precontrast.
The liver-spleen relative enhancement ratios for the patients with periportal enhancement were compared with those for ten patients without evidence of diffuse liver disease selected with frequency match on age decade (ie, normal control group). The ratio of the normal control group to corresponding periportal enhancement group or noncorresponding periportal enhancement group was one to one, respectively.
2.5. Statistical analysis
The laboratory data were compared between corresponding and noncorresponding periportal enhancement groups with Welch t test. The liver–spleen relative enhancement ratios for the patient groups with periportal enhancement and the control group were compared by means of a multiple comparison test (Dunnet procedure). A P-value of less than .05 was considered to indicate a significant difference.
3. Results
In 7 of the 19 patients, periportal enhancement areas corresponded with the periportal hyperintensity areas on T2-weighted images (ie, corresponding periportal enhancement pattern, type A). In the remaining 12 patients, the finding of periportal T2-hyperintensity was absent (type B, n = 4) or the periportal enhancement areas located immediately external to the periportal T2-hyperintense areas (type C, n = 8) (ie, noncorresponding periportal enhancement pattern). Schematic illustrations of these periportal enhancement patterns on hepatobiliary phase are shown in Figure 1.
Figure 1.
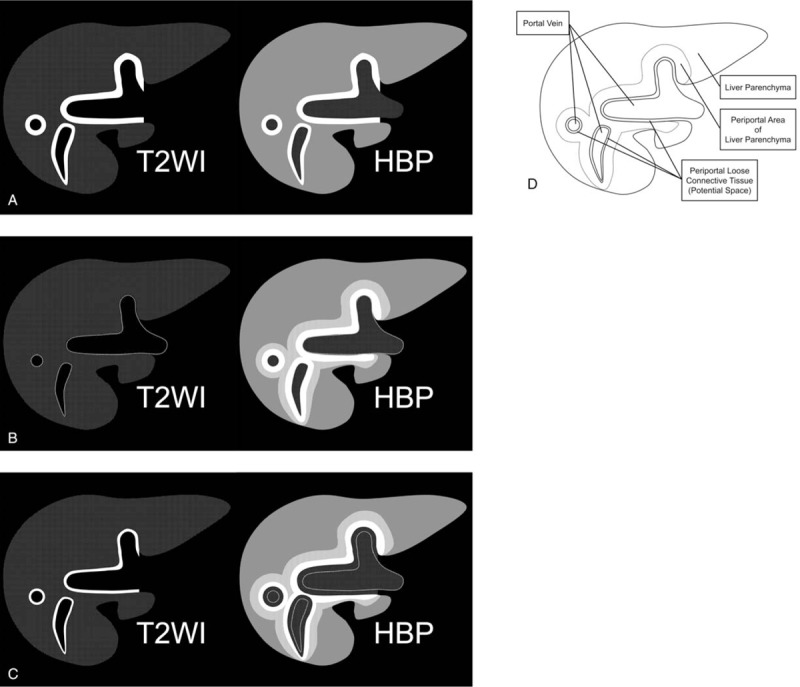
Schematic illustrations of periportal enhancement patterns on hepatobiliary phase gadoxetate disodium-enhanced MR images. (a) Corresponding periportal enhancement pattern. The periportal enhancement areas during the hepatobiliary phase match the periportal hyperintense areas on fat-suppressed T2-weighted images (type A). (b and c) Noncorresponding periportal enhancement pattern. Periportal hyperintensity on T2-weighted images was absent (type B) or periportal enhancement areas are located immediately outside of the periportal T2-hyperintense areas (type C). (d) Anatomy of periportal areas in the liver. HBP = hepatobiliary phase image, MR = magnetic resonance, T2WI = T2-weighted image.
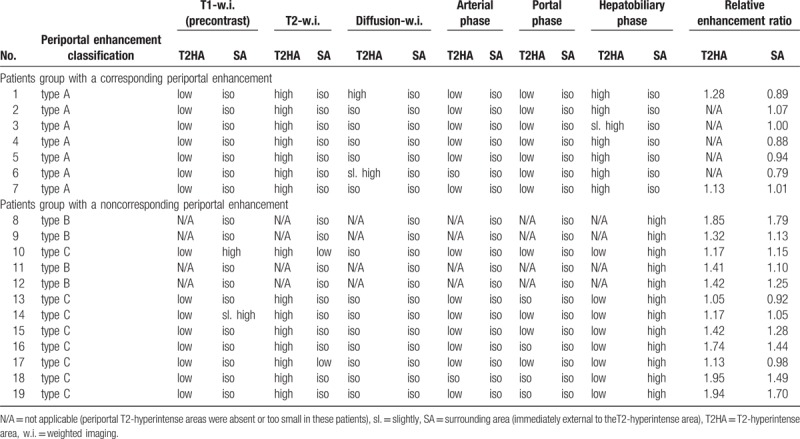
Table 2 shows signal intensities at the periportal areas on each imaging sequence. Two of the 12 patients in the noncorresponding enhancement group showed hypointense periportal halo signs on the T2-weighted images, which did not completely correspond to the enhanced areas. Although 4 patients (2 in the corresponding group and 2 in the noncorresponding group) were suspected of having liver steatosis based on the findings of in- and opposed-phase T1-weighted images, none of these patients showed inhomogeneous fat deposition or focal fatty sparing with a periportal predominance. Hepatobiliary phase images showed good enhancement of the biliary tracts in 1 of the corresponding group and in 11 of the noncorresponding group but poor enhancement in the remaining patients of both groups.
Table 2.
Signal intensities at the periportal areas on each sequence in patients with diffuse periportal hepatobiliary enhancement.
Patient backgrounds and final diagnoses of their liver disorders are listed in Table 3. In the corresponding enhancement group, 2 were diagnosed with autoimmune hepatitis (Fig. 2), 3 with autoimmune hepatitis or drug-induced hepatitis (or primary biliary cirrhosis), 1 with acute exacerbation of chronic hepatitis B and 1 with acute alcoholic steatohepatitis. In the noncorresponding enhancement group, 2 were diagnosed with primary sclerosing cholangitis (Fig. 3), 1 with autoimmune hepatitis-primary biliary cirrhosis overlap syndrome (Fig. 4), 1 with cryptogenic cholestatic chronic hepatitis, 1 was clinically suspected of having autoimmune cholangitis, 1 of having azathioprine-induced liver cirrhosis, 2 were diagnosed with alcohol-related (and hepatitis C virus-induced) liver cirrhosis, 3 with liver cirrhosis with unclear etiology, and 1 with cholestatic hepatopathy associated with Crohn disease. The mean total bilirubin level in the corresponding periportal enhancement group (11.2 mg/dL) was significantly higher than that in the noncorresponding group (1.3 mg/dL, P < .05). The mean aspartate aminotransferase and alanine aminotransferase levels in the corresponding group (1022 IU/L and 1168 IU/L, respectively) were also higher than those in the noncorresponding group (57 IU/L, 63 IU/L), although the difference did not reach statistical significance (P = .11 and .09, respectively).
Table 3.
Patient backgrounds and final diagnoses.
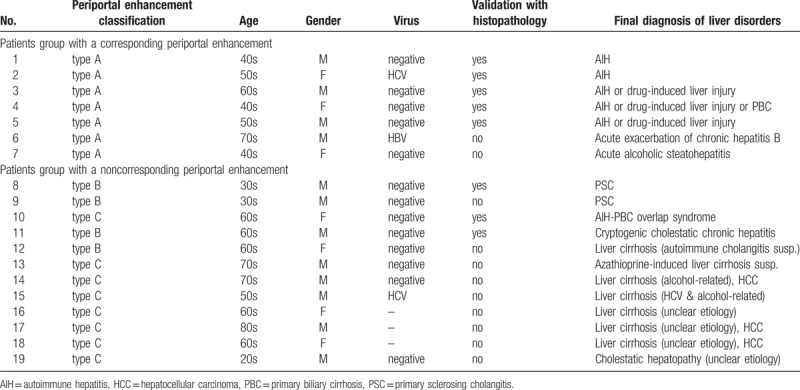
Figure 2.
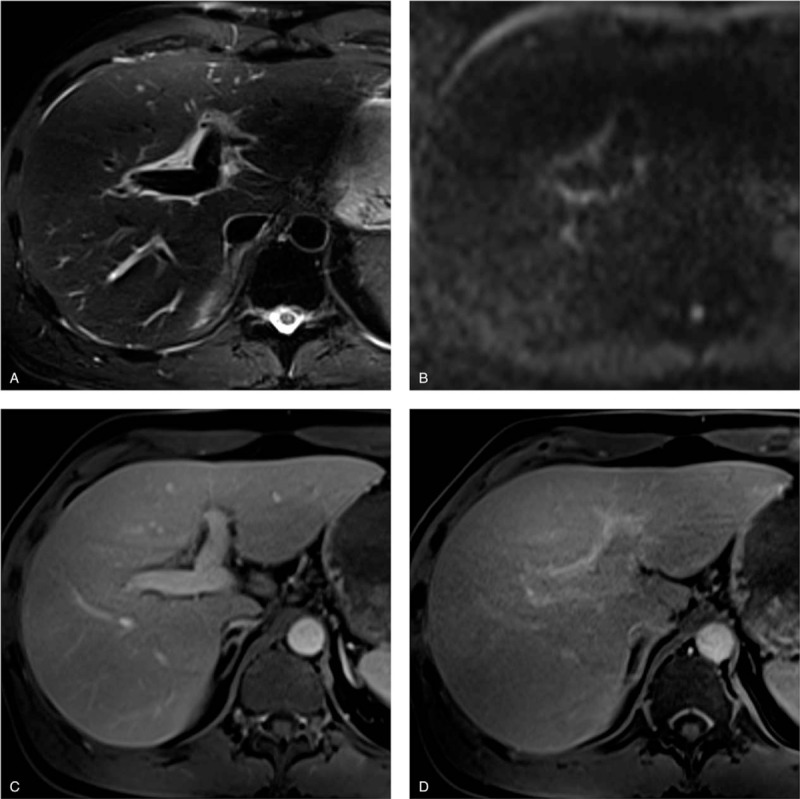
Pathologically proven autoimmune hepatitis in a 49-year-old man. (a) T2-weighted image shows markedly hyperintense areas adjacent to the intrahepatic portal veins. (b) Corresponding diffusion-weighted image also shows them as mildly hyperintense areas. (c) Gadoxetate-disodium enhanced image obtained during the portal venous phase shows the areas with minimal enhancement. These findings are consistent with periportal edema. (d) Image obtained during the hepatobiliary phase shows moderate periportal enhancement. The enhancement areas match the periportal T2-hyperintense areas (corresponding periportal enhancement pattern). Note the poor hepatobiliary enhancement of liver parenchyma (liver-spleen relative enhancement ratio = 0.89).
Figure 3.
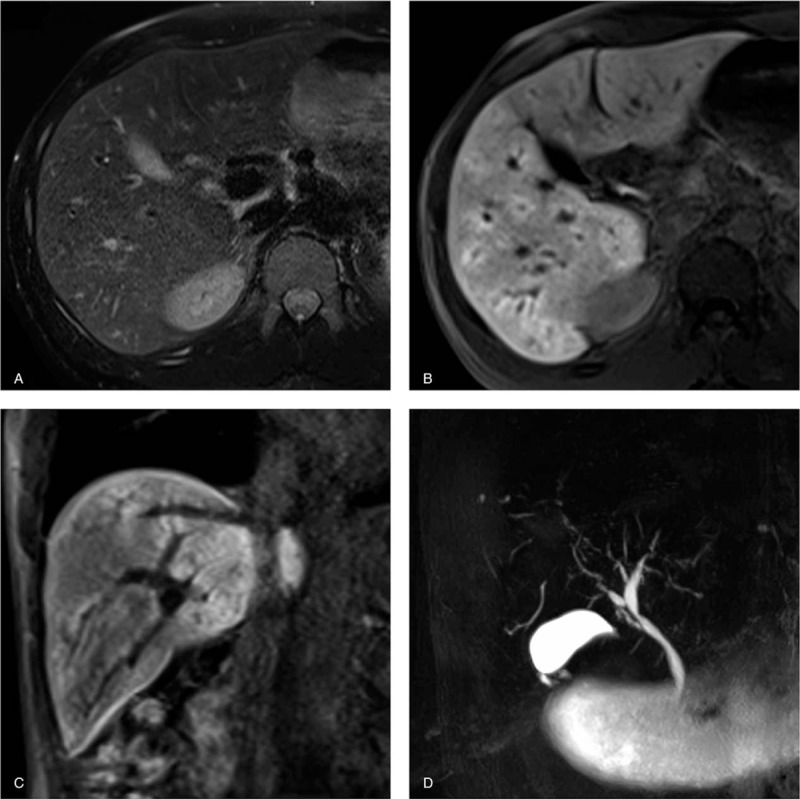
Primary sclerosing cholangitis in a 33-year-old man. (a) T2-weighted images show no abnormal intensity at periportal areas. Transverse (b) and coronal (c) gadoxetate-disodium enhanced images obtained during the hepatobiliary phase show diffuse periportal enhancement without relation to periportal T2-hyperintensity (noncorresponding periportal enhancement pattern). (d) MRCP demonstrates mild diffuse intrahepatic bile duct dilatation with multiple strictures, which are typical findings for primary sclerosing cholangitis.
Figure 4.
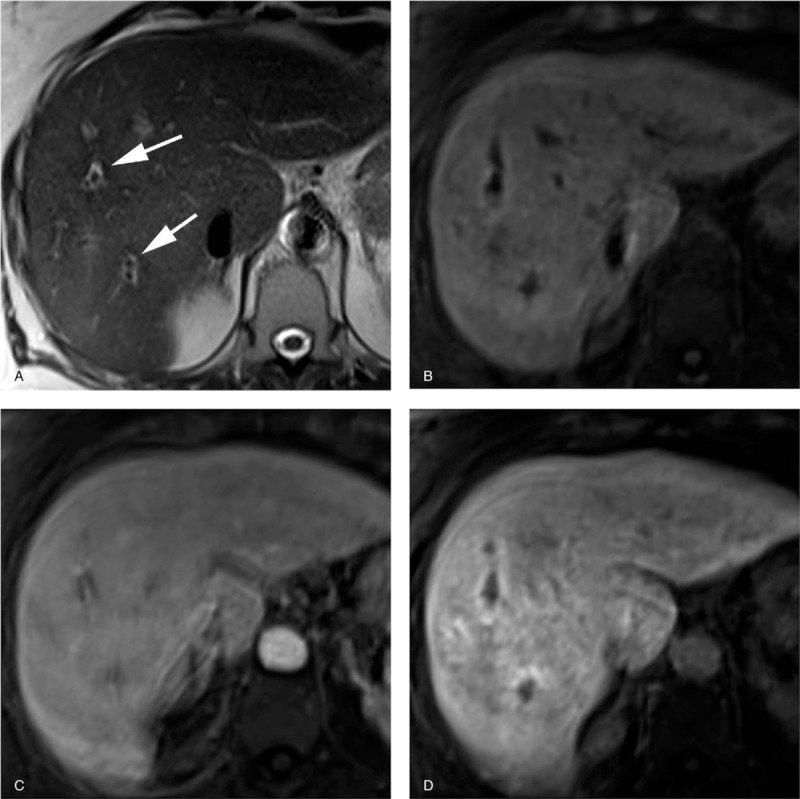
Pathologically proven autoimmune hepatitis-primary biliary cirrhosis overlap syndrome in a 63-year-old woman. Serological assays for antimitochondrial and anti-M2 antibodies were positive. (a) T2-weighted image shows periportal halo sign as hypointense areas around portal vein branches (arrows). (b) Precontrast T1-weighted image with fat suppression shows periportal liver parenchyma as slightly hyperintense areas. (c) Gadoxetate-disodium enhanced image obtained during the portal venous phase shows homogeneous enhancement of the liver parenchyma including periportal areas. (d) Gadoxetate-disodium enhanced image obtained during the hepatobiliary phase shows periportal areas with moderate enhancement. The periportal enhanced areas located immediately external to the periportal T2-hyperintense areas (noncorresponding periportal enhancement pattern).
The quantitative image analyses yielded a mean liver–spleen relative enhancement ratio of 0.94 ± 0.09 in the corresponding enhancement group, and of 1.47 ± 0.33 at the periportal enhancement area and 1.27 ± 0.28 at the remainder of the liver parenchyma in the noncorresponding enhancement group. These ratios were lower than for the normal control (1.91 ± 0.30) with statistically significant differences (P < .01 for all). As for the corresponding enhancement group, the signal intensities at periportal enhancement areas were not evaluated, since those areas were too small for the placement of ROIs in most cases.
4. Discussion
The diffuse periportal enhancement finding during the hepatobiliary phase corresponded with periportal T2-hyperintensity in the location in 7 of 19 patients. In the remaining 12 patients, periportal enhancement and T2-hyperintensity findings were present at different locations or periportal T2-hyperintensity finding was not observed.
In the cases with a corresponding periportal enhancement pattern, the periportal enhancement area showed hyperintensity on T2-weighted images and no or minimal enhancement during the arterial and portal venous phases. The finding of periportal hyperintense appearance on T2-weighted images indicates periportal edema.[32] Periportal edema reflects the layer of loose connective tissue surrounding the portal veins (ie, Glisson capsule) expanded by inflammation or other conditions.[31–33] Therefore, the corresponding periportal enhancement during the hepatobiliary phase can be considered as delayed enhancement of the periportal loose connective tissue. Periportal edema is often seen in patients with acute viral hepatitis.[10,35] In the present study, the corresponding enhancement group included various liver conditions with hepatitis such as viral hepatitis and autoimmune hepatitis. The greatly elevated total bilirubin, aspartate aminotransferase, and alanine aminotransferase levels in the group may support substantial active inflammation of the liver.
The mean relative liver-spleen enhancement ratios during the hepatobiliary phase markedly decreased in the corresponding enhancement group. In addition, most patients in the group showed poor enhancement of the biliary tracts. It is considered that the periportal area showed relatively higher intensity than surrounding liver parenchyma due to its severe deterioration of hepatobiliary enhancement. When the liver parenchyma is normally enhanced during the hepatobiliary phase, the delayed enhancement of periportal edema may be masked by the stronger enhancement of the liver parenchyma.
In the cases with noncorresponding periportal enhancement, the periportal enhancement pattern was not consistent locationally with any of abnormal signal intensities on T1- and T2-weighted, arterial, and portal venous phase images. During the arterial and portal venous phase, the signal intensities at periportal enhancement areas were equivalent to those at the remainder of the liver parenchyma in the non-corresponding enhancement group, unlike those in the corresponding enhancement group. The periportal enhancement area is considered part of liver parenchyma in the noncorresponding enhancement group since it shows the same perfusion appearance as the reminder in the dynamic study.
The mean relative liver-spleen enhancement ratios, both at the periportal enhancement areas and at the remainder of the parenchyma in the noncorresponding enhancement group, were lower than those for the patients with normal liver. Our results are consistent with those of a previous study reported by Kobayashi et al.[34] Hence, the noncorresponding periportal enhancement is also considered relatively high intensity due to poor enhancement of the remaining liver parenchyma. We speculate that the enhancement pattern at periportal area during the hepatobiliary phase could be due to a difference of uptake function for gadoxetate disodium (eg, expression of organic anion transporting protein), regional biliary ductular proliferation, and chronic congestion. From our present perspective, however, it is difficult to determine the pathological condition corresponding to periportal liver parenchyma enhancement. Further investigations using pathological and molecular biological approaches will be needed to clarify the causes of this enhancement pattern in diffuse liver diseases.
Our result revealed that diseases of the corresponding enhancement group differed from those of the noncorresponding enhancement group. Specifically, the former was associated with active inflammation such as hepatitis and the latter was predominantly associated with a chronic change such as cirrhosis. Therefore, the classification of these periportal enhancement patterns based on the consistency with periportal hyperintensity on T2-weighted images may help to make a differential diagnosis of disuse liver diseases.
Our study has various limitations. First, as in the case of some previous studies,[10,32,33,35] a potential limitation of our study could be the lack of histologic evidence for some of the diffuse liver diseases described and discussed here. Several diffuse liver diseases such as acute viral hepatitis were, however, properly diagnosed based on the clinical findings and blood test results including serological assays and without access to histologic findings. Second, even in biopsied cases, the location of the biopsy sites, whether in periportal areas or the remainder of the liver parenchyma, were not identified because of the retrospective nature of this study. Third, the sample size of the patients with periportal enhancement patterns included in our study population was small, because of the rare nature of these findings. Finally, changes in image findings following changes in the clinical course were not assessed in this study, although a majority of diffuse liver diseases culminate in liver cirrhosis, and the clinical stage of these diseases may affect the image findings.[14]
In conclusion, the rare finding of diffuse periportal enhancement during the hepatobiliary phase does not always correspond to the periportal hyperintensity finding on T2-weighted images. In the classification based on the consistency with the finding on T2-weighted images, each periportal enhancement pattern is observed in different categories of liver diseases. Appropriate recognition of these periportal enhancement patterns can be helpful for differential diagnosis of diffuse liver diseases.
Author contributions
Conceptualization: Hiromitsu Onishi, Christoph J. Zech.
Data curation: Hiromitsu Onishi, Daniel Theisen.
Formal analysis: Hiromitsu Onishi.
Funding acquisition: Hiromitsu Onishi.
Investigation: Hiromitsu Onishi, Daniel Theisen.
Methodology: Hiromitsu Onishi.
Project administration: Hiromitsu Onishi.
Supervision: Reinhart Zachoval, Christoph J. Zech.
Writing – original draft: Hiromitsu Onishi.
Writing – review and editing: Hiromitsu Onishi, Daniel Theisen, Maximilian F. Reiser, Christoph J. Zech.
Hiromitsu Onishi orcid: 0000-0002-3241-5994.
Footnotes
Abbreviations: MR = magnetic resonance, ROIs = regions of interest.
This work has been supported in part by from Japan Society for the Promotion of Science (JSPS KAKENHI Grant Number 24591761) and Japanese Society for Magnetic Resonance in Medicine.
The authors have no conflicts of interest to disclose.
References
- [1].Boll DT, Merkle EM. Diffuse liver disease: strategies for hepatic CT and MR imaging. Radiographics 2009;29:1591–614. [DOI] [PubMed] [Google Scholar]
- [2].Akhan O. Imaging of diffuse liver diseases. Eur J Radiol 2007;61:1–2. [DOI] [PubMed] [Google Scholar]
- [3].Matteoni CA, Younossi ZM, Gramlich T, et al. Nonalcoholic fatty liver disease: a spectrum of clinical and pathological severity. Gastroenterology 1999;116:1413–9. [DOI] [PubMed] [Google Scholar]
- [4].Faria SC, Ganesan K, Mwangi I, et al. MR imaging of liver fibrosis: current state of the art. Radiographics 2009;29:1615–35. [DOI] [PMC free article] [PubMed] [Google Scholar]
- [5].Garg D, Nagar A, Philips S, et al. Immunological diseases of the pancreatico–hepatobiliary system: update on etiopathogenesis and cross–sectional imaging findings. Abdom Imaging 2012;37:261–74. [DOI] [PubMed] [Google Scholar]
- [6].Janes CH, Lindor KD. Outcome of patients hospitalized for complications after outpatient liver biopsy. Ann Intern Med 1993;118:96–8. [DOI] [PubMed] [Google Scholar]
- [7].Vijayaraghavan G, Sheehan D, Zheng L, et al. Unusual complication after left–lobe liver biopsy for diffuse liver disease: severe bleeding from the superior epigastric artery. AJR Am J Roentgenol 2011;197:W1135–1139. [DOI] [PubMed] [Google Scholar]
- [8].Regev A, Berho M, Jeffers LJ, et al. Sampling error and intraobserver variation in liver biopsy in patients with chronic HCV infection. Am J Gastroenterol 2002;97:2614–8. [DOI] [PubMed] [Google Scholar]
- [9].Poniachik J, Bernstein DE, Reddy KR, et al. The role of laparoscopy in the diagnosis of cirrhosis. Gastrointest Endosc 1996;43:568–71. [DOI] [PubMed] [Google Scholar]
- [10].Matsui O, Kadoya M, Takashima T, et al. Intrahepatic periportal abnormal intensity on MR images: an indication of various hepatobiliary diseases. Radiology 1989;171:335–8. [DOI] [PubMed] [Google Scholar]
- [11].Chen J, Talwalkar JA, Yin M, et al. Early detection of nonalcoholic steatohepatitis in patients with nonalcoholic fatty liver disease by using MR elastography. Radiology 2011;259:749–56. [DOI] [PMC free article] [PubMed] [Google Scholar]
- [12].Awaya H, Mitchell DG, Kamishima T, et al. Cirrhosis: modified caudate–right lobe ratio. Radiology 2002;224:769–74. [DOI] [PubMed] [Google Scholar]
- [13].Wenzel JS, Donohoe A, Ford KL, 3rd, et al. Primary biliary cirrhosis: MR imaging findings and description of MR imaging periportal halo sign. AJR Am J Roentgenol 2001;176:885–9. [DOI] [PubMed] [Google Scholar]
- [14].Kobayashi S, Matsui O, Gabata T, et al. MRI findings of primary biliary cirrhosis: correlation with Scheuer histologic staging. Abdom Imaging 2005;30:71–6. [DOI] [PubMed] [Google Scholar]
- [15].Kovač JD, Ješić R, Stanisavljević D, et al. Integrative role of MRI in the evaluation of primary biliary cirrhosis. Eur Radiol 2012;22:688–94. [DOI] [PubMed] [Google Scholar]
- [16].Sahni VA, Raghunathan G, Mearadji B, et al. Autoimmune hepatitis: CT and MR imaging features with histopathological correlation. Abdom Imaging 2010;35:75–84. [DOI] [PubMed] [Google Scholar]
- [17].Schuhmann–Giampieri G, Schmitt–Willich H, Press WR, et al. Preclinical evaluation of Gd–EOB–DTPA as a contrast agent in MR imaging of the hepatobiliary system. Radiology 1992;183:59–64. [DOI] [PubMed] [Google Scholar]
- [18].Hamm B, Staks T, Mühler A, et al. Phase I clinical evaluation of Gd–EOB–DTPA as a hepatobiliary MR contrast agent: safety, pharmacokinetics, and MR imaging. Radiology 1995;195:785–92. [DOI] [PubMed] [Google Scholar]
- [19].Tsuboyama T, Onishi H, Kim T, et al. Hepatocellular carcinoma: hepatocyte–selective enhancement at gadoxetic acid–enhanced MR imaging—correlation with expression of sinusoidal and canalicular transporters and bile accumulation. Radiology 2010;255:824–33. [DOI] [PubMed] [Google Scholar]
- [20].Kitao A, Zen Y, Matsui O, et al. Hepatocellular carcinoma: signal intensity at gadoxetic acid–enhanced MR imaging—correlation with molecular transporters and histopathologic features. Radiology 2010;256:817–26. [DOI] [PubMed] [Google Scholar]
- [21].Sahani DV, Agarwal S, Chung RT. The double-edged sword of functional liver imaging. Radiology 2012;264:621–3. [DOI] [PubMed] [Google Scholar]
- [22].Nassif A, Jia J, Keiser M, et al. Visualization of hepatic uptake transporter function in healthy subjects by using gadoxetic acid-enhanced MR imaging. Radiology 2012;264:741–50. [DOI] [PubMed] [Google Scholar]
- [23].Reimer P, Rummeny EJ, Shamsi K, et al. Phase II clinical evaluation of Gd–EOB–DTPA: dose, safety aspects, and pulse sequence. Radiology 1996;199:177–83. [DOI] [PubMed] [Google Scholar]
- [24].Vogl TJ, Kümmel S, Hammerstingl R, et al. Liver tumors: comparison of MR imaging with Gd–EOB–DTPA and Gd–DTPA. Radiology 1996;200:59–67. [DOI] [PubMed] [Google Scholar]
- [25].Huppertz A, Balzer T, Blakeborough A, et al. Improved detection of focal liver lesions at MR imaging: multicenter comparison of gadoxetic acid–enhanced MR images with intraoperative findings. Radiology 2004;230:266–75. [DOI] [PubMed] [Google Scholar]
- [26].Zech CJ, Grazioli L, Breuer J, et al. Diagnostic performance and description of morphological features of focal nodular hyperplasia in Gd-EOB-DTPA-enhanced liver magnetic resonance imaging: results of a multicenter trial. Invest Radiol 2008;43:504–11. [DOI] [PubMed] [Google Scholar]
- [27].Di Martino M, Marin D, Guerrisi A, et al. Intraindividual comparison of gadoxetate disodium-enhanced MR imaging and 64-section multidetector CT in the detection of hepatocellular carcinoma in patients with cirrhosis. Radiology 2010;256:806–16. [DOI] [PubMed] [Google Scholar]
- [28].Motosugi U, Ichikawa T, Morisaka H, et al. Detection of pancreatic carcinoma and liver metastases with gadoxetic acid-enhanced MR imaging: comparison with contrast-enhanced multi-detector row CT. Radiology 2011;260:446–53. [DOI] [PubMed] [Google Scholar]
- [29].Watanabe H, Kanematsu M, Goshima S, et al. Staging hepatic fibrosis: comparison of gadoxetate disodium-enhanced and diffusion-weighted MR imaging—preliminary observations. Radiology 2011;259:142–50. [DOI] [PubMed] [Google Scholar]
- [30].Motosugi U, Ichikawa T, Oguri M, et al. Staging liver fibrosis by using liver-enhancement ratio of gadoxetic acid-enhanced MR imaging: comparison with aspartate aminotransferase-to-platelet ratio index. Magn Reson Imaging 2011;29:1047–52. [DOI] [PubMed] [Google Scholar]
- [31].Karcaaltincaba M, Haliloglu M, Akpinar E, et al. Multidetector CT and MRI findings in periportal space pathologies. Eur J Radiol 2007;61:3–10. [DOI] [PubMed] [Google Scholar]
- [32].Ly JN, Miller FH. Periportal contrast enhancement and abnormal signal intensity on state-of-the-art MR images. AJR Am J Roentgenol 2001;176:891–7. [DOI] [PubMed] [Google Scholar]
- [33].Siegel MJ, Herman TE. Periportal low attenuation at CT in childhood. Radiology 1992;183:685–8. [DOI] [PubMed] [Google Scholar]
- [34].Kobayashi S, Matsui O, Gabata T, et al. Intrahepatic periportal high intensity on hepatobiliary phase images of Gd-EOB-DTPA-enhanced MRI: imaging findings and prevalence in various hepatobiliary diseases. Jpn J Radiol 2013;31:9–15. [DOI] [PubMed] [Google Scholar]
- [35].Itoh H, Sakai T, Takahashi N, et al. Periportal high intensity on T2–weighted MR images in acute viral hepatitis. J Comput Assist Tomogr 1992;16:564–7. [DOI] [PubMed] [Google Scholar]


