Abstract
Hyperglycemia was proved to cause neuron death in both animal experiments and poor outcome of hemorrhage patients, but the predictive ability of admission blood glucose level for early hematoma growth in patients with intracranial hemorrhage (ICH) is still controversial. Spot sign is a well-established imaging predictor for early hematoma growth, implying active microvascular bleeding. Here, we aim to assess associations between admission serum glucose and early hematoma expansion in ICH patients, as well as spot sign.
We retrospectively reviewed all the patients with ICH from January 2017 to March 2018 in West China Hospital, Sichuan University. Admission blood glucose, clinical variables, radiological characteristics, and laboratorial parameters were obtained from medical record. According to computed tomography (CT) and computed tomography angiography (CTA) scan results, hematoma expansion and spot sign were identified by 2 experienced neuroradiologists. Multivariate logistic regression analyses were employed to adjust the associations of hematoma expansion and spot sign with other clinical parameters.
Around 42 patients exhibited early hematoma expansions and 26 exhibited spot signs over 138 enrolled patients. The average level of admission blood glucose was 7.55 mmol/L. Multivariate logistic regression analyses revealed that Glasgow Coma Scale (GCS) score on admission, hematoma volume, spot sign, and hyperglycemia were associated with hematoma expansion, whereas admission serum glucose and hematoma size were only associated with spot sign, respectively.
Admission blood glucose level is correlated with hematoma growth and incidence of spot sign. These results indicated that hyperglycemia probably plays a critical role in the pathological process of the active bleeding. Further studies should be drawn urgently to understand the potential molecular mechanism of systemic hyperglycemia in affecting prognosis of patients with ICH.
Keywords: active bleeding, glucose, hematoma expansion, intracerebral hemorrhage, spot sign
1. Introduction
Intracranial hemorrhage (ICH) is a disastrous healthcare issue that accounts for 15% to 30% of patients with stroke.[1,2] It is well documented that both increased blood glucose[3] and early hematoma expansion[4] could be used to predict the morbidity and mortality of ICH patients; however, the conclusions from previous studies in regard to the relationship between hyperglycemia and early hematoma growth are still under debate due to the lack of evidence from clinical studies.[5,6] Experimental studies indicated that hyperglycemia could accelerate the brain blood barrier damage, impair microvascular integrity of vessels adjacent to the initial bleeding site, as well as promot continuous bleeding.[7,8] We preciously demonstrated that admission hyperglycemia of ICH patients could predict the existence of island sign, which is considered as a novel nonenhanced computed tomography (NCCT) based imaging feature to indicate hematoma expansion.[9] However, whether there is correlation between admission blood glucose level and computed tomography angiography (CTA) spot sign is still unrevealed in ICH patients. As a well-established imaging parameter for predicting early hematoma growth, spot sign is also proposed to reflect active bleeding or ongoing bleeding.[10–12] Compared to island sign from NCCT, spot sign exhibits better predictive ability for hematoma expansion (sensitivity even reached to 91%, specificity 89%)[10] and stronger association with active bleeding (sensitivity 46%, specificity 88%).[13] Furthermore, spot sign is usually applied as a golden standard image parameter for examining predictive values of some NCCT parameters.[13–17] Here, we aim to understand the relationship between admission blood glucose level and spot sign in patients with ICH, as well as the hematoma expansion and prognosis.
2. Patients and methods
2.1. Patient selection
All the spontaneous ICH patients involved in this retrospective study were from China and admitted in West China Hospital between January 2017 and March 2018. The inclusion criteria were as follows: Spontaneous intracranial hemorrhage was confirmed by computed tomography (CT); CTA and CT scans were performed within 6 hours after the symptoms onset, follow-up CT were performed within 24 hours. Admission serum glucose level was obtained within 24 hours from ictus of ICH; Age≥18 years old. Patients were excluded: if secondary ICH resulted from tumor, aneurysm, trauma and arteriovenous malformation or Moyamoya disease was found; Follow-up CT scan was unavailable; anticoagulants or antiplatelet treatments were found in medical history; hematoma evacuation was performed prior to follow-up CT; Medical history showed a stroke attack within 6 months before ICH onset. Patients or their guardians refused to sign the informed consent for this study.
The Ethics Committee of West China Hospital approved this study and all the patients or their guardians signed informed consents. This study was also conducted in accordance with relevant regulations of Sichuan University. All the data are available by contacting the corresponding author.
2.2. Clinical data
We retrospectively reviewed all the clinical parameters, including: age, gender, family history of ICH, cerebral infarction or aneurysm, blood pressure, cigarette use, alcohol abuse, hypertension and diabetes. The laboratory variables are prothrombin time (PT), activated partial thromboplastin time (APTT), international normalized ratio (INR), and admission serum glucose level.
2.3. Imaging data
Two experienced neuroradiologists independently reviewed all the CTA scans. Both of them were blind to the clinical conditions of patients. Any discrepancy between 2 reviewers was settled by joint discussion. Imaging features were evaluated from initial CTA and CT, as well as follow-up CT scan, including hematoma site and volume, subarachnoid hemorrhage (SAH), intraventricular hemorrhage (IVH), cerebral infarction, and spot sign. Hematoma volume was calculated by ABC/2 method.[18] Hematoma growth was defined as a relative increase in hematoma volume (above 33%) or more than 12.5 mL of absolute hematoma volume growth on follow-up CT.[4] The spot sign was defined as more than 1 spot-like foci of enhancement found from CTA scan. The diameter of the contrast density is 1 to 2 mm, which could be easily identified by visual inspection (Fig. 1).
Figure 1.
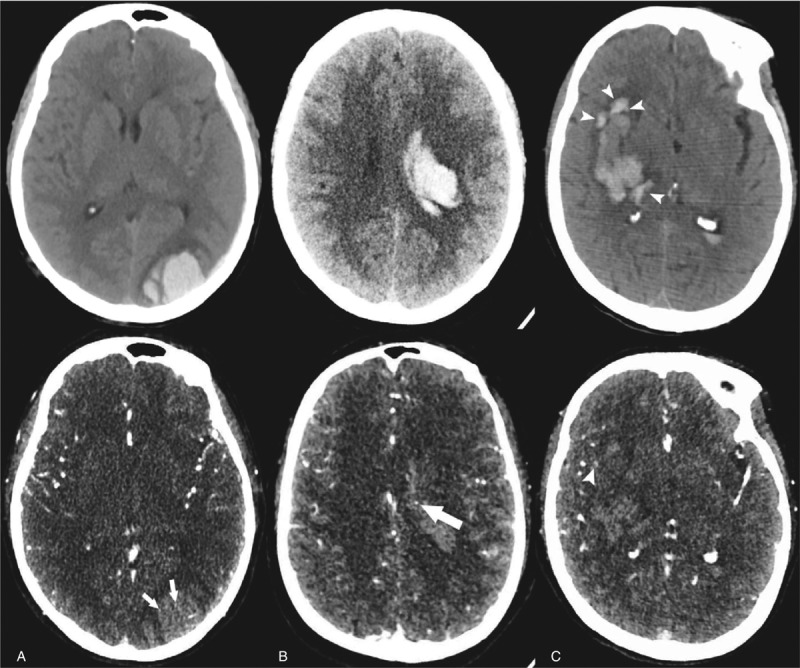
Illustration of spot sign and island sign. (A) Unenhanced CT shows an intracerebral hemorrhage of left occipital lob, and the CTA demonstrates spot signs presenting as enhancement foci within main hematoma (arrow) (75-year old female). (B) A 54-year old individual presenting a mild hemorrhage and CTA imaging shows a spot sign within the main hematoma (arrow). (C) A right basal ganglia hemorrhage was found in a 63-year old male patient. The hematoma consists of 4 separate adjacent small hematomas which were identified as island sign (arrowheads) in unenhanced CT. Note that a spot-like foci of enhancement which is located around a small hematoma but not within the main hematoma is NOT considered as spot sign (arrowheads). CTA = computed tomography angiography.
2.4. Statistical analysis
Continuous data was presented as the mean±standard deviation and compared using the independent t-test. Discontinuous variables were described as median with interquartile range (IQR) and analyzed by Mann–Whitney U test. Categorical values were presented as frequency with percentage and analyzed by Chi-square test or Fisher's exact test. Clinical data, laboratorial parameters, and/or imaging marker were compared between patients with or without spot sign(s). The variables with P < .10 from univariate analysis were then included in the multivariable regression analysis to explore association of admission hyperglycemia on spot sign. The inter-observer reliability of spot sign was determined by K value. Receiver-operator analysis was performed to estimate the predictive value of admission hyperglycemia for hematoma expansion, as well as spot sign. The variables were considered statistically significant if P < .05. Statistical analyses were performed by using SPSS software (Version 23.0).
3. Results
In the present study, 138 cases from January 2017 to March 2018 were retrospectively reviewed, including 98 males and 40 females. The average age of those patients was 62.33 ± 11.49 with a range from 37 to 88 years old. The mean hematoma volume over all patients was 28.21 ± 13.96 mL. Based on the electronic records, the average admission blood glucose over all patients was 7.55 mmol/L (95%CI: 7.07– 8.04) and mean time interval from symptom ictus to CT scan was 3.98 ± 2.06 hours. Supratentorial hematomas and infratentorial hematomas were observed in 123 and 16 patients, respectively. Early hematoma growths were present in 42 patients with ICH, whereas spot signs were observed in 26 of them. Around 6 cases were raised for discussion between the 2 neuroradiologists to determine the presence of spot sign (Spot location outside hematoma in 1 case while foci of enhancement could not be detected by visual inspection easily in 5 cases). The K value for evaluating inter-observer reliability of spot sign was 90.4%, indicating satisfactory inter-observer agreement between the 2 readers.
The baseline of clinical variables for patients with or without early hematoma growths are listed in Table 1. Moreover, comparisons between selected clinical characteristics in ICH patients with or without spot signs are presented in Table 2. In spite of the statistical significance, ICH patients with spot signs exhibited higher prevalence of mellitus (P = .06) and lower incidence of ischemic medical history (P = .08) than patients without spot sign. Meanwhile, no significant difference was found in gender (P = .38), hypertension (P = .44), Mean arterial pressure (P = .45), smoking (P = .43), alcohol abuse (P = .78), platelet count (P = .86), PT (P = .85), APTT (P = .69) or INR (P = .68).
Table 1.
Clinical characteristics related to hematoma expansion in patients with ICH.
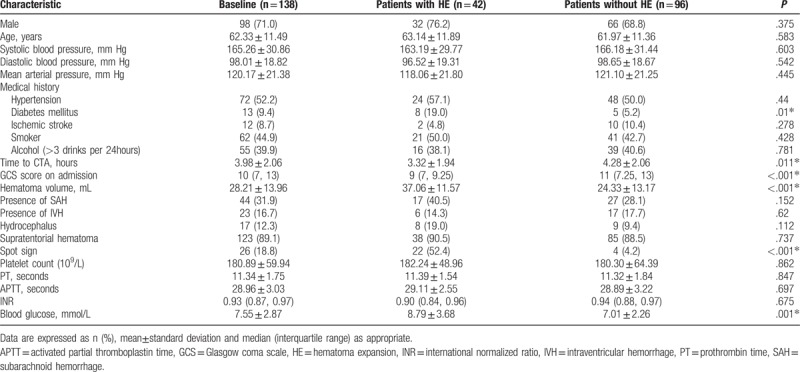
Table 2.
Clinical characteristics related to spot sign in patients with ICH.
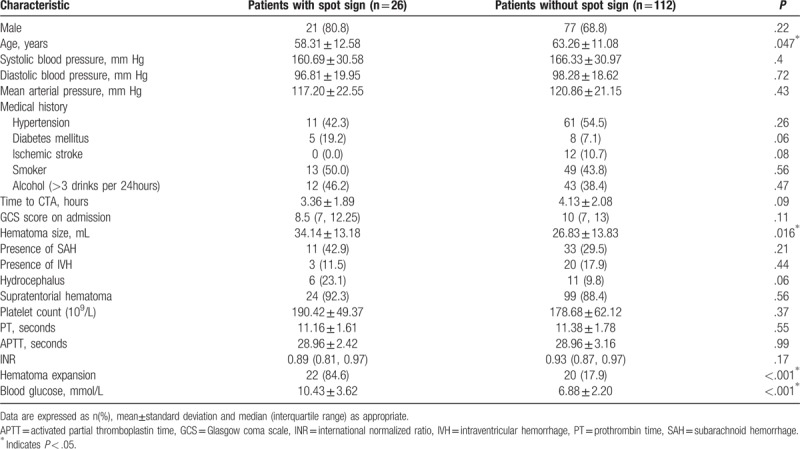
ICH patients with hematoma expansions showed significantly shorter interval from onset to initial CTA scan, lower GCS score on admission, larger hematoma size, higher blood glucose level and existence of spot sign. Univariate analysis also indicated that younger age, larger hematoma size and admission hyperglycemia were associated with the prevalence of spot signs. No preference of spot sign was observed in different hemorrhage locations (Supratentorial vs. infratentorial hemorrhage, P = .56, Table 2). Multivariable analyses were performed when P value of univariate analyses is below 0.10. Multivariate analysis revealed that GCS score, hematoma volume, spot sign and admission blood glucose levels could independently predict early hematoma growth (Table 3). In addition, after the adjustment of potential confounders, only admission blood glucose levels and hematoma size could predict the spot sign (Table 4).
Table 3.
Multivariable logistic regression of spot sign and blood glucose on hematoma expansion after ICH.

Table 4.
Associations of admission blood glucose with island sign in patients with ICH.

Receiver operating characteristic analyses were then preformed to assess the predictive value of admission blood glucose levels on early hematoma growth and spot sign. Spot sign produced a slightly better ability to predict early hematoma expansion compared to admission hyperglycemia without statistical significance (area under the curve [AUC] 0.741 vs AUC 0.661, P = .07, Fig. 2). Interestingly, admission hyperglycemia displayed an excellent predictive ability for spot sign (cut-off point 8.28, sensitivity 80.77%, specificity 83.04%, positive predictive value 52.5, negative predictive value 94.9, AUC 0.846, P < .001, Fig. 3).
Figure 2.
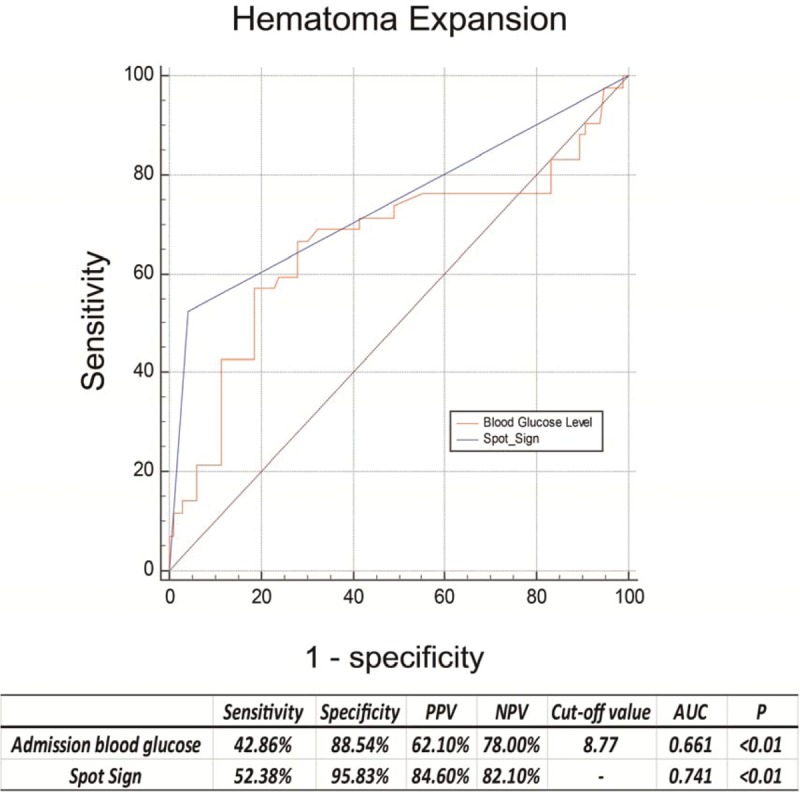
Receiver operating characteristic curves of blood glucose and spot sign with their corresponding areas under the curve (AUC) for predicting early hematoma growth. The best cut-off points were identified with their sensitivity, specificity, positive predictive value (PPV) and negative predictive value (NPV), respectively.
Figure 3.
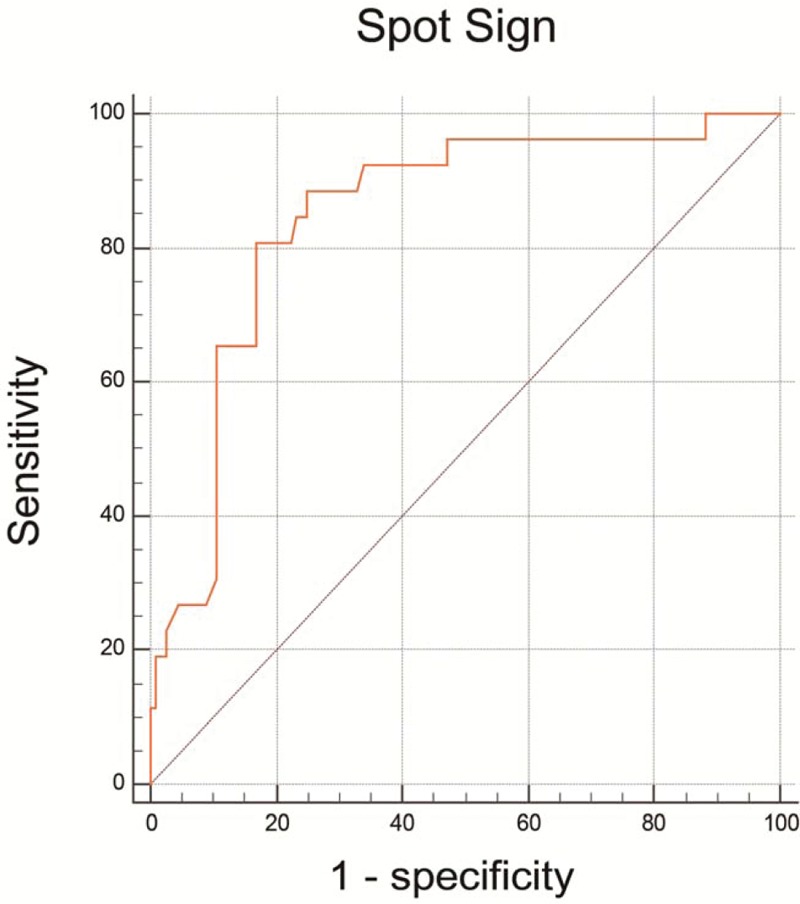
Receiver operating characteristic curves of admission blood glucose for predicting spot sign. The areas under the curve (AUC), sensitivity, specificity, positive predictive value (PPV) and negative predictive value (NPV) of serum glucose for predicting island sign were 0.828,80.77%, 83.04%, 52.50%, 94.90%, respectively. AUC = area under the curve, NPV = negative predictive value, PPV = positive predictive value.
4. Discussion
According to our results, elevated admission blood glucose levels independently predicts spot sign, which is associated with early hematoma expansion. Furthermore, hyperglycemia also exhibited a comparable predictive value to spot sign in predicting hematoma expansion. This conclusion firstly revealed the potential predictive ability of admission serum glucose levels in spot sign, as well as prognosis of patients with ICH.
Previous studies reported one-third of patients with ICH presented significant hematoma growth and absolute hematoma expansion was observed in more than 70% patients.[19,20] The predictors for hematoma expansion and the predictive value of hyperglycemia after ICH captured a host of attention for the past 2 decades since both hematoma growth and increased blood glucose level were potentially preventable. Numerous evidence has shown hyperglycemia[21–23] and hematoma expansion[24–26] are associated with adverse outcome in patients with ICH.
As a novel imaging feature, spot sign was firstly identified by Wada et al[10] to predict early hematoma expansion, and the existence of spot sign was further confirmed to correlate with unfavorable prognosis of ICH patients.[11,12,27,28] Nowadays, accumulating evidence from neuroradiology studies reveal that spot sign could be considered as a golden standard to evaluate the predictive abilities of NCCT signs (such as island sign, black hole sign, blend sign) in ICH filed.[12,13,16,17] Nevertheless, not all the ICH patients with hematoma growth had spot signs among whole Chinese population[15,16] and the exact underlying mechanism is still unrevealed. On the other hand, although most studies agree that increased serum glucose are associated with poor outcome in patients with ICH,[22,29] there are conflicting results[5,6,26,30–32] regarding the association of hyperglycemia on early hematoma growth. Besides, the research concerning the relationship between blood glucose and hematoma expansion are still lacking. Our retrospective studies revealed that other than the predictive ability on early hematoma growth, admission blood glucose levels are also associated with the existence of spot sign. Spot sign has been proposed to reflect contrast extravasation on cerebrovascular angiography and to indicate active bleeding.[10] Following which, data from previous experimental studies may explain the plausible mechanisms of how hyperglycemia increased active bleeding and is associated with spot sign.
Firstly, hyperglycemia accelerated breakdown of the BBB, impaired the surrounding vessels integrity and promoted continuous or emerging bleeding, can be reflected via existence of spot sign.[10,11,25,28,33] Secondly, it is well documented that hyperglycemia is one of the most important triggers of oxygen-free radical generation and inflammation, thus leading to microvascular integrity damage and early hematoma expansion.[5,34–36] Furthermore, glucose-lowering therapy could efficiently reduce the expansion of hematoma volume. Combined with our findings, we believe admission hyperglycemia of ICH patients could partially reveal higher risk of hematoma expansion and active bleeding (contrast extravasation on CTA), as well as the existence of spot sign.
Actually, we could not exclude the possibility that hyperglycemia was induced by stress after ICH ictus.[37] Results from INTERACT 2 study[6] prompted that higher blood glucose levels was associated with worse clinical situation at nadir of ICH patients. Here, ICH patients with higher admission serum glucose levels were observed to have lower GCS scores and larger hematomas volumes. Overall, associating admission hyperglycemia with spot sign could be considered as an easily available factor for predicting outcomes of ICH patients in the developing countries and/or financial-challenged regions.
Lastly, there are still several limitations in our retrospective studies. First of all, as a retrospective cohort research, we only obtained relatively small sample size from a single institution. Secondly, hematoma size was calculated with ABC/2 methods, which is a less accurate way than CT planar technology. Additionally, some involved ICH patients could not provide the medication history, which might affect the blood test results thus leading to an inaccurate calculation of its predictive ability (e.g., Selective Serotonin Reuptake Inhibitor, SSRI). Other than that, all enrolled patients are from West China Hospital, which only takes patients with emergency situations. Therefore, we could not exclude the possibility that all enrolled patients might have relatively severe symptoms at nadir compared to other studies.
In conclusion, our results demonstrated that elevated serum glucose levels independently predicts early hematoma growth and discovered that admission hyperglycemia was associated with spot sign in some ICH patients. These findings highlight the link between imaging feature (spot sign) and laboratorial parameter (serum glucose levels).
Acknowledgments
We thank the colleagues in our department who supported this study.
Author contributions
Conception and design: Zhang F, Tao C, Zhang S and Yang M.
Acquisition of data: Tao C, Li X, Xin T and Zhang F.
Analysis and interpretation of data: Zhang F, Zhang S, Xin T and Yang M.
Drafting the article: Zhang F, Yang M and Tao C.
Supervision: Yang M and Xin T.
Review and editing: All the authors.
Conceptualization: Chuanyuan Tao.
Data curation: Fan Zhang, Chuanyuan Tao, Zijia Yang, Xi Li, Tao Xin.
Formal analysis: Zijia Yang.
Funding acquisition: Fan Zhang, Xi Li.
Investigation: Fan Zhang.
Methodology: Fan Zhang, Chuanyuan Tao, Mu Yang.
Project administration: Si Zhang, Zijia Yang.
Resources: Fan Zhang, Mu Yang.
Software: Si Zhang, Mu Yang.
Supervision: Fan Zhang, Chao You, Tao Xin, Mu Yang.
Validation: Si Zhang, Chao You, Mu Yang.
Visualization: Fan Zhang, Chao You, Mu Yang.
Writing – original draft: Fan Zhang, Chao You, Mu Yang.
Writing – review & editing: Chao You, Tao Xin, Mu Yang.
Footnotes
Abbreviations: APTT = activated partial thromboplastin time, AUC = area under the curve, CI = confidence interval, CT = computed tomography, CTA = computed tomography angiography, HE = hematoma expansion, ICH = intracerebral hemorrhage, ICH = intracranial hemorrhage, INR = international normalized ratio, IQR = interquartile range, IVH = intraventricular hemorrhage, OR = odds ratio, PLT = platelet count, PT = prothrombin time, ROC = receiver operating curve, SAH = Subarachnoid hemorrhage, sICH = spontaneous intracranial hemorrhage.
The work was supported, in whole or in part, by Sichuan province science and technology grant 2015SZ0051 and West China hospital academic excellence grant 2016102. The work was also supported by Sichuan University postdoctoral grant 2017SCU12048, West China Hospital postdoctoral grant 2018HXBH031, China postdoctoral science foundation grant 2018M633373 and Sichuan Health commission grant 18PJ425 (to FZ).
The authors have no conflicts of interest to disclose.
References
- [1].Qureshi AI, Mendelow AD, Hanley DF. Intracerebral haemorrhage. Lancet 2009;373:1632–44. [DOI] [PMC free article] [PubMed] [Google Scholar]
- [2].Song EC, Chu K, Jeong SW, et al. Hyperglycemia exacerbates brain edema and perihematomal cell death after intracerebral hemorrhage. Stroke 2003;34:2215–20. [DOI] [PubMed] [Google Scholar]
- [3].Bejot Y, Aboa-Eboule C, Hervieu M, et al. The deleterious effect of admission hyperglycemia on survival and functional outcome in patients with intracerebral hemorrhage. Stroke 2012;43:243–5. [DOI] [PubMed] [Google Scholar]
- [4].Davis SM, Broderick J, Hennerici M, et al. Hematoma growth is a determinant of mortality and poor outcome after intracerebral hemorrhage. Neurology 2006;66:1175–81. [DOI] [PubMed] [Google Scholar]
- [5].Qureshi AI, Palesch YY, Martin R, et al. Association of serum glucose concentrations during acute hospitalization with hematoma expansion, perihematomal edema, and three month outcome among patients with intracerebral hemorrhage. Neurocrit Care 2011;15:428–35. [DOI] [PubMed] [Google Scholar]
- [6].Saxena A, Anderson CS, Wang X, et al. Prognostic significance of hyperglycemia in acute intracerebral hemorrhage: the INTERACT2 study. Stroke 2016;47:682–8. [DOI] [PubMed] [Google Scholar]
- [7].Liu J, Gao BB, Clermont AC, et al. Hyperglycemia-induced cerebral hematoma expansion is mediated by plasma kallikrein. Nat Med 2011;17:206–10. [DOI] [PMC free article] [PubMed] [Google Scholar]
- [8].Zheng Y, Hu Q, Manaenko A, et al. 17beta-Estradiol attenuates hematoma expansion through estrogen receptor alpha/silent information regulator 1/nuclear factor-kappa b pathway in hyperglycemic intracerebral hemorrhage mice. Stroke 2015;46:485–91. [DOI] [PMC free article] [PubMed] [Google Scholar]
- [9].Zhang F, Li H, Qian J, et al. Hyperglycemia is associated with island sign in patients with intracerebral hemorrhage. World Neurosurg 2018;119:e703–9. [DOI] [PubMed] [Google Scholar]
- [10].Wada R, Aviv RI, Fox AJ, et al. CT angiography “spot sign” predicts hematoma expansion in acute intracerebral hemorrhage. Stroke 2007;38:1257–62. [DOI] [PubMed] [Google Scholar]
- [11].Morotti A, Jessel MJ, Brouwers HB, et al. CT Angiography spot sign, hematoma expansion, and outcome in primary pontine intracerebral hemorrhage. Neurocrit Care 2016;25:79–85. [DOI] [PMC free article] [PubMed] [Google Scholar]
- [12].Delgado Almandoz JE, Kelly HR, Schaefer PW, et al. CT angiography spot sign predicts in-hospital mortality in patients with secondary intracerebral hemorrhage. J Neurointerv Surg 2012;4:442–7. [DOI] [PMC free article] [PubMed] [Google Scholar]
- [13].Zheng J, Yu Z, Wang C, et al. Evaluating the predictive value of island sign and spot sign for hematoma expansion in spontaneous intracerebral hemorrhage. World Neurosurg 2018;117:e167–71. [DOI] [PubMed] [Google Scholar]
- [14].Sporns PB, Schwake M, Kemmling A, et al. Comparison of spot sign, blend sign and black hole sign for outcome prediction in patients with intracerebral hemorrhage. J Stroke 2017;19:333–9. [DOI] [PMC free article] [PubMed] [Google Scholar]
- [15].Yu Z, Zheng J, Ali H, et al. Significance of satellite sign and spot sign in predicting hematoma expansion in spontaneous intracerebral hemorrhage. Clin Neurol Neurosurg 2017;162:67–71. [DOI] [PubMed] [Google Scholar]
- [16].Yu Z, Zheng J, Ma L, et al. The predictive accuracy of the black hole sign and the spot sign for hematoma expansion in patients with spontaneous intracerebral hemorrhage. Neurol Sci 2017;38:1591–7. [DOI] [PubMed] [Google Scholar]
- [17].Zheng J, Yu Z, Xu Z, et al. The accuracy of the spot sign and the blend sign for predicting hematoma expansion in patients with spontaneous intracerebral hemorrhage. Med Sci Monit 2017;23:2250–7. [DOI] [PMC free article] [PubMed] [Google Scholar]
- [18].Kothari RU, Brott T, Broderick JP, et al. The ABCs of measuring intracerebral hemorrhage volumes. Stroke 1996;27:1304–5. [DOI] [PubMed] [Google Scholar]
- [19].Delcourt C, Huang Y, Arima H, et al. Hematoma growth and outcomes in intracerebral hemorrhage: the INTERACT1 study. Neurology 2012;79:314–9. [DOI] [PubMed] [Google Scholar]
- [20].Dowlatshahi D, Wasserman JK, Momoli F, et al. Evolution of computed tomography angiography spot sign is consistent with a site of active hemorrhage in acute intracerebral hemorrhage. Stroke 2014;45:277–80. [DOI] [PubMed] [Google Scholar]
- [21].Fogelholm R, Murros K, Rissanen A, et al. Admission blood glucose and short term survival in primary intracerebral haemorrhage: a population based study. J Neurol Neurosurg Psychiatry 2005;76:349–53. [DOI] [PMC free article] [PubMed] [Google Scholar]
- [22].Koga M, Yamagami H, Okuda S, et al. Blood glucose levels during the initial 72 h and 3-month functional outcomes in acute intracerebral hemorrhage: the SAMURAI-ICH study. J Neurol Sci 2015;350:75–8. [DOI] [PubMed] [Google Scholar]
- [23].Liu RY, Wang JJ, Qiu X, et al. Acute hyperglycemia together with hematoma of high-glucose blood exacerbates neurological injury in a rat model of intracerebral hemorrhage. Neurosci Bull 2014;30:90–8. [DOI] [PMC free article] [PubMed] [Google Scholar]
- [24].Brouwers HB, Greenberg SM. Hematoma expansion following acute intracerebral hemorrhage. Cerebrovasc Dis 2013;35:195–201. [DOI] [PMC free article] [PubMed] [Google Scholar]
- [25].Chen S, Zhao B, Wang W, et al. Predictors of hematoma expansion predictors after intracerebral hemorrhage. Oncotarget 2017;8:89348–63. [DOI] [PMC free article] [PubMed] [Google Scholar]
- [26].Yaghi S, Dibu J, Achi E, et al. Hematoma expansion in spontaneous intracerebral hemorrhage: predictors and outcome. Int J Neurosci 2014;124:890–3. [DOI] [PubMed] [Google Scholar]
- [27].Brouwers HB, Goldstein JN, Romero JM, et al. Clinical applications of the computed tomography angiography spot sign in acute intracerebral hemorrhage: a review. Stroke 2012;43:3427–32. [DOI] [PMC free article] [PubMed] [Google Scholar]
- [28].Demchuk AM, Dowlatshahi D, Rodriguez-Luna D, et al. Prediction of haematoma growth and outcome in patients with intracerebral haemorrhage using the CT-angiography spot sign (PREDICT): a prospective observational study. Lancet Neurol 2012;11:307–14. [DOI] [PubMed] [Google Scholar]
- [29].Kimura K, Iguchi Y, Inoue T, et al. Hyperglycemia independently increases the risk of early death in acute spontaneous intracerebral hemorrhage. J Neurol Sci 2007;255:90–4. [DOI] [PubMed] [Google Scholar]
- [30].Chan S, Conell C, Veerina KT, et al. Prediction of intracerebral haemorrhage expansion with clinical, laboratory, pharmacologic, and noncontrast radiographic variables. Int J Stroke 2015;10:1057–61. [DOI] [PubMed] [Google Scholar]
- [31].Kazui S, Minematsu K, Yamamoto H, et al. Predisposing factors to enlargement of spontaneous intracerebral hematoma. Stroke 1997;28:2370–5. [DOI] [PubMed] [Google Scholar]
- [32].Passero S, Ciacci G, Ulivelli M. The influence of diabetes and hyperglycemia on clinical course after intracerebral hemorrhage. Neurology 2003;61:1351–6. [DOI] [PubMed] [Google Scholar]
- [33].Allen CL, Bayraktutan U. Antioxidants attenuate hyperglycaemia-mediated brain endothelial cell dysfunction and blood-brain barrier hyperpermeability. Diabetes Obes Metab 2009;11:480–90. [DOI] [PubMed] [Google Scholar]
- [34].Esposito K. Inflammatory cytokine concentrations are acutely increased by hyperglycemia in humans: role of oxidative stress. Circulation 2002;106:2067–72. [DOI] [PubMed] [Google Scholar]
- [35].Asakawa H, Miyagawa J, Hanafusa T, et al. High glucose and hyperosmolarity increase secretion of interleukin-1 beta in cultured human aortic endothelial cells. J Diabetes Complications 1997;11:176–9. [DOI] [PubMed] [Google Scholar]
- [36].Pampfer S, Cordi S, Dutrieux C, et al. Interleukin 1beta mediates the effect of high D-glucose on the secretion of TNF-alpha by mouse uterine epithelial cells. Cytokine 1999;11:500–9. [DOI] [PubMed] [Google Scholar]
- [37].Tao C, Hu X, Wang J, et al. Effect of admission hyperglycemia on 6-month functional outcome in patients with spontaneous cerebellar hemorrhage. Med Sci Monit 2017;23:1200–7. [DOI] [PMC free article] [PubMed] [Google Scholar]


