Abstract
This study aimed to evaluate the diagnostic value of 18F-fluorodeoxyglucose (18F-FDG) positron emission tomography/computed tomography (PET/CT) for solitary pulmonary nodules (SPNs) with different diameters.
One hundred eighty two consecutive patients with SPN who underwent 18F-FDG PET/CT examination were retrospectively studied. Patients were categorized into 3 groups according to the diameter of nodules: Group A with the diameter of greater than or equal to 6 mm and less than or equal to 10 mm; Group B with diameter greater than 10 mm and less than or equal to 20 mm; Group C with diameter greater than 20 mm and less than or equal to 30 mm. The efficiency of PET/CT, PET and CT in the diagnosis of benign and malignant SPNs and different subgroup of SPNs was calculated. Receiver operating characteristic curves (ROCs) were drawn and area under the curves (AUCs) were compared between different groups.
The age, diameter, mean standardized uptake value (SUVmean) and maximum standardized uptake value (SUVmax) of benign and malignant nodules were significantly different (P < .05). For overall SPNs, the sensitivity, specificity, accuracy, PPV, and NPV of PET/CT were 98.35%, 77.05%, 91.21%, 89.47%, and 95.92%, respectively. The AUC of PET/CT was significantly larger than that of SUVmean, SUVmax, and CT (P < .05). For different size of SPNs, the AUC of PET/CT in group A was higher than that in group B and group C, but there was no significant difference with CT (P > .05). In group B, the accuracy of PET/CT in the diagnosis of SPN was significantly higher than that of CT (P < .05).
18F-FDG PET/CT demonstrated excellent performance in identifying different size of SPNs, especially for those with diameter between 11 and 20 mm, the diagnostic value of 18F-FDG PET/CT is significantly higher than other methods.
Keywords: area under the roc curve, deoxyglucose, emission-computed, positron emission tomography, solitary pulmonary nodule, standardized uptake value
1. Introduction
Solitary pulmonary nodule (SPN)[1] refers to the circular or oval nodule with a clear edge, the size of not more than 30 mm, surrounded by healthy lung parenchyma, without satellite lesions, atelectasis or mediastinal lymph nodes, and other unrelated lung lesions.[2] With the widespread use of chest CT, SPNs detection rate have been significantly improved.[3,4] It is reported that more than 150,000 new cases of SPN patients are detected annually in the United States.[5] SPN evaluation is critical because they may be an early manifestation of lung cancer. It was reported that about 35% of SPNs are primary malignancies.[6] Most malignant SPNs were in the IA stage of tumor node metastasis (TNM), with a 5-year survival rate of 61% to 75%.[7] For small nodules, it is one of the clinical challenges to distinguish between malignant and benign nodules because of their small size and lack of specific morphological features.[8] It was reported that about half of lung cancer patients missed the best time for surgical treatment, resulting in 5-year survival rate decreased to 10% to 15%.[9] Therefore, accurate diagnosis of SPN patients helps to improve the accuracy of T stage and prognosis of patients with malignant nodules.
In recent years, 18F-fluorodeoxyglucose (18F-FDG) positron emission tomography/computed tomography (PET/CT) had been regarded as a routine method for assessing tumors.[10–12] Compared to conventional imaging, PET/CT can not only display the morphological features of the lesion, but also provide molecular level of nodular glucose metabolism information. The value of 18F-FDG PET/CT in the diagnosis of SPN has been widely recognized, the sensitivity and specificity of which were 82% to 96.8% and 71% to 77.8%, respectively.[13–15] Rami-Porta et al[16] found that the size of the diameter was the risk factor for lung cancer prognosis after multivariate Cox regression analysis adjusted for age, gender, histological type, and geographic area. The cutoff value of the diameter for staging T1 and T2 lung cancer is 30 mm. In the range of 10 to 50 mm in diameter, every 10 mm increase in diameter has a significant difference in tumor prognosis. Therefore, the differential diagnosis of SPN with different diameter size directly affects the T stage and prognosis of SPN patients. However, the diagnostic value of 18F-FDG PET/CT in the diagnosis of different diameter nodules is uncertain. In this study, we aimed to evaluate the value of 18F-FDG PET/CT on the diagnosis of different diameter nodules compared with CT, the mean standardized uptake value (SUVmean) and the maximum SUV (SUVmax), by using receiver operating characteristic curve (ROC) analysis.
2. Materials and methods
2.1. SPN data
This study retrospectively analyzed 228 consecutive cases of SPN patients who underwent PET/CT examinations between October 2011 and September 2013. The local ethics committee and institutional review board approved this retrospective study (ChiCTR-DRD-17010780). Informed consent was signed for each participant. Exclusion criteria are:
-
1.
the longest diameter of the nodules <6 mm;
-
2.
with previous history of tumors or associated thoracic surgery or distant metastases.
The exclusion procedure was performed as follows: a total of 228 patients met SPN diagnostic criteria, in which 228 patients, 26 cases with nodule diameter less than 6 mm, 7 cases associated with history of chest surgery, and 13 cases with metastases. Finally, a total of 46 SPN patients were excluded from these criteria, while 182 patients with SPN were recruited in this study. All malignant nodules were diagnosed by histopathological examination. All benign nodules were confirmed by either histopathology or clinical follow-up. Biopsy or surgical excision was performed when PET/CT indicated malignancy or was difficult to characterize, or nodule enlargement was observed during follow-up, or clinical assessment was suspicious of malignancy. Clinical follow-up as listed below suggested benign nodules: a significant reduction in the volume of the lesion or a complete reduction or complete regression of the lesion after anti-inflammatory or anti-tuberculosis treatment. When the follow-up findings of SPN indicated a clinical and radiological stability for at least 2 years, the diagnosis of benign nodules was established.[17,18] TNM staging, 8th edition of lung tumors guided that a lesion with diameter less than or equal to 10 mm was defined as T1a, 11 to 20 mm as T1b and 21 to 30 mm as T1c.[16] In this study, patients were divided into 3 groups according to the diameter of the nodule: the diameter of greater than or equal to 6 mm and less than or equal to 10 mm into the group A, a total of 26 patients; diameter greater than 10 mm and less than or equal to 20 mm into the group B, a total of 76 patients; The diameter of more than 20 mm and less than or equal to 30 mm into the group C, a total of 80 patients.
2.2. 18F-FDG PET/CT imaging
All patients were fasted for at least 6 hours prior to the PET/CT examination. The serum glucose levels were <110 mg/dl before administration of 18F-FDG. PET images were acquired approximately 1 hour later by means of a hybrid PET/CT scanner (GEMINI TF 64, Philips, Netherlands) after intravenous injection of 3.7 MBq/kg of 18F-FDG. CT scan parameters were set as: tube voltage 120 kV, tube current 300 mA, pitch 0.829, collimation 64 × 0.625 mm, rotation time 0.5 seconds, reconstruction thickness 5.0 mm. For PET scan, the use of three-dimensional model from the skull base to the middle of the thigh. The scan time for each bed was 1.5 minutes. The PET images were reconstructed using the ordered subset expectation maximization (OSEM) method, the reconstructed layer thickness and interval were both 5.0 mm, and the reconstructed PET images were corrected using CT attenuation. All collected data were transferred to Philips EBW 3.0 Workstations for post-processing to reconstruct PET, CT and PET/CT fusion images.
2.3. PET/CT image analysis
The nodular features of PET/CT images were independently analyzed by 2 radiologists and nuclear medicine physicians with 6 years and 12 years of experience, respectively. The SUVmean and SUVmax of SPNs were automatically calculated. According to the criteria previously described by Fletcher et al,[19] the nodular PET and CT results are classified as 5 points system:
-
1.
to determine benign;
-
2.
benign possibility;
-
3.
hard to make diagnosis;
-
4.
malignant possibility;
-
5.
to determine malignant.
When the PET or CT score ≥ 3 points, the nodule was diagnosed as malignant nodule. PET/CT images are interpreted as benign or malignant by the following criteria: if the results of PET and CT are consistent, the diagnosis is identified as benign or malignant. When the 2 are inconsistent, if the signs of benign lesions are typical in the CT, the lesion is diagnosed as benign, and if the CT has a typical sign of a malignant lesion, the lesion is diagnosed as malignant. If the lesion has a typical high 18F-FDG metabolic profile, PET diagnosis is preferred. If PET and CT signs are not typical, the morphological characteristics of the disease and metabolic characteristics combined to make a comprehensive judgment.[20]
2.4. Statistical analysis
All data were analyzed using the Statistical Product and Service Solutions (SPSS), version 22.0. Data was expressed as mean ± standard deviation. Comparison of the 2 samples were performed by t test. A two-sided P-value of .05 was considered statistically significant. The diagnostic performance like accuracy, sensitivity, specificity, PPV, and NPV were calculated for different diagnostic methods in nodules with different diameter. The ROCs of different methods for diagnosis of SPNs were performed. Using Z test to compare the difference between AUC and Z > 1.96 for AUC were differentiated.
3. Results
3.1. Clinical data and 18F-FDG uptake of overall SPNs
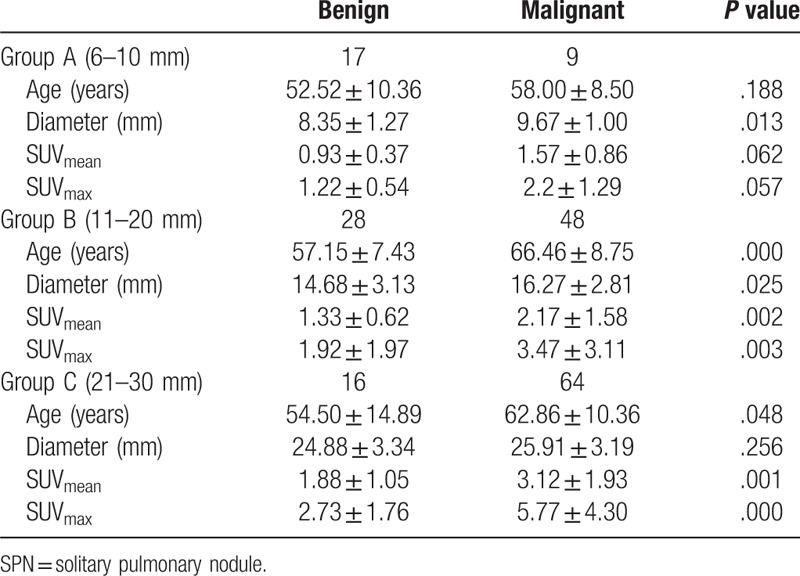
In this retrospective study, a total of 182 patients (99 males, 83 females; age range, 26–85 years; mean age (61.19 ± 10.79)) were included. The average diameter of SPNs was 18.61 ± 6.83 mm (range, 6–30 mm). In these nodules, 120 patients were pathologically confirmed as malignant nodules, including 50 adenocarcinoma patients, 15 squamous cell carcinoma patients, 19 bronchial alveolar carcinoma patients, 5 gland Squamous cell carcinoma patients, 2 mucinous adenocarcinoma patients, 1 sarcomatoid carcinoma patients, 2 neuroendocrine tumor patients, and 26 patients with other types of tumor. A total of 62 patients was confirmed as benign nodules by pathology or clinical follow-up, including 7 tuberculosis patients, 4 interstitial pneumonia patients, 2 inflammatory pseudotumor patients, 8 hamartoma patients, 3 atypical adenomatous hyperplasia patients, 1 giant lymph node hyperplasia patient, 2 organic pneumonia patients, 9 benign lung tumor patients, 2 cryptococcal disease patients, 1 bronchial cyst patient, and 23 non-specific inflammation patients. The SUVmean and SUVmax of malignant SPNs were significant higher than benign ones (P < .05). The basic situation of benign and malignant nodules was shown in Table 1.
Table 1.
The data of benign and malignant SPNs.

3.2. Clinical data and 18F-FDG uptake of different groups of SPNs
The age, diameter, SUVmean, SUVmax of group A, B ,and C were shown in Table 2. In group A and B, the diameters of malignant nodules were significantly greater than benign nodules (P = .013, .025). While in group C, the difference in diameter between malignant and benign nodules was not significant (P = .256). There were no significant differences in SUVmean and SUVmax between malignant and benign nodules in group A (P > .05). However, SUVmean and SUVmax of malignant SPNs were both significantly higher than those of benign SPNs in group B and group C (P <0.05).
Table 2.
The data of different diameter SPNs.
3.3. The diagnostic value of PET/CT for different groups of SPNs
The diagnostic values of PET/CT, CT, SUVmean, and SUVmax in diagnosis of SPNs were shown in Table 3. Of the 182 patients, 166 were correctly diagnosed by PET/CT, including 47 benign nodules, and 119 malignant nodules. Meanwhile, PET/CT made misdiagnoses in 16 patients, including 14 false positive cases and 2 false negative cases. The pathological results of 14 false positive cases were listed as follows: 1 inflammatory pseudotumor, 5 pulmonary tuberculosis, 2 benign tumor lesions, 1 inflammatory granuloma, 2 atypical adenomatous hyperplasia, 3 non-specific inflammation. The pathological results of 2 false negative cases were metastatic adenocarcinoma and poorly differentiated squamous cell carcinoma.
Table 3.
The diagnostic value of PET/CT, CT, SUVmean and SUVmax for SPNs.

The sensitivity, specificity, accuracy, PPV, and NPV of PET/CT for group A were 100.00%, 82.35%, 88.46%, 75.00%, and 100.00%, respectively. The results compared with CT, SUVmean and SUVmax were shown in Table 4. The sensitivity, specificity, accuracy, PPV, and NPV of PET/CT for group B were 95.83%, 78.57%, 89.47%, 88.46%, and 91.67%, respectively. The results compared with CT, SUVmean, and SUVmax were shown in Table 5. The sensitivity, specificity, accuracy, PPV, and NPV of PET/CT for group C were 83.47%, 47.54%, 71.43%, 75.94%, and 59.18%, respectively. The results compared with CT, SUVmean, and SUVmax were illustrated in Table 6.
Table 4.
The diagnostic value of PET/CT, CT, SUVmean and SUVmax for Group A.

Table 5.
The diagnostic value of PET/CT, CT, SUVmean and SUVmax for Group B.

Table 6.
The diagnostic value of PET/CT, CT, SUVmean and SUVmax for Group C.

3.4. The analysis of ROC curve
ROC curves of PET/CT, SUVmean, SUVmax, and CT for overall SPNs and different groups of SPNs were demonstrated in Figures 1–4. The AUC of each diagnostic method was calculated and compared. For overall SPNs, the AUC of SUVmean, SUVmax, CT, and PET/CT were 0.735 (95% CI: 0.662–0.808), 0.753 (95% CI: 0.682–0.824), 0.758 (95% CI: 0.675–0.829), and 0.873 (95% CI: 0.807–0.939), respectively. The AUC of PET/CT was significantly higher than that of the other 3 diagnostic methods (P < .05) (Table 7).
Figure 1.
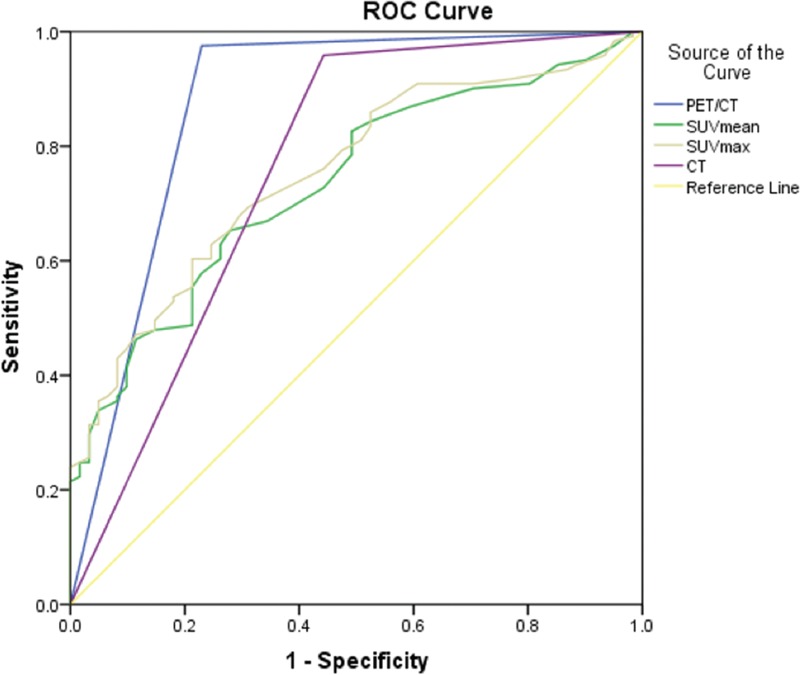
The ROC curves of PET/CT, CT, SUVmean, and SUVmax for diagnosis of SPNs. ROC = receiver operating characteristic curve, SPN = solitary pulmonary nodule, SUV = standardized uptake value.
Figure 4.
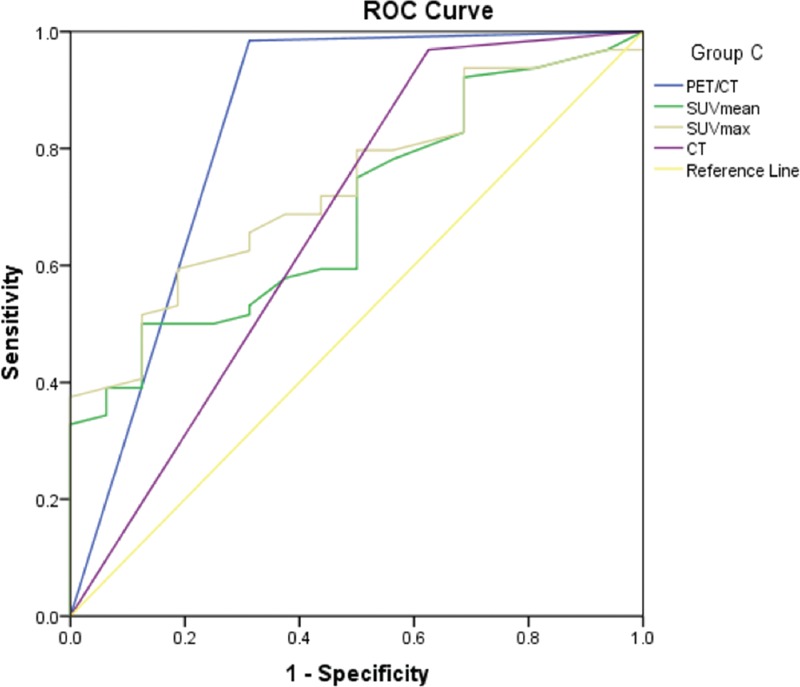
The ROC curves of PET/CT, CT, SUVmean and SUVmax for diagnosis of Group C. ROC = receiver operating characteristic curve, SUV = standardized uptake value.
Table 7.
The comparison of AUC for PET/CT, SUVmen, SUVmax and CT in diagnose of SPNs.

Figure 2.
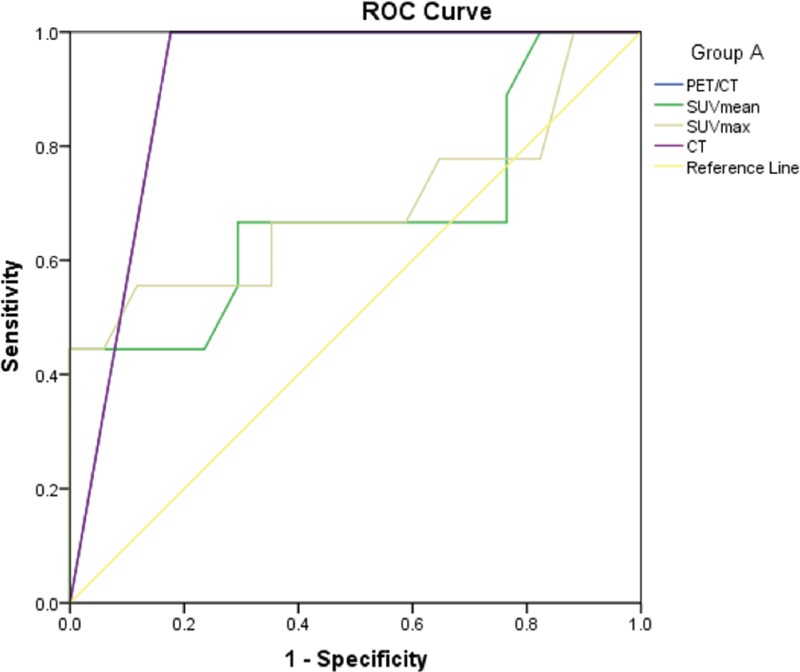
The ROC curves of PET/CT, CT, SUVmean and SUVmax for diagnosis of Group A. ROC = receiver operating characteristic curve, SUV = standardized uptake value.
Figure 3.
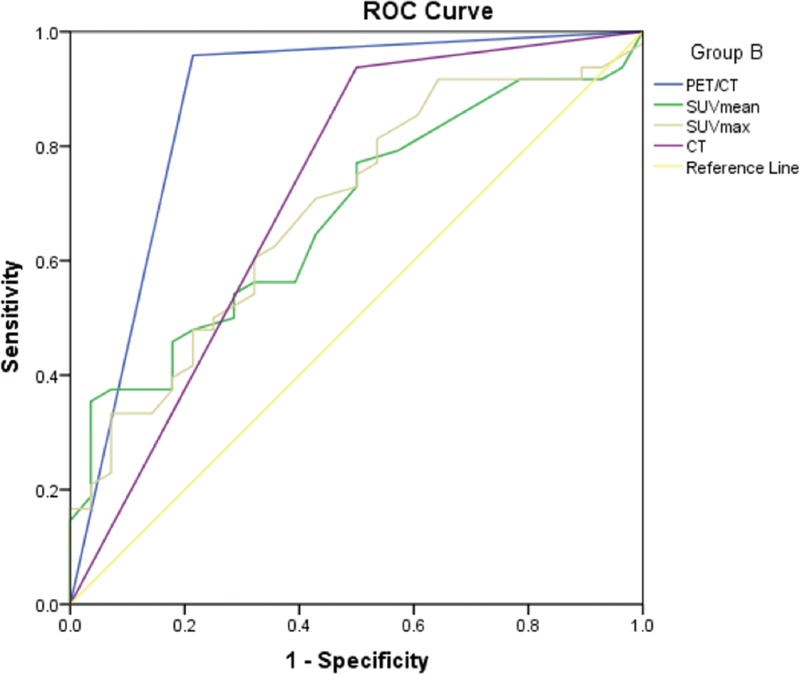
The ROC curves of PET/CT, CT, SUVmean and SUVmax for diagnosis of Group B. ROC = receiver operating characteristic curve, SUV = standardized uptake value.
Both the AUC of PET/CT and CT in group A were 0.912 (95% CI: 0.796–1.000), there was no significant difference (Table 8). The AUC of PET/CT in group B was 0.872 (95% CI: 0.775–0.969), it was significantly greater than that of CT (0.709) (95% CI: 0.560–0.848), SUVmean (0.679) (95% CI: 0.559–0.799), and SUVmax (0.689) (95% CI: 0.568–0.811) (Table 9). In group C, the AUC of PET/CT, SUVmean, SUVmax, and CT were 0.836 (95% CI: 0.695–0.977), 0.693 (95% CI: 0.564–0.823), 0.736 (95% CI: 0.617- 0.855), and 0.672 (95% CI: 0.503–0.841), respectively. The AUC values among those groups had no significant differences (P > .05) (Table 10).
Table 8.
The comparison of AUC for PET/CT, SUVmen, SUVmax and CT in diagnose of Group A.

Table 9.
The comparison of AUC for PET/CT, SUVmen, SUVmax and CT in diagnose of Group B.

Table 10.
The comparison of AUC for PET/CT, SUVmen, SUVmax and CT in diagnose of Group C.

4. Discussion
Invasive examination, such as fiberoptic bronchoscopy, thoracic needle aspiration biopsy, video-assisted thoracoscopy, and thoracotomy can make pathological diagnosis for SPN, but the effectiveness of the mirror in diagnosing small nodules and deep nodules is limited and costly and associated with morbidity.[21–23] As noted above, for nodules with small size, it is one of the clinical challenges to distinguish between malignant and benign ones because of their small volume and lack of specific morphological features.[8]
Our results confirmed that PET/CT had obvious advantages in the diagnosis of SPN, which were consistent with previous studies.[13,14] In this study, the diagnostic sensitivity, specificity and accuracy of PET/CT for overall SPNs were 98.35%, 77.05% and 91.21%, respectively. The AUC of PET/CT was significantly higher than that of SUVmean, SUVmax and CT (P < .05). The limitation of which is, for the 182 enrolled patients, the malignant nodules accounted for 65.4% (119/182). This may result from a bias in the performance of PET/CT examination, which is nodule with obvious benign characteristics can be previously diagnosed by conventional imaging. In addition, we included different pathological types of malignant nodules which had different metabolic activity. For example, the bronchial alveolar carcinoma and neuroendocrine tumor with poor FDG activity can result in false negative results, which leads to low sensitivity of SUV diagnosis.
For SPNs with different size, PET/CT also showed excellent diagnostic efficiency. The AUC of PET / CT for group A, B, and C were 0.912, 0.872, and 0.836, respectively. Divisi et al[24] reported that nodal size would affect the reliability of 18F-FDG PET/CT diagnostics, and 18F-FDG PET/CT diagnostic accuracy of nodules with less than 10 mm is higher than nodules with diameter of 10 to 15 mm. This may be due to the small number of necrotic foci in the small nodules, which improves the 18F-FDG uptake of the lesion, and is beneficial to the differentiation between benign and malignant nodules. Although this study showed the highest diagnostic efficiency of PET/CT in group A, the difference was not significant when compared with that in group B and C.
Interestingly, this study showed that PET/CT in the diameter of less than 10 mm or 20 to 30 mm nodules did not significantly improve the diagnostic efficiency of CT. It was worth mentioning that when the size of SPNs in the range of 11 to 20 mm, the SUVmax of malignant nodules was significantly higher than that of benign nodules, and the AUC of PET/CT was significantly higher than that of CT, that is, in patients with nodular size located within this range PET/CT imaging can achieve greater diagnostic performance than CT. When the diameter of the nodule was within this range, the AUC of PET/CT diagnosis of SPN was 0.872 (95% CI: 0.775–0.969), which was significantly higher than the AUC of the CT diagnosis of 0.709 (95% CI: 0.560–0.848) (P < .05).
It was reported that in the nodules with diameter less than 10 mm, the sensitivity, specificity and accuracy of PET/CT diagnosis were 83%, 100%, and 95%, respectively.[25] In addition, Calcagni et al[26] reported that PET/CT provided the correct diagnosis for all 5 patients with tumor diameters less than 10 mm. Generally, when PET/CT results are negative, SPN can be safely considered as benign one, that is to say that when PET/CT is negative, invasive surgery is not needed. Inconsistent with the study that do not recommend patients with diameter <10 mm SPN in PET/CT examinations,[3] the present study demonstrated that PPV and NPV of PET/CT diagnosis in group A (diameter <10 mm) were 100% and 75.00%, indicating that PET/CT had an undoubtedly positive detection rate for SPN < 10 mm in diameter. The result also showed that there was a significant difference in the diameter between the benign and malignant nodules in this group, so the nodular size can be used as a reference when defining the feature of nodule with diameter in this range.
As it is known that there is a phenomenon named“partial-volume effect”(PVE) when interpreting the findings of PET or PET/CT. It was reported that the smaller the tumor, the greater the underestimation of the uptake value.[27] Thus, the PVE should be taken into consideration when interpreting nodules with sub-centimeter. PVE also depends on the spatial resolution in the reconstructed images, and better spatial resolution produces less PVE. Therefore, it was suggested that tumor uptake values must be compared in images with the same spatial resolution values. A solution method for PVE in PET imaging is to adopt corrective SUV, which can significantly improve the sensitivity in diagnosis of small nodules.[28] Although the corrective SUV was not applied in present study, the diagnostic sensitivity in subcentimeter nodules was not significantly affected.
There are 14 false positive cases in all the groups, of which most are tuberculosis (5/14). It indicates that tuberculosis and lung cancer have the similar glucose metabolic activity as reported previously. A good understanding of patient's history of tuberculosis is helpful to the differential diagnosis between lung cancer and tuberculosis.[29,30] In this study, there were only 2 false negative cases of PET/CT in diagnosing SPN, which suggested that the negative results of PET/CT imaging of SPN may suggest a high benign probability of nodules.
Undisputedly, 18F-FDG uptake in benign and malignant nodules was significantly different. However, the present study showed that SUVmax overlapped between malignant nodules and benign nodules in all three groups. Further, it was reported that although the SUVmax values of benign and malignant nodules overlapped, all SPNs with SUVmax < 1.25 were benign nodules.[31] Inconsistently, this phenomenon was not found in the present study. In this study, there were 15 malignant nodules with SUVmax less than 1.25, of which 9 cases were bronchial alveolar carcinoma and the smallest SUVmax of which was only 0.4. Therefore, the effectiveness of the SUV in diagnosis of SPN was poor, as confirmed by this study.
There are several limitations in this study. Firstly, the number of cases is limited, so the benefit of PET/CT imaging for patients with different nodular size needs to be further confirmed in a large number of patients. Secondly, there is a selection bias in this study as we mentioned above, which is the malignant nodules is the majority in this study. Thirdly, we did not take the partial volume effect of small-sized nodules into consideration. Hypothesizing that there is an association between pathology and FDG uptake, we will take the different pathological types of malignant nodules into consideration in the further study.
5. Conclusion
In this retrospective study, we confirmed that 18F-FDG PET/CT had excellent performance in identifying different size of SPN, especially for those nodules with diameter between 11 to 20 mm, which are more likely to benefit from this examination. As a result of the selection bias and limited number of nodules included in this study, a larger, prospective, multicenter study is needed for further confirmation.
Author contributions
Conceptualization: Yiwei Wu.
Data curation: Ling Wang.
Formal analysis: Xiangwu Zheng.
Methodology: Jie Lin.
Supervision: Xiangwu Zheng.
Writing – original draft: Kun Tang.
Writing – review & editing: Yiwei Wu.
Footnotes
Abbreviations: AUC = area under the curve, CT = computed tomography, 18F-FDG = 18F-fluorodeoxyglucose, OSEM = ordered subset expectation maximization, PET = positron emission tomography, ROC = receiver operating characteristic curve, SPN = solitary pulmonary nodule, SUV = standardized uptake value, TNM = tumor node metastasis.
KT and LW contributed equally to this work.
The authors have no conflicts of interest to disclose.
References
- [1].Austin JH, Muller NL, Friedman PJ, et al. Glossary of terms for CT of the lungs: recommendations of the Nomenclature Committee of the Fleischner Society. Radiology 1996;200:327–31. [DOI] [PubMed] [Google Scholar]
- [2].Tsushima Y, Tateishi U, Uno H, et al. Diagnostic performance of PET/CT in differentiation of malignant and benign non-solid solitary pulmonary nodules. Ann Nucl Med 2008;22:571–7. [DOI] [PubMed] [Google Scholar]
- [3].Leef JL, 3rd, Klein JS. The solitary pulmonary nodule. Radiol Clin North Am 2002;40:123–43. ix. [DOI] [PubMed] [Google Scholar]
- [4].Seemann MD, Seemann O, Luboldt W, et al. Differentiation of malignant from benign solitary pulmonary lesions using chest radiography, spiral CT and HRCT. Lung Cancer 2000;29:105–24. [DOI] [PubMed] [Google Scholar]
- [5].Tan BB, Flaherty KR, Kazerooni EA, et al. The solitary pulmonary nodule. Chest 2003;123:89S–96S. [DOI] [PubMed] [Google Scholar]
- [6].Jemal A, Thomas A, Murray T, et al. Cancer statistics, 2002. CA Cancer J Clin 2002;52:23–47. [DOI] [PubMed] [Google Scholar]
- [7].Mountain CF. Revisions in the international system for staging lung cancer. Chest 1997;111:1710–7. [DOI] [PubMed] [Google Scholar]
- [8].Swensen SJ. CT screening for lung cancer. AJR Am J Roentgenol 2002;179:833–6. [DOI] [PubMed] [Google Scholar]
- [9].Yankelevitz DF, Henschke CI. Small solitary pulmonary nodules. Radiol Clin North Am 2000;38:471–8. [DOI] [PubMed] [Google Scholar]
- [10].Hu L, Pan Y, Zhou Z, et al. Application of positron emission tomography-computed tomography in the diagnosis of pulmonary ground-glass nodules. Exp Ther Med 2017;14:5109–13. [DOI] [PMC free article] [PubMed] [Google Scholar]
- [11].Meads C, Auguste P, Davenport C, et al. Positron emission tomography/computerised tomography imaging in detecting and managing recurrent cervical cancer: systematic review of evidence, elicitation of subjective probabilities and economic modelling. Health Technol Assess 2013;17:1–323. [DOI] [PMC free article] [PubMed] [Google Scholar]
- [12].Liu Y, Ma J, Liu Y. (18)F-fluorodeoxyglucose positron emission tomography-computed tomography as a screening tool for second primary cancers in cancer patients. Oncotarget 2017;8:92555–60. [DOI] [PMC free article] [PubMed] [Google Scholar]
- [13].Gould MK, Maclean CC, Kuschner WG, et al. Accuracy of positron emission tomography for diagnosis of pulmonary nodules and mass lesions: a meta-analysis. JAMA 2001;285:914–24. [DOI] [PubMed] [Google Scholar]
- [14].Jeong SY, Lee KS, Shin KM, et al. Efficacy of PET/CT in the characterization of solid or partly solid solitary pulmonary nodules. Lung Cancer 2008;61:186–94. [DOI] [PubMed] [Google Scholar]
- [15].Dabrowska M, Krenke R, Korczynski P, et al. Diagnostic accuracy of contrast-enhanced computed tomography and positron emission tomography with 18-FDG in identifying malignant solitary pulmonary nodules. Medicine (Baltimore) 2015;94:e666. [DOI] [PMC free article] [PubMed] [Google Scholar]
- [16].Rami-Porta R, Bolejack V, Crowley J, et al. The IASLC lung cancer staging project: proposals for the revisions of the T descriptors in the forthcoming eighth edition of the TNM classification for lung cancer. J Thorac Oncol 2015;10:990–1003. [DOI] [PubMed] [Google Scholar]
- [17].Gurney JW, Lyddon DM, McKay JA. Determining the likelihood of malignancy in solitary pulmonary nodules with Bayesian analysis. Part II. Application. Radiology 1993;186:415–22. [DOI] [PubMed] [Google Scholar]
- [18].Gurney JW. Determining the likelihood of malignancy in solitary pulmonary nodules with Bayesian analysis. Part I. Theory. Radiology 1993;186:405–13. [DOI] [PubMed] [Google Scholar]
- [19].Fletcher JW, Kymes SM, Gould M, et al. A comparison of the diagnostic accuracy of 18F-FDG PET and CT in the characterization of solitary pulmonary nodules. J Nucl Med 2008;49:179–85. [DOI] [PubMed] [Google Scholar]
- [20].Kim SK, Allen-Auerbach M, Goldin J, et al. Accuracy of PET/CT in characterization of solitary pulmonary lesions. J Nucl Med 2007;48:214–20. [PubMed] [Google Scholar]
- [21].Gambhir SS, Shepherd JE, Shah BD, et al. Analytical decision model for the cost-effective management of solitary pulmonary nodules. J Clin Oncol 1998;16:2113–25. [DOI] [PubMed] [Google Scholar]
- [22].Qi H, Wan C, Zhang L, et al. Early effective treatment of small pulmonary nodules with video-assisted thoracoscopic surgery combined with CT-guided dual-barbed hookwire localization. Oncotarget 2017;8:38793–801. [DOI] [PMC free article] [PubMed] [Google Scholar]
- [23].Han Y, Kim HJ, Kong KA, et al. Diagnosis of small pulmonary lesions by transbronchial lung biopsy with radial endobronchial ultrasound and virtual bronchoscopic navigation versus CT-guided transthoracic needle biopsy: a systematic review and meta-analysis. PLoS One 2018;13:e0191590. [DOI] [PMC free article] [PubMed] [Google Scholar]
- [24].Divisi D, Di Tommaso S, Di Leonardo G, et al. 18-fluorine fluorodeoxyglucose positron emission tomography with computerized tomography versus computerized tomography alone for the management of solitary lung nodules with diameters inferior to 1.5 cm. Thorac Cardiovasc Surg 2010;58:422–6. [DOI] [PubMed] [Google Scholar]
- [25].Veronesi G, Bellomi M, Veronesi U, et al. Role of positron emission tomography scanning in the management of lung nodules detected at baseline computed tomography screening. Ann Thorac Surg 2007;84:959–65. discussion 965-956. [DOI] [PubMed] [Google Scholar]
- [26].Calcagni ML, Taralli S, Maggi F, et al. (1)(8)F-fluoro-deoxy-glucose focal uptake in very small pulmonary nodules: fact or artifact? Case reports. World J Surg Oncol 2012;10:71. [DOI] [PMC free article] [PubMed] [Google Scholar]
- [27].Soret M, Bacharach SL, Buvat I. Partial-volume effect in PET tumor imaging. J Nucl Med 2007;48:932–45. [DOI] [PubMed] [Google Scholar]
- [28].Zhao L, Tong L, Lin J, et al. Characterization of solitary pulmonary nodules with 18F-FDG PET/CT relative activity distribution analysis. Eur Radiol 2015;25:1837–44. [DOI] [PubMed] [Google Scholar]
- [29].Huang YE, Lu HI, Liu FY, et al. Solitary pulmonary nodules differentiated by dynamic F-18 FDG PET in a region with high prevalence of granulomatous disease. J Radiat Res 2012;53:306–12. [DOI] [PubMed] [Google Scholar]
- [30].Feng M, Yang X, Ma Q, et al. Retrospective analysis for the false positive diagnosis of PET-CT scan in lung cancer patients. Medicine (Baltimore) 2017;96:e7415. [DOI] [PMC free article] [PubMed] [Google Scholar]
- [31].Grgic A, Yuksel Y, Groschel A, et al. Risk stratification of solitary pulmonary nodules by means of PET using (18)F-fluorodeoxyglucose and SUV quantification. Eur J Nucl Med Mol Imaging 2010;37:1087–94. [DOI] [PubMed] [Google Scholar]


