SUMMARY
The mechanistic target of rapamycin complex-1 (mTORC1) coordinates regulation of growth, metabolism, protein synthesis, and autophagy1. Its hyper-activation contributes to disease in many organs including the heart1,2, though broad mTORC1 inhibition risks interference with its homeostatic roles. Tuberin (TSC2) is a GTPase-activating protein and prominent intrinsic regulator of mTORC1 by modulating Rheb (Ras homolog enriched in brain). TSC2 constitutively inhibits mTORC1, but this activity is modified by phosphorylation from multiple signaling kinases to in turn inhibit (AMPK, GSK3β) or stimulate (Akt, ERK, RSK-1) mTORC1 activity3–9. Each kinase requires engagement of multiple serines, impeding analysis of their role in vivo. Here, we reveal phosphorylation or gain-or-loss of function mutations at either of two adjacent serines in TSC2 (S1365/1366 mouse; 1364/1365 human), with no prior known function, is sufficient to bi-directionally potently control growth-factor and hemodynamic-stress stimulated mTORC1 activity and consequent cell growth and autophagy. Basal mTORC1 activity, however, is unchanged. In heart, myocytes, and fibroblasts, phosphorylation occurs by protein kinase G (PKG), a primary effector of nitric oxide and natriuretic peptide signaling whose activation is protective against heart disease10–13. PKG suppression of hypertrophy and stimulation of autophagy in myocytes requires TSC2 phosphorylation. Homozygous knock-in (KI) mice expressing a phospho-silenced TSC2 (S1365A) mutation develop far worse heart disease and mortality from sustained pressure-overload (PO) due to hyperactive mTORC1 that cannot be rescued by PKG stimulation. Heterozygote SA-KI are rescued, and KI-mice expressing a phospho-mimetic (S1365E) mutation are protected. Neither KI model alters resting mTORC1 activity. Thus, TSC2 phosphorylation is both required and sufficient for PKG-mediated cardiac protection against pressure-overload. These newly identified serines provide a genetic tool to bi-directionally regulate the amplitude of stress-stimulated mTORC1 activity.
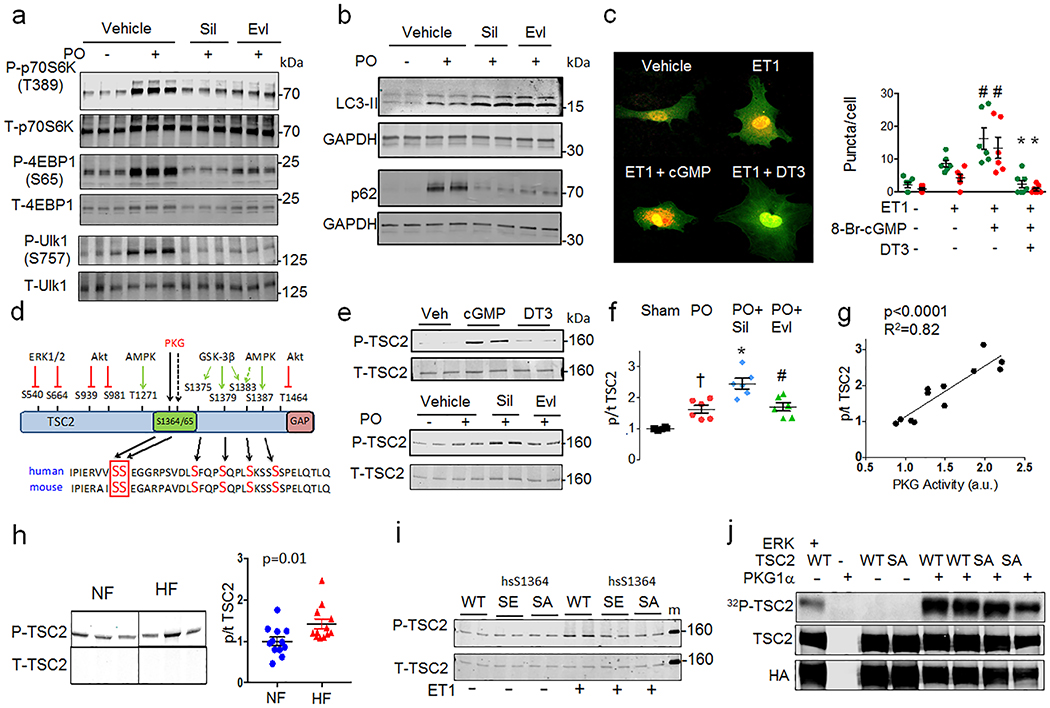
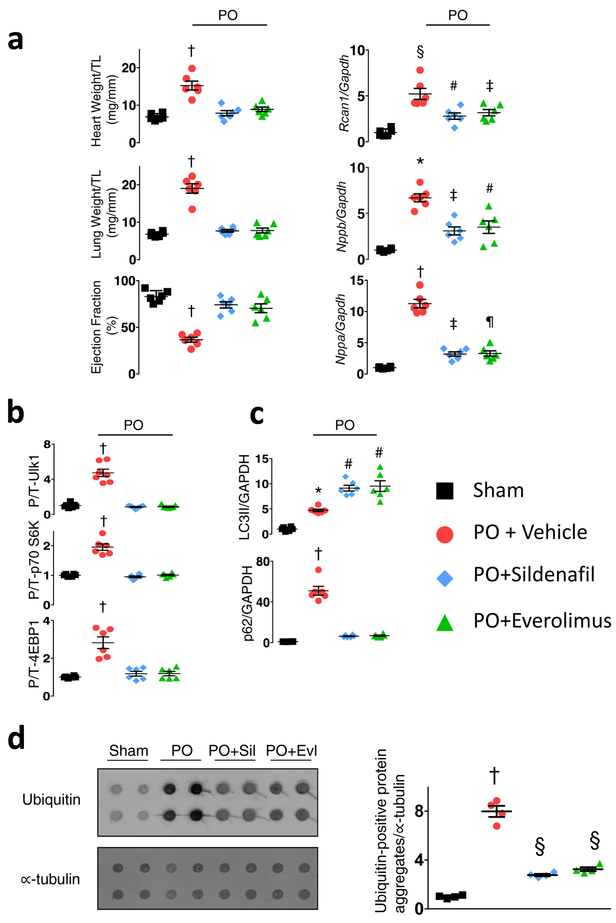
Hearts subjected to sustained PO develop pathological growth and reduced function (Extended Data 1a), accompanied by mTORC1 activation shown by increased phosphorylation of p70S6K and 4EBP1 (elF4E binding protein-1) stimulating gene transcription/translation, and Ulk-1 (Unc-51-like kinase-1) reducing autophagy14 (Figure 1a, Extended Data 1b). PKG activation by orally administered sildenafil (phosphodiesterase-type-5 inhibitor) suppresses these changes, also increasing LC3-II (microtubule-associated protein light-chain 3-II) while reducing p62 protein expression (Figure 1b, Extended Data 1c) and myocardial protein aggregation (Extended Data 1d), consistent with enhanced autophagy. These effects are mirrored by everolimus (Evl), a relatively selective mTORC1 inhibitor. In isolated cardiac myocytes stimulated by endothelin-1 (ET1), cGMP activation of PKG increases autophagic-flux, demonstrated by increased red-puncta (auto-lysosomes) in cells expressing a fluorescent reporter (TF-LC3)15 (Figure 1c), and by more enhanced LC3-II expression in bafilomycin-A1 treated cells (Extended Data 2a). PKG anti-hypertrophic effects are blunted by gene silencing of autophagy related 5 (Atg5) (Extended Data 2b). Thus, PKG activation suppresses cardiac mTORC1 signaling, blunting growth and enhancing autophagy.
Figure 1. PKG suppresses mTORC1 activity, reducing growth and stimulating autophagy, and phosphorylates TSC2 at serine 1365.
a) mTORC1 activation reflected by phosphorylated/total Ulk1, p70S6K and 4EBP1 rises in hearts of vehicle (Veh) treated mice subjected to sustained pressure-overload (PO). PKG activation by sildenafil (Sil) or mTORC1 inhibition (everolimus, Evl) similarly blocks these changes. b) LC3-II and p62 protein expression from same study. Summary results and statistics for panel a and b provided in Extended Data Figure 1b, based on n=6 biologically independent experiments. c) Confocal images of myocytes expressing LC3-II-GFP-RFP reporter, stimulated with ET1±cGMP or DT3 (PKG-inhibitor). Green puncta (autophagosomes) and red puncta (autolysosomes) per cell are quantified (mean±SEM, n=6–7 biologically independent samples, *p=0.003 vs no stimuli, # p=0.003 vs ET1+cGMP; Kruskal Wallis test with Dunn’s multiple comparisons test.) d) TSC2 phospho-target map shows S1365 identified from PKG-phospho-kinome relative to other known phosphorylation sites for mouse and human protein. e) Example Western blots for TSC2 S1365 phosphorylation. Upper- Phosphorylated/total (p/t) Ab signal (mm-pS1365) in mouse embryonic fibroblasts (MEFs) treated for 15 min with 8-Br-cGMP±PKG inhibitor (DT3) or vehicle (repeated x3 with similar results). Summary data in Extended Data 2D; Lower- p/t TSC2 using same antibody in mouse left ventricle ±PO with vehicle, Sil, or Evl co-treatment. f) Summary results for Panel e-lower. Mean±SEM, n=6 biologically independent experiments. (*p<0.002 vs other groups, #p=0.004 vs Sham, †p=0.01 vs Sham; 1WANOVA, Tukey multiple comparisons test). g) TSC2 phosphorylation correlates with in vivo myocardial PKG activity. h) Example and summary data for p/tTSC2 levels in normal versus failing human heart (n=11–12/group). i) Phospho-Ab detects pTSC2 in endothelin-1 (ET1)-stimulated myocytes in cells overexpressing hs-TSC2-WT (WT) but not hs-TSC2-S1364A or hs-TSC2-S1364E. 3 full replicates; summary in Extended Data Fig 3d. j) TSC2 phosphorylation occurs by recombinant PKG1α based on autoradiography of hsTSC2-HA-WT and hsTSC2-HA-S1364A (upper lane). Immunoblots for HA and TSC2 are in shown in lower lanes (8 biologically independent replicates).
Figure 1C green dots * p=0.003 vs vehicle, # p=0.003 vs ET1+cGMP;
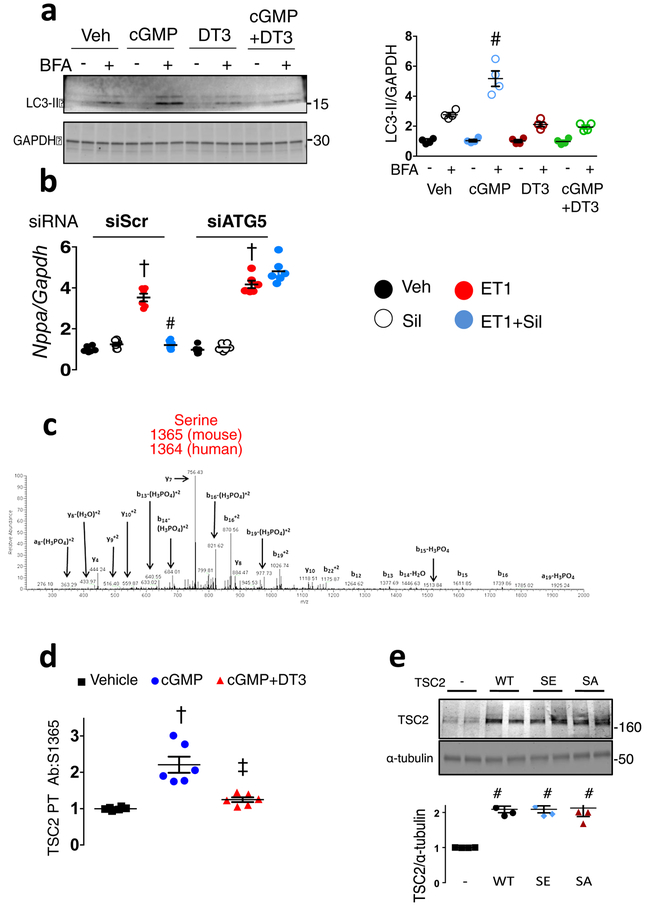
To determine the mechanism for mTORC1 suppression by PKG, adult rat myocytes were exposed to cGMP for 15 min, and lysates analyzed by phospho-proteomics. Among mTORC1-complex and regulating proteins, mass-spectroscopy identified two adjacent serines (hsS1364/65-human; mmS1365/66-mouse) in a highly conserved activation domain of TSC2, upstream of GSK-3β and AMPK phospho-sites (Figure 1d, Extended data 2c). PKG is among the top three kinases predicted to modify hsS1364 (PhosphoNET, Kinexus; link), though it may also modify hsS1365. Databases report phosphorylation of hsS136416,17. There are no reported human mutations in the hsS1364, but are two children with an hsS1365L mutation, each with seizures but no tumors.
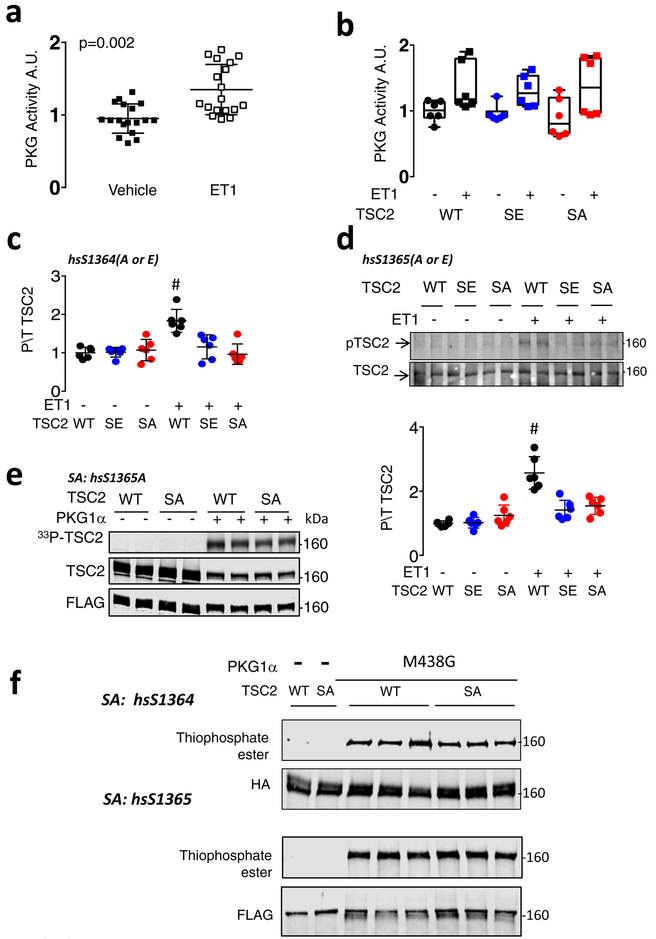
A commercial antibody for mouse phospho-mmS1365 was manufactured, but had no prior validation. Mouse embryonic fibroblasts (MEFs) show low-levels of basal signal that increases with cGMP stimulation and is blocked by PKG inhibition (DT3) (Figure 1e upper, Extended Data 2d). Antibody signal is present in myocardium in vivo, increasing with PO and further with PO+Sil but not PO+Evl co-treatment (Figure 1f). This correlates with PKG activity (Figure 1g). Analogous phosphorylation at hsS1364 is found in non-failing human myocardium that increases in dilated heart failure (Figure 1h). To test antibody specificity, myocytes were transfected with hsTSC2-WT, hsTSC2-HA-S1364A, or hsTSC2-HA-S1364E at matched expression levels (Extended data 2e), and cells stimulated with endothelin-1 (ET1) to activate PKG (Extended data 3a, 3b) and induce TSC2-phosphorylation. Antibody signal increased only if WT TSC2 was expressed (Figure 1i, Extended data 3c). Identical results were obtained if hsTSC2-S1365 was mutated (Extended data 3d), so interference with either serine prevents PKG phosphorylation.
PKG directly phosphorylates TSC2 as demonstrated by radiolabeling of TSC2 upon co-incubation of recombinant PKG1α (primary cardiovascular isoform) with TSC2-HA, and [γ−32P]-ATP (Figure 1j). This is also found when hsTSC2-HA-S1364A (Figure 1j) or hsTSC2-FLAG-S1365A is used (Extended data 3e) indicating additional sites exist. We also tested if PKG1α directly modifies TSC2 in the presence of whole cell proteins using mutated PKG1α18 (M438G) that uniquely binds modified/enlarged sulfonated-ATP19. This assay revealed TSC2-thiphosphate ester (PKG phosphorylation) in WT and both SA mutations (Extended Data 3f) as well.
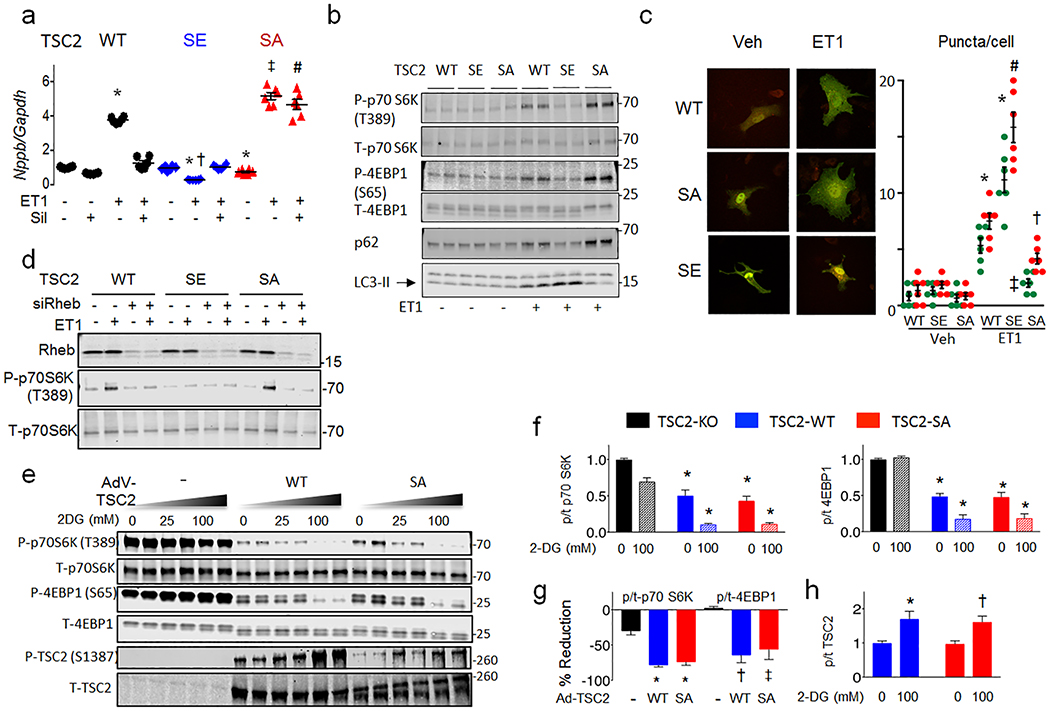
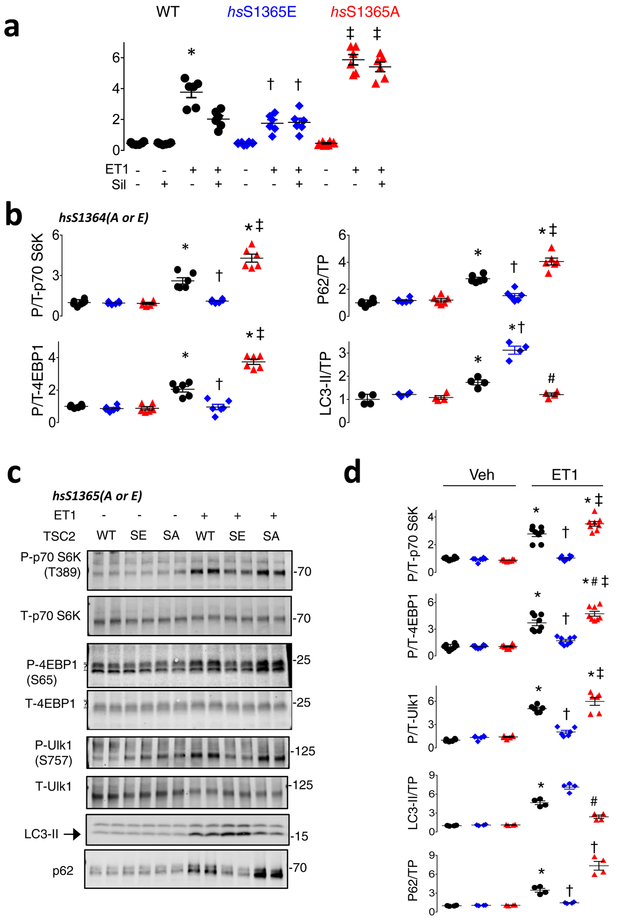
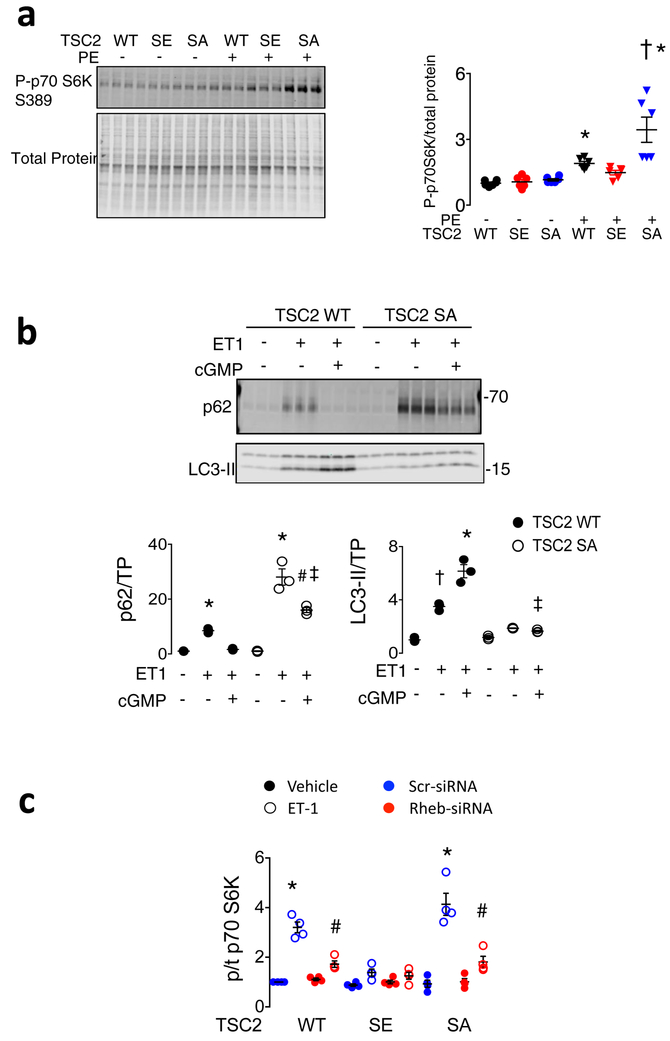
We next tested the functional significance of the serines. Figure 2a and 2b show results from myocytes transfected with WT, hsTSC2-HA-S1364A, or hs-TSC2-HA-S1364E and then further stimulated with 48-hr ET1. Basal Nppb mRNA (a hypertrophy biomarker) was low, regardless of which TSC2 was over-expressed. ET1 increased Nppb most in hsS1364A-TSC2 and least in hsS1364E-TSC2 expressing cells, each compared to WT (Figure 2a). Nppb expression declined with PKG only in TSC2-WT-expressing cells, consistent with the lack of hsS1364 phosphorylation with either site mutated (Figure 1i). Very similar results were obtained with hsS1365A and hsS1365E mutations (Extended Data 4a), so mutations of either serine alone are sufficient to induce a similar biological response. Compared to WT, SA-TSC2 amplified whereas SE-TSC2 attenuated mTORC1 activity stimulated by ET1, neither having an impact at rest. LC3-II protein increased and p62 declined with SE expression supporting enhanced autophagy; the opposite occurring with SA expression. This was observed regardless of which serine was mutated (hsS1364: Figure 2b, Extended Data 4b; hsS1365: Extended Data 4c, 4d). Increased TF-LC3 red-punctae support enhanced autophagic flux with SE expression (Figure 2c). Phenylephrine mimicked ET1 effects (Extended Data 5a), and hsS1364A-TSC2 expression depressed PKG-modulation of LC3-II and p62 (Extended Data 5b). Thus, site-substitution mutants at either of the two adjacent serines on TSC2 either amplify or attenuate stress-stimulated mTORC1 regulation, and PKG effects on growth and autophagy are either markedly impaired (SA) or mimicked (SE) by single point mutations of either one.
Figure 2. TSC2 S1365A and S1365E mutations bi-directionally regulate mTORC1 growth hormone-activation to control cardiomyocyte hypertrophy and autophagy.
a) Effect of hs-TSC2-WT, hs-TSC2-S1364E (SE), or hs-TSC2-S1364A (SA) mutants ± Sil on pro-hypertrophic Nppb expression in isolated myocytes stimulated with vehicle or ET1 (n=6 biologically independent samples for each condition). Mean±SEM. 1WANOVA, Tukey multiple comparisons test within TSC2 genotypes: *p<1E-6 vs other groups; 2WANOVA between genotypes, ET1 vs ET1+Sil: p<1E-6 for Sil and TSC2-genotype interaction, Tukey multiple comparisons tests: †p<1E-6 vs WT+ET1 and SE+ET1, ‡p=4E-6 vs WT+ET1, #p<1E-6 vs ET1+SIL for other genotypes. b) Example immunoblots for p/t - p70S6K, 4EBP1, total p62 and LC3-II, from same protocol in panel a. Summary results shown in Extended Data 4b with 4–6 biologically independent samples. c) Confocal image and summary data (n=6 biologically independent experiments; Mean±SEM) for LC3-GFP-RFP reporter of autophagic flux in WT, SA, or SE-TSC2 expressing myocytes ± ET-1 stimulation. 1W ANOVA, Sidak multiple comparison test. For green and red dots: * p≤8E-5 vs corresponding Vehicle, red: †-p=0.014 vs Veh-SA and WT-ET1, p<1E-6 vs SE-ET1, # p<1E-6 vs WT-ET1. d) SA-mTORC1 modulation requires Rheb. NRCMs transfected with Rheb or scrambled siRNA, co-transfected with TSC2 WT, SE, or SA plasmids are then stimulated with ET1. Immunoblots for Rheb, P-p70S6K and total p70S6K are shown (n=4 biologically independent experiments, summary in Extended Data 5c. e) TSC2-KO MEFs expressing empty vector, TSC2 WT or TSC2 SA TSC2 exposed to ET1 to stimulate mTORC1, and then 2-deoxyglucose (2-DG) to suppress it by activating AMPK. MTORC1 activation is blunted by 2DG in TSC2-WT or TSC2–SA expressing cells, and correlates with enhanced hsTSC2-S1387 (AMPK site) phosphorylation. Experiment replicated 5 times. f-h) Summary analysis of experiment in panel e, n=10 biologically independent samples; Mean±SEM. f) 2W-ANOVA, Tukey multiple comparisons. *p<1E-6 vs TSC2 KO in corresponding treatment group, p=0.6 for interaction of 2DG and genotype. g) 1WANOVA, Tukey multiple comparisons: *p<1E-6, †p=0.0002, ‡p=0.001 vs. TSC2-KO. h) *p=0.004, †p=0.008 vs without 2-DG.
TSC2 principally modulates mTORC1 by regulating Rheb-GTP binding, and Rheb gene silencing blocked ET1-stimulated mTORC1 activation in WT- and SA-TSC2 expressing myocytes. It had no effect in SE-TSC2 expressing cells that exhibited low mTORC1 activity regardless (Fig. 2d, Extended Data 5c). The serines are proximate to AMPK and GSK3β targeted residues, the latter requiring AMPK co-activation of TSC29. To test if an SA mutation prevents TSC2-mTORC1 control via AMPK, TSC2-KO MEFs expressing WT, SA, or empty vector were exposed to ET1 and then 2-deoxyglucose (2-DG), the latter inhibiting glycolysis to stimulate AMPK. KO MEFs displayed constitutive mTORC1 activation fairly insensitive to 2-DG. WT- or SA-TSC2 expression reduced this activity, but it was further depressed similarly by 2-DG in concordance with hsTSC2-S1387 phosphorylation (AMPK site) (Figure 2e-2h).
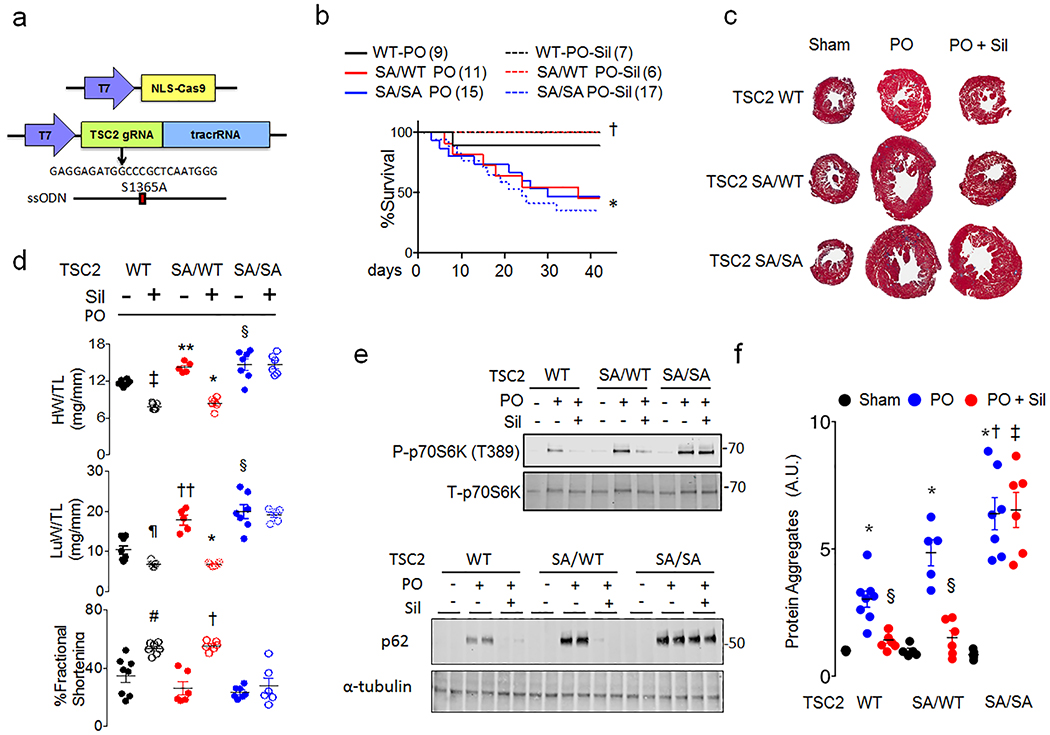
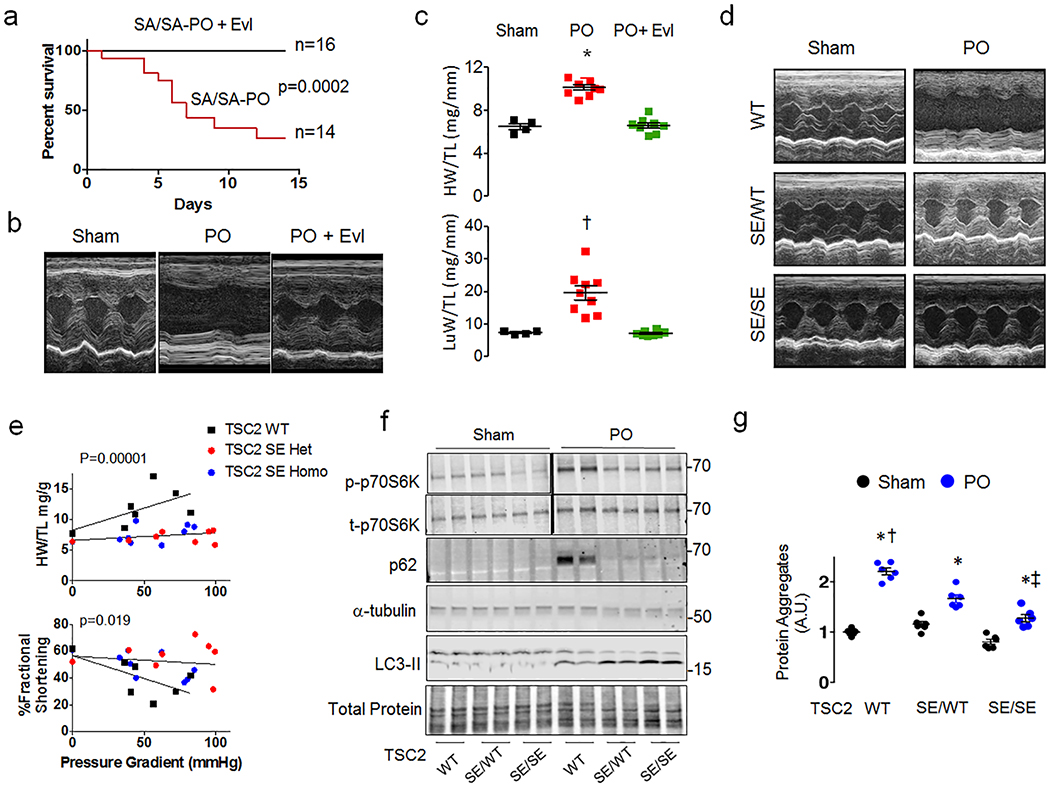
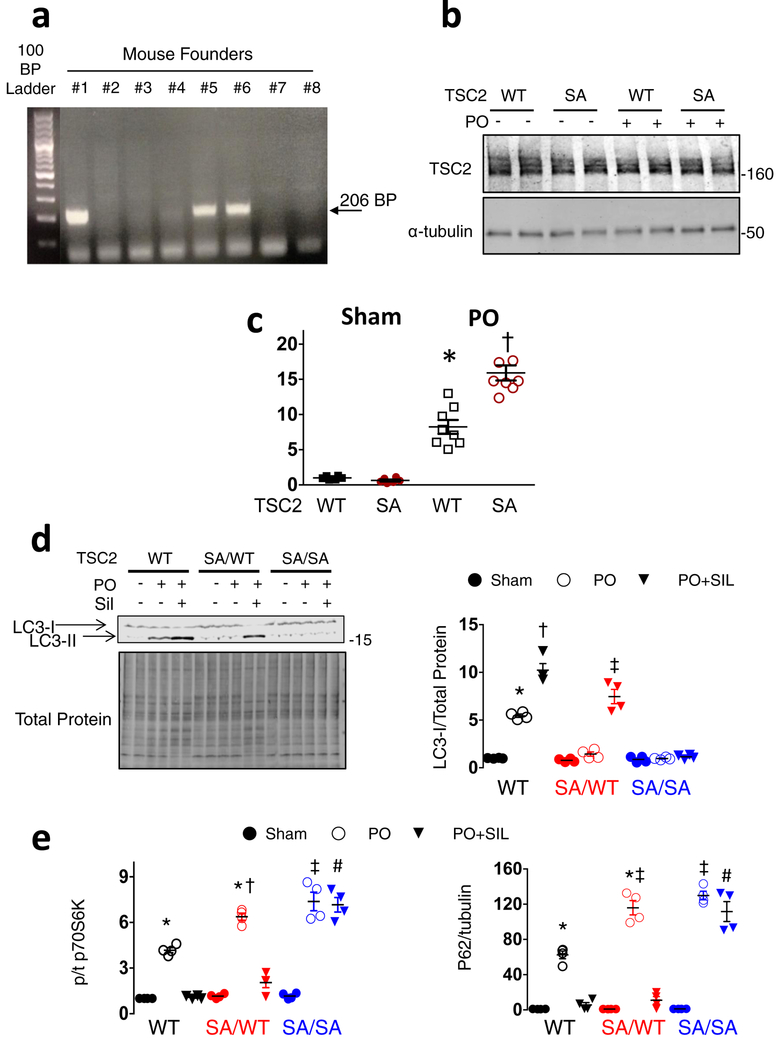
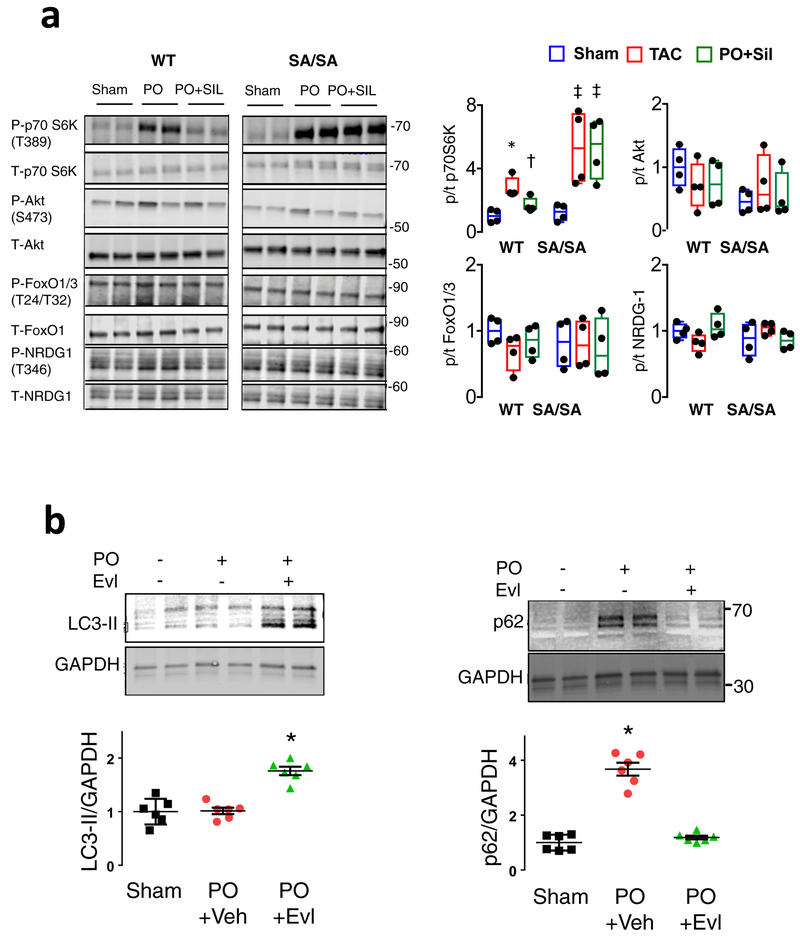
Mice with a global mmTSC2-S1365A (SA) knock-in mutation were generated using CRISPR/Cas9 gene editing (Figure 3a and Extended Data 6a) to assess its role in vivo. They are born in normal Mendelian ratios, grow and develop normally, have similar cardiac structure and function as their littermate controls (Extended Data Table), and levels of myocardial TSC2 protein (Extended Data 6b). Heterozygote (SA/WT), homozygote (SA/SA) and control (WT) mice were subjected to PO, and randomized to vehicle or sildenafil co-treatment. Mortality after PO in vehicle-treated mice was markedly higher in SA/WT and SA/SA versus WT, and sildenafil prevented this in SA/WT but not SA/SA mice (Figure 3b). PO-stimulated heart hypertrophy, dysfunction, and greater lung weight was similar in SA-expressers versus WT, but sildenafil only reversed this in SA/WT and WT (Figure 3c-3d, Extended Data 6c). MTORC1 activity and myocardial protein aggregation were greater and autophagy (p62, LC3-II) depressed following PO in SA-expressers versus WT, and was reversed by sildenafil in all but SA/SA hearts (Figure 3g, 3h, Extended Data 6d, 6e). These findings were similar in males and females. MTOR-complex-2 activation was unaltered by the SA mutation (Extended Data 7a). SA/SA mice randomized to everolimus (vs. vehicle, each starting 3 days before PO) showed full rescue of mortality (Figure 4a) and heart disease (Figure 4b, 4c), with enhanced autophagy (Extended Data 7b), supporting a key role of mTORC1 hyperactivation from SA-expression. Together, they show the mmS1365A mutation acts as an autosomal dominant, amplifying stress-stimulated but not rest mTORC1 activity in vivo, and that pS1365 is required for PKG-mediated mTORC1 suppression and amelioration of PO-induced heart disease.
Figure 3. TSC2 S1365A knock-in mice have exacerbated hypertrophy and mortality from pressure-overload, and homozygous KI cannot be ameliorated by PKG activation.
a) Strategy and guide-RNA for CRISPR-Cas9 generated mmS1365A (SA) knock-in mice. b) Percent survival for TSC2 WT, (SA/WT), and (SA/SA) mice exposed to sham or PO with vehicle or Sil co-treatment. Sample size/group noted in figure. Log rank Mantel-Cox test, *p=0.04 combined SA/WT and SA/SA vs WT-Veh; †p=0.03 vs SA/WT + Sil. c) Example Masson’s trichrome stained left ventricle cross sections from TSC2 WT, SA/WT, SA/SA mice subjected to sham or PO and treated with vehicle or Sil. Repeated at least 6× for each condition. d) Heart (HW), lung (LuW) weight normalized to tibial length (TL), and fractional shortening for same experiments show near complete suppression of hypertrophy and lung congestion with Sil-treatment in WT and SA/WT but no effect in SA/SA PO hearts. (Biologically independent replicates: n=5 for SA/WT PO, 6 for SA/WT and SA/SA PO+Sil, 7 for SA/SA and WT PO+Sil, and 8 for WT-PO); Mean±SEM. 1WANOVA, Tukey multiple comparison: * p<1E-6, †p=0.0004 vs PO without Sil, and SA/SA PO+Sil, ‡ p=0.0001, ¶p=0.04, # p=0.001 vs WT without Sil, ** p=0.009, †† p=0.0009 vs WT-PO. e) Immunoblots for phospho/total p70S6K and p62/tubulin from myocardium of WT, SA/WT, and SA/SA mice with sham, PO, or PO+Sil. Repeated x1 with identical results, summary (n=4/condition) in Extended Data 6e, 6f. f) Effect of SA/WT or SA/SA on myocardial protein aggregation in sham, PO, and PO+Sil. Mean±SEM, biological replicates are as listed for Panel d. 1WANOVA, Tukey multiple comparisons test: *p≤0.00008 vs respective sham in each group; §p<0.0003 vs. respective PO; †p<0.0003 vs WT-PO, sham, ‡ p<1E-6 vs PO+Sil for other two genotype groups.
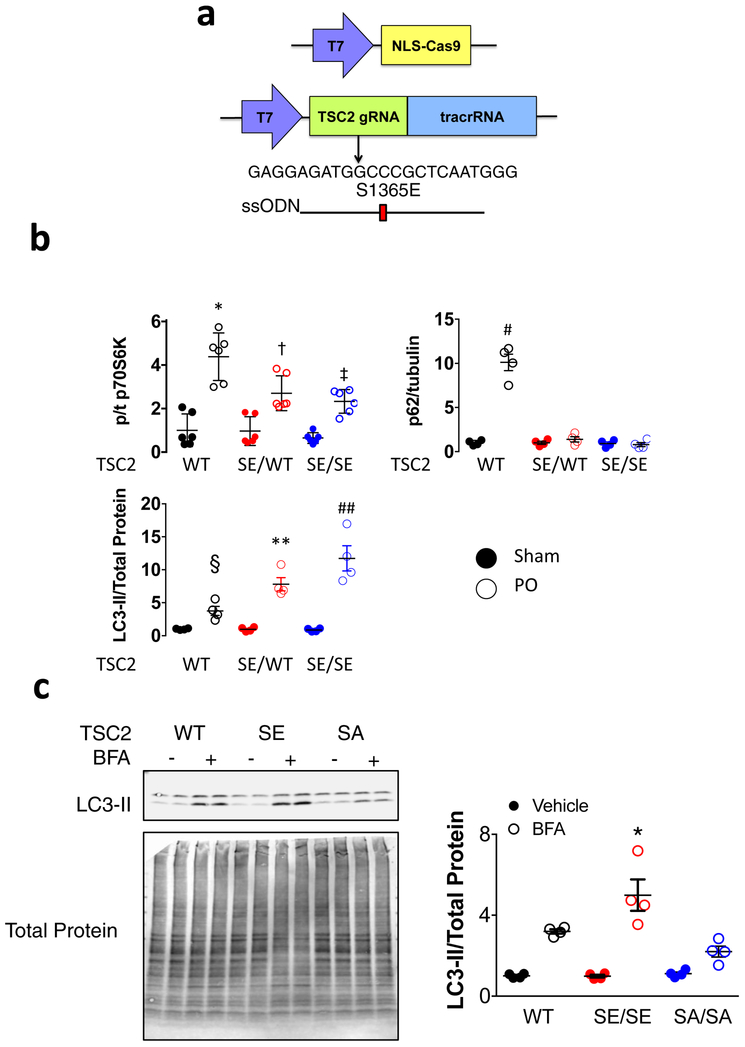
Figure 4. Everolimus rescues mmS1365A mice, and mmS1365E KI mice are protected against hypertrophy, dysfunction, and mTORC1 hyper-activation following pressure overload.
a) Percent survival of SA/SA PO mice +/− everolimus (Evl) co-treatment. P-value for log-rank Mantel-Cox test. Sample size/group shown. b) Example echocardiography shows normalized left ventricular function in Evl-treated mice. Repeated: n=4, 9, 8 for Sham, PO, and PO+Evl. c) PO increased heart (HW) and lung (LuW) weight normalized to tibia length (TL) is reversed by by Evl-treatment in SA/SA; Mean±SEM, Kruskal Wallis Test with Dunn’s multiple comparisons vs PO alone: *p=0.01 vs Sham, p=0.001 vs PO+Evl; †p=0.021 vs Sham, p=.0005 vs PO+Evl. d) Echocardiograms of mice expressing SE/WT or SE/SE KI mutation subjected to 6-weeks of PO display improved function despite PO. Repeated 7–8 times/group. e) Regression of heart weight/tibia length and percent fractional shortening versus left ventricular-aorta pressure difference (load), p-values are for group effect between TSC2 WT/WT versus SE/WT and SE/SE by ANCOVA. f) Immunoblots for p/t70 S6K, p62/tubulin, and LC3-II/tubulin (n=6, 4, 4, respectively for biologically independent samples, summary data in Extended Data 8b). g) Effect of SE/WT and SE/SE expression on myocardial protein aggregation induced by PO. Mean±SEM, n=6 biologically independent experiments, 2WANOVA (p<1E-6 for effect of PO, genotype, and interaction), Tukey multiple comparisons: * p=0.00002 versus respective sham; † p=0.00002 vs SE/WT and SE/SE PO, ‡ p=0.0003 vs SE/WT PO.
Panel F * = 0.001; + - <0.001 § - p=0.02 vs SA homo; ǂ - 0.016 vs SE het, and p<0.001 vs SE homo p=
KI mice expressing mmTSC2-S1365E were also generated (Extended Data 8a) to test if a phosphomimetic mutation confers effects opposite to SA. The mice are born with normal Mendelian ratios, cardiac morphology, and function (Extended Data Table). Opposite to SA, both SE/WT and SE/SE are markedly protected against PO, with minimal hypertrophy and better heart function (Figure 4d, 4e). Baseline mTORC1 activity with SE expression is similar to WT but remains low after PO, while LC3-II increases and p62 declines (Figure 4f, Extended Data 8b). In vivo autophagic flux is somewhat higher in SE and less in SA vs WT (Extended Data 8c). SE-TSC2 expressing mice also have reduced myocardial protein aggregation (Figure 4g).
Both SA and SE TSC2 modifications impact stress-induced but not basal mTORC1 activity or in vivo cardiac physiology. This distinguishes them from myocyte-targeted TSC2-deletion that constitutively activates mTORC1 inducing heart disease20, and genetic mTOR or mTORC1 suppression that induces heart failure and early lethality21,22. Lack of a basal phenotype in both KI models is notable, as these mutations exist in all cells, highlighting an advantage of modulating mTORC1 via TSC2 rather than targeting the mTORC1 complex itself. Prior in vitro studies with TSC2 mutants that silenced (S→A substitution) kinase-targeted phospho-sites for AMPK8, ERK1/24, Akt5, and GSK3β9 each found they altered basal mTORC1 activity. Phospho-mimetic simulation of ERK1/2 phosphorylation stimulated mTORC1 activity and cell growth4. This too differs from hsTSC2-S1364 (or S1365) modulation, that acts more as an amplifier/attenuator of mTORC1 co-stimuli. Moreover, it affords selective control, potently regulating growth factors (or PO, a multi-factorial stress), but not metabolic signaling via AMPK. Similar selectivity may apply to other TSC2 kinase regulators, but this remains unknown. The present KI mice are the first in vivo models altering TSC2 phosphorylation, and whether multi-site silencing/mimetic mutants of other TSC2 regulating kinases yield similarly benign rest phenotypes remains to be determined.
Both SA- and SE-TSC2 modify mTORC1-regulated growth and autophagy, revealed by multiple assays with mutations at either of the two adjacent serines, and in the SA-PO everolimus-rescue study. While PKG modulates pathological growth by other pathways as well11, we believe this is the first study coupling it to autophagy. In SA/SA mice subjected to PO, sildenafil failed to alter LC3-II and p62 expression or protein aggregation, supporting a key role of PKG-TSC2 modulation at mmS1365. Whether genetically preventing autophagy abrogates PKG-amelioration of heart disease in vivo, and if so requires TSC2-hsS1364/S1365, remains to be tested.
Our results identify PKG as a direct mediator of TSC2-hsS1364/1365 post-translational regulation. That PKG does not phosphorylate TSC2 regardless of which is mutated, and that cell behavior from SA or SE mutations in each serine are very similar supports tight inter-regulation. While additional PKG sites on TSC2 are suggested by our studies, the data indicates either of the identified sites is sufficient. Other kinases may also target these residues, as mmS1365 phosphorylation was first reported in a proteomic study of TSC2-suppressors (ERK, p90S6K), and modified by phorbol ester, a non-specific protein kinase C activator16. The study did not perform functional analysis, and importantly, phorbol ester and more specific PKC activators activate mTORC123,24, opposite to PKG. The findings that pathological stress stimulates TSC2 phosphorylation in myocytes and myocardium along with mTORC1 activation, but its prevention by TSC2-SA expression amplifies the pathology, supports a role of this phosphorylation site on negative feedback to mTORC1. Protective effects from TSC2-SE expression or more selective phosphorylation by PKG supports this further. Mammalian cells broadly express TSC2, mTOR, and related mTOR-complex proteins, and many also express PKG. Thus, our data have implications beyond the heart, expanding potential therapeutic roles of PKG activators for disease where altered modulation of mTORC1 is present and/or desired. Furthermore, genetic modulation of the newly identified phospho-sites provides an mTORC1 controller with potential utility for adoptive cell therapies by providing more nuanced and flexible mTORC1 regulation.
METHODS
Animal models
Mice expressing global TSC2 knock-in mutations mmTSC2-S1365A (SA) or mmTSC2-S1365E (SE) (Figure 3A, Extended Data 6a, Extended Data 8a) were newly generated using CRISPR/Cas9 gene editing (Transgenic Core Laboratory, Johns Hopkins University). TSC2 guide RNA was designed using an algorithm developed by Vinod Ranganathan25, and cloned into pSpCas9(BB)-2A-Puro (PX459) V2.0 (a gift from Feng Zhang, Addgene plasmid #62988), and pUC57-sgRNA expression vector (a gift from Xingxu Huang, Addgene plasmid #51132). DNA cleavage was tested in mouse N2a cells using the Surveyor Mutation Detection kit (Integrated DNA Technologies, Coralville, IA) according to the protocol of Ran et al26. In vitro transcription was performed for both Cas9 (from a modified pX330-U6-Chimeric_BB-CBh-hSpCas9 plasmid, originally a gift from Feng Zhang, Addgene plasmid #42230), and guide RNA using the Ambion mMESSAGE mMACHINE kit and NEB HiScribe T7 High Yield RNA Synthesis kit, respectively. ssODN for the S1365A or S1365E point mutations were purchased from Integrated DNA Technologies. C57Bl/6J blastocyst injections were performed by the Johns Hopkins Transgenic Mouse Core Laboratory with a mix consisting of: 25ng/μl Cas9; 12.5ng/μl guide RNA, and 25ng/μl ssODN. We received 5 founders positive for the TSC2 SE transgene and 3 founders positive for the TSC2 SA transgene. Both colonies of mice were backcrossed with mice on a C57Bl/6J background, generating mice with a 98.5% (SE) and 99.3% (SA) purity. The genetic backgrounds of mice were assessed at DartMouse™ Speed Congenic Core Facility at the Geisel School of Medicine at Dartmouth. DartMouse uses the Illumina, Inc. (San Diego, CA) Infinium Genotyping Assay to interrogate a custom panel of 5307 SNPs spread throughout the genome. The raw SNP data were analyzed using DartMouse’s SNaP-MaP™ and Map-Synth™ software, allowing the determination for each mouse of the genetic background at each SNP location. We maintained each colony with the breeding strategy of a heterozygous male and a heterozygous female, yielding KI homozygous mice, KI heterozygous mice, and littermate WT mice at a 25:50:25 ratio.
Pressure overload (PO) model
PO was induced by trans-aortic constriction as previously described10. Sham controls underwent similar surgery without ligature constriction. Age and weight-matched littermates were randomly divided into PO or sham groups with male and female mice equally represented in the data presented. Mice were followed for up to 6 weeks after PO, in some instances, co-treated with everolimus (Evl, Sigma; oral gavage, 10 mg/kg/day), or sildenafil (Sil, Pfizer or Wako Pure Chemical Industries, 200 mg/kg/day mixed in soft diet, Bioserv)27, or appropriate matched vehicle. Drug treatment started either 1-week following PO, or several days prior to PO. All of the protocols were approved by the Johns Hopkins Medical Institutions Animal Care and Use Committee. The studies were in compliance with all ethical regulations.
Conscious mouse echocardiography
Intact heart morphology and function were measured in conscious mice by serial M-mode transthoracic echocardiography (VisualSonics Vevo 2100, 18–38 MHz transducer; SanoSite Inc.). Images were obtained and analyzed using VisualSonics image software, by an individual blinded to the animal condition.
TSC2 expression plasmids and adenovirus
A FLAG-tagged human TSC2 expression plasmid was provided by Brendan Manning (Harvard University). Based on this, we further generated 5 new constructs, one in which FLAG was replaced by an HA sequence (both at the C-terminus), and then each WT vector further modified to generate hsTSC2-HA-S1364A, hsTSC2-HA-S1364E, hsTSC2-FLAG-S1365A, and hsTSC2-FLAG-S1365E mutants. Adenovirus was also developed expressing the FLAG-tagged WT, hsS1365A, or hsS1365E (Welgen, Inc., Worcester, MA) and used for studies involving TSC2-KO and TSC2-WT mouse embryonic fibroblasts MEFs. These cells lines were provided by Dr. Brendan Manning as first generated by David Kwiatkowski28.
Neonatal rat cardiomyocyte studies (NRCMs)
NRCMs were isolated and cultured at 1M cells/well in 6-well plates for 24 hours in DMEM with 10% FBS and antibiotics prior to study, described10. Hypertrophy was stimulated with endothelin 1 (ET1, 10 nM, Sigma), phenylephrine (PE, 100 μM, Sigma) for either 15 min or 48 hours in serum-free DMEM supplemented with 0.1% Insulin-Transferrin-Selenium (Life Technologies). Studies were also performed in NRCMs first transfected with plasmids expressing TSC2-WT, SA, or SE mutations (hsS1364 or hsS1365) (5 μg/well), using Takara Clontech Xfect reagent per manufacturer’s protocol. Cells were provided 24 hours prior to exposure to stimulation with ET1 or vehicle in combination with other reagents as described in the study.
Mouse Embryonic Fibroblasts (MEF) and HEK TSC2-KO cells
MEFs were cultured in DMEM supplemented with 10% FBS and 1% antibiotics until reaching 50–60% confluence at which time the cells were transfected with TSC2 constructs or empty vector, or infected with adenovirus expressing WT-, SA- or SE-TSC2. Expression vectors used a CMV promoter. Following an additional 24 hours of culturing, transfected MEFs were treated with various reagents: 8-Bromo-cGMP (100 μM), DT3 (1 μM), 2-deoxyglucose (100 μM), and vehicle control.
Human myocardium analysis
Human myocardium was obtained in accordance with institutional review board approvals at Johns Hopkins University and the University of Pennsylvania. The use of human subject material was in compliance with all ethical regulations. Failing human hearts were obtained at time of explant surgery, and non-failing controls at time of other organ harvesting. LV free wall tissue was collected at the University of Pennsylvania under ice-cold cardioplegia and rapidly frozen in liquid nitrogen. Informed consent was obtained from failing heart human tissue donors. The family or legal representative provided consent for organ harvesting from deceased donor controls. For the non-failing controls, the age was 52.8 ±15.4, 6 males, 6 females, no clinical history of heart failure; for the heart failure group, the mean age was 51.3 ±12.1, 8 males, 4 females (p=NS for sex distribution between groups), and all were non-ischemic dilated cardiomyopathy patients with severe LV dysfunction who then underwent cardiac transplantation.
Immunoblot analysis
Whole cell lysate was extracted (Cell Signaling Technology #9803) and protein concentration determined by BCA method (Pierce). Samples were prepared in SDS Tris-Glycine buffer (Life Technologies) and run on Novex 8–16% Tris-Glycine Gels (Life Technologies) or TGX 7.5% and 4–20% Tris-Glycine Gels (Bio-Rad) and blotted onto a nitrocellulose membrane. The following primary antibodies were used in this study: phospho-Akt (S473) #9271 lot 14 used at 1:1,000, Akt #9272 lot 28 used at 1:1,000, phospho-70 S6K (T389) #9205 lot 21 used at 1:1,000, p70 S6K #9202 lot 20 used at 1:1,000, phospho-4EBP1 (S65) #9451 lot 14 used at 1:1,000, 4EBP1 #9452 lot 12 used at 1:1,000, phospho-Ulk-1 (S757) #1420 clone D706U lot 4 used at 1:1,000, Ulk-1 #8054 clone D8H5 lot 5 used at 1:1,000, phospho-FoxO1/3 #9464 lot 7 used at 1:2,500, FoxO1 #2880 clone C29H4 lot 11 used at 1:3,000, phospho-NRDG-1 #3217 clone D98G11 lot 3 used at 1:5,000, NRDG-1 #9395 clone D6C2 lot 1 used at 1:1,000, GAPDH #2118 clone 14C10 lot 10 used at 1:1,000, Rheb #13879 clone E1G1R lot 1 used at 1:1,000, phospho-TSC2 (S1387) #5584 lot 5 used at 1:1,000, TSC2 #3612 clone D93F12 lot 5 used at 1:1,000, and α-tubulin #3873 clone DM1A lot 12 used at 1:1,000 (Cell Signaling Technology), phospho-TSC2 (S1365) #120718 lot NFSA12072OAH used at 1:500 (NovoPro Labs), LC3 #ab192890 lot GR321–3 used at 1:1,000, thiophosphate ester #ab92570 lot GR237393–18 used at 1:5,000, and p62 #ab109012 lot GR12843–70 used at 1:1,000 (Abcam), FLAG #F3165 lot SLBK1346V used at 1:1,000, ubiquitin #SAB4503053 lot 310385 used at 1:1,000 (Sigma), and a total protein stain #926–11016 lot C80522–02 used at 5 ml/membrane (Li-Cor). Antibody binding was visualized by infrared imaging (Odyssey, Licor) and quantified with Licor Image Studio Software 3.1.
Gene expression by quantitative RT-PCR
Total RNA isolated from left ventricular myocardium or cultured NRCMs (Trizol Reagent, Invitrogen), was reverse transcribed to cDNA (High Capacity RNA-to-cDNA Kit, Applied Biosystems, Life Technologies), and underwent PCR amplification using TaqMan probes for atrial natriuretic peptide (Nppa) (mouse #Mm01255747_g1, rat #Rn00664637_g1), B-type natriuretic peptide (Nppb) (mouse # Mm01255770_g1, rat #Rn00580641_m1), regulator of calcineurin-1 (Rcan-1) (mouse #Mm01213406_m1, rat #01458494_m1), tuberous sclerosis complex 2 (tuberin, TSC2) (mouse #Mm00442004_m1, rat #Rn00562086_m1), or glyceraldehyde-3-phosphate dehydrogenase (GAPDH) (mouse #99999915_g1, rat #Rn01775763_g1) (Applied Biosystems). The threshold cycle value was determined using the crossing point method, and samples normalized to the GAPDH for each run.
Bafilomycin A1 autophagy-flux assay
For in vitro studies, NRCMs were cultured as described above, stimulated with cGMP (50 μM) for 15 minutes, and then with either vehicle or bafilomycin A1 (BFA, 1 μM) (Sigma) for 3 hours. For in vivo studies, WT, SA/SA, and SE/SE mice received two injections of BFA (3 μM/kg, IP) 90 minutes apart. Myocardium was collected 90 minutes after the second injection, and protein extract examined by immunoblot for LC3-II. The relative increase in expression with versus without BFA indexes autophagic flux.
Protein Aggregation Assays
Protein aggregation was measured using Proteostat (Enzo #ENZ-51023) following manufacturer’s instructions. Ventricular myocardial lysate (Cell Signaling lysis buffer) was obtained, protein concentration assayed, and 10 μg protein loaded into a 96 well microplate and protein aggregates analyzed using the Proteostat® assay kit (Enzo Life Sciences) following manufacturer’s instructions. After background subtraction, values were normalized to WT sham.
For a second assay, 1 mmol/L phenylmethanesulfonyl fluoride and a phosSTOP™ tablet (Sigma-Aldrich/Roche) were added to myocardial lysates. This was centrifuged at 8,000g in 4°C for 10 minutes, supernatant (soluble fraction) extracted, and the pellet then resuspended in insoluble extraction buffer (40 mmol/L Tris HCl [pH 8.8], 1% SDS, 8% glycerol), boiled for 5 minutes, and re-centrifuged at 3,000g for 5 minutes. 2.5 μg of the supernatant (insoluble fraction) was filtered through nitrocellulose membrane (pore diameter, 0.22 μm, Millipore) using a dot-blot apparatus (BioRad), and immunoprobed for ubiquitin and α-tubulin.
Tandem fluorescent LC3 autophagic flux assay
NRCMs were infected with an adenovirus (10 MOI) expressing a tandem fluorescent (GFP-RFP) tagged LC315. This expresses LC3 with both green and red fluorescence as the autophagosomal membrane is forming; but upon merging with the acidic lysosome (autolysosome), the GFP signal is quenched, leaving RFP. The rise in RFP provides a marker of autophagic flux. In some studies, myocytes were further transfected with plasmid encoding for WT-TSC2, or SA or SE mutant TSC2, and further stimulated for 48 hours with endothelin 1 (10 nM). Dot counts for both colors/cell were determined using Image J software (Ver 1.52a, NIH).
In vitro protein kinase G activity
PKG activity was assessed by in vitro colorimetric assay (Cyclex, Cat #CY-1161, Nagano, Japan) following the manufacturer’s instructions. The assay provides cGMP substrate, and a kinase-specific peptide-target to assess phosphorylation activity.
Proteomic analysis of PKG phospho-kinome
Freshly isolated adult cardiac myocytes were obtained from male Wistar rats as described29, and divided into two aliquots, each relaxed in Tyrode buffer (140 mM NaCl, 5 mM KCL, 10 mM HEPES, 1 mM glucose, 1 mM MgCl2, 1 mM Ca2+, pH 7.45). Cells were then exposed to 1 mM 8-Br-cGMP or Tyrode solution for 10 minutes to stimulate intracellular PKG activity. Cells were then centrifuged for 1 minute at 1000g, the supernatant removed, and the pellet frozen in liquid nitrogen and stored at −80°C. Frozen samples (n=3/group) were then lysed in an 8M Urea, 0.5% SDS solution with brief sonication, and protein concentration determined by the BCA method. For each sample, 200 μg of total protein was digested with trypsin/Lys-C protease mixture (Promega), samples were desalted on 10 mg Oasis HLB cartridges (Waters) and eluted in 300 μL of 80% acetonitrile (ACN), 5% trifluoroacetic acid, 1 M glycolic acid and enriched by titanium dioxide (TiO2). Enriched peptides were desalted as above but eluted in 200 μL of 80% ACN, 0.1% formic acid (FA) and dried under vacuum. Dried peptides were re-suspended in 20 μL of 0.1% FA for LC-MS/MS analysis. Samples (4 μL) were injected in duplicate onto an EASY-nLC 1000 (mobile phase A was 0.1% FA in water and mobile phase B was 0.1 % FA in ACN) connected to a Q-Exactive Plus (Thermo) equipped with a nano-electrospray ion source. Raw MS/MS data was searched using the Sorcerer 2TM-SEQUEST® algorithm (Sage-N Research) using default peak extraction parameters. Post-search analysis was performed using Scaffold 4 (Proteome Software, Inc.) with protein and peptide probability thresholds set to 95% and 90%, respectively, and one peptide required for identification, and spectra manually validated. Phospho-site localization was determined using Scaffold PTM version 2.1.3 and phospho-sites had to have probabilities greater than 90%.
Detection of direct PKG phosphorylation of TSC2
These assays utilized a TSC2 KO HEK cell line generated in our laboratory. 1 million HEK293T cells were plated overnight in 6 well plate with antibiotics free DMEM supplemented with 10% FBS. The following day 4 μg of Custom Sanger CRISPR plasmid for TSC2 (All-in-one, ready-to-use Cas9 and guide RNA (U6gRNA-Cas9–2A-GFP) expression plasmid against target site GTCGCGGATCTGTTGCAGCCGG, #HS0000020001 Sigma) was transiently transfected using Lipofectamine 3000 (Invitrogen). The following day, media was replaced with DMEM supplemented with 10% FBS and 1% antibiotics, and day after GFP positive cells were FACS sorted to obtain TSC2 KO HEK293T cells and assessed for KO efficiency via immunoblotting. CRISPR TSC2 KO HEK cells were cultured in DMEM supplemented with 10% FBS and 1% antibiotics. For PKG-TSC2 kinase assays, TSC2 was re-introduced into KO HEK cells grown to 50–60% confluence using adenovirus expressing WT-FLAG or S1365A-FLAG TSC2, cultured for 24 hours, and protein isolated.
TSC2 WT or SA (either hsS1364A or hsS1365A)-TSC2 protein was expressed in TSC2 KO HEK cells delivered by plasmid or adenovirus, respectively, and then immunoprecipitated with FLAG or HA magnetic beads (Sigma). Immune complexes were washed three times in lysis buffer and then washed twice in kinase buffer (25 mM HEPES, 10 mM magnesium acetate, and 50 μM ATP) and incubated with 1 μg purified active PKG (Millipore) and 2 μCi [γ−32P]-ATP or 2 μCi [γ−33P]-ATP in 40 μl kinase buffer for 30 minutes at 30°C. The reactions were stopped by washing twice in kinase buffer and boiling in gel loading buffer. Samples were then resolved in a 7.5% TGX gel (Bio-Rad), transferred to a nitrocellulose membrane, and 33P incorporation detected by autoradiography.
We also used the method developed by the Shokat laboratory19 involving a genetically modified PKG (M438G) first reported and validated by the Rudnick lab18 that enlarges the ATP binding site so a bio-orthogonal sulfonated ATPγS (N6-benzyl-ATP) can preferentially bind. TSC2 KO HEKs were seeded into 10-cm plates, infected with FLAG-TSC2 or HA-TSC2, and lysates obtained 24 hrs later in cell signaling lysis buffer. A 200 μL kinase reaction consisted of 25 mM Tris, 10 mM MgCl2, 1 mM 8-CPT-cGMP, 0.4 mM ATP, 6 mM GTP, 1 mM ATP (N6 benzyl ATPγS), and 100 μL cell lysate30. Reactions further received 2 μg of WT or M438G PKG, or buffer to equal final volume. The reaction was carried out at 30o C for 1 hour, then quenched with 20 mM EDTA, and 5 mM p-nitrobenzyl mesylate to alkylate samples (1 hour rotating at room temperature). Immunoprecipitation was carried out (using either FLAG or HA coated beads) overnight at 4oC, samples eluted by boiling in sample buffer for 3 minutes, and the precipitate analyzed by immunoblot using a thiophosphate ester monoclonal Ab (Abcam).
Statistical Analysis
Data presentation format (e.g. mean, SD, SEM), number of experiments and biological independent samples, analysis including multiple comparisons test, and absolute p values for comparisons are provided for each figure panel in the corresponding legend. The majority of summary data are presented as Mean SEM, with a 1-way ANOVA and Tukey multiple comparisons test. Statistical analysis was performed using Graphpad Prism software (Ver. 7a, 2016).
Extended Data
Extended Data Figure 1: Both mTOR inhibition (everolimus) and PKG activation (sildenafil) similarly prevent pathological heart growth, dysfunction, hypertrophic gene expression, mTORC1 activation, and myocardial protein aggregation.
a)) Heart weight/tibia length (TL), lung weight/tibia length, cardiac ejection fraction (EF), mRNA expression for Nppa (A-type natriuretic peptide), Nppb (B-type natriuretic peptide), and Rcan1 (regulator of calcineurin 1), each gene normalized to Gapdh - from study of mice subjected to 6-wks of pressure-overload (PO) from trans-aortic constriction or to sham surgery, and PO mice further treated with vehicle, sildenafil (Sil, 200 mg/kg/day), or everolimus (Evl, 10 mg/kg/day) starting 1-week after PO surgery. Mean±SEM, n=6 biologically independent experiments, 1WANOVA with Tukey multiple comparisons test: †p≤ 6E-5 vs. other three groups, § p=1E-6 vs. Sham, p=0.007 vs PO+Sil, p=0.002 vs PO+Evl; # p=0.02, ‡ p<0.007, ¶ p=0.02 vs Sham; * p≤0.0005 vs all other groups. b,c) Summary analysis for immunoblots as displayed in Figure 1a and 1b. Data shown as mean±SEM; same 6 biologically independent experiments as in Panel a. 1WAVNOA, Tukey multiple comparisons test: †p<0.0001 vs. other three groups, # p<0.0003 vs Sham and PO, *p=0.002 vs Sham. d) Filter trap assay from myocardium obtained from same mouse experiment, with membranes probed for ubiquitin and α-tubulin. n=4 biologically independent experiments, Mean±SEM, 1WANOVA, Tukey multiple comparisons test, † p=1E-5 vs. other groups, #p=0.0002, ‡p=0.001 vs Sham.
Extended Data Figure 2: PKG activation enhances autophagic flux and this is required for anti-hypertrophic efficacy; and leads to TSC2 phosphorylation at S1364 (human; 1365 mouse; 1366 rat).
a)Immunoblot of LC3-II in neonatal rat cardiomyocytes (NRCMs) with and without BFA treatment to block autophagy by preventing lysosomal proteolysis. The relative increase in LC3-II expression without versus with BFA treatment indexes autophagic flux. An example blot is shown to the left, summary data to the right. n=4 biologically independent experiments; mean±SEM, 1-WANOVA, Tukey multiple comparisons test; p<0.0001 for interaction of +/− BFA and drug treatment; * p=3E-5 vs Vehicle, p<1E-6 vs other groups. b) Effect of siRNA gene knockdown of ATG5 (siATG5) versus scrambled control (siScr) on Nppb gene expression in NRCMs treated with ET1±Sil. n=6 biologically independent samples, mean±SEM, 1WANOVA and Tukey multiple comparisons test: † p<1E-6 vs. three groups in siScr, # p<1E-6 vs. Veh and Sil in siATG5 group. c) Mass-spectrometry identifies TSC2 rat: raS1366 (equivalent to human: hsS1364 and mouse: mmS1365) as a phosphorylation target of PKG. Adult rat ventricular myocytes were exposed to cGMP to stimulate PKG activity, and MS performed on three independent replicates. d) Summary of immunoblot experiment in Figure 1e-upper. Mouse embryonic fibroblasts treated with 8-bromo-cGMP +/− PKG-inhibitor DT3; n=6 biologically independent samples. mean±SEM, 1WANOVA with post hoc Tukey test: †p=0.00004 vs vehicle, ‡ p=0.0004 vs cGMP. e) Immunoblot for TSC2 (antibody recognizing C-terminus) in myocytes expressing native protein, or transduced with wild-type, SA, SE TSC2 mutants using plasmid vector transfection. Expression levels were similar with each plasmid at 2× the leven in non-transduced cells. n=4 biologically independent samples, mean±SEM, 1WANOVA with post hoc Tukey test #p=0.0004 vs Control.
Extended Data Figure 3: PKG is activated by endothelin-1 in myoyctes, and results in TSC2 phosphorylation detected by hsS1364-Ab in cells expressing WT but not huS1364A or huS1365A mutations. Direct PKG-TSC2 phosphorylation is confirmed using recombinant proteins ± SA mutations, and in cell lysates.
a) PKG activation in myocytes expressing WT, SA, or SE TSC2 and stimulated with endothelin-1 (ET1, 10 nM) versus vehicle for 48 hours. Mean±SD, n=18 biologically independent samples, unpaired Student’s 2-tailed t-test. b) PKG activation is independent of the form of TSC2 expressed; n=6 biologically independent samples, box/whisker and raw data plot; p=0.0004 for ET-1 effect, p>0.8 for group effect by 2-way ANOVA. c) Summary data for phospho/total S1364 TSC2 (human sequence) from ET1-stimulation experiment shown in Figure 1f. Mean±SEM, n=6 biologically independent samples from 3 experiments, 1WANOVA, Tukey multiple comparisons test, # p=0.003 vs SE, p=0.0003 vs SA. d) Antibody raised to mmS1365 (mouse) (equivalent to huS1364, human) shows increase TSC2 phosphorylation in myocytes transfected with WT TSC2 plasmid, but not cells expressing TSC2 SA or SE mutations at muS1366 (huS1365). The experiment is replicated x3, with n=6 biologically independent samples, Mean±SD. 1WANOVA, Tukey multiple comparisons test, # p=0.0002 vs SE, p=0.0007 vs SA. The results are identical to those using muS1365 (hsS1364) mutants, indicating that mutating either serine (SA or SE) prevents phosphorylation of the other and/or its detection by the phospho-antibody. e) Direct TSC2 phosphorylation by recombinant PKG1α detected by autoradiography on hsTSC2-FLAG (WT) and hsTSC2-FLAG-S1365A. Data replicated × 3; n=6 biologically independent samples, with identical results. The result is identical to that in Figure 1j with hsTSC2-HA-S1364A. f) Direct TSC2 phosphorylation by PKG1α in lysates from TSC2-KO HEK cells expressing WT or hsTSC2-HA-S1364A or hsTSC2-FLAG-S1365A, PKG1α M438G, and N6-Benzyl-ATPγS, and probed for thiophosphate ester. Top gel shows data with huS1364 mutated, lower with huS1365 mutated. The results are identical. n=6 biologically independent samples for each assay.
Extended Data Figure 4: TSC2 huS1364 or huS1365 mutated to glutamatic acid (SE) suppresses endothelin-1 stimulated myocyte hypertrophy and mTORC1 activation, whereas mutation to alanine (SA) amplifies both.
a) Nppb mRNA expression (pathological hypertrophy gene marker) in myocytes transfected with WT, SA, or SE TSC2 (huS1365 mutated), and then exposed to 48-hrs ET1 (to induce hypertrophy) or to vehicle (Veh). Activation of PKG by sildenafil (Sil) reduces ET1-stimulated Nppb in WT expressing cells, but not in cells expressing SA or SE TSC2 mutants. SE expression depresses Nppb rise with ET1 stimulation, whereas SA expression enhances it. These results are nearly identical to those shown in Figure 2A in which the huS1364 (first serine of the duplet) was mutated. This shows that genetic modulation of either serine results in the same biological modulation of ET1 stimultion on growth and mTORC1 activity. Mean±SEM, n=6 biologically independent experiments, 1WANOVA with Tukey multiple comparisons test. *p<1E-5 vs other WT groups; † p=0.001 vs SE, p<1E-6 vs WT+ET1, ‡ p<1E-6 vs SA, WT-ET1, SE+ET1. b) Summary analysis of immunoblots displayed in Figure 1b. Values are normalized to WT/Veh; Mean SEM, n=4 (LC3-II) or 6 (others) biologically independent experiments; 1WANOVA, Tukey multiple comparisons test: *p≤ 7E-6 vs Vehicle control; † p<1E-6 vs SE-ET1; ‡p<5E-6, #p=0.01 vs WT-ET1, c) Example immunoblots from the same experiment as in Panel a and b, showing changes in mTORC1 signaling proteins, p62, and LC3-II. ET1 stimulates phosphorylation of mTORC1 targets (p70S6K, 4EBP1, Ulk1) and increases LC3-II and p62–consistent with mTORC1 activation and enhanced autophagy. SE (huS1365E) reduces mTORC1 activation and p62, and increases LC3-II, whereas SA (huS1365A) does the opposite. This is identical to responses found using huS1364 mutants (Fig 2b, Extended Data panel 4b) confirming functional equivalency from either serine modification. Experiment replicated 2–4 times, providing n=4–8 biologically independent samples. d) Summary data for this experiment. Values normalized to WT/Veh; Mean±SEM, n=8 independent replicates for p70S6K and 4EBP1, n=6 for Ulk-1, and n=4 for p62 and LC3-II. 1-WANOVA with Tukey multiple comparisons test, *p≤1E-6 vs WT vehicle and SE-ET1, †p<1E-6 vs SA-ET1, §p=0.0001, ‡p=0.003, ¶p<1E-6 vs SA-ET1, #p=0.003 vs. SA-Veh.
Extended Data Figure 5: Effects of TSC2 SA and SE mutations on mTORC1 activation in response to phenylephrine; PKG activation of autophagy requires in part its phosphorylation of TSC2; and amplification of mTORC1 stimulation in cells expressing S1365A TSC2 mutation requires Rheb.
a) Neonatal rat myocytes expressing WT, SA, or SE TSC2 protein (huS1365 was modified) and exposed to vehicle or phenylephrine (PE, 100 mM) for 48 hours. Left: example immunoblot for phospho-p70S6K and total protein, Right: summary data, normalized to WT/PE-. Mean±SEM, n=6 biologically independent samples, Kruskal Wallis Test, Dunn’s multiple comparisons, *-p=0.003 vs corresponding vehicle; †: p=0.0013 vs SE-ET1. b) Upper: example immunoblots for LC3-II and p62 in lysates obtained from TSC2-KO MEFs transfected with either TSC2-WT or -SA plasmids (huS1364 modified) and then treated with ET1 (10 nM) ± cGMP (50 μM). n=3 biologically independent samples. Lower: Summary data, normalized to WT-TSC2, cGMP-/ET-; Mean±SEM, 1WANOVA, Tukey multiple comparisons test: *p≤1E-6 vs corresponding vehicle and SE+ET1, # p=0.0001 vs WT+Veh, p=0.001 vs SE+ET1, p=0.007 vs SA+ET1, †p=0.003 vs vehicle and ET1+cGMP, ‡ p=0.001 vs WT-ET1+cGMP. c) Summary results for Figure 2d. NRCMs transfected with Rheb or scrambled (Scr) siRNA, co-transfected with TSC2 WT, SE, or SA plasmids (huS1365 modified) and stimulated with ET1 for 48 hours. n=4 biologically independent experiments, Mean±SEM, values normalized to WT/Veh/Scr-siRNA; 1WANOVA, Tukey multiple comparisons test. *p=1E-6 vs Scr-siRNA/vehicle for WT and SA, #p=0.00002 vs siScr+ET1 for WT or SA.
Extended Data Figure 6: TSC2 S1365A KI mouse genotyping; expression of TSC2 ± pressure overload; and effect on pressure-overload stimulated hypertrophy fetal gene (Nppa), autophagy, and mTORC1 activation.
a) Mouse TSC2-S1365A KI Genotyping by PCR detects a unique sequence based on the mutated residue as a 206-base pair (BP) fragment. This signature was used for genotyping. b) Immunoblot of TSC2 protein from SA and WT (littermate controls) for sham and PO treated groups. There is no difference in expression levels among these groups or conditions. Repeated independently x3 with identical results. c) Nppa normalized to Gapdh mRNA expression in WT versus SA/SA myocardium before and after chronic PO. N=8 biologically independent experiments. Mean±SEM, 1WANOVA, Tukey multiple comparisons test: * p=2E-5 vs Sham, †p<1E-6 vs Sham, p=3E-6 vs WT-PO. d) Immunoblots of LC3 from TSC2 WT, SA/WT, and SA/SA myocardium from mice subjected to sham or PO and co-treated with vehicle (Veh) or Sildenafil (Sil). PO-stimulated LC3-II expression is lacking in SA/WT or SA/SA, but is recovered in SA/WT with Sil treatment. It increases further in WT+PO+Sil. Experiment replicated twice providing 4 biologically independent samples. Mean±SEM; data normalized to mean of WT-sham, 1-WANOVA, Tukey test for multiple comparisons; *p<1E-6 vs respective Sham and vs PO in other two groups, †p<1E-6 vs respective Sham and vs SA/SA PO+Sil, p=0.0013 vs SA/WT PO+Sil, ‡ p<1E-6 vs Sham and SA/SA PO+Sil. e) Summary data for immunoblots displayed in Figure 3e and 3f. n=4 biologically independent experiments, Mean±SEM, data normalized to mean of WT-sham; 1WANOVA, Tukey multiple comparisons test: *p<1E-6 vs respective Sham and PO+Sil; † p=0.0002 vs Sham, ‡ p<1E-6 vs Sham and WT+PO, # p<1E-6 vs WT and SA/WT PO+Sil.
Extended Data Figure 7: SA/SA KI mice display significantly increased mTORC1 but no change in mTORC2 activation; Depressed autophagy in SA/SA mice subjected to pressure overload is reversed by mTOR inhibition with everolimus.
a) Immunoblots and summary quantitation for mTORC2 targets from TSC2 WT and SA/SA mice subjected to sham or PO surgeries and treated with sildenafil or vehicle. n=4 biologically independent experiments, Box/whisker plots (median) with individual data shown; data normalized to mean of sham-WT. Analysis: 1WANOVA, Tukey multiple comparisons test. P70S6K is shown at top as an mTORC1 control, showing increased phosphorylation with PO that is greater and unresponsive to Sil in SA/SA mice; *p=0.002 vs Sham, †p=0.04 vs PO, ‡ p=0.03 vs Sham. However, there were no significant changes (p≥0.62 between conditions within genotype) in the expression of mTORC2 substrates: S473 p/t Akt, T24/T32 p/t FOXO1/3, and T346 p/t NRDG1. b) LC3-II expression is unaltered while p62 expression rises from PO in SA/SA myocardium, indicating suppression of autophagy. Both are reversed by co-treatment with mTORC1 inhibitor everolimus (Evl). n=6 biologically independent animal experiments, Mean±SEM, 1WANOVA, Tukey multiple comparisons test: *p≤3E-5 versus other two groups. Data are normalized to mean of sham control.
Extended Data Figure 8: Generation of TSC2 S1365E KI mice, and impact on pressure-overload induced mTORC1 activation, autophagy, and autophagic flux in vivo.
a) Strategy and guide RNA for CRISPR-Cas9 protocol to generate S1365E (SE) knock-in mice. b) Summary data for Figure 4f. p/t70S6K (n=6 biologically independent experiments), p62/tubulin and LC3-II/total protein (n=4 biologically independent experiments, Mean±SEM, values are normalized to WT-Sham), 2WANOVA with Sidak’s multiple comparisons test *p<1E-6 vs WT sham, and p=0.0012, 0.0001 for PO-SE/WT and PO-SE/SE, respectively, † p=0.0008 vs SE/WT sham, ‡p=0.001 vs SE/SE Sham; for p62: # P≤1E-6 vs all other groups, § p=0.018 and p=0.0003 vs PO-SE/WT and PO-SE/SE, respectively, ** p=0.02 vs PO-SE/SE and p=0.0002 vs Sham, ## p<1E-6 vs Sham. c) Example immunoblot and summary results for TSC2 WT, SE/SE, and SA/SA mice treated with bafilomycin A1 (BFA) or vehicle. Myocardium was assayed for LC3-II, with higher expression in the presence of BFA indicating greater autophagic flux. Summary data, values normalized to WT-vehicle, Mean±SEM, n=4 biologically independent experiments; 2WANOVA with Sidak’s multiple comparisons test: p<1E-6 for BFA effect, p=0.003 for TSC2 genotype effect, and p=0.002 for interaction; Within group comparisons show p=0.04 for greater increase in SE/SE vs WT, and p=0.0017 for reduced increase in SA/SA vs WT in presence of BFA.
Extended Data Table 1:
Cardiac morphometry and function in TSC2 S1365E (SE) and S1365A (SA) KI mice, versus respective age-matched littermate controls.
| Mice Aged 2–3 Months | ||||||||||
| TSC2 WT | n | TSC2S1365E | n | p-value | TSC2 WT | n | TSC2 S1365A | n | p-value | |
| Body Weight (g) | 25.0 ± 4.1 | 11 | 23.9 ± 2.9 | 13 | 0.60 | 22.5 ± 3.3 | 12 | 21.8 ± 2.4 | 13 | 0.60 |
| Heart Weight (mg) | 119.7 ± 23.6 | 6 | 113.6 ± 12.4 | 7 | 0.88 | 117.0 ± 24.7 | 5 | 114.9 ± 12.7 | 4 | 0.88 |
| Left Ventricular Weight (mg) | 84.7 ± 17.6 | 6 | 80.5 ± 9.8 | 7 | 0.44 | 81.2 ± 13.4 | 5 | 75.4 ± 4.8 | 4 | 0.44 |
| Lung Weight (mg) | 141.7 ± 14.5 | 6 | 128.3 ±13.0 | 7 | 0.72 | 133.4 ± 15.0 | 5 | 130.2 ± 10.8 | 4 | 0.72 |
| Tibial Length (mm) | 17.8 ± 0.8 | 6 | 17.6 ± 0.5 | 7 | 0.30 | 18.2 ± 0.8 | 5 | 17.8 ± 0.3 | 4 | 0.30 |
| HW/TL | 6.7 ± 1.1 | 6 | 6.4 ± 0.6 | 7 | 0.92 | 6.4 ± 1.1 | 5 | 6.5 ± 0.6 | 4 | 0.92 |
| LVW/TL | 4.7 ± 0.8 | 6 | 4.6 ± 0.5 | 7 | 0.57 | 4.5 ± 0.6 | 5 | 4.3 ± 0.3 | 4 | 0.57 |
| LuW/TL | 7.9 ± 0.6 | 6 | 7.3 ± 0.7 | 7 | 1.00 | 7.3 ± 0.7 | 5 | 7.3 ± 0.5 | 4 | 1.00 |
| Heart Rate (bpm) | 680.4 ± 56.6 | 11 | 690.0 ± 67.9 | 13 | 0.60 | 675.8 ± 21.4 | 12 | 683.2 ± 42.9 | 11 | 0.60 |
| %Ejection Fraction | 82.0 ± 1.5 | 11 | 83.4 ± 3.7 | 13 | 0.74 | 82.1 ± 1.6 | 12 | 81.8 ± 2.6 | 11 | 0.74 |
| %Fractional Shortening | 57.6 ± 3.0 | 11 | 59.5 ± 4.4 | 13 | 0.76 | 57.7 ± 1.9 | 12 | 57.4 ± 2.9 | 11 | 0.76 |
| Mice Aged 9–12 Months | ||||||||||
| TSC2 WT | n | TSC2S1365E | n | p-value | TSC2 WT | n | TSC2 S1365A | n | p-value | |
| Body Weight (g) | 30.2 ± 3.0 | 6 | 28.5 ± 3.5 | 7 | 0.37 | 29.6 ± 3.1 | 8 | 29.2 ± 4.2 | 7 | 0.37 |
| Heart Weight (mg) | 163.4 ±2 5.6 | 6 | 147.9 ± 26.3 | 7 | 0.31 | 159.5 ± 25.0 | 8 | 167.3 ± 32.2 | 7 | 0.31 |
| Left Ventricular Weight (mg) | 119.2 ± 23.1 | 6 | 109.3 ± 27.1 | 7 | 0.50 | 125.7 ± 25.6 | 8 | 134.8 ± 33.9 | 7 | 0.50 |
| Lung Weight (mg) | 149.2 ± 20.9 | 6 | 130.8 ± 17.4 | 7 | 0.11 | 141.4 ± 24.5 | 8 | 161.5 ± 37.5 | 7 | 0.11 |
| Tibial Length (mm) | 19.7 ± 1.4 | 6 | 19.6 ± 1.3 | 7 | 0.90 | 19.1 ± 1.1 | 8 | 19.1 ± 1.2 | 7 | 0.98 |
| HW/TL | 8.3 ± 0.85 | 6 | 7.5 ± 0.9 | 7 | 0.14 | 8.3 ± 0.9 | 8 | 8.7 ± 1.4 | 7 | 0.51 |
| LVW/TL | 6.0 ± 0.9 | 6 | 5.5 ± 1.0 | 7 | 0.37 | 6.5 ± 1.0 | 8 | 7.0 ± 1.6 | 7 | 0.50 |
| LuW/TL | 7.6 ± 0.7 | 6 | 6.7 ± 0.7 | 7 | 0.04 | 7.4 ± 0.9 | 8 | 8.4 ± 1.7 | 7 | 0.15 |
| Heart Rate (bpm) | 704.2 ± 37.5 | 6 | 693.6 ± 25.3 | 7 | 0.56 | 671.3 ±7 4.3 | 8 | 659.3 ± 86.4 | 7 | 0.56 |
| %Ejection Fraction | 77.2 ± 2.9 | 6 | 77.0 ± 2.7 | 7 | 0.90 | 80.8 ± 1.9 | 8 | 68.2 ± 24.6 | 7 | 0.90 |
| %Fractional Shortening | 52.3 ± 3.1 | 6 | 52.1 ±2.8 | 7 | 0.89 | 52.3 ± 2.2 | 8 | 46.5 ± 19.4 | 7 | 0.89 |
The upper table provides results for aged 2–3 month mice (age used in study), and lower table for 9–12 month aged mice. The results show negligible impact of the TSC2 KI mutations in the basal state at both ages. TL – tibia length, bpm – beats/minute. P values are for a two-sided unpaired Student’s t-test.
Supplementary Material
Acknowledgements:
Supported by National Institute of Health – National Heart Lung and Blood Institute grants: HL-135827, HL-119012, HL089297, T32-HL-07227 (DAK), HHSN268201000032C (JEVE, DAK), F31-HL134196 (KMK), F31-HL143905 (BLDE), American Heart Association Post-Doctoral Fellowships (MJR, DL, TN), Deutsche Forschungsgemeinschaft OE 688/1–1 (CUO), Fondation Leducq TransAtlantic Network of Excellence, and Abraham and Virginia Weiss Professorship (DAK). Erika J. Glazer Endowed Chair in Women’s Heart Health (JEVE) and Barbra Streisand Women’s Heart Center (JEVE). This work was supported by the NIH grants (R01AI077610 and R01AI091481) to JDP and the Bloomberg~Kimmel Institute for Cancer Immunotherapy to JDP. We thank Philip Eaton for providing the PKG WT, PKG C42S KI mice, and related plasmid constructs. We thank Dr. Junichi Sadoshima for providing the tandem fluorescent LC3 adenovirus, Brendan Manning for the DNA construct of wild type TSC2, and Jeremy T. Kass for assisting with protein kinase bioinformatics analyses.
Footnotes
Author Information
Any reagents developed for this study, including novel plasmids, viral vectors, and the TSC2 KI mouse models can be made available upon direct request to the corresponding author: David A. Kass, M.D., Johns Hopkins Medical Institutions, Ross Research Building 858, 720 Rutland Avenue, Baltimore MD 21205. The authors declare the following financial competing interests: David Kass, Jonathan Powell, Mark Ranek, Kristen Kokkonen-Simon, and Chirag Patel are co-inventors on a patent application (PCT: 448070145WO1) that was filed July 2018 (provisional filed June 2017). The patent relates to the use of TSC2-S1365/S1364 modifications for immunological applications. David Kass, Jonathan Powell, and Mark Ranek are co-founders and shareholders of Meta-T Cellular Inc., a start-up company that aims to develop applications of this IP for immune therapy.
Data Availability Statement
The authors declare that the data supporting the findings of this study are available within the paper and extended data file. Numerical values corresponding to figures detailing results from in vivo model studies are provided in a separate Source Data file for Figures 1F, 1G, 1H, 2A, 3D, 4C, 4E, and Extended Data 1A. Other source data related to the study are available from the Corresponding Author upon reasonable request.
REFERENCES
- 1.Saxton RA & Sabatini DM mTOR Signaling in Growth, Metabolism, and Disease. Cell 168, 960–976, doi: 10.1016/j.cell.2017.02.004 (2017). [DOI] [PMC free article] [PubMed] [Google Scholar]
- 2.Sciarretta S, Forte M, Frati G & Sadoshima J New Insights Into the Role of mTOR Signaling in the Cardiovascular System. Circ Res 122, 489–505, doi: 10.1161/circresaha.117.311147 (2018). [DOI] [PMC free article] [PubMed] [Google Scholar]
- 3.Zhang Y et al. Coordinated regulation of protein synthesis and degradation by mTORC1. Nature 513, 440–443, doi: 10.1038/nature13492 (2014). [DOI] [PMC free article] [PubMed] [Google Scholar]
- 4.Ma L, Chen Z, Erdjument-Bromage H, Tempst P & Pandolfi PP Phosphorylation and functional inactivation of TSC2 by Erk implications for tuberous sclerosis and cancer pathogenesis. Cell 121, 179–193, doi: 10.1016/j.cell.2005.02.031 (2005). [DOI] [PubMed] [Google Scholar]
- 5.Potter CJ, Pedraza LG & Xu T Akt regulates growth by directly phosphorylating Tsc2. Nat Cell Biol 4, 658–665, doi: 10.1038/ncb840 (2002). [DOI] [PubMed] [Google Scholar]
- 6.Roux PP, Ballif BA, Anjum R, Gygi SP & Blenis J Tumor-promoting phorbol esters and activated Ras inactivate the tuberous sclerosis tumor suppressor complex via p90 ribosomal S6 kinase. Proc Natl Acad Sci U S A 101, 13489–13494, doi: 10.1073/pnas.0405659101 (2004). [DOI] [PMC free article] [PubMed] [Google Scholar]
- 7.Menon S et al. Spatial control of the TSC complex integrates insulin and nutrient regulation of mTORC1 at the lysosome. Cell 156, 771–785, doi: 10.1016/j.cell.2013.11.049 (2014). [DOI] [PMC free article] [PubMed] [Google Scholar]
- 8.Inoki K, Zhu T & Guan KL TSC2 mediates cellular energy response to control cell growth and survival. Cell 115, 577–590 (2003). [DOI] [PubMed] [Google Scholar]
- 9.Inoki K et al. TSC2 integrates Wnt and energy signals via a coordinated phosphorylation by AMPK and GSK3 to regulate cell growth. Cell 126, 955–968, doi: 10.1016/j.cell.2006.06.055 (2006). [DOI] [PubMed] [Google Scholar]
- 10.Lee DI et al. Phosphodiesterase 9A controls nitric-oxide-independent cGMP and hypertrophic heart disease. Nature 519, 472–476, doi: 10.1038/nature14332 (2015). [DOI] [PMC free article] [PubMed] [Google Scholar]
- 11.Kim GE & Kass DA Cardiac Phosphodiesterases and Their Modulation for Treating Heart Disease. Handbook of experimental pharmacology 243, 249–269, doi: 10.1007/164_2016_82 (2017). [DOI] [PMC free article] [PubMed] [Google Scholar]
- 12.Takimoto E et al. Chronic inhibition of cyclic GMP phosphodiesterase 5A prevents and reverses cardiac hypertrophy. Nat. Med 11, 214–222 (2005). [DOI] [PubMed] [Google Scholar]
- 13.Kinoshita H et al. Inhibition of TRPC6 channel activity contributes to the antihypertrophic effects of natriuretic peptides-guanylyl cyclase-A signaling in the heart. Circ. Res 106, 1849–1860 (2010). [DOI] [PubMed] [Google Scholar]
- 14.Kim J, Kundu M, Viollet B & Guan KL AMPK and mTOR regulate autophagy through direct phosphorylation of Ulk1. Nature cell biology 13, 132–141, doi: 10.1038/ncb2152 (2011). [DOI] [PMC free article] [PubMed] [Google Scholar]
- 15.Hariharan N, Zhai P & Sadoshima J Oxidative stress stimulates autophagic flux during ischemia/reperfusion. Antioxid Redox Signal 14, 2179–2190, doi: 10.1089/ars.2010.3488 (2011). [DOI] [PMC free article] [PubMed] [Google Scholar]
- 16.Ballif BA et al. Quantitative phosphorylation profiling of the ERK/p90 ribosomal S6 kinase-signaling cassette and its targets, the tuberous sclerosis tumor suppressors. Proc Natl Acad Sci U S A 102, 667–672, doi: 10.1073/pnas.0409143102 (2005). [DOI] [PMC free article] [PubMed] [Google Scholar]
- 17.Mertins P et al. Proteogenomics connects somatic mutations to signalling in breast cancer. Nature 534, 55–62, doi: 10.1038/nature18003 (2016). [DOI] [PMC free article] [PubMed] [Google Scholar]
- 18.Wong A, Zhang YW, Jeschke GR, Turk BE & Rudnick G Cyclic GMP-dependent stimulation of serotonin transport does not involve direct transporter phosphorylation by cGMP-dependent protein kinase. J Biol Chem 287, 36051–36058, doi: 10.1074/jbc.M112.394726 (2012). [DOI] [PMC free article] [PubMed] [Google Scholar]
- 19.Allen JJ et al. A semisynthetic epitope for kinase substrates. Nature methods 4, 511–516, doi: 10.1038/nmeth1048 (2007). [DOI] [PMC free article] [PubMed] [Google Scholar]
- 20.Taneike M et al. mTOR Hyperactivation by Ablation of Tuberous Sclerosis Complex 2 in the Mouse Heart Induces Cardiac Dysfunction with the Increased Number of Small Mitochondria Mediated through the Down-Regulation of Autophagy. PloS one 11, e0152628, doi: 10.1371/journal.pone.0152628 (2016). [DOI] [PMC free article] [PubMed] [Google Scholar]
- 21.Zhang D et al. MTORC1 regulates cardiac function and myocyte survival through 4E-BP1 inhibition in mice. J Clin Invest 120, 2805–2816, doi: 10.1172/jci43008 (2010). [DOI] [PMC free article] [PubMed] [Google Scholar]
- 22.Shende P et al. Cardiac raptor ablation impairs adaptive hypertrophy, alters metabolic gene expression, and causes heart failure in mice. Circulation 123, 1073–1082, doi: 10.1161/circulationaha.110.977066 (2011). [DOI] [PubMed] [Google Scholar]
- 23.Moschella PC, Rao VU, McDermott PJ & Kuppuswamy D Regulation of mTOR and S6K1 activation by the nPKC isoforms, PKCepsilon and PKCdelta, in adult cardiac muscle cells. J Mol Cell Cardiol 43, 754–766, doi: 10.1016/j.yjmcc.2007.09.015 (2007). [DOI] [PMC free article] [PubMed] [Google Scholar]
- 24.Fonseca BD et al. Pharmacological and genetic evaluation of proposed roles of mitogen-activated protein kinase/extracellular signal-regulated kinase kinase (MEK), extracellular signal-regulated kinase (ERK), and p90(RSK) in the control of mTORC1 protein signaling by phorbol esters. J Biol Chem 286, 27111–27122, doi: 10.1074/jbc.M111.260794 (2011). [DOI] [PMC free article] [PubMed] [Google Scholar]
- 25.Ranganathan V, Wahlin K, Maruotti J & Zack DJ Expansion of the CRISPR-Cas9 genome targeting space through the use of H1 promoter-expressed guide RNAs. Nature communications 5, 4516, doi: 10.1038/ncomms5516 (2014). [DOI] [PMC free article] [PubMed] [Google Scholar]
- 26.Ran FA et al. Genome engineering using the CRISPR-Cas9 system. Nat Protoc 8, 2281–2308, doi: 10.1038/nprot.2013.143 (2013). [DOI] [PMC free article] [PubMed] [Google Scholar]
- 27.Takimoto E et al. Chronic inhibition of cyclic GMP phosphodiesterase 5A prevents and reverses cardiac hypertrophy. Nat Med 11, 214–222, doi: 10.1038/nm1175 (2005). [DOI] [PubMed] [Google Scholar]
- 28.Zhang H et al. Loss of Tsc1/Tsc2 activates mTOR and disrupts PI3K-Akt signaling through downregulation of PDGFR. J Clin Invest 112, 1223–1233, doi: 10.1172/JCI17222 (2003). [DOI] [PMC free article] [PubMed] [Google Scholar]
- 29.Nakamura T et al. Prevention of PKG1alpha oxidation augments cardioprotection in the stressed heart. J Clin Invest 125, 2468–2472, doi: 10.1172/JCI80275 (2015). [DOI] [PMC free article] [PubMed] [Google Scholar]
- 30.Scotcher J et al. Disulfide-activated protein kinase G Ialpha regulates cardiac diastolic relaxation and fine-tunes the Frank-Starling response. Nature communications 7, 13187, doi: 10.1038/ncomms13187 (2016). [DOI] [PMC free article] [PubMed] [Google Scholar]
Associated Data
This section collects any data citations, data availability statements, or supplementary materials included in this article.


