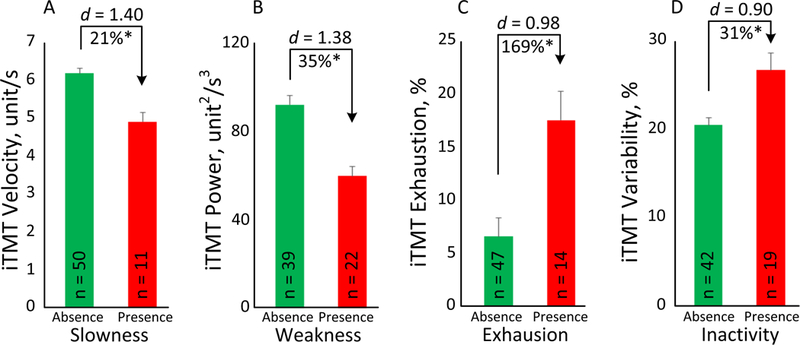
Figure 3.

The iTMT derived parameters enabled significant discrimination between the presence and absence of each frailty phenotype as determined by the Fried Frailty Criteria, including slowness (Fig. 3A), weakness (Fig. 3B), exhaustion (Fig. 3C), and inactivity (Fig. 3D).Error bars represent the standard errors. ‘n’ denotes number of subjects per group. ‘*’ denotes when the between group comparison achieved a statistically significant level (p<0.050).
