

Abstract
It is well established clinically that rhythmic auditory cues can improve gait and other motor behaviors in Parkinson’s disease (PD) and other disorders. However, the neural systems underlying this therapeutic effect are largely unknown. To investigate this question we scanned people with PD and age-matched healthy controls using functional magnetic resonance imaging (fMRI). All subjects performed a rhythmic motor behavior (right hand finger tapping) with and without simultaneous auditory rhythmic cues at two different speeds (1 Hz and 4 Hz). We used spatial independent component analysis (ICA) and regression to identify task-related functional connectivity networks and assessed differences between groups in intra- and inter-network connectivity. Overall, the control group showed greater intra-network connectivity in perceptual and motor related networks during motor tapping both with and without rhythmic cues. The PD group showed greater inter-network connectivity between the auditory network and the executive control network, and between the executive control network and the motor/cerebellar network associated with the motor task performance. We interpret our results as indicating that the temporal rhythmic auditory information may assist compensatory mechanisms through network-level effects, reflected in increased interaction between auditory and executive networks that in turn modulate activity in cortico-cerebellar networks.
Keywords: synchronization, entrainment, basal ganglia, beat, music therapy
Graphical Abstract
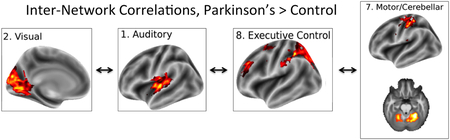
Greater inter-network correlations during motor tapping in a Rhythmic Auditory Stimulation paradigm in subjects with Parkinson’s disease compared with controls.
Auditory rhythm, the repetitive structure of sounds across time, can serve to synchronize motor networks. Synchronization is thought to occur via motor entrainment, a temporal locking process in which one system’s motion or signal frequency induces another system to take on a related frequency (Thaut 2015). This basic science phenomenon led to the use of auditory rhythm to retrain motor function in disorders of movement via the clinical technique of Rhythmic Auditory Stimulation (RAS; Thaut & Abiru, 2010), especially in Parkinson’s disease, the second most common neurodegenerative illness affecting 1–2% of adults over age 65 (Dorsey et al., 2007). In original key studies by Thaut et al. (1996) and Miller et al. (1996), PD patients utilizing RAS in 3-week home-based training studies showed significant improvements in velocity, stride length, cadence, and reduction in EMG variability of gastrocnemius and anterior tibialis muscles, and additional studies showed that these improvements were maintained for approximately 4 weeks after training (McIntosh et al., 1998). The effects of RAS are not dependent on dopaminergic medication: McIntosh et al., (1997) found that PD patients off medication were able to synchronize their step patterns to RAS, resulting in increased gait velocity, stride length, and step cadence rates. Positive effects of RAS are not limited to gait, and instead appear to reflect a general effect on all aspects of motor coordination; positive effects have been found for arm movements and upper limb coordination when compared to uncued movement (Bernatzky et al., 2004, Georgiou et al., 1993, Ma et al., 2009, Vercruysee et al., 2012). Anatomical and functional connectivity and transmission routes exist between auditory and motor areas at all levels of the motor hierarchy (Thaut et al., 2014), but it is still unknown which neural systems underlay the effects of RAS on motor functioning in PD (Nombela et al., 2013; Thaut 2015).
Rhythm is a composite term consisting of multiple timing components, such as pulse, beat, meter, durations, and complex time patterns whose perception activates common as well as distinct neural networks (Thaut et al., 2014). However, the primary feature of rhythm that is typically the focus of entrainment is the beat, or fundamental period of the repeated stimuli. Rhythm processing and entrainment are tightly intertwined; neural resonance theory hypothesizes that the perception of a beat is in itself a result of entrainment (Tierney & Kraus, 2015). Psychophysical studies have shown that motor entrainment to auditory rhythm is almost instantaneous without necessary learning periods (Thaut et al., 2002; Thaut et al., 1998; Stephan et al., 2002).
We hypothesize that the effects of RAS are likely achieved through interaction of auditory cortex with one or more of the main three neural systems controlling motor performance: the corticostriatal system, the corticocerebellar system, or the premotor-primary sensorimotor cortical system. Our first hypothesis is that RAS affects the basal ganglia and its interactions within the corticostriatal system. Parkinson’s disease is primarily thought to affect the corticostriatal system, which becomes dysregulated due to depletion of tonic dopaminergic input from the substantia nigra. The corticostriatal system selectively inhibits or excites cortical representations, which in the motor domain allows for inhibition of unwanted movements and selection for execution of desired movements (Braunlich & Seger, 2013). Anatomically, the striatum receives direct projections from auditory cortical regions (Seger, 2013), which could support auditory entrainment and the effects of RAS. A meta-analysis of studies on healthy adults found that the putamen was equally active in both external and internal pacing conditions whereas the globus pallidus (a basal ganglia output nucleus) was more active for internal than external pacing cues (Chauvigné et al., 2014). Subjects with basal ganglia lesions show greater heterogeneity in internally generated beat production (Schwartze et al., 2012; Nozaradan et al., 2017). Parkinson’s disease is characterized by timing variability with increased tapping rates during internally paced performance (Freeman et al., 1993; Georgiou et al., 1993; O’Boyle et al., 1998). These findings implicating the basal ganglia in internally generated rhythm production imply that RAS may compensate for an impaired internal timing mechanism by providing an external timing signal.
The second hypothesis is that RAS may have its effects via the cerebellum, helping to compensate for lack of normal corticostriatal functioning (Martinu and Monchi, 2013). The cerebellum receives direct projections from auditory cortical regions which could provide an anatomical basis for RAS to affect cerebellar activity (Bostan et al., 2013). Previous research has indicated a role of the cerebellum as well as basal ganglia in rhythm processing, raising the possibility that one system may be able to compensate for dysfunction in the other. A metanalysis of studies on healthy adults found that the cerebellum was more active during entrainment (external > pacing; Chauvigné et al., 2014). Patients with cerebellar damage can detect beats (Molinari et al., 2005; Grube et al., 2010), but are impaired at tracking fast tempos (Nozaradan et al., 2017). Schwartze et al (2012) proposed that both basal ganglia and cerebellum are involved in temporal prediction, with the cerebellum having a role in automatic encoding with high temporal precision, and the basal ganglia a role in attentional encoding and longer intervals.
Finally, RAS may act through cortical systems, by directly or indirectly affecting interactions within and between auditory, premotor, and primary motor cortical regions. Cortical motor systems are active during perception of auditory rhythm in the absence of overt movement (Grahn, 2009; Kung et al., 2013; Chen et al., 2008). A number of studies have reported increased functional connectivity between auditory and dorsal premotor cortexes during tapping and beat perception tasks (Chen et al., 2006; Chen et al., 2008; Grahn and Rowe, 2009). Giovanelli et al (2014) provided causal convergent evidence for the importance of dorsal premotor cortex by showing that perturbation of this region with transcranial magnetic stimulation impaired motor synchronization to an auditory beat.
In the present study we examined the effects of RAS in PD and healthy controls by examining neural activity during a motor finger tapping task, both with and without simultaneous rhythmic auditory stimulation. Tapping was chosen for the motor response because it can be practically performed in the scanning environment, has been widely studied in basic research, and depends on the same fundamental neural mechanisms as more complex motor behaviors (Repp & Su, 2013). Two different tapping speeds were used: 1 and 4 Hz, resulting in inter-tap intervals of 1000 and 250 ms respectively. Studies have shown that synchronization processes both to a metronome and to music are flexible with a lower bound typically below 200 ms, which is due to limitations of the motor effector, and upper bound gradually decreasing in accuracy after 1800 ms ( Repp, 2005; Repp & Su, 2013; Thaut et al., 1998). We used Independent Component Analysis (ICA) along with regression to identify functionally connected neural networks that were modulated by task and patient status (Calhoun et al., 2001; Meda et al., 2009). We hypothesized that the presence of RAS would improve motor tapping accuracy. We further hypothesized that RAS would differentially affect functional connectivity within and/or between one or more of the neural networks that have been shown to be involved in auditory entrainment: corticostriatal, corticocerebellar, or cortical networks, and that these changes in connectivity would differ across PD and control subjects.
Materials and Methods
Subjects:
Subjects included 15 adults diagnosed with PD and 14 healthy adult controls. All subjects indicated that they were right handed and were fluent speakers of English. PD subjects had an average age of 65.9 (range: 51–81, 10 male, 5 female). Controls had an average age of 65.0 (range: 51–78; 6 male, 8 female). PD subjects met United Kingdom Brain Bank criteria for probable Parkinson’s disease (Hughes et al., 1992). All PD subjects were taking dopamine replacement medication and were tested during their ON medication state. Exclusions for all subjects included: neurological or psychiatric disorder (other than Parkinson’s disease for the PD group), history of alcoholism or substance abuse, currently taking psychoactive medication, presence of metal in the body incompatible with MR scanning safety requirements, hearing loss, and claustrophobia. The study was approved by the Medical Institutional Review Board at Colorado State University and conformed to the World Medical Association Declaration of Helsinki. All subjects provided written informed consent. Subjects received monetary compensation for their participation.
Task:
Subjects performed four tapping tasks at two different speeds (fast, 4Hz, and slow, 1Hz) and with or without simultaneous rhythmic auditory stimulation (RAS), resulting in a 2 × 2 design: Presence of RAS (present, absent) x Rate (1 Hz, 4 Hz). Each task was performed in a 16 s block preceded by a 2 s Instruction cue and followed by a 14 s intertrial interval during which a fixation cross was presented. Subjects performed 15 cycles of each of the 4 tasks; within each cycle, the order was always No RAS - Slow, No RAS - Fast, RAS - Slow, RAS – Fast. A set order of tasks within each cycle was utilized rather than randomization in order to maximize the statistical power to detect differences between the tasks. During the Instruction cue phase one of the static visual displays shown in Figure 1 was shown, while the words “Ready”, “Set” were displayed consecutively for 1 s each above the visual display. The task block began with the simultaneous onset of auditory stimulation and presentation of the word “Tap!!” above the visual display. Subjects tapped with the index finger of their right hand on a magnet-compatible response box. In the RAS conditions the auditory stimulation continued through the entire block. In the non-RAS conditions, stimulation was present for only the first 2 s of the block, and subjects were required to continue tapping at the indicated speed through the remaining 14 s without auditory stimulation. Auditory stimulation consisted of simultaneous alternating pure tones (sampling rate: 44100 Hz, duration: 100 ms), one at 300hz, and the other at 400 Hz. The end of the block was indicated by cessation of the auditory stimulation in the RAS condition, and switching the displayed image from the visual cue to the fixation cross in all conditions. Subjects were instructed that they should stop tapping at that point and rest. During MR scanning, tasks were grouped into three runs of 5 cycles containing a block of each of the four tasks, with the runs separated by short breaks (less than 1 minute each). This resulted in a total of 15 blocks of each of the 4 tasks.
Figure 1:

Static visual displays accompanying each of the four the task conditions. Each display was presented at the beginning of the block and remained on the screen throughout the block without change. These visual displays were intended to orient the participants to the task; individual taps were cued only via auditory stimulation, not concurrent visual stimulation. In the Rhythmic Auditory Stimulation conditions (RAS), auditory stimulation continued throughout the 16 s block, as indicated by the red vertical cues that extend across the length of the green line. In the no-RAS conditions auditory stimulation was present only for the first 2 s and subjects were required to continue tapping at the indicated speed throughout the block. In the Fast conditions, subjects tapped at a rate of 4Hz; Slow conditions at a rate of 1 Hz.
MRI data acquisition:
Images were acquired on a research-dedicated whole-body 3-Tesla Siemens MRI scanner with 32-channel parallel imaging at the Intermountain Neuroimaging Consortium, Boulder, Colorado during a single 50 minute scanning session including anatomical imaging and three functional runs of the behavioral tasks. High resolution anatomical images were acquired with a T1-weighted 3D magnetization prepared rapid gradient multi-echo sequence (MPRAGE; sagittal plane; repetition time [TR] = 2530 ms; echo times [TE] = 1.64 ms, 3.5 ms, 5.36 ms, 7.22 ms, 9.08 ms; GRAPPA parallel imaging factor 2; FOV = 256mm; flip angle = 7°; 192 interleaved 1mm slices) covering the whole brain in 6:03 minutes. Functional images were acquired with a 2-dimensional echoplanar sequence (ep2d; anterior commissure – posterior commissure plane; TR = 2000 ms; TE = 29 ms; GRAPPA parallel imaging factor 2; FOV = 220 mm; flip angle = 50°; 36 interleaved 3 mm slices). Subjects performed three functional runs each lasting 10:34 min separated by brief (approximately 1 minute) breaks. During each functional run, subjects completed 5 blocks of each of the four tasks.
FMRI preprocessing and data analysis:
Preprocessing was performed using Statistical Parametric Mapping version 12 (SPM; http://www.fil.ion.ucl.ac.uk/spm/) software and included the following steps: (1) three dimensional motion correction (2) slice scan time correction (3) temporal data filtering with a high-pass filter of three cycles in the time course to correct for signal drift. To allow for group analyses, each subject’s high-resolution anatomical image was normalized to the MNI brain template, and the resulting transformations applied to the functional data. Normalized functional data was smoothed using a Gaussian kernel, 6.0 mm full width at half maximum.
Group Independent Component Analysis (ICA; Calhoun et al., 2001), using the GIFT toolbox for MATLAB (http://icatb.sourceforge.net) was used to identify 30 independent components (ICs, or “brain networks”), and their associated time-courses in a data-driven fashion. For each participant, this involved removing the mean for each time-point, performing PCA to reduce dimensionality, and then implementing the Infomax algorithm (Bell & Sejnowski, 1995). Back-reconstruction of the subject spatial maps and timecourses was implemented using the GICA algorithm (Calhoun et al. 2001) and converted to z-scores. ICASSO (Himberg et al., 2004) (50 iterations, each with a random start location) was used to assess the stability of components. ICs associated with white matter or cerebrospinal fluid were removed through visual inspection. We tested the voxel-wise significance of each IC using single-sample t-tests in SPM. Of the remaining ICs, a subset was identified as showing activity patterns related to the behavioral task through regression (Meda et al., 2009), and only these ICs were retained for subsequent analyses. Briefly, this method involves convolving the experimental paradigm with the canonical hemodynamic response function (HRF), and then investigating the correlation between the timecourse of each IC, and specific contrasts of the convolved design matrix (e.g., Fast-Tapping > Implicit Baseline). The beta coefficients from this analysis, therefore, provide information about how each component is modulated by the experimental paradigm. To investigate patterns shared across both groups, t-tests were used to investigate specific contrasts across regressors (e.g., Fast-Tapping > Slow-Tapping). Similarly, t-tests were used to investigate differences between groups (e.g., Patients > Controls) for specific contrasts across regressors (e.g., Fast-Tapping > Slow-Tapping).
Relationships between networks were investigated using Functional Network Connectivity analysis (FNC; Jafri et al, 2008), using the FNC toolbox (http://mialab.mrn.org/software/fnc). To account for regional differences in the temporal dynamics of the BOLD signal, the lag between the (upsampled) component timecourses was allowed to vary +- 3 seconds, and the alignment that maximized the unsigned correlation between components was chosen. P-values were calculated by shuffling subject data between groups (5000 times), and comparing the true differences between groups to those associated with this empirically estimated null distribution. The false discovery rate was used to correct for multiple comparisons (corrected p < 0.05; Benjamini & Hochberg, 1995).
Results
A total of 29 subjects (15 PD patients and 14 healthy controls) were included in the neuroimaging analyses. Behavioral data from one patient (male, age 80) and one control (female, age 62) were excluded due to communication problems with the response box, resulting in data from 27 participants considered for behavioral analyses.
Behavior
Behavioral performance was measured in terms of temporal error of tapping, which was calculated as the difference in the onset of each tap and the onset of the tone. In the No-RAS condition, this measure was calculated with regards to when the tone would have been presented. The initial tap within each block, as well as taps following long pauses or freezing, were excluded from the primary analyses. Behavioral freezing was assessed as latency to begin tapping at the beginning of the block, and presence of large pauses during blocks.
Signed Error.
Signed error was calculated as the difference in timing between the tap and the onset of the stimulus tone. A 2 × 2 repeated measures Analysis of Variance (ANOVA), which included a between-participant factor for Patients vs. Controls, was used to investigate effects of tapping rate (fast vs. slow) and presence of RAS (RAS vs. No-RAS). The effect of tapping speed was significant (F (1,25) = 9.39, p = 0.005, η² =0.26) such that participants tended to respond earlier in the slow-tapping condition (M = 0.05 seconds before the tone, SD = 0.06) than in the fast tapping condition (M = 0.008 seconds before the tone, SD = 0.26). The effect of RAS was significant F (1,25) = 39.95, p < 0.001, η² = 0.61) such that participants tended to respond earlier in the RAS Condition (M = 0.05 sec. before the tone, SD = 0.03) than the No-RAS condition (M = 0.005 sec. before the tone, SD = 0.05). The interaction between the RAS and rate factors was significant (F(1,25) = 20.82, p < .001, η² = 0.45), such that in the slow condition, the difference between the RAS (M = 0.08 sec. before the tone, SD = 0.05) and the No-RAS conditions (M=0.009 sec. before the tone, SD=0.09) was greater than in the fast condition (M(RAS) = 0.014 sec. before the tone, SD(RAS) = 0.018; M(No-RAS) = 0.002 sec. before the tone, SD(No-RAS) = 0.007). There were no significant differences in signed tapping error between groups (F(1,25) = 0.84, p = 0.37). The two- and three-way interactions with group (i.e., Patients vs. Controls) were not significant.
Variance.
To investigate variability in tapping time, the standard deviation of the signed error for each condition was calculated for each participant. As above (signed error analysis), a 2 × 2 repeated measures ANOVA, which included a between-participants factor for Patients vs. Controls, was used to investigate effects associated with RAS and tapping speed. The effect of RAS was significant (F(1,25) = 155.32, p < 0.001, η² = 0.86) such that participants tended to display less variability in tapping time in the RAS condition (M = 0.22, SD = 0.2), than the No-RAS condition (M = 0.26, SD = 0.2). The effect of tapping speed was significant (F(1,25) = 153.57, p < 0.001 η² = 0.86). such that participants tended to display less variability in the fast tapping condition (M= 0.2, SD = 0.2) than in the slow-tapping condition (M= 0.28 , SD = 0.2). The interaction between the RAS and rate factors was significant (F(1,25) = 71.44, p < 0.001 , η² = 0.74), such that in the slow condition, the difference between the RAS (M = 0.08 sec., SD = 0.03) and No-RAS (M = 0.22 sec., SD = 0.06) conditions was greater than in the fast condition (M(RAS) = 0.05 sec., SD(RAS) = 0.02; M(No-RAS) = 0.07 sec., SD(No-RAS) = 0.005). There were no significant differences in the main effect of tapping variance between groups (F(1,25) = 0.11, p = 0.74). The interaction between RAS and group was not significant (F(1,25) = 0.48 , p = 0.5). The interaction between the rate and group factors was not significant (F(1,25) = 0.61, p = 0.44). The three-way interaction between the RAS, rate and group factors was also not significant (F(1,25) = 042, p = 0.53).
Freezing.
Patients (M(patients) = 2.026 s, SD(patients) = 1.262) tended to be slower to begin tapping after the “Tap!” cue than Controls (M(healthy)= 0.38 s, SD(healthy)= 0.322; t (25) = 4.38, p < 0.001, d = 1.69). Patients also showed significantly more variability in the timing of their first tap than Controls (t(25) = 5.07, p < 0.001, d = 1.95).
In addition, patients occasionally displayed long pauses between taps within blocks, consistent with behavioral freezing. To investigate this effect, freezes were identified as periods in which the inter-tap interval exceeded 4 seconds (results were qualitatively similar when criteria of 3 and 5 seconds were used). The number of taps in which this criterion was exceeded was then compared across groups and conditions using repeated measures ANOVA. As above, this included a between-participant factor for Patients vs. Controls, and within-participant factors for tapping rate (fast vs. slow) and presence of RAS (RAS vs. No-RAS). There was no significant main effect of RAS on freezing (F(1,25) = 2.583, p = 0.12). The interaction between RAS and group was also not significant (F(1,25) = 0.92, p = 0.348). The effect of tapping speed was significant (F(1,25) =7.752, p = 0.01, η² =0.2), such that there was more freezing during slow tapping (M = 3.89, SD=5.21) than fast tapping (M = 1.98, SD = 3.43). The interaction between tapping speed and group was also significant, F (1,25) = 6.51, p = 0.017, η² = 0.17, such that the difference between fast and slow tapping was larger for patients (M = 3.54 taps) than for the healthy participants (M = 0.15). The main effect of group was also significant, F(1,25) = 26.04, p < 0.001, η² = 0.51. Patients (M = 5.59, SD = 4.93) tended to display more freezing than Controls (M < 0.08, SD < 0.33). The 3-way interaction between tapping speed, RAS and group was also significant (F(1,25) = 8.86, p = 0.006, η² = 0.23).
As control patients rarely “froze”, we conducted an additional 2 × 2 repeated-measures ANOVA in which we considered only Patients. The main effect of RAS was not significant (F(1,13) = 5.16, p = 0.2). However, the effect of tapping speed was significant (F(1,13) = 7.72, p = 0.016, η² =0.37). The interaction between RAS and tapping speed was also significant (F(1,13) = 7.59, p = 0.016, η² =0.37), such that patients showed a beneficial effect of RAS for the fast tapping condition (on average freezing 1.64 fewer times with RAS than without it; SD = 2.06, t(13) = 2.98, p(Holm-Bonferroni) = 0.047, d = 0.43) , but not for the slow tapping condition (t(13) = −0.69, p(Holm-Bonferroni) = 0.5, d = - 0.08).
FMRI Results
Task-Related Network Identification.
Using the ICA plus regression procedure described in Methods, eight components were identified that were sensitive to the tapping task. We assigned names for the components to make it easier to refer to them and to relate to other studies; however, the reader should be mindful that these networks were identified in a data-driven fashion and thus are not necessarily limited to functions associated with the name, and are based on the strongest correlations and thus may mask weaker but nevertheless important connectivity patterns. These components are illustrated in Figure 2. Component 1, “Auditory”, extended across bilateral auditory cortex. Component 2, “Visual”, included much of the occipital cortex along with medial occipital and temporal regions including the parahippocampal and lingual gyri. Component 3, “Executive Cerebellar”, encompassed the lateral cerebellar lobules and inferior cerebellum, regions typically associated with cognitive cerebellar functions (Stoodley et al., 2016), in contrast to the hand-related motor region of the cerebellum included in Component 7. Component 4, “Salience”, included regions that have been associated in resting state fcMRI studies with the salience or ventral attention network: bilateral inferior frontal / anterior insula cortex, the bilateral middle cingulate, and the supramarginal gyrus (Yeo et al, 2011). Component 5, “Motor/IFG”, extended across both the bilateral lateral sensorimotor cortex and the bilateral inferior frontal cortex. The areas of sensorimotor cortex in this component are related to the face and tongue (Yeo et al., 2011), and are anatomically inferior and lateral to the sensorimotor cortical regions included in Component 7. Component 6 “Basal Ganglia/Thalamus” included the bilateral striatum (both caudate and putamen) along with the thalamus. Component 7, “Motor/Cerebellar”, included the left motor somatosensory cortex in the hand region (consistent with right hand responses; Wu et al., 2015) and regions of the motor cerebellum overlapping the hand-related regions identified by Buckner et al. (2011). Component 8, “Executive Control”, included bilateral lateral prefrontal, inferior parietal, and medial frontal areas that resting state fMRI studies have associated with executive control networks, in addition to posterior parietal activity associated with the dorsal attention network (Yeo et al, 2011).
Figure 2:

Eight task-modulated components identified via Spatial Group ICA that were retained for subsequent network-level analyses. For each spatial map, the familywise error rate was controlled at the voxel level (p < 0.05).
Task Differences in Task-Related Network Modulation.
We first examined task differences collapsed across both groups of subjects. As shown in Table 1, the auditory IC showed greater activation for the contrast of RAS > No-RAS collapsed across speed. Five of the ICs (auditory, executive cerebellar, salience, motor/IFG, and motor/cerebellar) showed greater activation for Fast tapping than Slow tapping, collapsed across presence of RAS. No networks showed greater activation for Slow than for Fast tapping, or for No-RAS than for RAS.
Table 1:
Task Differences in Task-Modulated Networks
| Contrast | Component (#) | t(28) | p | p(fdr) |
|---|---|---|---|---|
| RAS > No-RAS | ||||
| Auditory (1) | 16.974 | < 0.001 | < 0.001 | |
| Fast > Slow | ||||
| Auditory (1) | 7.148 | < 0.001 | < 0.001 | |
| Executive Cerebellar (3) | 2.623 | < 0.001 | 0.014 | |
| Salience (4) | 3.636 | < 0.001 | 0.001 | |
| Motor/IFG (5) | 3.279 | 0.001 | 0.002 | |
| Motor/Cerebellar (7) | 9.097 | < 0.001 | < 0.001 |
Note: Components are illustrated in Figure 2.
Group Differences in Task-Related Network Modulation.
As shown in Table 2, during all four tapping tasks (compared with implicit baseline), the time course of the auditory IC was more strongly associated with the reference (i.e., model) time course for Controls than Patients. We investigated effects associated with speed and RAS separately by collapsing across the other condition. During Slow tapping, the auditory, salience, motor/IFG, basal ganglia/thalamus, and motor/cerebellar ICs were more strongly modulated (i.e., showed greater intra-network connectivity) for Controls than for the PD group. With RAS, the auditory IC was also more strongly associated with the reference (model) time course in Controls than PD. No components significantly differed between groups during the No-RAS or Fast tapping conditions. The results indicate that within-network correlations were overall more strongly modulated by task conditions for Controls than for the PD group, which is consistent with studies that have found lower within network connectivity and decreased modular integrity in PD during the resting state (Ma et al., 2017; Zhang, Wang, et al., 2015).
Table 2:
Group Differences in Task-Modulated Networks
| Task Contrast | Group Contrast |
Component # | t(27) | p | pFDR |
|---|---|---|---|---|---|
| All tasks > Implicit Baseline | |||||
| C > PD | Auditory | 3.437 | 0.002 | 0.033 | |
| Slow Tapping> Implicit Baseline | |||||
| C > PD | Auditory | 4.084 | < 0.001 | 0.005 | |
| C > PD | Salience | 3.803 | < 0.001 | 0.006 | |
| C > PD | Motor/IFG | 3.106 | 0.004 | 0.022 | |
| C > PD | BG/Thalamus | 2.628 | 0.014 | < 0.05 | |
| C > PD | Motor/Cerebellar | 2.59 | 0.015 | < 0.05 | |
| RAS > Implicit Baseline | |||||
| C > PD | Auditory | 3.459 | 0.002 | 0.031 |
Note: Components are illustrated in Figure 2. C: Control subjects. PD: Parkinson’s disease subjects. pFDR: False discovery rate adjusted p value.
Functional Network Connectivity (FNC):
Interactions between the 8 ICs were investigated, and are shown in Figure 3 for all subjects and for the control and PD groups separately, as well as significant differences between groups. This analysis investigated overall correlations between networks across conditions. There were 3 pairs of networks that showed stronger correlation in Patients than in Controls, as shown in the top right matrix in Figure 3. These pairs were the auditory and visual (M(healthy) = 0.11, SD(healthy) = 0.31, M(patients) = 0.42, SD(patients) = 0.13, PFDR = 0.011), auditory and executive control (M(healthy) = 0.14, SD(healthy) = 0.25, M(patients) = 0.34, SD(patients) = 0.18, PFDR = 0.049), and motor/cerebellar and executive control (M(healthy) = 0.25, SD(healthy) = 0.24, M(patients) = 0.46, SD(patients) = 0.15, PFDR = 0.022). Overall these result are consistent with studies that find increases in intranetwork functional connectivity in PD during the resting state (Zhang, Liu, et al., 2015).
Figure 3:

Functional Network Connectivity. Top Left: Across all participants (Patients and Controls). Top Right: Significant differences between PD and control group. PD showed stronger connectivity between the visual and auditory networks, auditory and executive control networks, and between the executive control and motor/cerebellar networks than controls. Bottom left: PD group only. Bottom Right: Control group only. In all plots, only statistically significant connections are shown (FDR-corrected p-values < 0.05). Only the lower triangular portion of the symmetric correlation matrix is shown. Color bars indicate Pearson correlation coefficient values.
Discussion
In order to investigate the neural mechanisms underlying the beneficial effects of RAS on rhythmic motor performance we used ICA to identify neural networks associated with performance of a rhythmic motor tapping task during the presence and absence of RAS in PD and control subjects. Behaviorally, both groups benefited from RAS when measured in terms of signed error and its variance. This is consistent with previous research finding RAS benefits in healthy adults. Additionally, RAS interacted with tapping speed and group in influencing behavioral freezing. Specifically, although healthy participants rarely “froze”, patients displayed a stronger beneficial effect of RAS under the fast-tapping condition than under the slow-tapping condition. These results are consistent with past studies of the effects of RAS on motor tapping in PD (Nombela et al., 2013; O’Doyle et al., 1998; Thaut et al. 2014).
We hypothesized three neural mechanisms for the effects of RAS: direct effects on activity within the corticostriatal system, a compensatory mechanism recruiting the cerebellum, or through effects on cortical systems. When examining intra-network connectivity, we found that controls showed greater connectivity within individual networks than PD subjects, particularly those underlying auditory and motor functions. However, when inter-network connectivity was examined we found that connectivity between networks was stronger for PD subjects than controls. In particular, PD subjects showed greater connectivity between the auditory and visual, auditory and executive control, and the motor/cerebellar and executive control ICs than did Controls.
Our results imply an important role for cortical systems in RAS. The strongest RAS effects on within-network connectivity were within the auditory network; connectivity was greater both when collapsed across subjects, and when controls were compared with PD subjects. The most prominent group effects were the finding of greater inter-network connectivity in PD and controls, between the executive control cortical network and both the auditory and motor/cerebellar networks.
Overall, PD is associated with a shift from reliance on habitual or automatic systems, which are impaired in PD, to greater reliance on goal-directed or controlled systems (Redgrave et al., 2010; Vandenbossche et al., 2012). It is possible that RAS associated entrainment has its effects on frontoparietal control systems, allowing them to exert greater influence on motor control systems. This role of RAS is consistent with studies that have found that RAS benefits not only motor task performance, but cognitive task performance as well (Bella et al., 2014; Benoit et al., 2014; Thaut et al., 2014).
Our results do not support a direct effect of RAS on the corticostriatal system or corticocerebellar system. The basal ganglia / thalamus IC was modulated by the tapping task, however, we found no effects of RAS, tapping speed, or subject group on functional connectivity within this IC or between this IC and other ICs. The motor/cerebellar IC was modulated by tapping speed, but not by the presence or absence of RAS and did not differ in PD subjects when compared with controls.
Auditory processing and RAS-related activity:
The auditory IC extended across the bilateral auditory cortex. Unsurprisingly, this IC showed strong task-related activity that reflected the amount of auditory stimulation: greater activity when sound was present in RAS than when sound was absent, and greater activity for the faster rhythm than the slower rhythm. Overall these task-related differences were reflected in greater within-IC activity in the control group. However, in PD there was greater between-IC correlation between the auditory and visual and auditory and executive control networks, indicating potentially broader effects of RAS in PD than controls. Intriguingly, there was a stronger inter-network correlation between auditory and visual ICs in PD than controls. The reason for this difference in correlation is unclear, but could be due to PD subjects finding the task more difficult and therefore paying more attention to the visual cues, or as part of an overall shift towards controlled rather than automatic performance in PD (Redgrave et al., 2010).
Motor processing and the cerebellum:
The Motor/Cerebellar IC included both the hand region of the left somatosensory cortex and the corresponding hand region of the cerebellum. Task related activity in this network reflected motor demands, with higher activity during fast tapping than slow tapping. As was the case for auditory processing, control subjects showed overall greater within-IC activity, but the PD subjects showed greater between-IC correlation, in particular between the Motor/Cerebellar IC and the Executive Control IC. In addition to the Motor/Cerebellar IC, a second cerebellar IC (IC3, “Executive Cerebellar”) was identified. The Executive Cerebellar IC incorporated more lateral and inferior regions of the cerebellum, regions that are known to be functionally interconnected with frontoparietal executive control regions (Buckner et al., 2011). Activity in both cerebellar ICs was greater for fast than slow tapping, consistent with a metanalysis that found cerebellar activity in externally-paced tapping (Chauvigné et al, 2014) and previous studies that associated damage to the cerebellum with impaired processing of rapid rhythms (Nozaradan et al., 2017).
Basal Ganglia:
The Basal Ganglia/Thalamus IC extended across striatal regions of the basal ganglia and the thalamus. Like all the ICs, the basal ganglia IC was identified on the basis of task-related activity modulation. Although this IC was involved in motor tapping, it did not differ in recruitment across individual task conditions (RAS and/or tapping speed), indicating similar basal ganglia demands regardless of these task variables. Furthermore, this network did not differ in recruitment across the PD and control groups in this task, despite the known impairments of basal ganglia functioning in PD. It should be noted that all PD subjects were on their normal dosage of dopaminergic medication, which has been shown to restore overall corticostriatal activity levels in PD patients (Au et al., 2012; Ng et al., 2009). However, dopaminergic medication does not normalize all corticostriatal activity and does not ameliorate all symptoms, and much RAS therapy clinically is focused on dopaminergic refractory symptoms (Koshimori and Thaut, 2018). Overall, these results imply that RAS does not primarily affect motor performance through direct influences on the basal ganglia. However, it should be noted that BOLD activity does not capture all aspects of neural function and there could be effects that are missed by this physiological correlate.
Limitations:
In our study PD subjects were instructed to take their usual amount of dopaminergic medication and testing was performed during the ON period 2–3 hours after medication intake. This choice was made in order to maximize translational impact: almost all PD patients take medication to control symptoms, and RAS clinically has been shown to be effective both on and off medication (McIntosh et al., 1997). However, because dopaminergic medication tends to increase overall basal ganglia BOLD activity (Au et al., 2012; Ng et al, 2009), this choice may have reduced our ability to detect effects of RAS on corticostriatal systems using BOLD fMRI. Future work could build on this study by testing PD patients off of medication, though this is methodologically difficult due to increased tremor off medication and increased discomfort experienced by the patients. In PD, levodopa has been associated with changes in connectivity in corticostriatal networks (Herz et al., 2015), corticocerebellar networks (Jech et al., 2013) and between cortical motor regions (Cerasa et al., 2015; Esposito et al., 2013; Kishore and Popa, 2014).
The differences in intra-network correlation between PD and control groups were identified in analyses performed across all the motor tapping task conditions, not just during the RAS conditions, and thus may not be specific to RAS. It seems likely that these effects reflect an interaction between PD and RAS in that two of the inter-network correlation increases involved the auditory network, and this network is less likely to be active when sound cues are absent. However, future research should confirm whether these intra-network connectivity changes are indeed RAS-specific, or reflect more general neural connectivity changes in PD.
Detailed clinical variables such as side of symptoms and Hoehn and Yahr score were not available for all participants. In addition, although all subjects were taking their normal dosage of dopaminergic medication, details about their medication and dosage were not available. Further research should investigate the effects of these variables on neural recruitment.
Translational Implications
Although positive clinical training effects of RAS on gait and other motor functions have been consistently reported in studies since the pioneering research in the mid-nineties (Thaut et al. 1996, Miller et al. 1996; McIntosh et al., 1997), the neural mechanisms underlying the effects of RAS have been unknown. However, to support consistent application of therapeutic interventions and potentially expand their clinical use it is necessary to understand the mode of action of the intervention. To our knowledge, the current study is the first to shed light on the neural mechanisms underlying RAS. The results show a modulation of brain inter-network connectivity during motor tapping in PD in comparison with healthy controls, suggesting that RAS induced network plasticity may result in recruitment neural systems not affected by the primary disease process. In addition, the involvement of the executive network is consistent with an often overlooked fact in motor training for PD that RAS not only addresses motor issues but also enhances cognitive function (Rochester et al., 2005), which is an important consideration for optimizing all levels of functioning in the disease process since PD also affects cognition.
Conclusion
Our study found that during rhythmic stimulation healthy controls displayed stronger intra network connectivity in perceptual and motor systems, while PD subjects displayed stronger inter-network connectivity between auditory, executive control, and cerebellar/motor networks. Stronger inter-network connections between these networks in persons with PD may help compensate for a compromised cortico-striatal motor control system. The data provide a first functional neural basis for the application of RAS to PD mobility rehabilitation and should motivate further investigation into the roles of the executive control, basal ganglia, and cerebellar networks during RAS.
Acknowledgements:
This research was supported by NIH/NCATS Colorado CTSA Grants UL1TR002535, KL2TR002534, and TL1TR002533. Contents are the authors’ sole responsibility and do not necessarily represent official NIH views. MHT’s contribution was supported by a Canadian Research Chair Tier I award from the Canadian Institutes of Health Research. CAS received support from a Chiang Jiang Chair Professor award from the Ministry of Education, China and a research award from the School of Psychology, South China Normal University, Guangzhou, China. BMK received support from the NIH/NINDS (K02-NS080885–01A1). We thank Madison Propp and Hannah Mechtenberg for assistance in data collection.
Abbreviations:
- PD
Parkinson’s Disease
- RAS
Rhythmic Auditory Stimulation
- ICA
Independent Component Analysis
- IC
Independent Component
Footnotes
Conflict of Interest Statement:
Authors declare no conflict of interest.
Data Accessibility Statement:
All data underlying the present findings are fully available without restriction and will be shared with the research community upon request.
References
- Au WL, Zhou J, Palmes P, Sitoh YY, Tan LC, & Rajapakse JC (2012) Levodopa and the feedback process on set-shifting in Parkinson’s disease. Hum Brain Mapp 33, 27–39 [DOI] [PMC free article] [PubMed] [Google Scholar]
- Bell AJ, & Sejnowski TJ (1995) An information-maximization approach to blind separation and blind deconvolution. Neural Comput 7, 1129–159. [DOI] [PubMed] [Google Scholar]
- Bella SD, Benoit CE, Farrugia N, Schwartze M, & Kotz SA (2015) Effects of musically cued gait training in Parkinson’s disease: beyond a motor benefit. Ann N Y Acad Sci 1337, 77–85 [DOI] [PubMed] [Google Scholar]
- Benjamini Y, & Hochberg Y (1995) Controlling the false discovery rate: A practical and powerful approach to multiple testing. J R Stat Soc. 57, 289–300. [Google Scholar]
- Benoit CE, Dalla Bella S, Farrugia N, Obrig H, Mainka S, & Kotz SA (2014) Musically cued gait-training improves both perceptual and motor timing in Parkinson’s disease. Front Hum Neurosci, 8, 494. [DOI] [PMC free article] [PubMed] [Google Scholar]
- Bernatzky G, Bernatzky P, Hesse HP, Staffen W, Ladurner G (2004) Stimulating music increases motor coordination in patients affliected by Morbus Parkinson. Neurosci Lett, 361,4–8. [DOI] [PubMed] [Google Scholar]
- Bostan AC, Dum RP, & Strick PL (2013) Cerebellar networks with the cerebral cortex and basal ganglia. Trends Cogn Sci, 17, 241–54 [DOI] [PMC free article] [PubMed] [Google Scholar]
- Braunlich K & Seger CA. (2013) Basal Ganglia. Wiley Interdiscip Rev Cogn Sci, 4, 135–148. [DOI] [PubMed] [Google Scholar]
- Buckner RL, Krienen FM, Castellanos A, Diaz JC, & Yeo BT (2011) The organization of the human cerebellum estimated by intrinsic functional connectivity. J Neurophysiol 106, 2322–345 [DOI] [PMC free article] [PubMed] [Google Scholar]
- Calhoun VD, Adali T, Pearlson GD, & Pekar JJ (2001) A method for making group inferences from functional MRI data using independent component analysis. Hum Brain Mapp 14, 140–151 [DOI] [PMC free article] [PubMed] [Google Scholar]
- Cerasa A, Koch G, Donzuso G, Mangone G, Morelli M, Brusa L, Stampanoni Bassi M, Ponzo V, Picazio S, Passamonti L, Salsone M, Augimeri A, Caltagirone C, & Quattrone A (2015) A network centred on the inferior frontal cortex is critically involved in levodopa-induced dyskinesias. Brain 138, 414–427. [DOI] [PubMed] [Google Scholar]
- Chauvigné LA, Gitau KM, & Brown S (2014) The neural basis of audiomotor entrainment: an ALE meta-analysis. Front Hum Neurosci, 8, 776. [DOI] [PMC free article] [PubMed] [Google Scholar]
- Chen JL, Zatorre RJA, Penhune VB (2006) Interactions between auditory and dorsal premotor cortex during synchronization to musical rhythms. Neuroimage 32, 1771–781 [DOI] [PubMed] [Google Scholar]
- Chen JL, Penhune VB, & Zatorre RJ (2008) Moving on time: brain network for auditory-motor synchronization is modulated by rhythm complexity and musical training. J Cogn Neurosci, 20, 226–239. [DOI] [PubMed] [Google Scholar]
- Dorsey ER, Constantinescu R, Thompson JP, et al. (2007) Projected number of people with Parkinson disease in the most populous nations, 2005 through 2030. Neurology, 68, 384–386. [DOI] [PubMed] [Google Scholar]
- Esposito F, Tessitore A, Giordano A, De Micco R, Paccone A, Conforti R, Pignataro G, Annunziato L, &Tedeschi G (2013) Rhythm-specific modulation of the sensorimotor network in drug-naive patients with Parkinson’s disease by levodopa. Brain 136:710–725. [DOI] [PubMed] [Google Scholar]
- Freeman JS, Cody FW, & Schady W (1993) The influence of external timing cues upon the rhythm of voluntary movements in Parkinson’s disease. J Neurol Neurosurg Psychiatry 56, 1078–1084 [DOI] [PMC free article] [PubMed] [Google Scholar]
- Georgiou N, Inasek Rm Bradshaw JL, Phillips JG, Mattingley JB, & Bradshaw JA (1993) An evaluation of the role of internal cues in the pathogenesis of Parkinson hypokinesia. Brain 116:1575–1587 [DOI] [PubMed] [Google Scholar]
- Giovannelli F, Innocenti I, Rossi S, Borgheresi A, Ragazzoni A, Zaccara G, Viggiano MP, & Cincotta M (2014) Role of the Dorsal Premotor Cortex in Rhythmic Auditory-Motor Entrainment: A Perturbational Approach by rTMS. Cereb Cortex 24, 1009–016 [DOI] [PubMed] [Google Scholar]
- Grahn JA (2009) The role of the basal ganglia in beat perception: neuroimaging and neuropsychological investigations. Ann N Y Acad Sci 1169:35–45. [DOI] [PubMed] [Google Scholar]
- Grahn JA, & Rowe JB (2009). Feeling the beat: premotor and striatal interactions in musicians and nonmusicians during beat perception. J Neurosci 29, 7540–48 [DOI] [PMC free article] [PubMed] [Google Scholar]
- Grube M, Cooper FE, Chinnery PF, & Griffiths TD (2010) Dissociation of duration-based and beat-based auditory timing in cerebellar degeneration. Proc Natl Acad Sci U S A 107:11597–11601. [DOI] [PMC free article] [PubMed] [Google Scholar]
- Herz DM, Haagensen BN, Christensen MS, Madsen KH, Rowe JB, Løkkegaard A, & Siebner HR (2015) Abnormal dopaminergic modulation of striato-cortical networks underlies levodopa-induced dyskinesias in humans. Brain 138:1658–1666. [DOI] [PMC free article] [PubMed] [Google Scholar]
- Himberg J, Hyvärinen A, & Esposito F (2004) Validating the independent components of neuroimaging time series via clustering and visualization. Neuroimage 22, 1214–222 [DOI] [PubMed] [Google Scholar]
- Hughes AJ, Daniel SE, Kilford L, & Lees AJ. (1992) Accuracy of clinical diagnosis of idiopathic Parkinson’s disease: a clinico-pathological study of 100 cases. J Neurol Neurosurg Psychiatry;55:181–184. [DOI] [PMC free article] [PubMed] [Google Scholar]
- Jafri MJ, Pearlson GD, Stevens M, & Calhoun VD (2008) A Method for Functional Network Connectivity Among Spatially Independent Resting-State Components in Schizophrenia. NeuroImage, 39, 1666–1681. [DOI] [PMC free article] [PubMed] [Google Scholar]
- Jech R, Mueller K, Schroeter ML, & Ruzicka E (2013) Levodopa increases functional connectivity in the cerebellum and brainstem in Parkinson’s disease. Brain 136:e234. [DOI] [PubMed] [Google Scholar]
- Kishore A & Popa T (2014) Cerebellum in Levodopa-Induced Dyskinesias: The Unusual Suspect in the Motor Network. Front Neurol 5. [DOI] [PMC free article] [PubMed] [Google Scholar]
- Koshimori Y, & Thaut MH. (2018) Future perspectives on neural mechanisms underlying rhythm and music based neurorehabilitation in Parkinson’s disease. Ageing Res Rev, 47, 133–139. [DOI] [PubMed] [Google Scholar]
- Kung SJ, Chen JL, Zatorre RJ, & Penhune VB (2013) Interacting cortical and basal ganglia networks underlying finding and tapping to the musical beat. J Cogn Neurosci 25:401–420. [DOI] [PubMed] [Google Scholar]
- Ma HI, Hwang WJ, & Kin KC (2009) The effects of two different auditory stimuli on functional arm movement in persons with Parkinson’s disease: a dual task paradigm. Clin Rehabil 23: 229–237 [DOI] [PubMed] [Google Scholar]
- Ma Q, Huang B, Wang J, Seger C, Yang W, Li C, Wang J, Feng J, Weng L, Jiang W, & Huang R (2016) Altered modular organization of intrinsic brain functional networks in patients with Parkinson’s disease. Brain Imaging Behav 11, 430–443. [DOI] [PubMed] [Google Scholar]
- Martinu K & Monchi O (2013) Cortico-basal ganglia and cortico-cerebellar circuits in Parkinson’s disease: pathophysiology or compensation? Behav Neurosci 127:222–236. [DOI] [PubMed] [Google Scholar]
- McIntosh GC, Brown SH, Rice RR, & Thaut MH. (1997) Rhythmic auditory-motor facilitation of gait patterns in patients with Parkinson’s Disease. J Neurol Neurosurg Psychiatry 62: 122–126 [DOI] [PMC free article] [PubMed] [Google Scholar]
- McIntosh GC, Rice RR, Hurt CP, & Thaut MH. (1998) Long-term training effects of rhythmic auditory stimulation on gait in patients with Parkinson’s disease. Mov Disord 13 (suppl 2): 2129539332 [Google Scholar]
- Meda SA, Stevens MC, Folley BS, Calhoun VD, & Pearlson GD (2009) Evidence for anomalous network connectivity during working memory encoding in schizophrenia: an ICA based analysis. PLoS One 4, e7911. [DOI] [PMC free article] [PubMed] [Google Scholar]
- Miller RA, Thaut MH, McIntosh GC, & Rice RR. (1996) Components of EMG symmetry and variability in Parkinsonian and healthy elderly gait. Electroencephalogr Clin Neurophysiol 101: 1–7. [DOI] [PubMed] [Google Scholar]
- Molinari M, Leggio MG, Filippini V, Gioia MC, Cerasa A, & Thaut MH (2005) Sensorimotor transduction of time information is preserved in subjects with cerebellar damage. Brain Res Bull 67, 448–458 [DOI] [PubMed] [Google Scholar]
- Ng B, Palmer S, Abugharbieh R, & McKeown MJ (2009) Focusing effects of L-dopa in Parkinson’s disease. Hum Brain Mapp, 31, 88–97. [DOI] [PMC free article] [PubMed] [Google Scholar]
- Nombela C, Hughes LE, Owen AM, & Grahn JA (2013) Into the groove: Can rhythm influence parkinson’s disease? Neurosci and Biobehav Rev 37, 2564–2570 [DOI] [PubMed] [Google Scholar]
- Nozaradan S, Schwartze M, Obermeier C, & Kotz SA (2017) Specific contributions of basal ganglia and cerebellum to the neural tracking of rhythm. Cortex 95, 156–168 [DOI] [PubMed] [Google Scholar]
- O’Boyle DJ, Freeman JS, & Cody FWJ (1996) The accuracy and precision of timing of self-paced repetitive movements in subjects with Parkinson’s disease. Brain 119, 51–70. [DOI] [PubMed] [Google Scholar]
- Redgrave P, Rodriguez M, Smith Y, Rodriguez-Oroz MC, Lehericy S, Bergman H, Agid Y, DeLong MR, & Obeso JA (2010) Goal-directed and habitual control in the basal ganglia: implications for Parkinson’s disease. Nat Rev Neurosci 11, 760–772 [DOI] [PMC free article] [PubMed] [Google Scholar]
- Repp BH (2005) Sensorimotor synchronization: A review of the tapping literature, Psychon Bull Rev 12, 969. [DOI] [PubMed] [Google Scholar]
- Repp BH, Su YH (2013) Sensorimotor synchronization: A review of recent research (2006–2012) Psychon Bull Rev 20:403–452. [DOI] [PubMed] [Google Scholar]
- Rochester L, Hetherington V, Jones D, Nieuwboer A, Willems AM, Kwakkel G, & Van Wegen E (2005) The effect of external rhythmic cues (auditory and visual) on walking during a functional task in homes of people with Parkinson’s disease. Arch Phys Med Rehabil 86, 999–1006 [DOI] [PubMed] [Google Scholar]
- Schwartze M, Tavano A, Schröger E, & Kotz SA (2012). Temporal aspects of prediction in audition: cortical and subcortical neural mechanisms. Int J Psychophysiol 83, 200–07 [DOI] [PubMed] [Google Scholar]
- Seger CA (2013) The visual corticostriatal loop through the tail of the caudate: circuitry and function. Front Syst Neurosci 7:104. [DOI] [PMC free article] [PubMed] [Google Scholar]
- Stephan KM, Thaut MH, Wunderlich G, Schicks W, Tian B, Tellmann L, Schmitz T, Herzog H, McIntosh GC, Seitz RJ, & Hömberg V (2002) Conscious and subconscious sensorimotor synchronization--prefrontal cortex and the influence of awareness. Neuroimage 15:345–352. [DOI] [PubMed] [Google Scholar]
- Thaut MH (2015) The discovery of human auditory-motor entrainment and its role in the development of neurologic music therapy. Prog Brain Res 217, 253–266 [DOI] [PubMed] [Google Scholar]
- Thaut MH & Abiru M. (2010) Rhythmic auditory stimulation in rehabilitation of movement disorders: A review of current research. Music Perception 27: 263–269 [Google Scholar]
- Thaut MH, Kenyon GP, Hurt CP, McIntosh GC & Hoemberg V (2002) Kinematic optimization of spatiotemporal patterns in paretic arm training with stroke patients. Neuropsychologia 40:1073–1081. [DOI] [PubMed] [Google Scholar]
- Thaut MH, McIntosh GC & Hoemberg V (2014) Neurobiological foundations of neurologic music therapy: rhythmic entrainment and the motor system. Front Psychol 5:1185. [DOI] [PMC free article] [PubMed] [Google Scholar]
- Thaut MH, McIntosh GC, Rice RR, Miller RA, Rathbun J & Brault JM. (1996) Rhythmic auditory stimulation in gait training with Parkinson’s disease patients. Mov Disord 11: 193–200. [DOI] [PubMed] [Google Scholar]
- Thaut MH, Miller RA, & Schauer LM (1998) Multiple synchronization strategies in rhythmic sensorimotor tasks: phase vs period correction. Biol Cybern 79:241–250. [DOI] [PubMed] [Google Scholar]
- Tierney A & Kraus N (2015) Neural entrainment to the rhythmic structure of music. J Cogn Neurosci, 27(2), 400–8 [DOI] [PubMed] [Google Scholar]
- Vandenbossche J, Deroost N, Soetens E, Coomans D, Spildooren J, Vercruysse S, Nieuwboer A, & Kerckhofs E (2012) Freezing of gait in Parkinson’s disease: disturbances in automaticity and control. Front Hum Neurosci 6, 356. [DOI] [PMC free article] [PubMed] [Google Scholar]
- Vercruysee S, Spildooren J, Hereemens E, Vandenbossche J, Wenderoth N, Swinnen SP, Vandenberghe W, & Nieuwboer A (2012) Abnormalities and cue dependence of rhythmic upper limb movements in Parkinson patients with freezing gait. Neurorehabil Neural Repair 26:636–645 [DOI] [PubMed] [Google Scholar]
- Wu T, Hou Y, Hallett M, Zhang J, & Chan P (2015) Lateralization of brain activity pattern during unilateral movement in Parkinson’s disease. Hum Brain Mapp 36, 1878–891. [DOI] [PMC free article] [PubMed] [Google Scholar]
- Yeo BT, Krienen FM, Sepulcre J, Sabuncu MR, Lashkari D, Hollinshead M, Roffman JL, Smoller JW, Zöllei L, et al. (2011) The organization of the human cerebral cortex estimated by intrinsic functional connectivity. J Neurophysiol 106, 1125–165 [DOI] [PMC free article] [PubMed] [Google Scholar]
- Zhang D, Liu X, Chen J, Liu B, Wang J (2015) Widespread increase of functional connectivity in Parkinson’s disease with tremor: a resting-state FMRI study. Front Aging Neurosci 7:6. [DOI] [PMC free article] [PubMed] [Google Scholar]
- Zhang D, Wang J, Liu X, Chen J, Liu B (2015) Aberrant Brain Network Efficiency in Parkinson’s Disease Patients with Tremor:A Multi-Modality Study.Front Aging Neurosci 7:169. [DOI] [PMC free article] [PubMed] [Google Scholar]